TeamGroup 512GB EX2 Elite SATA III SSD Review – A Budget Solution for Gamers?
SSD (Solid State Drive) technology is continually improving and its pricing remains reasonable as speeds and capacities increase. SSD technology has become more accessible, and gamers need more and more capacity as games are getting larger. Teamgroup’s EX2 3D NAND SSD is a inexpensive SATA III drive that is available in 512MB, 1TB, and 2TB capacities. The Elite EX2 advertises a Read/Write Speed up to 550/520 MB/s which is slow compared with the fastest PCIe-based NVMe drives that reach around 7000/6000 MB/s Read/Write speeds but are expensive. We will see if the EX2 is a good buy for a gamer in late 2021.
Although the EX2’s specifications indicate that it is much slower than PCIe NVMe SSDs, we will see if it makes a practical difference for gamers and if SATA III is still relevant. Our 512MB Elite EX2 review sample came directly from TeamGroup, and we will focus on its performance by comparing it with six other SSDs. Besides benchmarking the EX2, we will focus on our other four fastest PCIe NVMe drives – the 1TB CARDEA Ceramic C440, the CAEDEA IOPS SSD, the CARDEA Liquid 512GB SSD, and the 1TB MP33 SSD – as well as our fastest SATA III SSD, the T-FORCE Vulcan 500GB drive and the DELTA MAX.
The TeamGroup Elite EX2 is currently $51.99 at Amazon and priced at $86.99 for the 1TB capacity. The 1TB DELTA MAX is currently $120.99 at Amazon or $72.99 for the 512GB version but they offer RGB lighting. The 512GB T-FORCE Vulcan 500GB SATA III SSD can be found for $49.99 and the 1TB version is $99.99; the Liquid CARDEA NVMe2 512GB drive is $76.99 at Amazon and the 1TB version is $139.49 at Newegg; and the PCIe Team Group MP33 1TBB SSD is $86.99, or $53.99 for the 512GB version. The CARDEA Ceramic C440 1TB is a Gen 4 x4 drive currently priced $119.99 at Amazon as a 5000MBps/ 4400MBps drive but there is no 512GB version.
Here are the features and specifications of the EX2 Elite taken directly from TeamGroup’s website.
FEATURES
- Blazing read/write speed
- Optimized performance
- Complete lineup of capacities
- Trustworthy reliability
Specifications
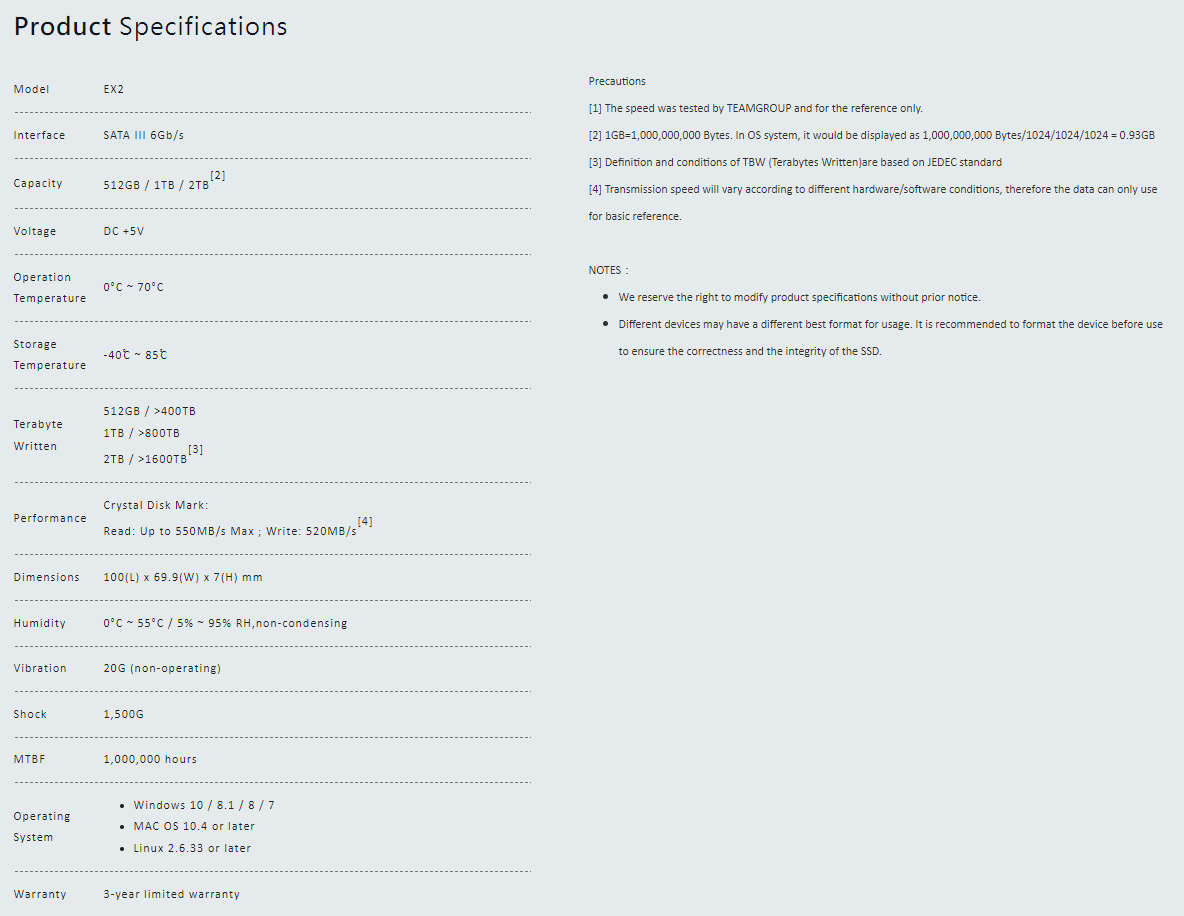
The specifications, based on CrystalDiskMark, boast 550MB/s Read and 520MB/s Write which are average for a SATA III drive.
Next we unbox the TeamGroup 512GB EX2 Elite and take a closer look at it.
Unboxing and a Closer Look
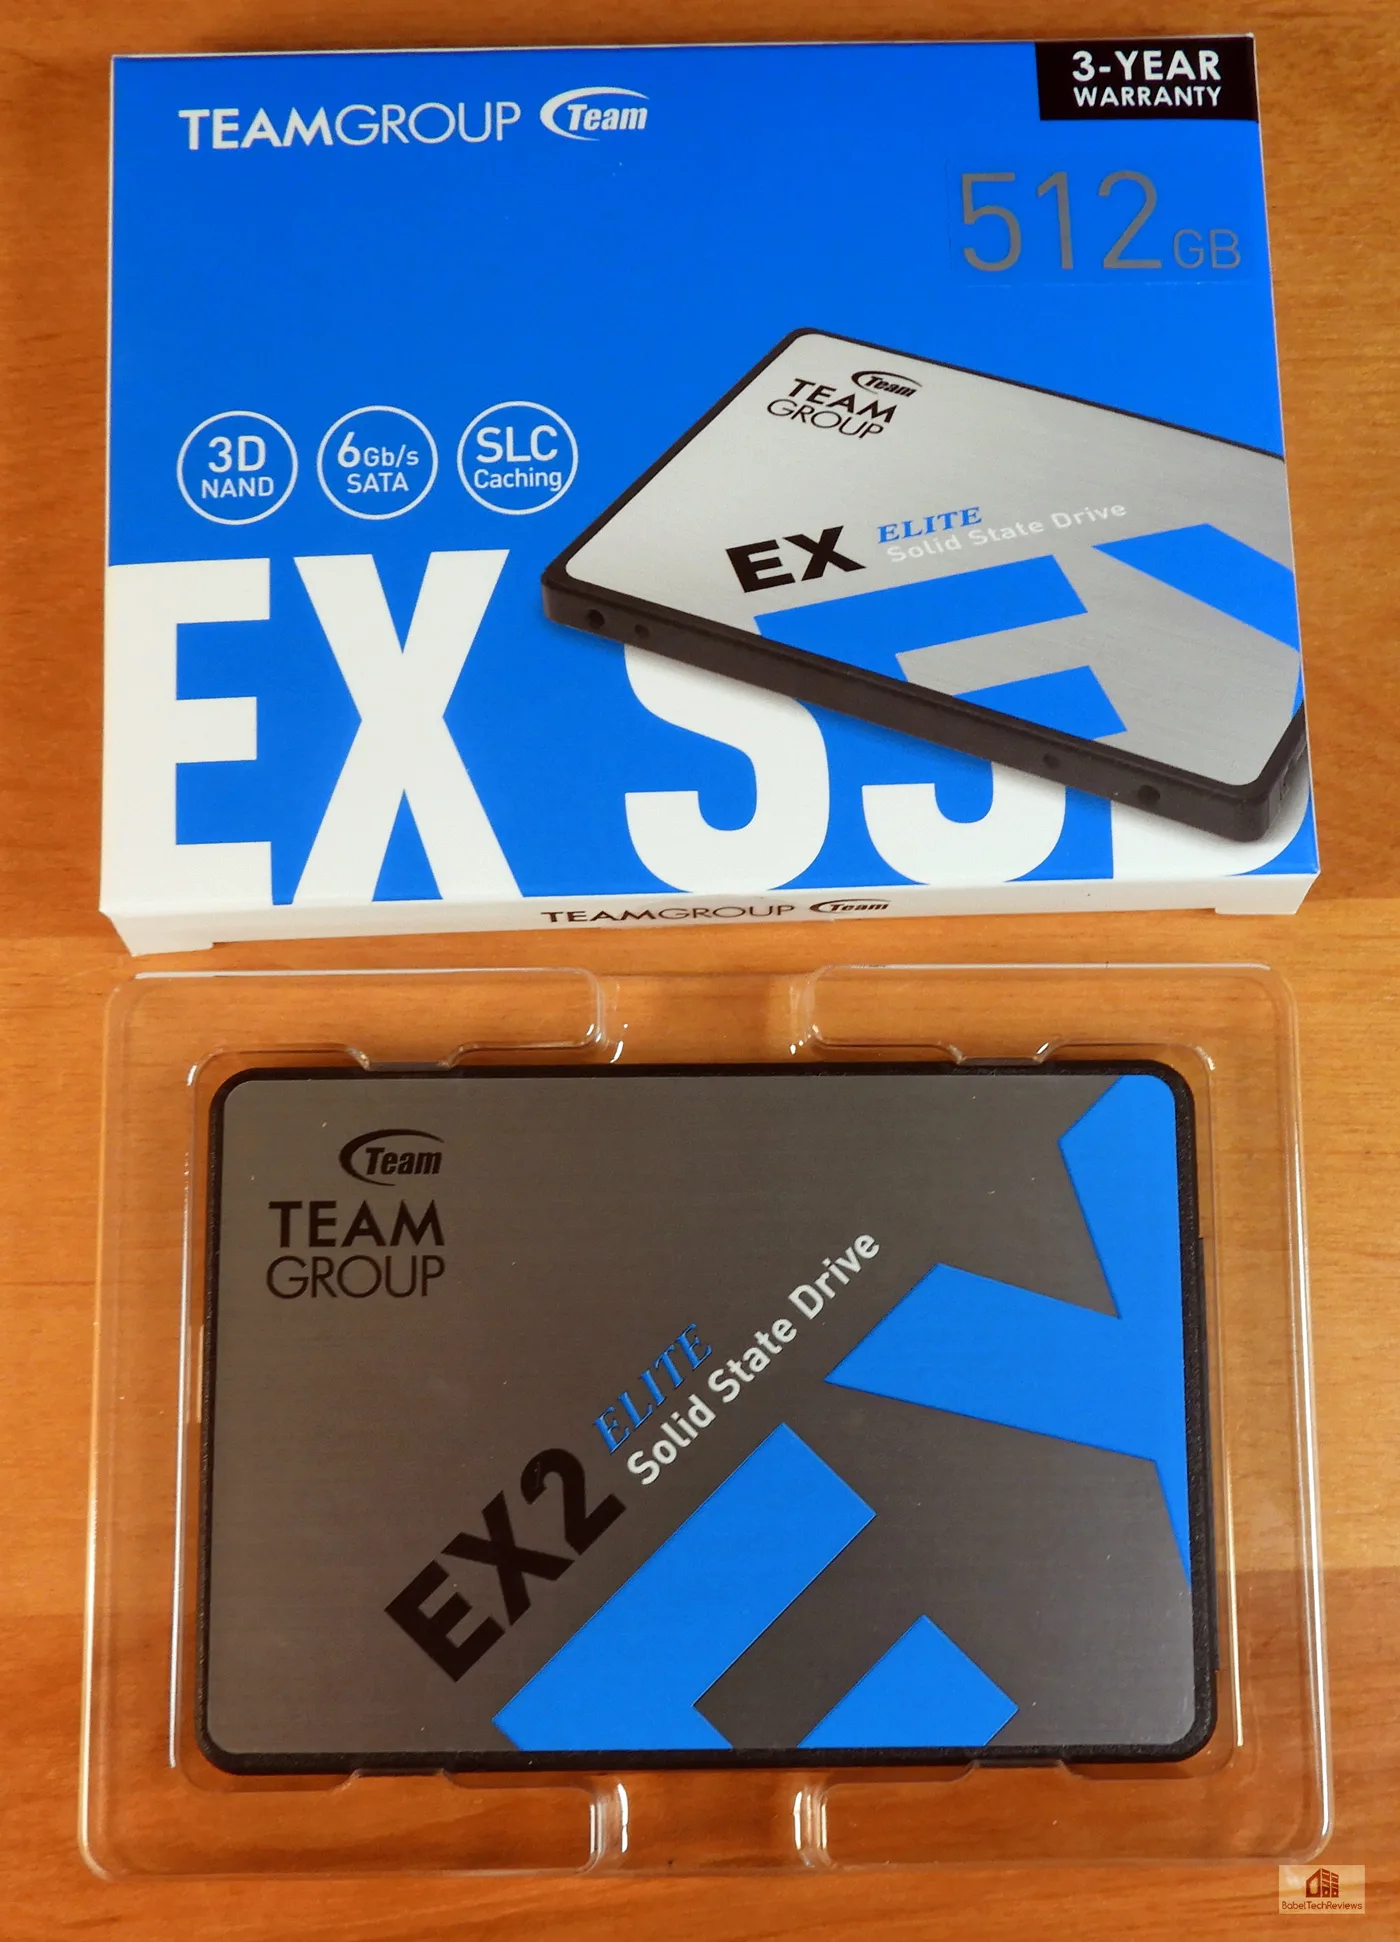
The TeamGroup 512GB EX2 Elite SSD comes in a small box that advertises 3D NAND, 6 Gb/s SATA, and SLC Caching together with a 3-year warranty.
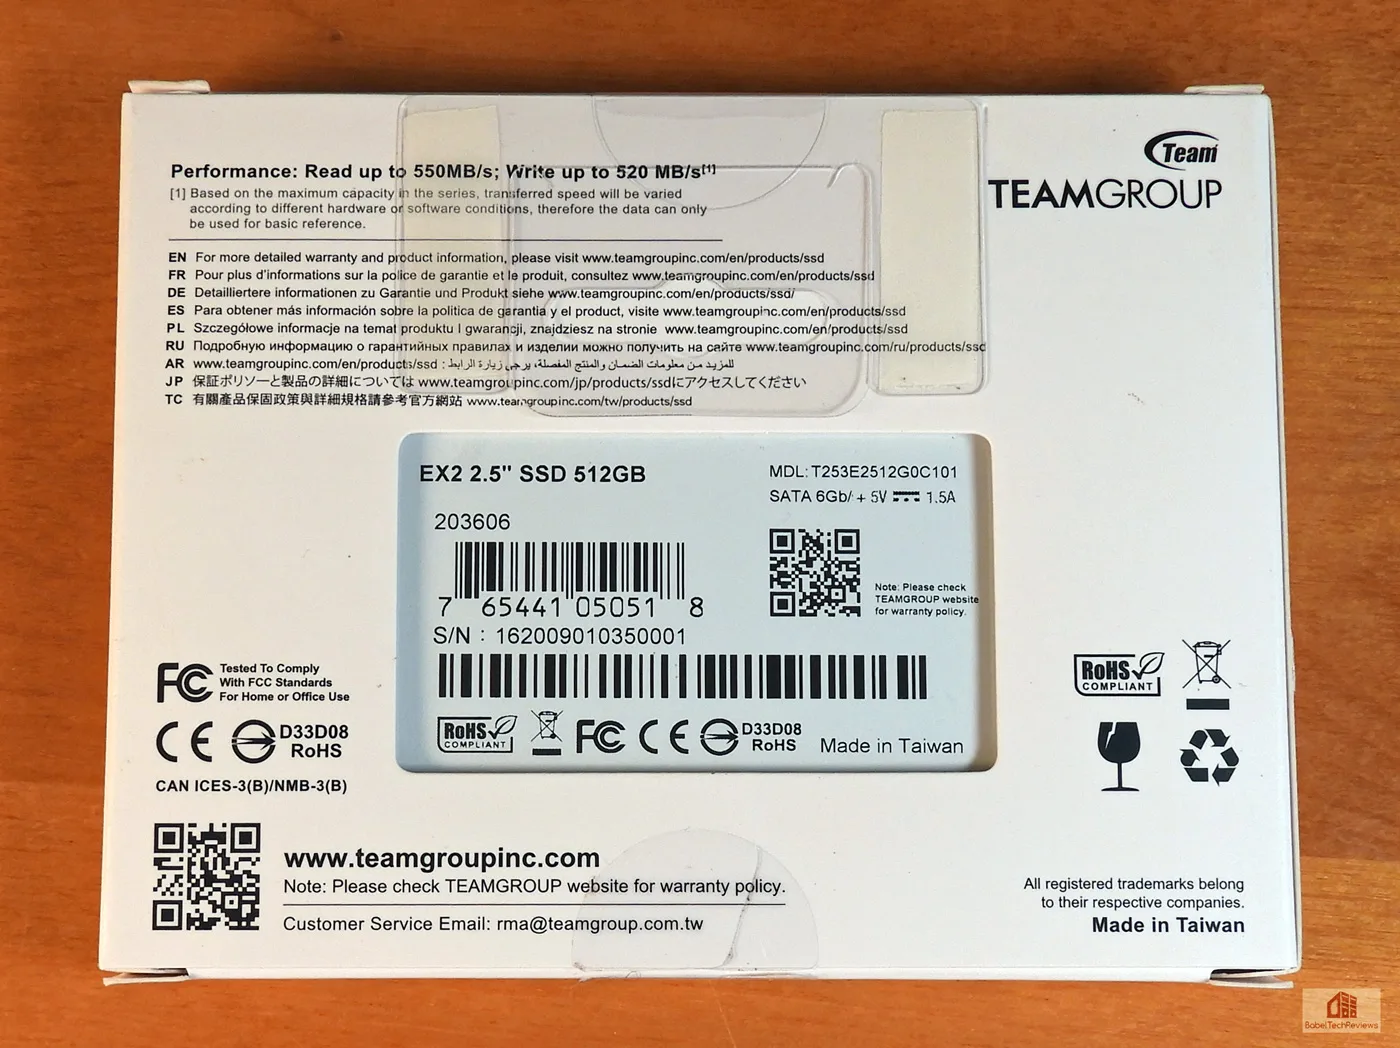
Here is the back of the box which warns the buyer that the transfer speeds can vary according to capacity and are only to be used for basic reference.
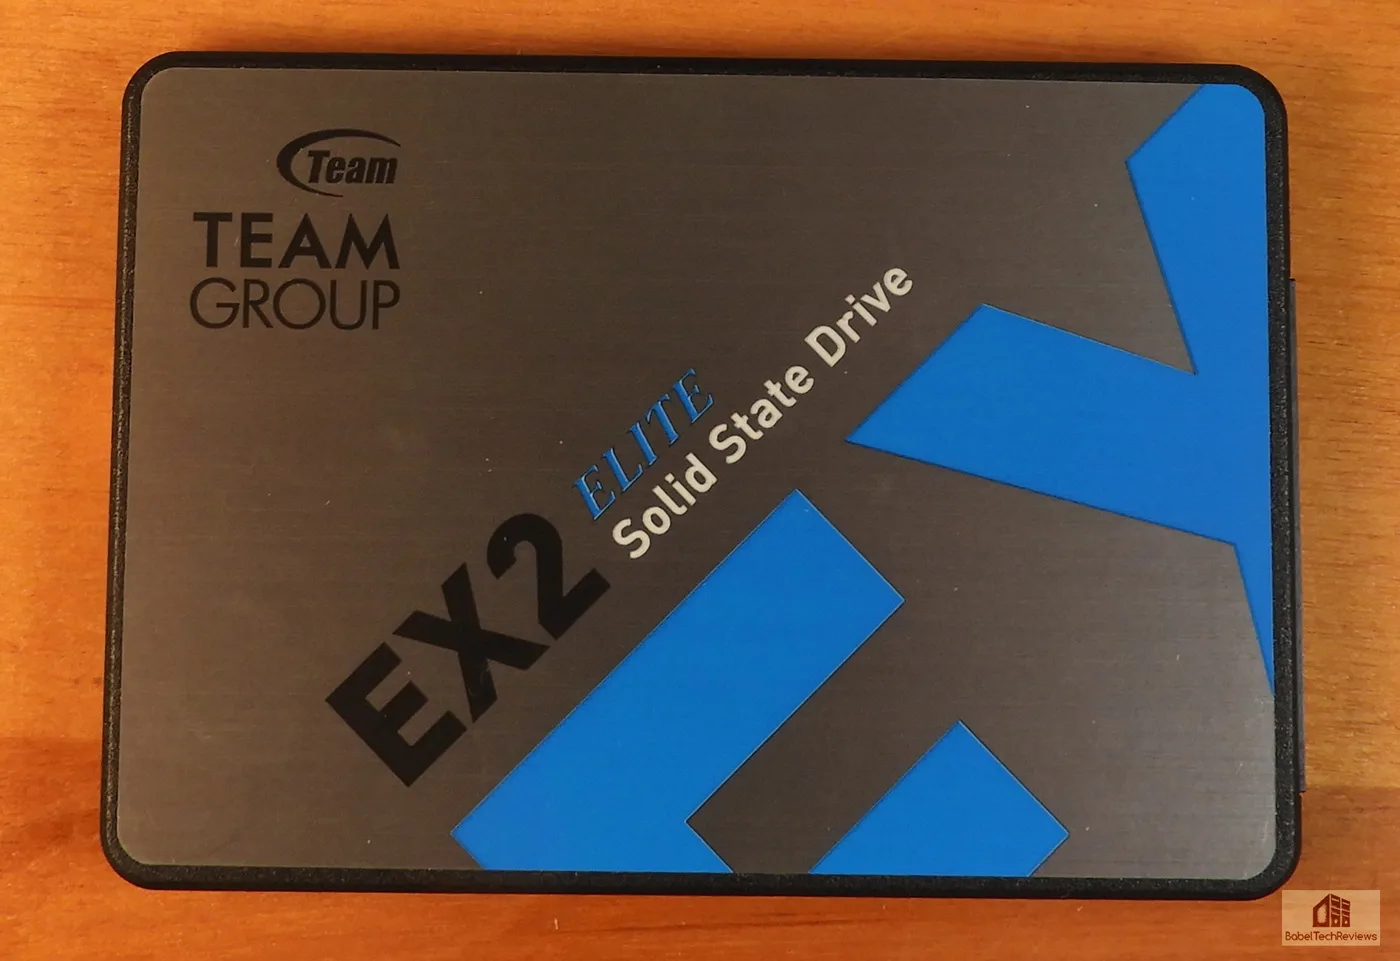
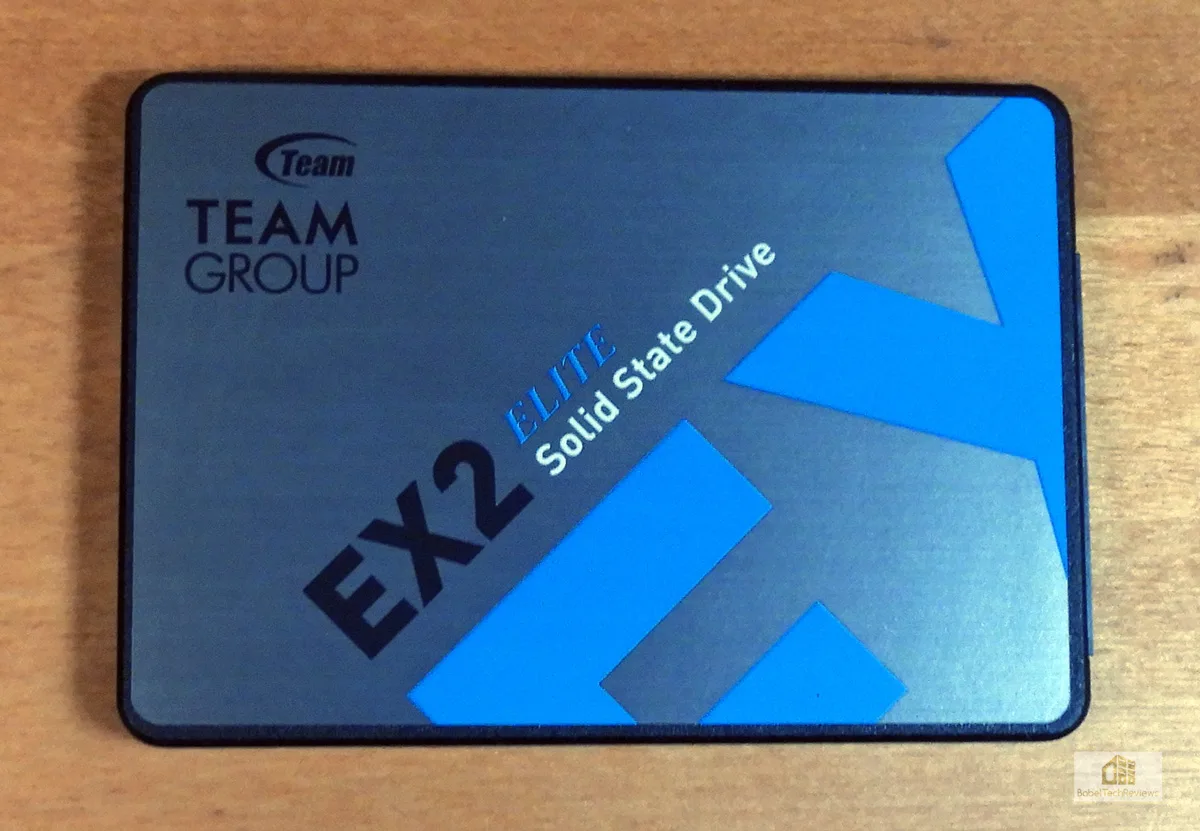
Here is a closer look at the 512GB EX2 Elite which looks typical for a 2.5 inch internal SATA III SSD in blue and silver.
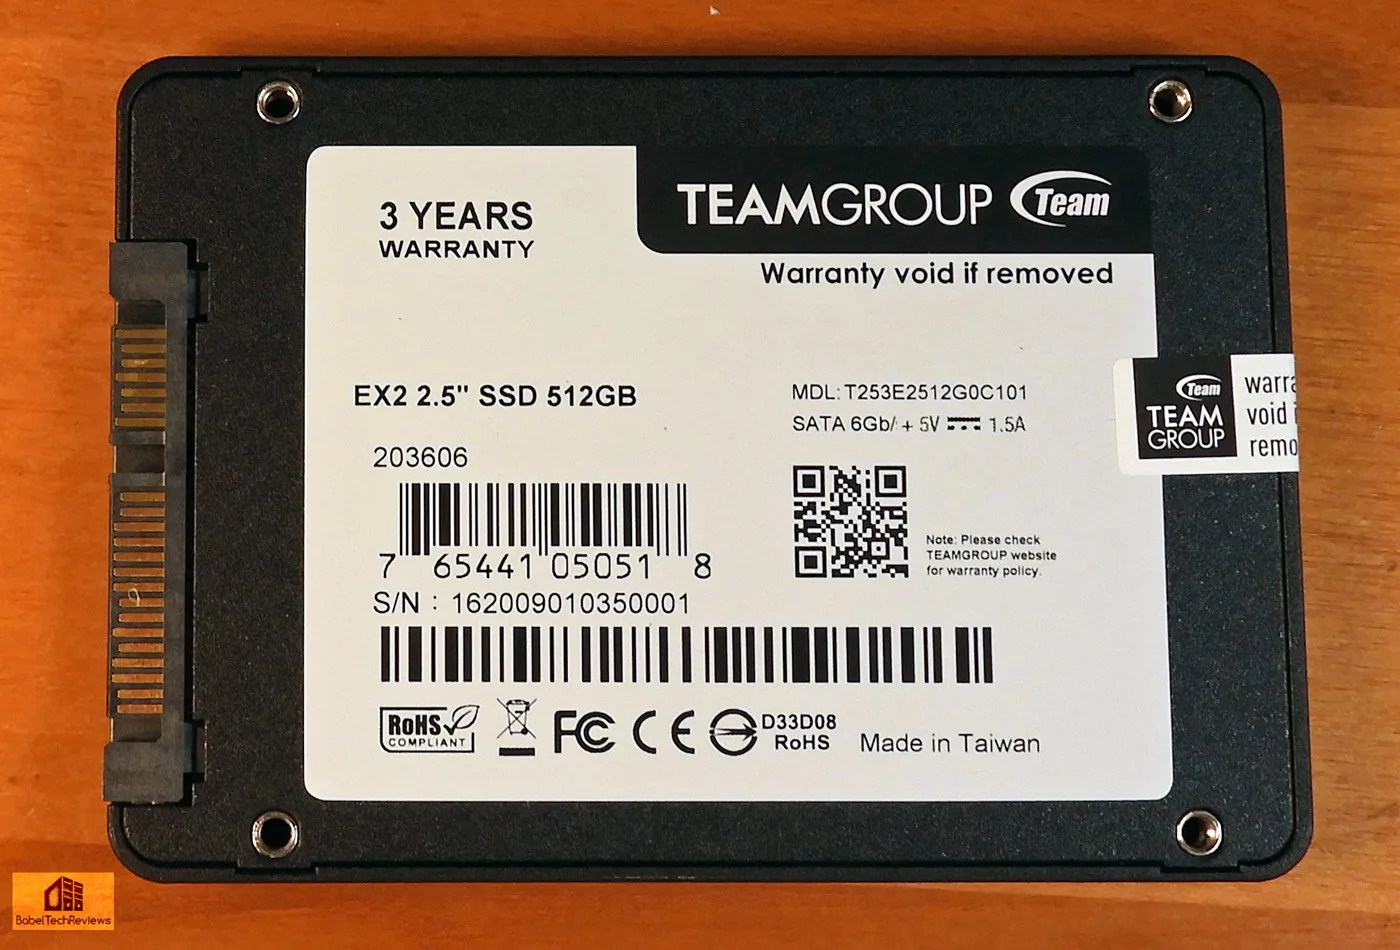
The obverse of the EX2 carries the sticker which warns that the warranty may be void if removed. There is no reason for an end user to open a SSD.
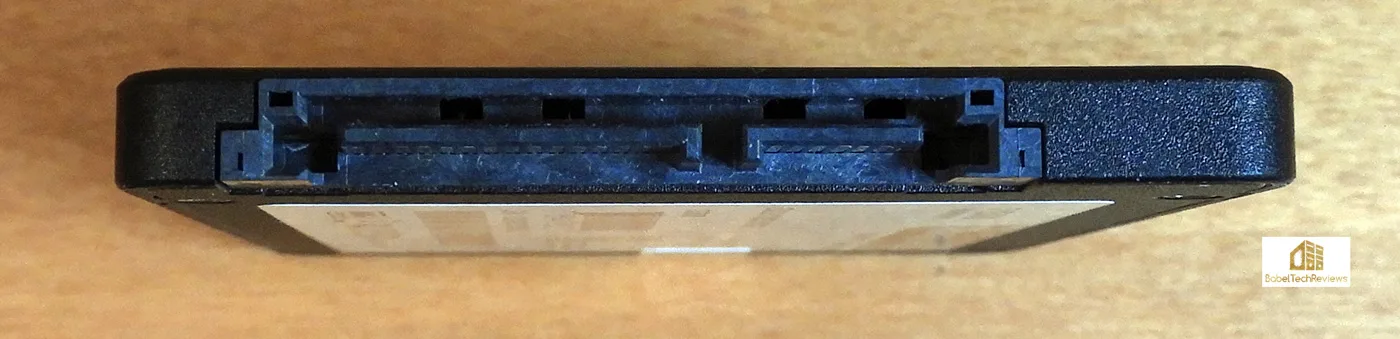
Seen from the edge, the SATA connectors are typical.
After installing the EX2 Elite SSD, the user may need to format it before using it. If you are planning to clone it, make sure both disks are GUID or convert one of them first.
Lets look at our test configuration next.
Test Configuration – Hardware
- Intel Core i9-10900K (HyperThreading and Turbo boost is locked on to 5.1/5.0GHz for all eight cores. Comet Lake DX11 CPU graphics.
- EVGA Z490 FTW motherboard (Intel Z390 chipset, latest BIOS with Resizable BAR disabled, PCIe 3.0/3.1/3.1 – USB 3.0 Type-C specification, CrossFire/SLI 8x+8x)
- T-FORCE XTREEM 16GB DDR4 (2x8GB, dual channel at 3866MHz), supplied by TeamGroup
- T-FORCE EX2 Elite SATA III 512GB SSD, supplied by TeamGroup
- T-FORCE DELTA MAX SATA III 1TB SSD, supplied by TeamGroup
- T-FORCE Vulcan 500GB SATA III SSD, supplied by TeamGroup
- Team Group MP33 1TB NVMe Gen 3 x4 PCIe SSD
- T-FORCE Liquid CARDEA 512GB PCIe Gen 3 x4 NVMe SSD, supplied by TeamGroup
- T-FORCE CARDEA IOPS1TB PCIe Gen 4 x4 NVMe SSD, supplied by TeamGroup
- T-FORCE CARDEA Ceramic C440 1TB PCIe Gen 4 x4 NVMe SSD, supplied by TeamGroup
- ANTEC HCG1000 Extreme, 1000W gold power supply unit
- DEEPCOOL Castle 360EX AIO 360mm liquid CPU cooler
- Phanteks Eclipse P400 ATX mid-tower (plus 1 Noctua 140mm fan)
- BenQ EW3270U 32? 4K HDR 60Hz FreeSync monitor
Test Configuration – Software
- Intel’s drivers v30.0.100.9966
- Gaming results show loading time in seconds and lower is better
- Windows 10 64-bit Pro edition; latest updates/build
- Latest DirectX
- All benchmarking programs are updated to their latest versions
- IOmeter
- HD Tach
- HD Tune
- AS SSD
- ATTO
- Crystal DiskMark
- S.M.A.R.T. Tool (TeamGroup)
PC Game & Level Loading Suite
- World of Warcraft (PCMark 8)
- Battlefield 3 (PCMark 8)
- Final Fantasy XIV: Shadowbringers & Endwalker benchmarks – loading times of five levels each
Synthetic Benching Suites
- SiSoft Sandra 2020
- AIDA64
- PCMark 8
- PCMark 10 Pro version courtesy of UL
- SPECworkstation3 (3.0.4) Benchmarks
- Anvil’s Storage Utilities
- TxBENCH
Let’s head to our benching results.
Benchmarking the EX2 Elite SSD
Benchmarking SSDs are not an exact science as there is variability between runs, and different benchmarks may show different results depending on how they run their tests and how up-to-date the benchmarks are. However, by using enough real world and synthetic tests, it may be possible to get a good idea of the relative performance across all six tested drives. For benchmark results, the drives are generally listed in the following order on the charts:
- TeamGroup EX2 Elite SATA III 512MB SSD
- T-FORCE DELTA MAX SATA III 1TB SSD
- T-FORCE Vulcan 500GB SATA III SSD
- Team Group MP33 1TB NVMe Gen 3 x4 PCIe SSD
- T-FORCE Liquid CARDEA 512GB PCIe Gen 3 x4 NVMe SSD
- T-FORCE CARDEA IOPS 1TB PCIe Gen 3 x4 NVMe SSD
- T-FORCE CARDEA Ceramic C440 1TB PCIe Gen 4 x4 NVMe SSD
We did not set up Windows on the Vulcan SSD, so not all of the benchmarks could be run on it. All of the drives will have their results summarized in multiple charts. Let’s start first with TeamGroup’s own S.M.A.R.T. utility to get some information on each SSD.
S.M.A.R.T.
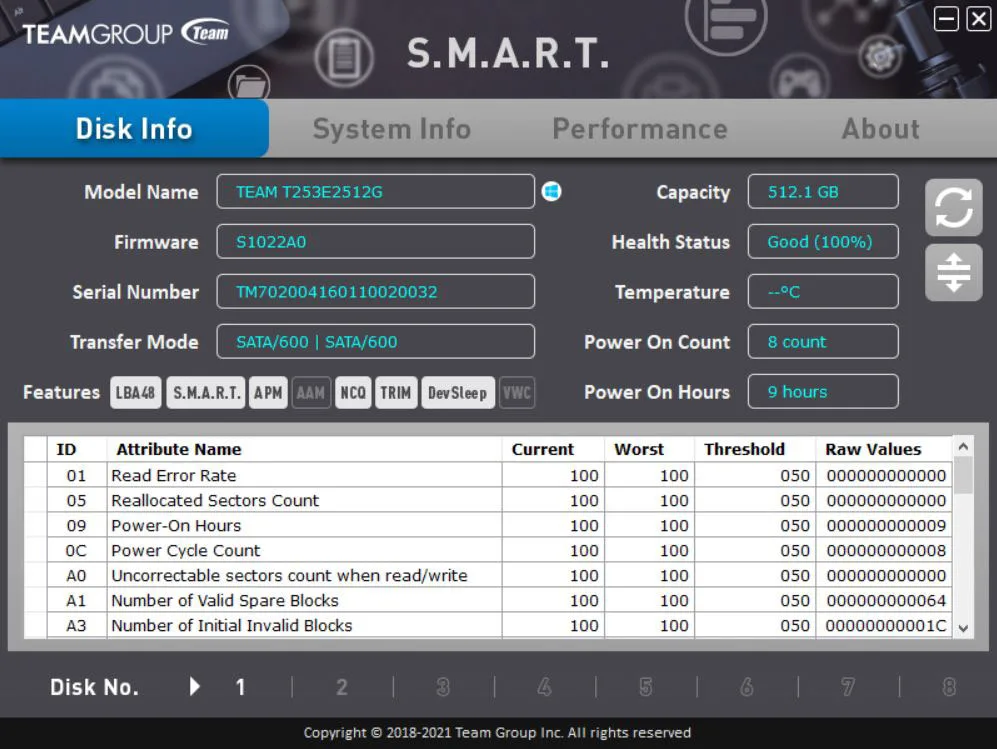
This TeamGroup S.M.A.R.T. utility gives more information than many other free disk tools.
First is the system and disk information for the EX2 Elite.
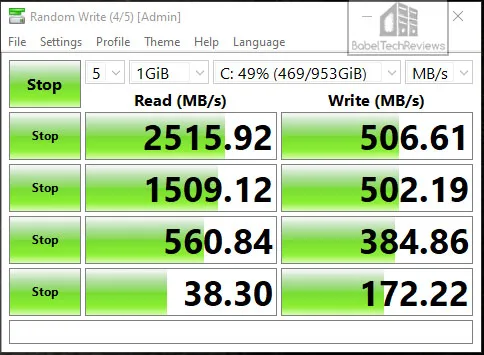
S.M.A.R.T. also tests the drive with two sets of tests. First up, the EX2 Elite dual performance tests starting with MB/s.
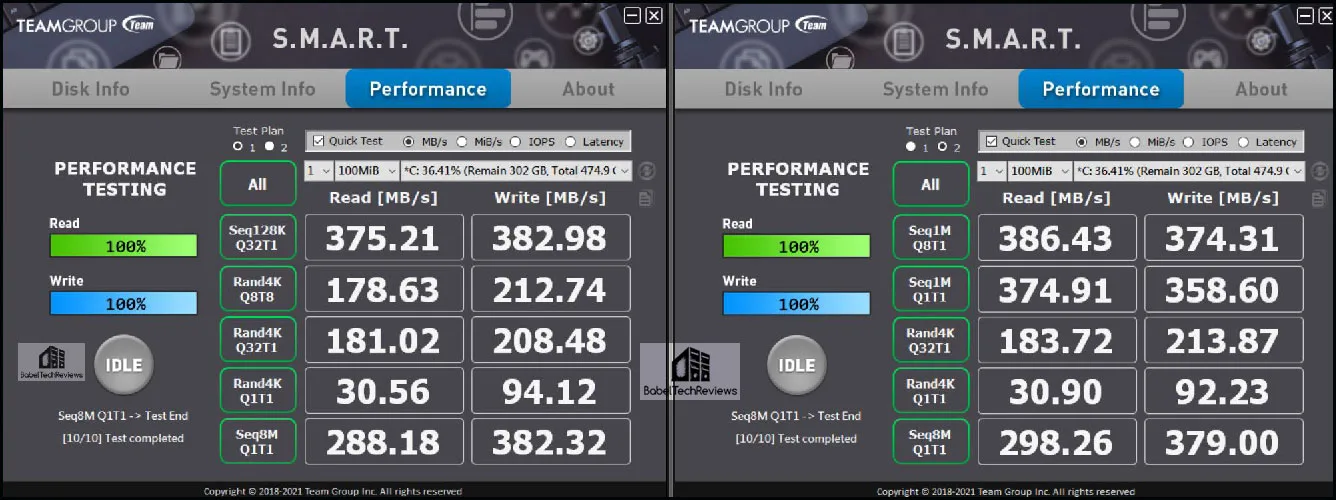
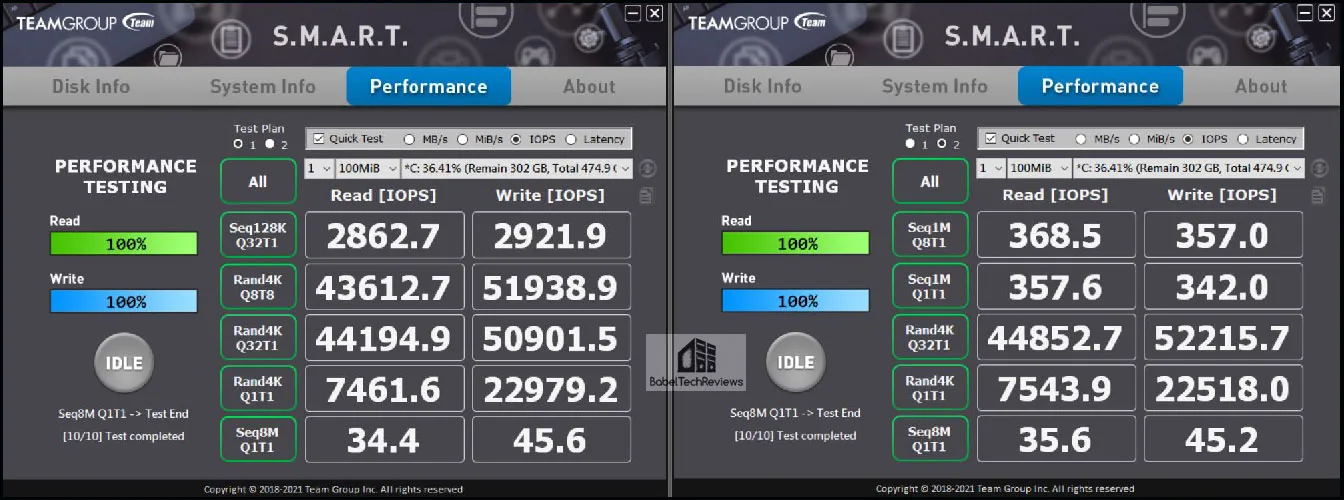
Next the EX2 Elite performance dual test results given in IOPS.
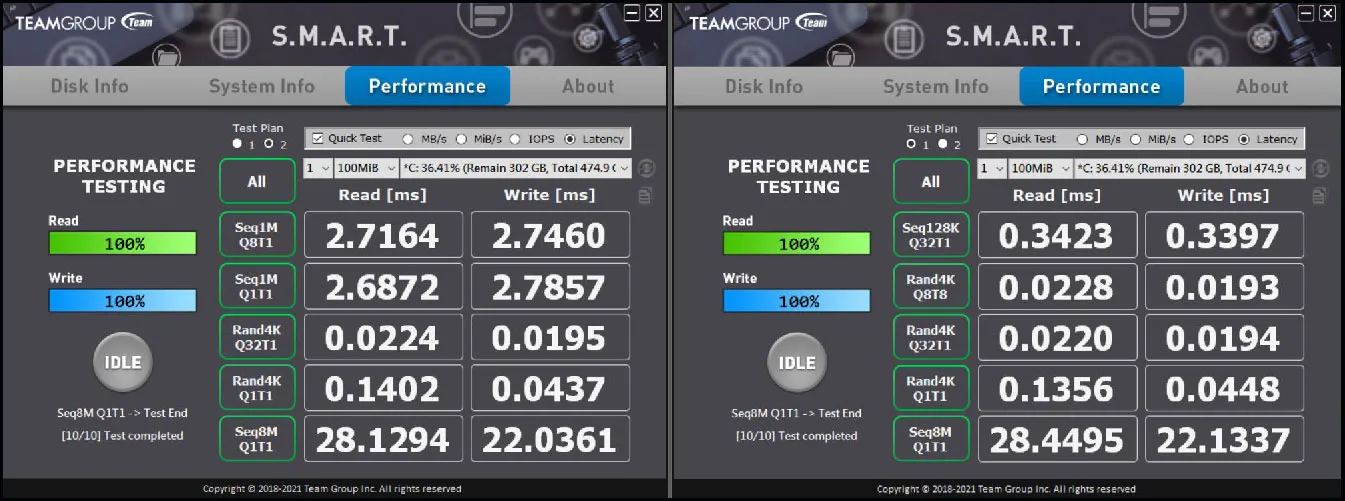
Finally, S.M.A.R.T. measures the EX2 Elite SSD latency.
Next, the DELTA MAX dual performance tests starting with MB/s. 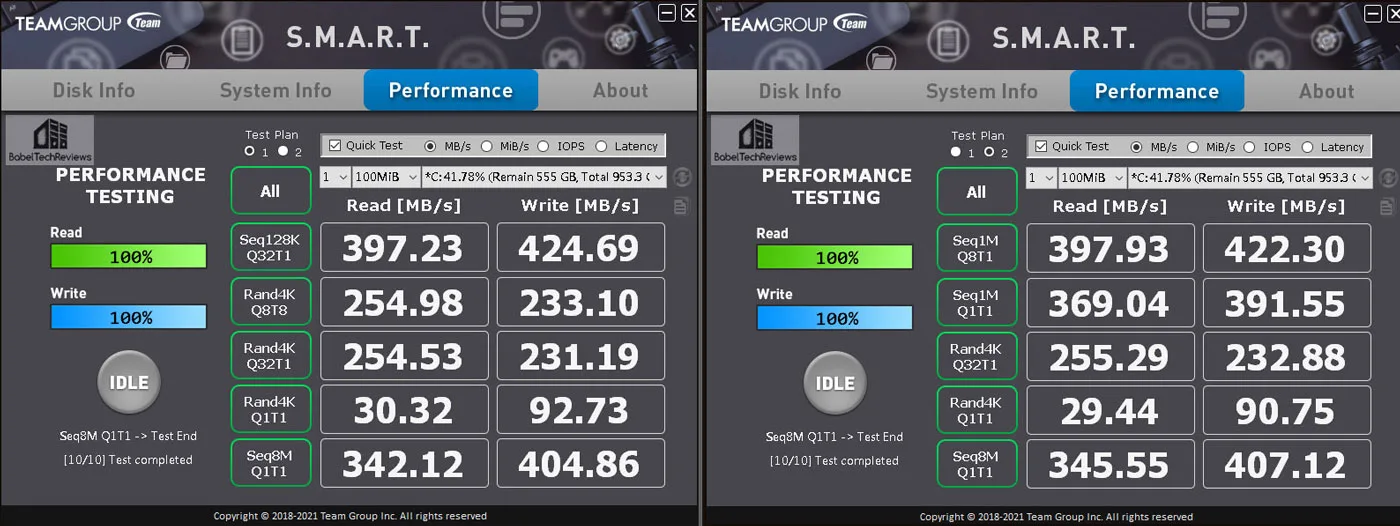 Next, S.M.A.R.T. measures the DELTA MAX SATA III SSD latency.
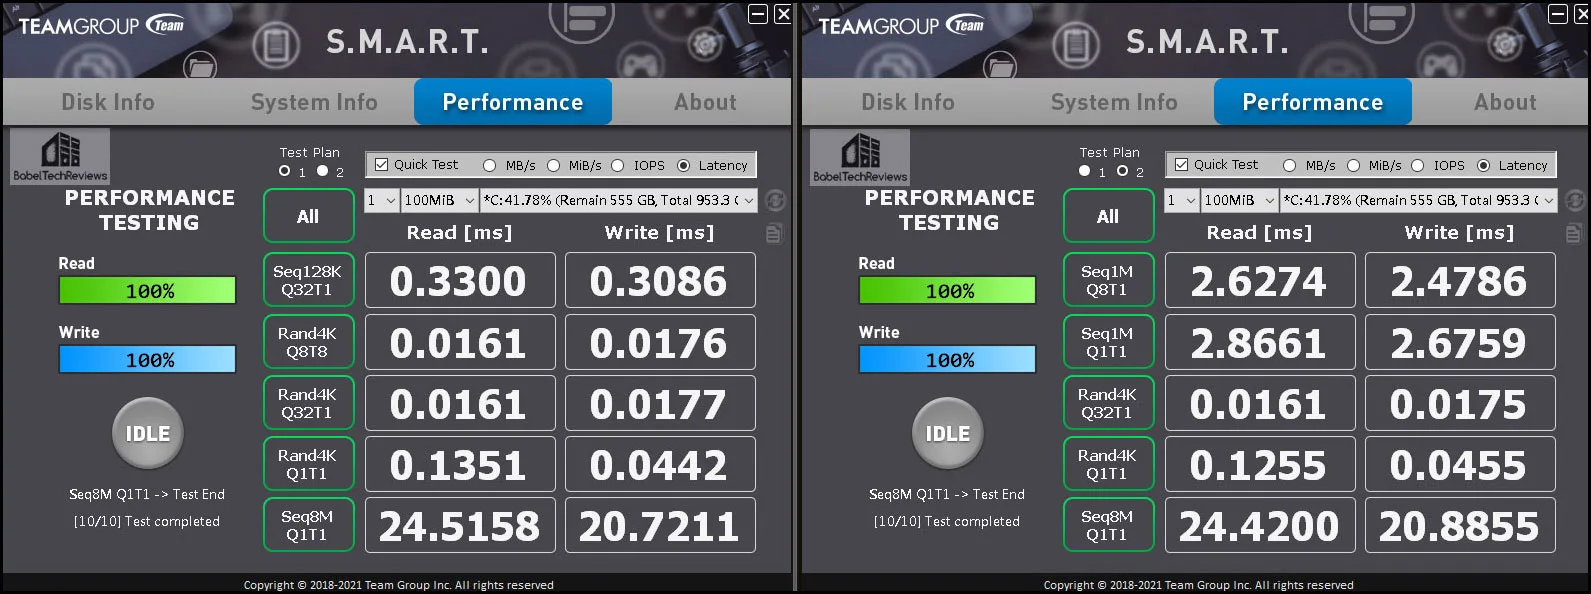 We check the performance tests in MB/s for the Vulcan SATA III SSD.
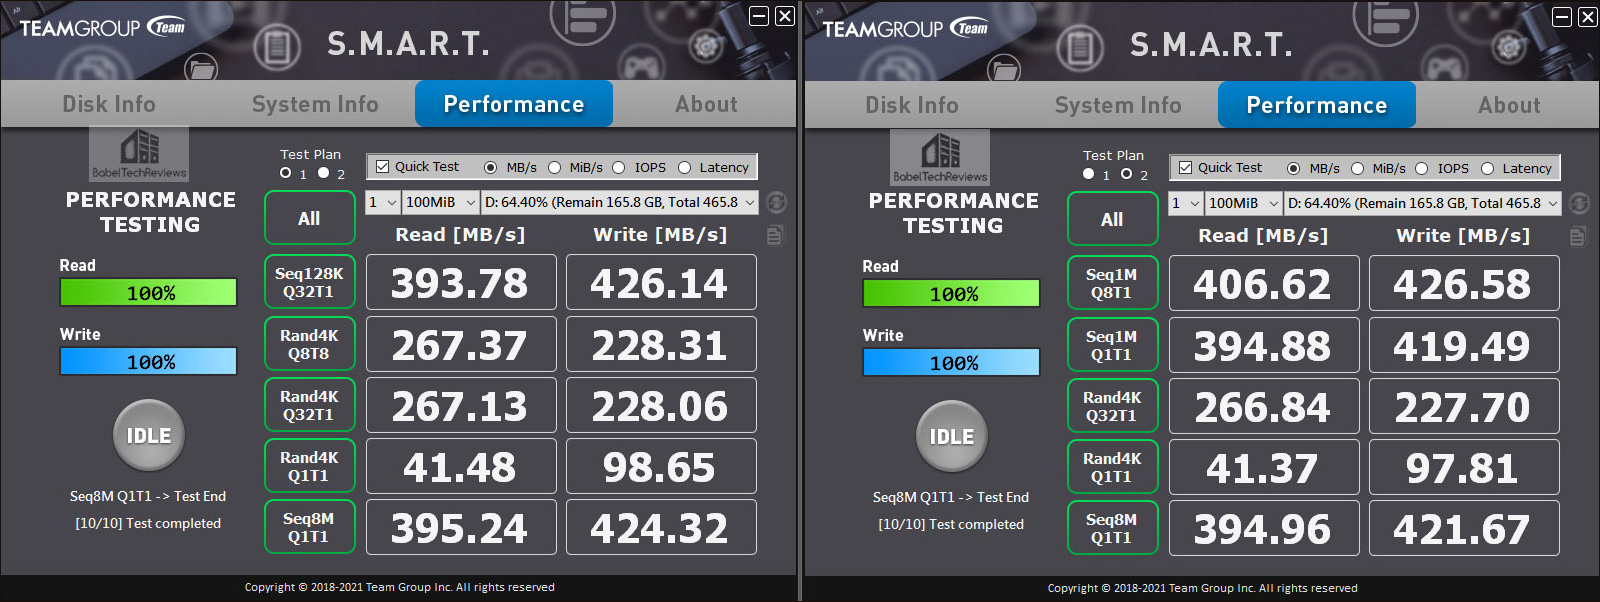 Next the dual latency tests for the Vulcan SSD.
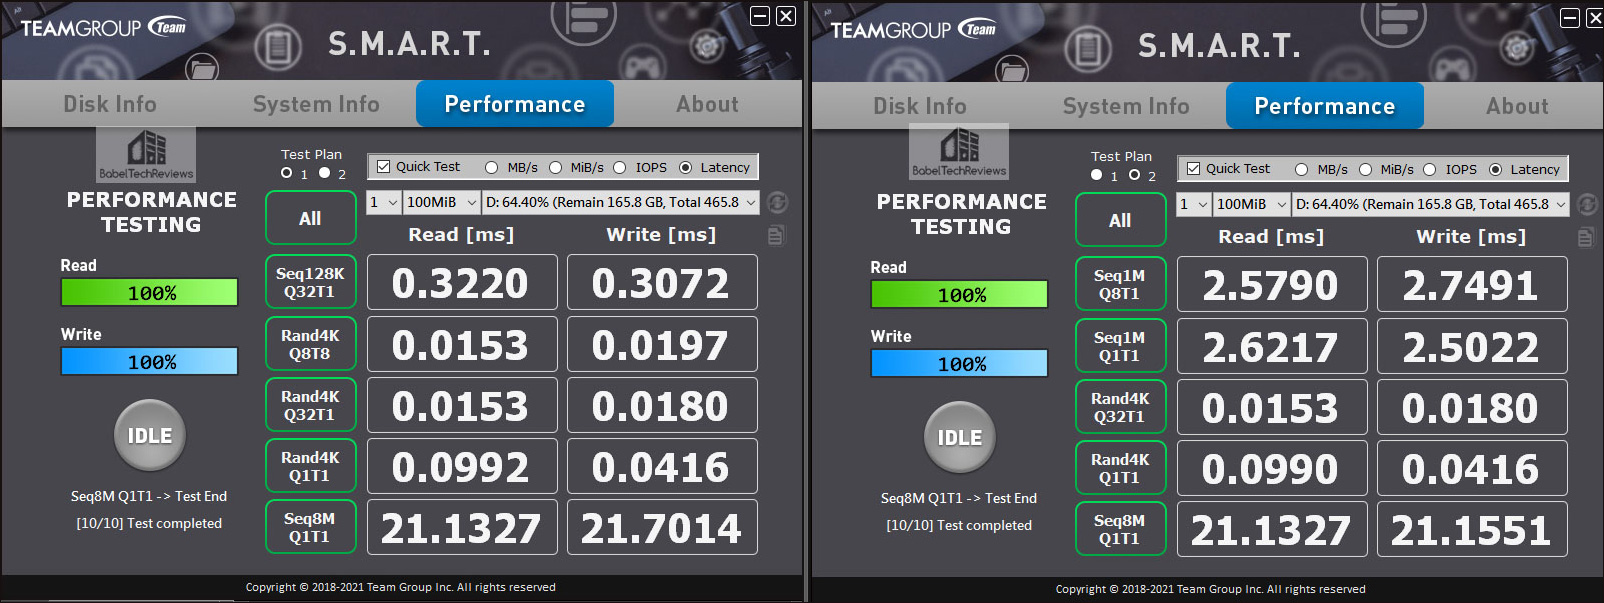 Next we look at the performance tests in MB/s for the TeamGroup MP33 SSD.
 Now the dual latency tests for the MP33 SSD.
 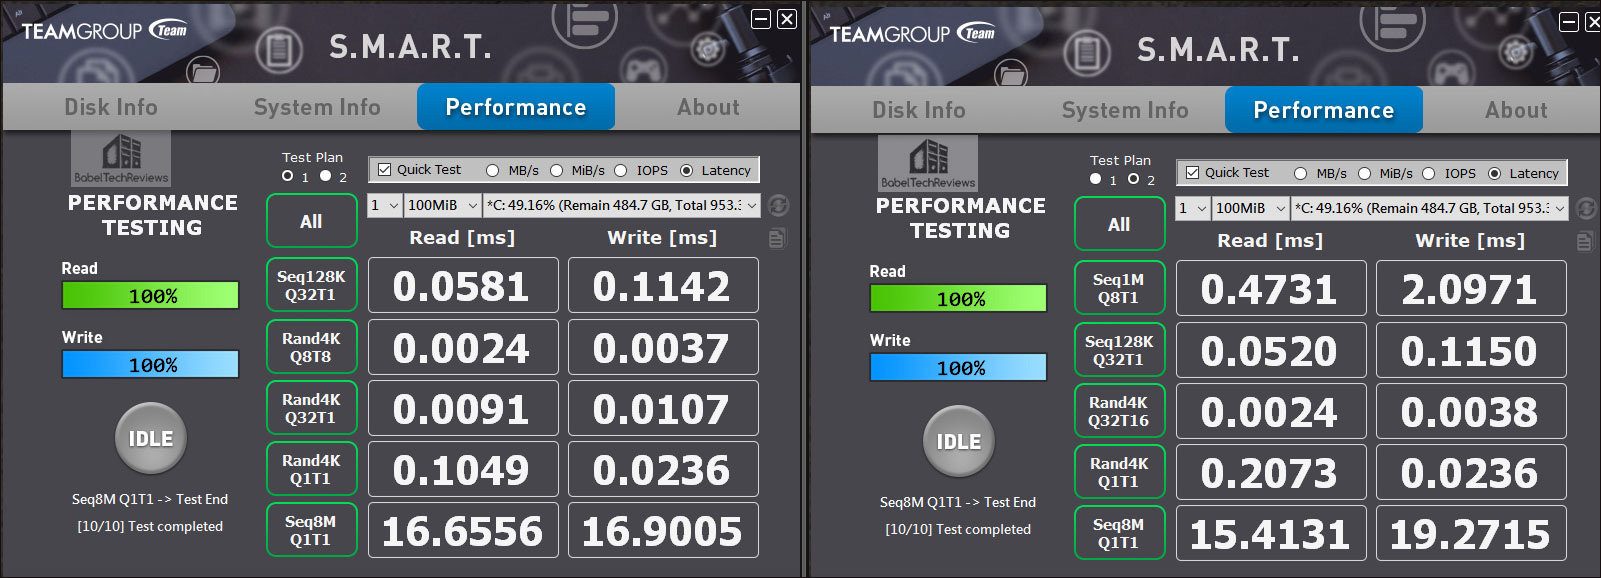 Next, the performance tests in MB/s for the CARDEA Liquid SSD.
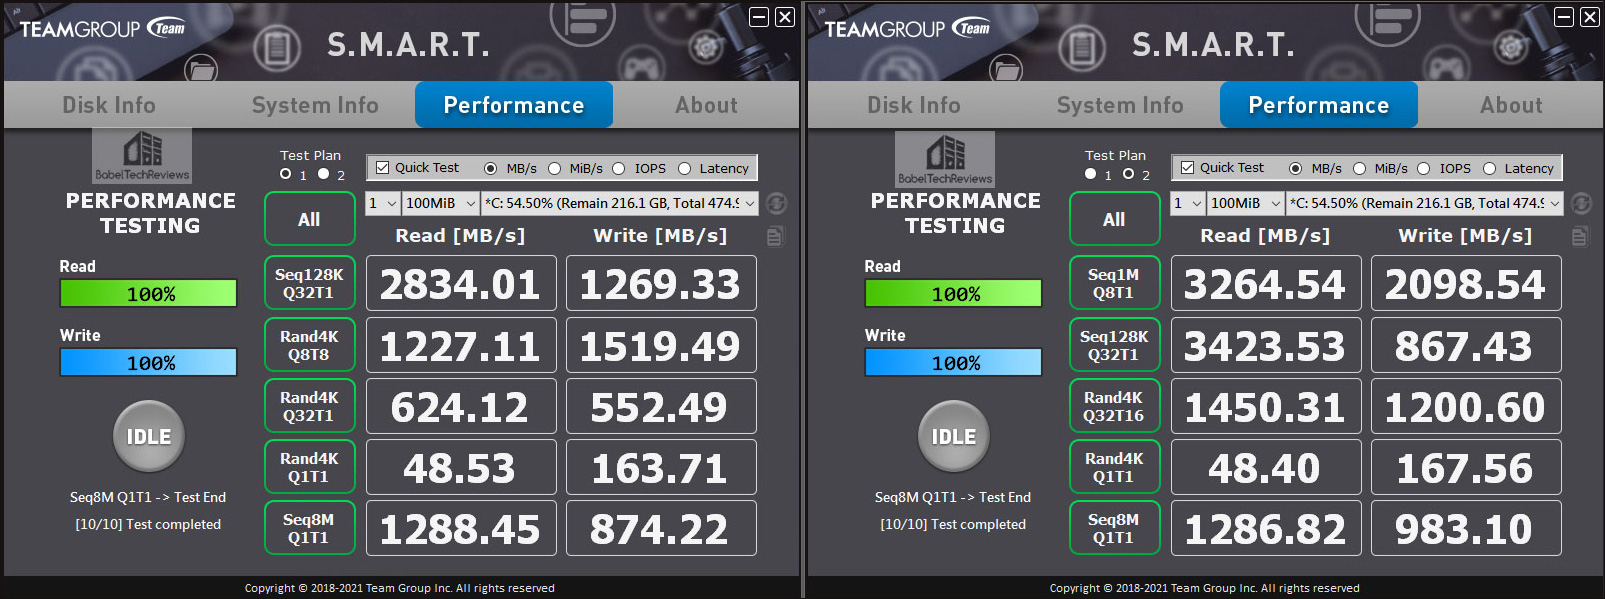 Now the dual latency tests for the CARDEA Liquid SSD.
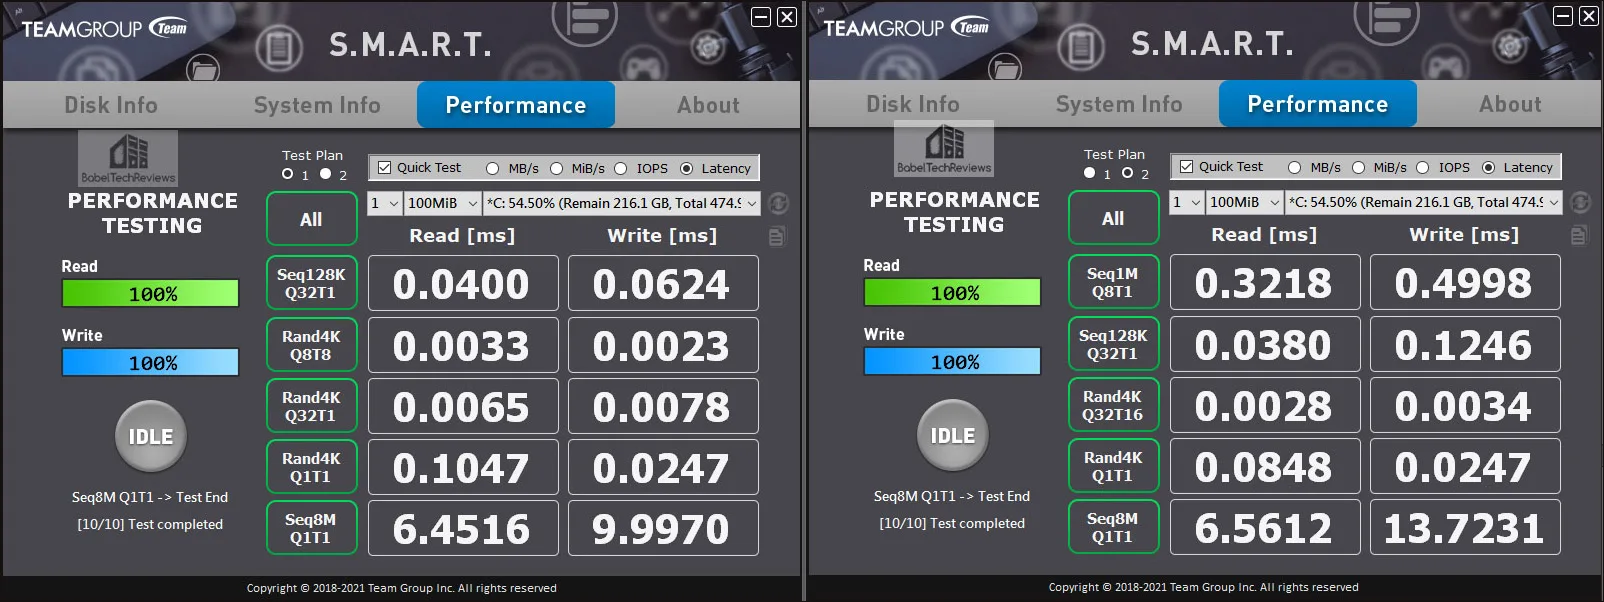 Here are the dual performance tests in MB/s for the T-FORCE CARDEA IOPS.
 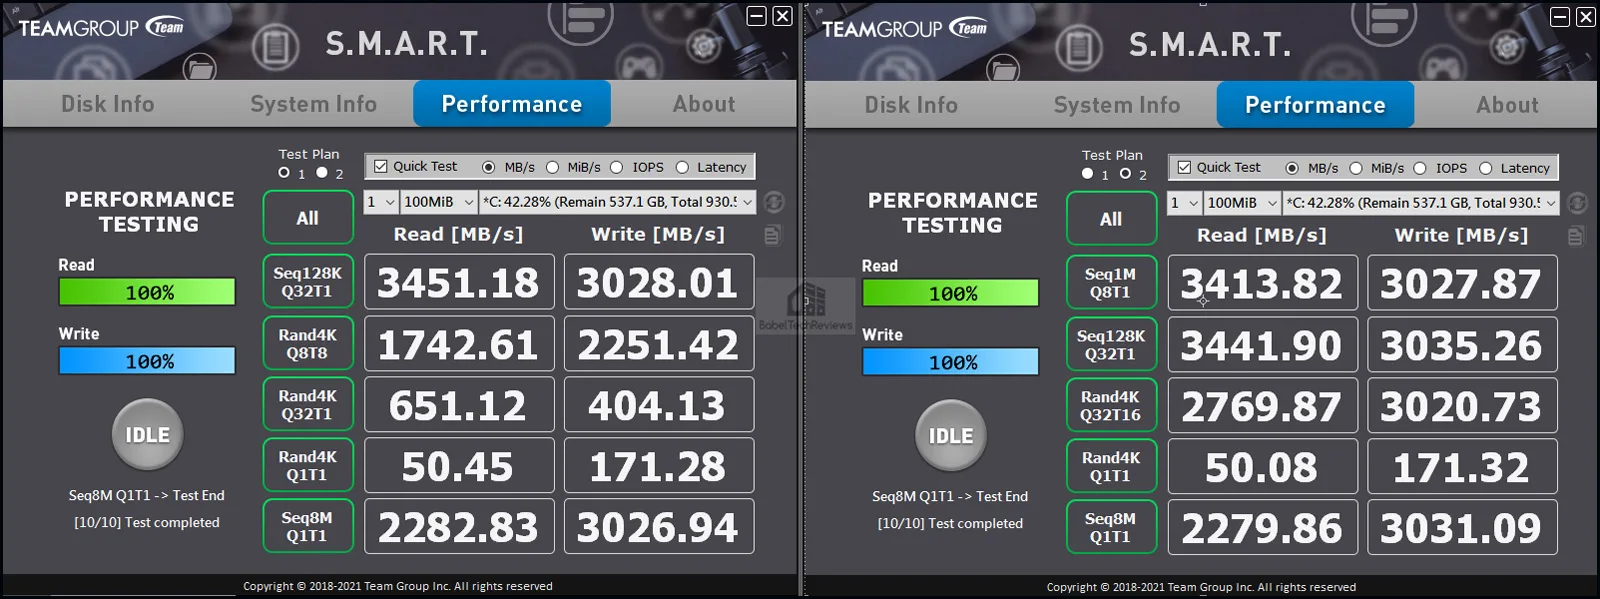 S.M.A.R.T. next measures latency for the CARDEA IOPS.
 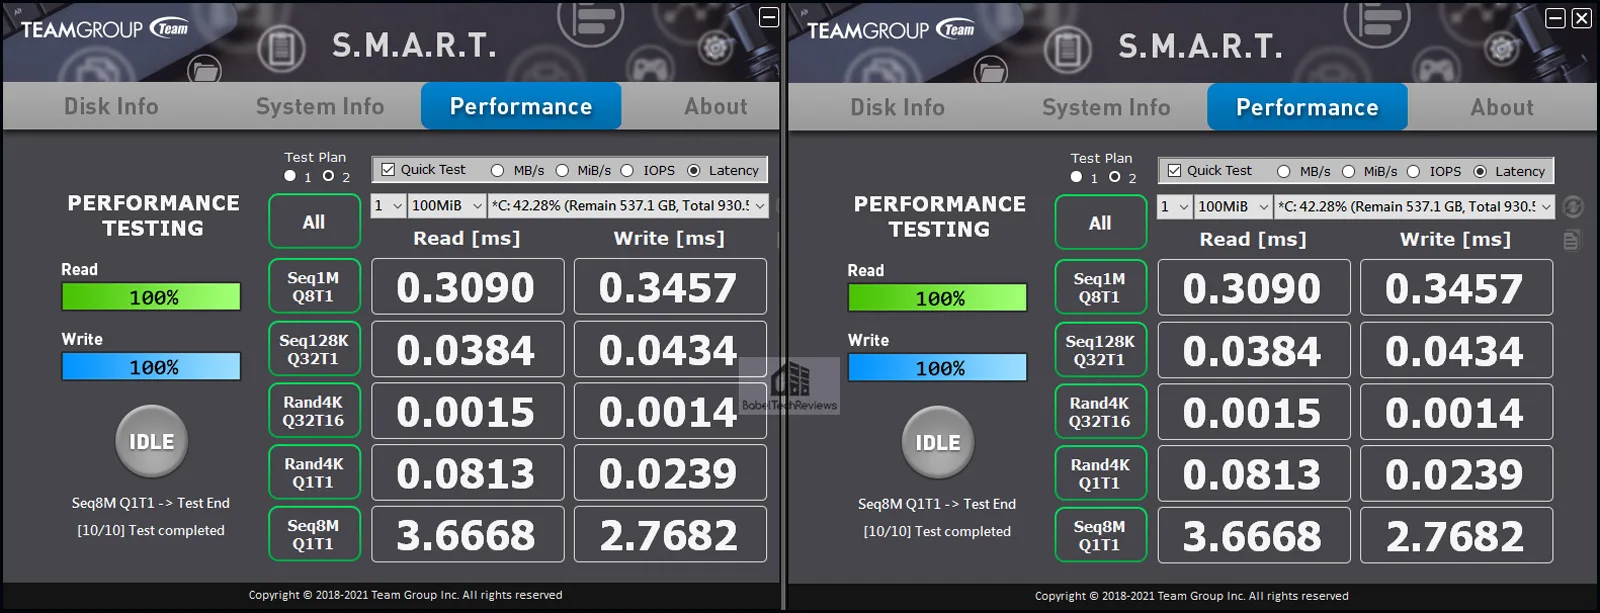 Next, the performance tests in MB/s for the T-FORCE CARDEA Ceramic C440.
 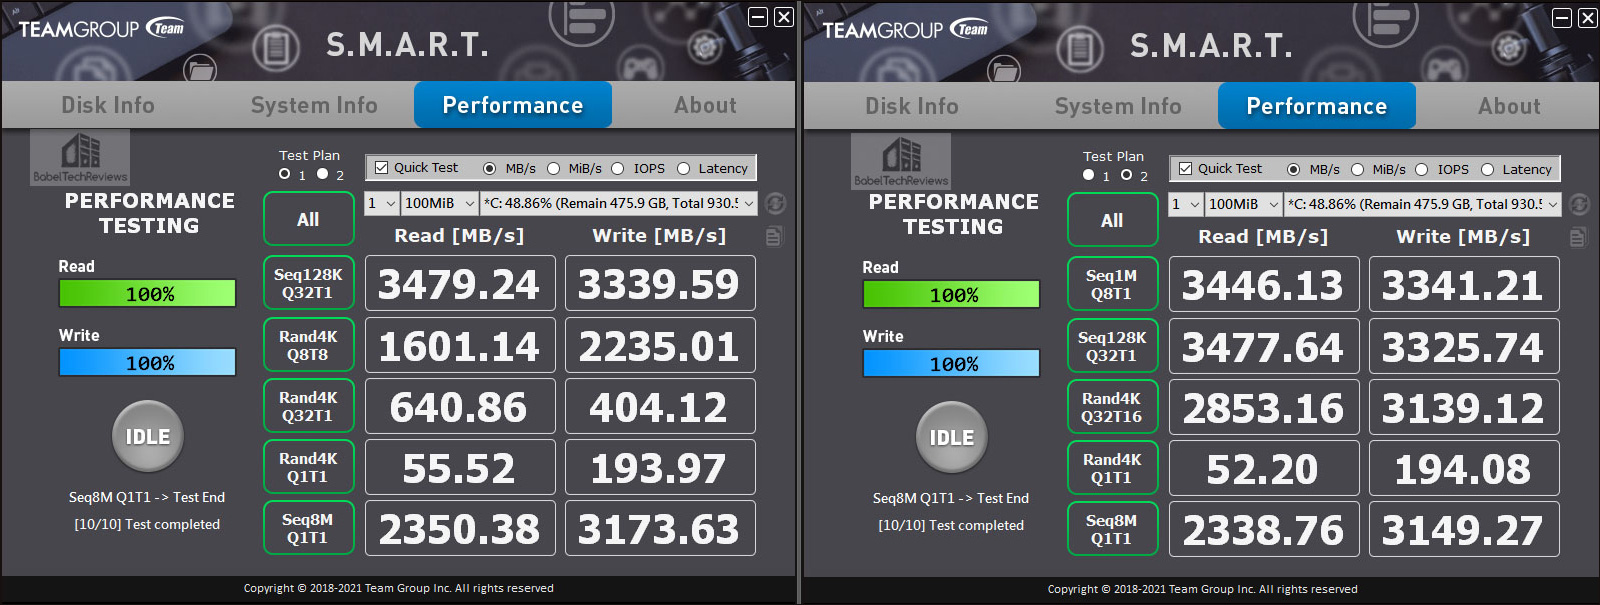 Finally, the S.M.A.R.T. tool measures latency for the CARDEA Ceramic C440.
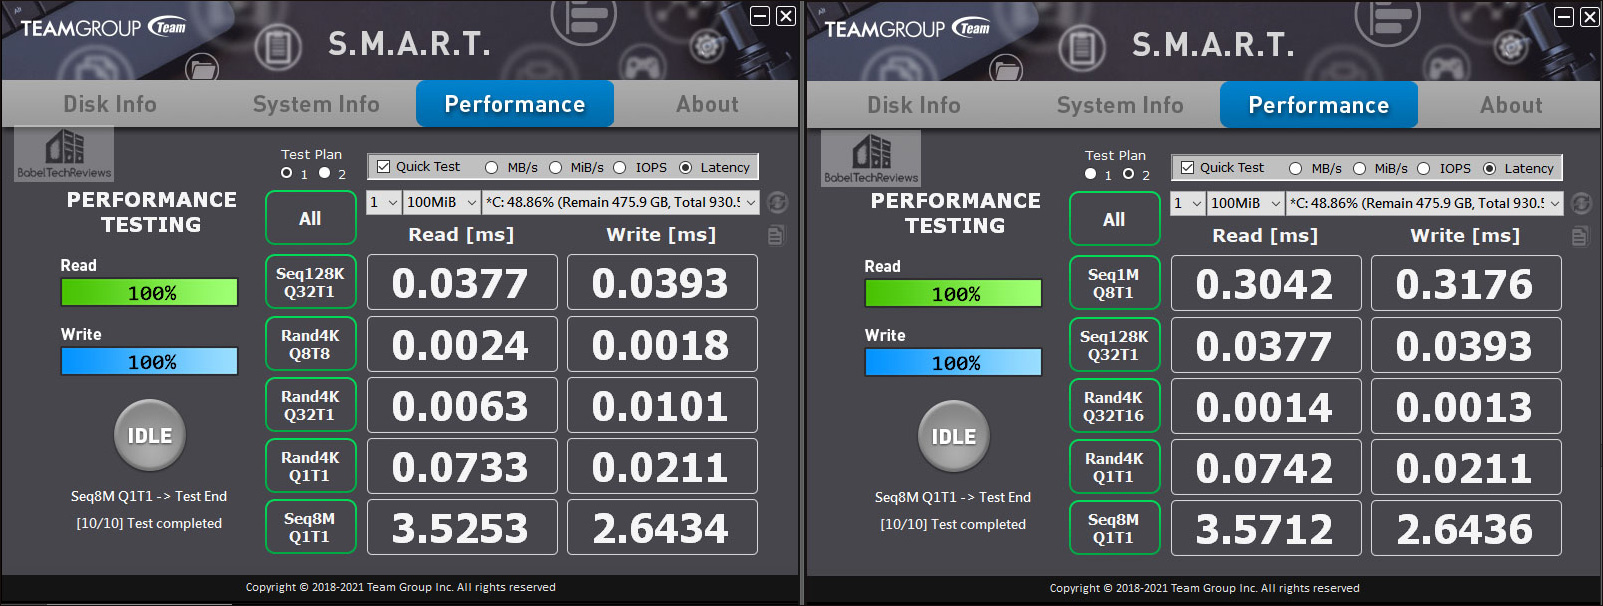 S.M.A.R.T. clearly shows the PCIe CARDEA Ceramic C440 is the fastest SSD, followed by the CARDEA IOPS, then the CARDEA Liquid, then the TeamGroup MP33 SSD, and in last places, the SATA III SSDs – the Vulcan SSD, the DELTA MAX, and the EX2 Elite offer similar performance although they do not achieve their stated Read/Write speeds of 560/510 MBps.
TeamGroup’s S.M.A.R.T. tool is a great place to start, so let’s see what other synthetic and real world tests show. Let’s begin with PCMark 10.
PCMark 10
UL (formerly Futuremark) has been a developer and publisher of PC benchmark applications for nearly two decades. Although PCMark benches are synthetic tests, they provide a good measure of system performance. PCMark 10 was primarily developed for Windows 10 and it builds upon the PCMark 8 platform for a package of vendor-neutral home and office benchmarks.
Unfortunately, in comparison to PCMark 8, PCMark 10 misses several key elements including detailed storage testing, and it is not possible to test the Vulcan SATA SSD as an attached drive as with the older suite. We use both PCMark 10’s Express and Extended settings which are summarized after all of the screenshots are presented. The Express benchmark suite is best suited for office tasks while the Extended benchmarks are for power users.
To properly compare the PCMark 10 scores, look at the detailed results. All of the SSD results are presented as screenshots. Open the images in separate tabs for easy individual test result comparisons.
Express benchmarks
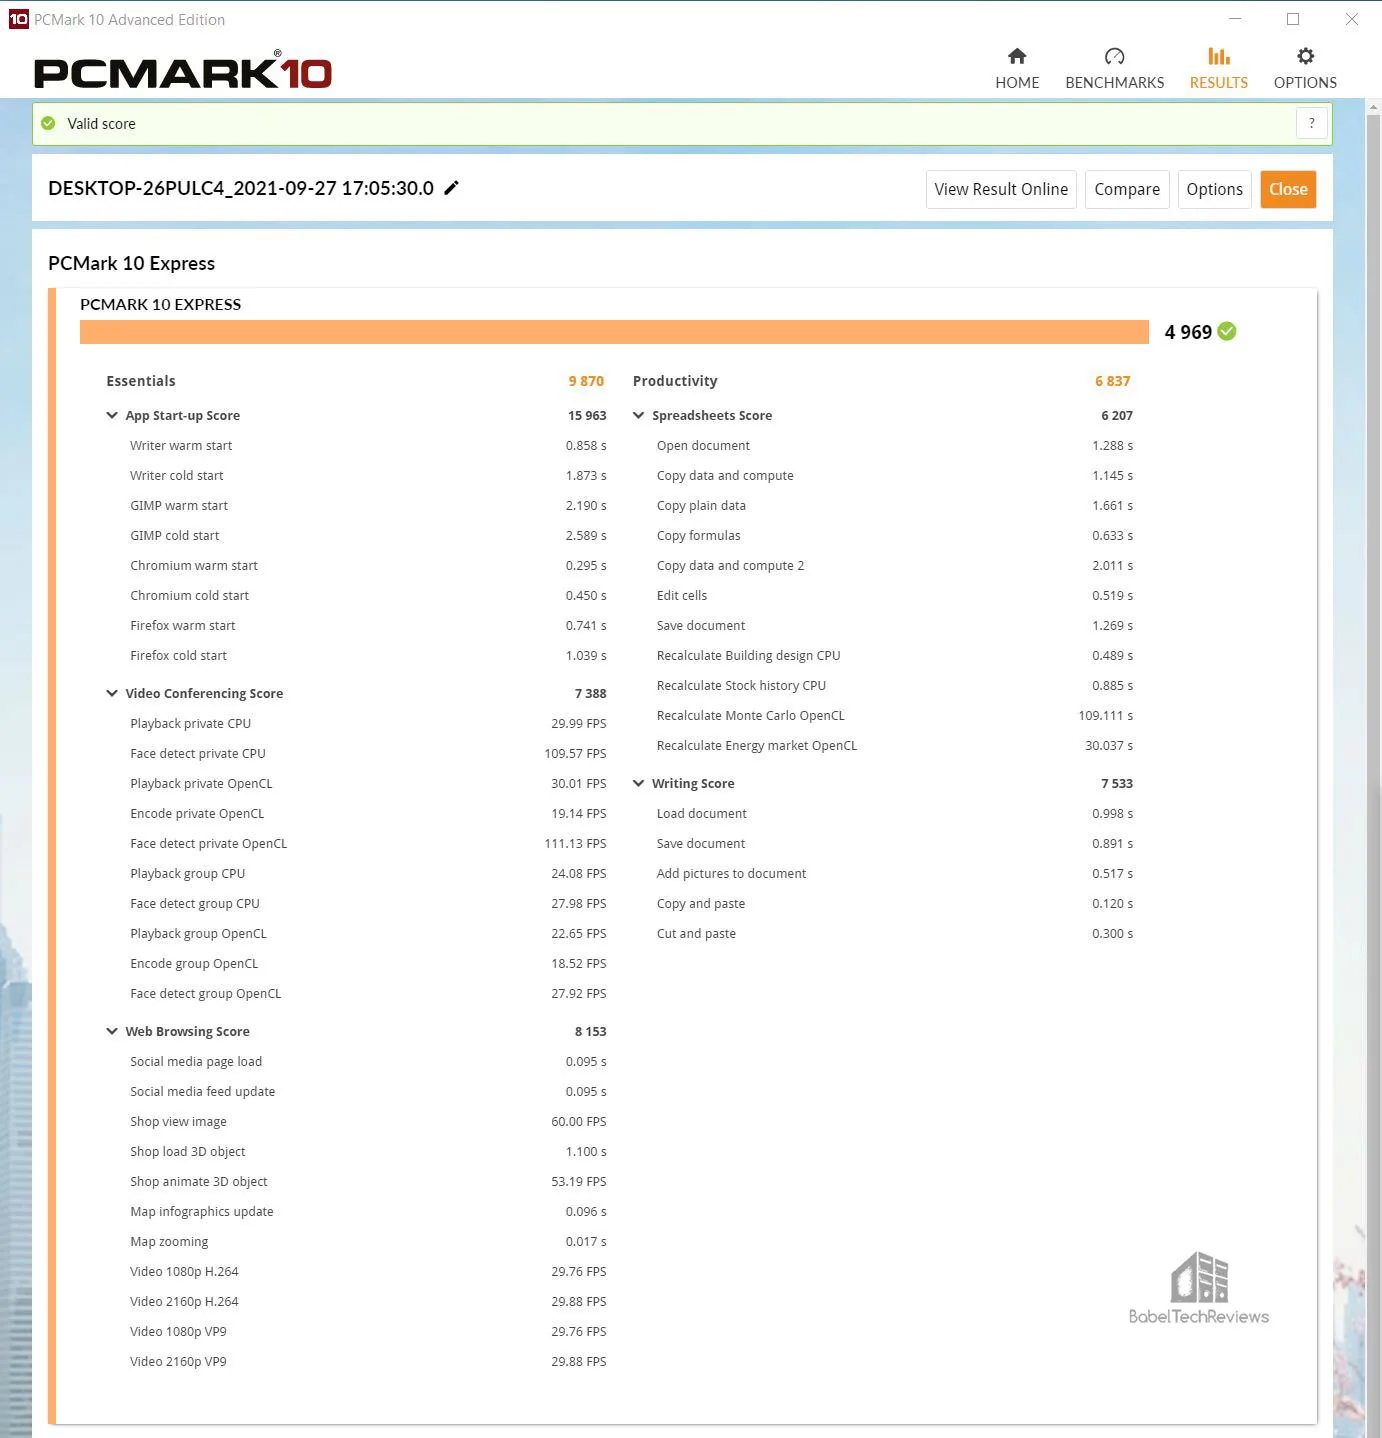
First up is the EX2 Elite SATA III Express score with 4969.
Next up, the T-FORCE DELTA MAX White SATA III Express score with 5045. 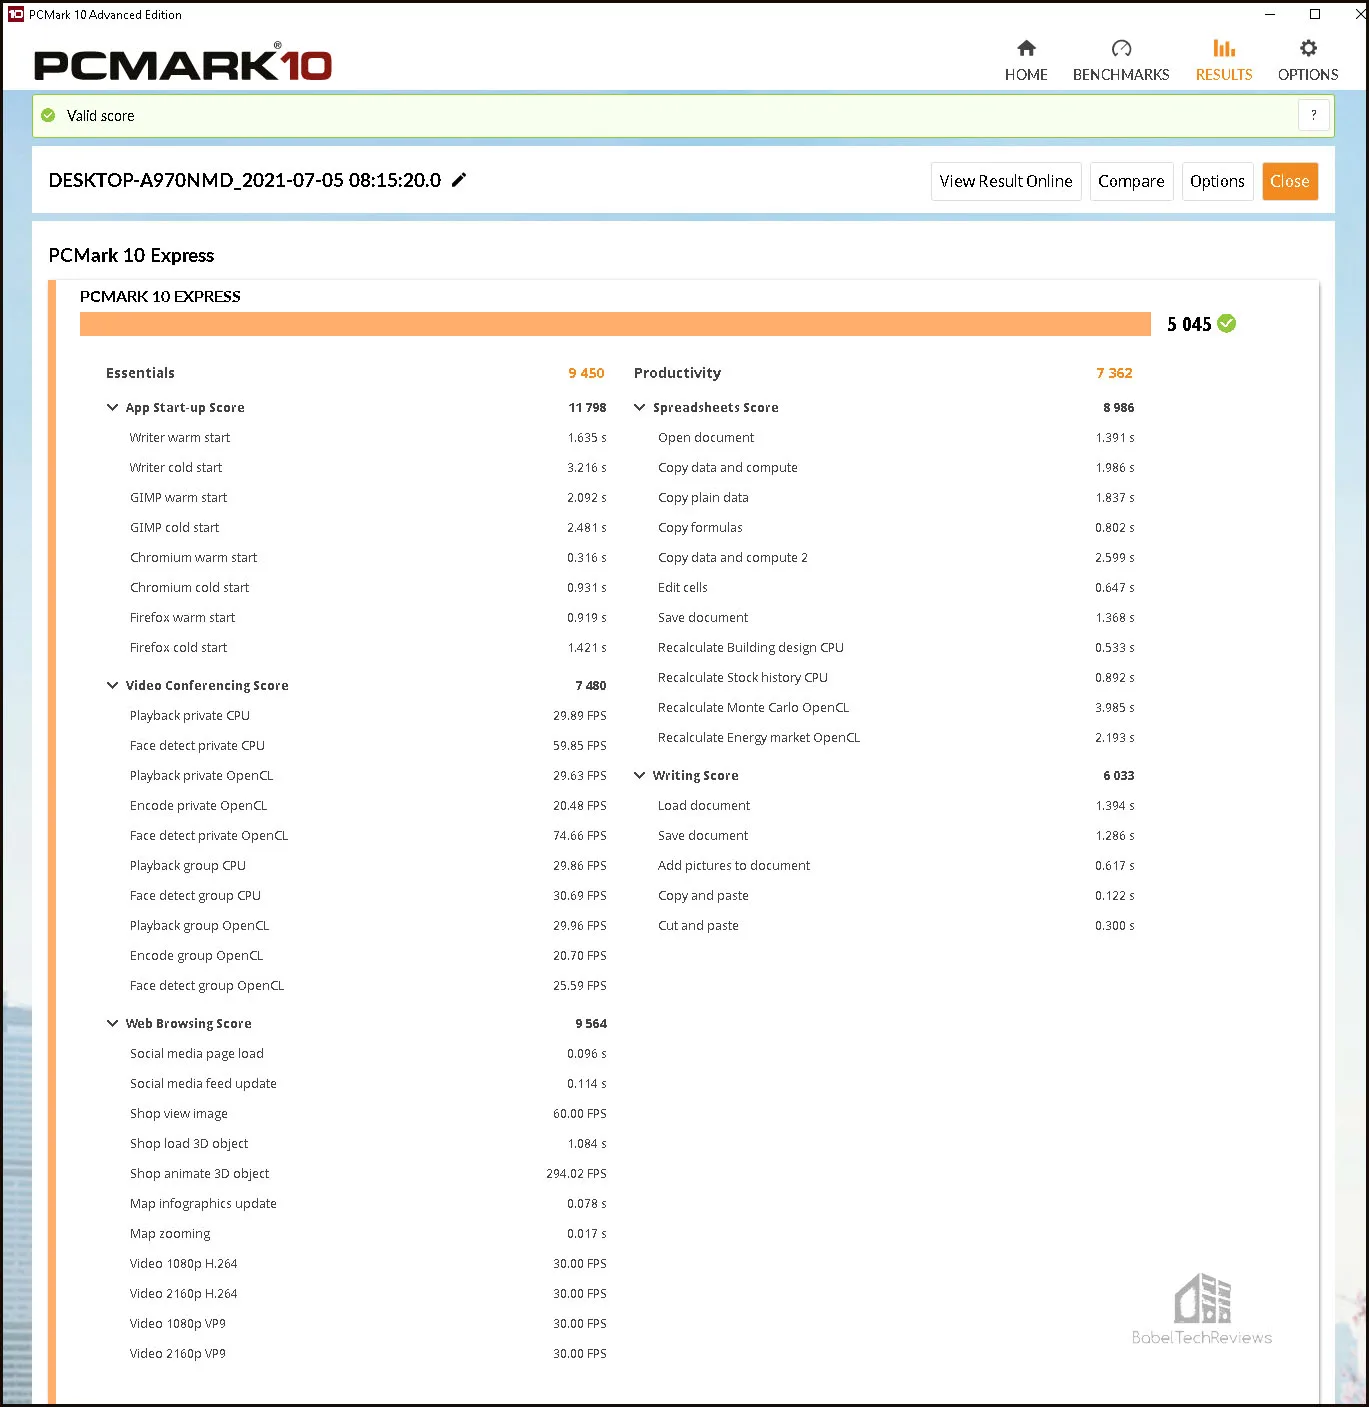 We did not test the Vulcan SATA III SSD, so the Team Group MP33 NVM2 PCIe 1TB SSD Express score is next with 5428
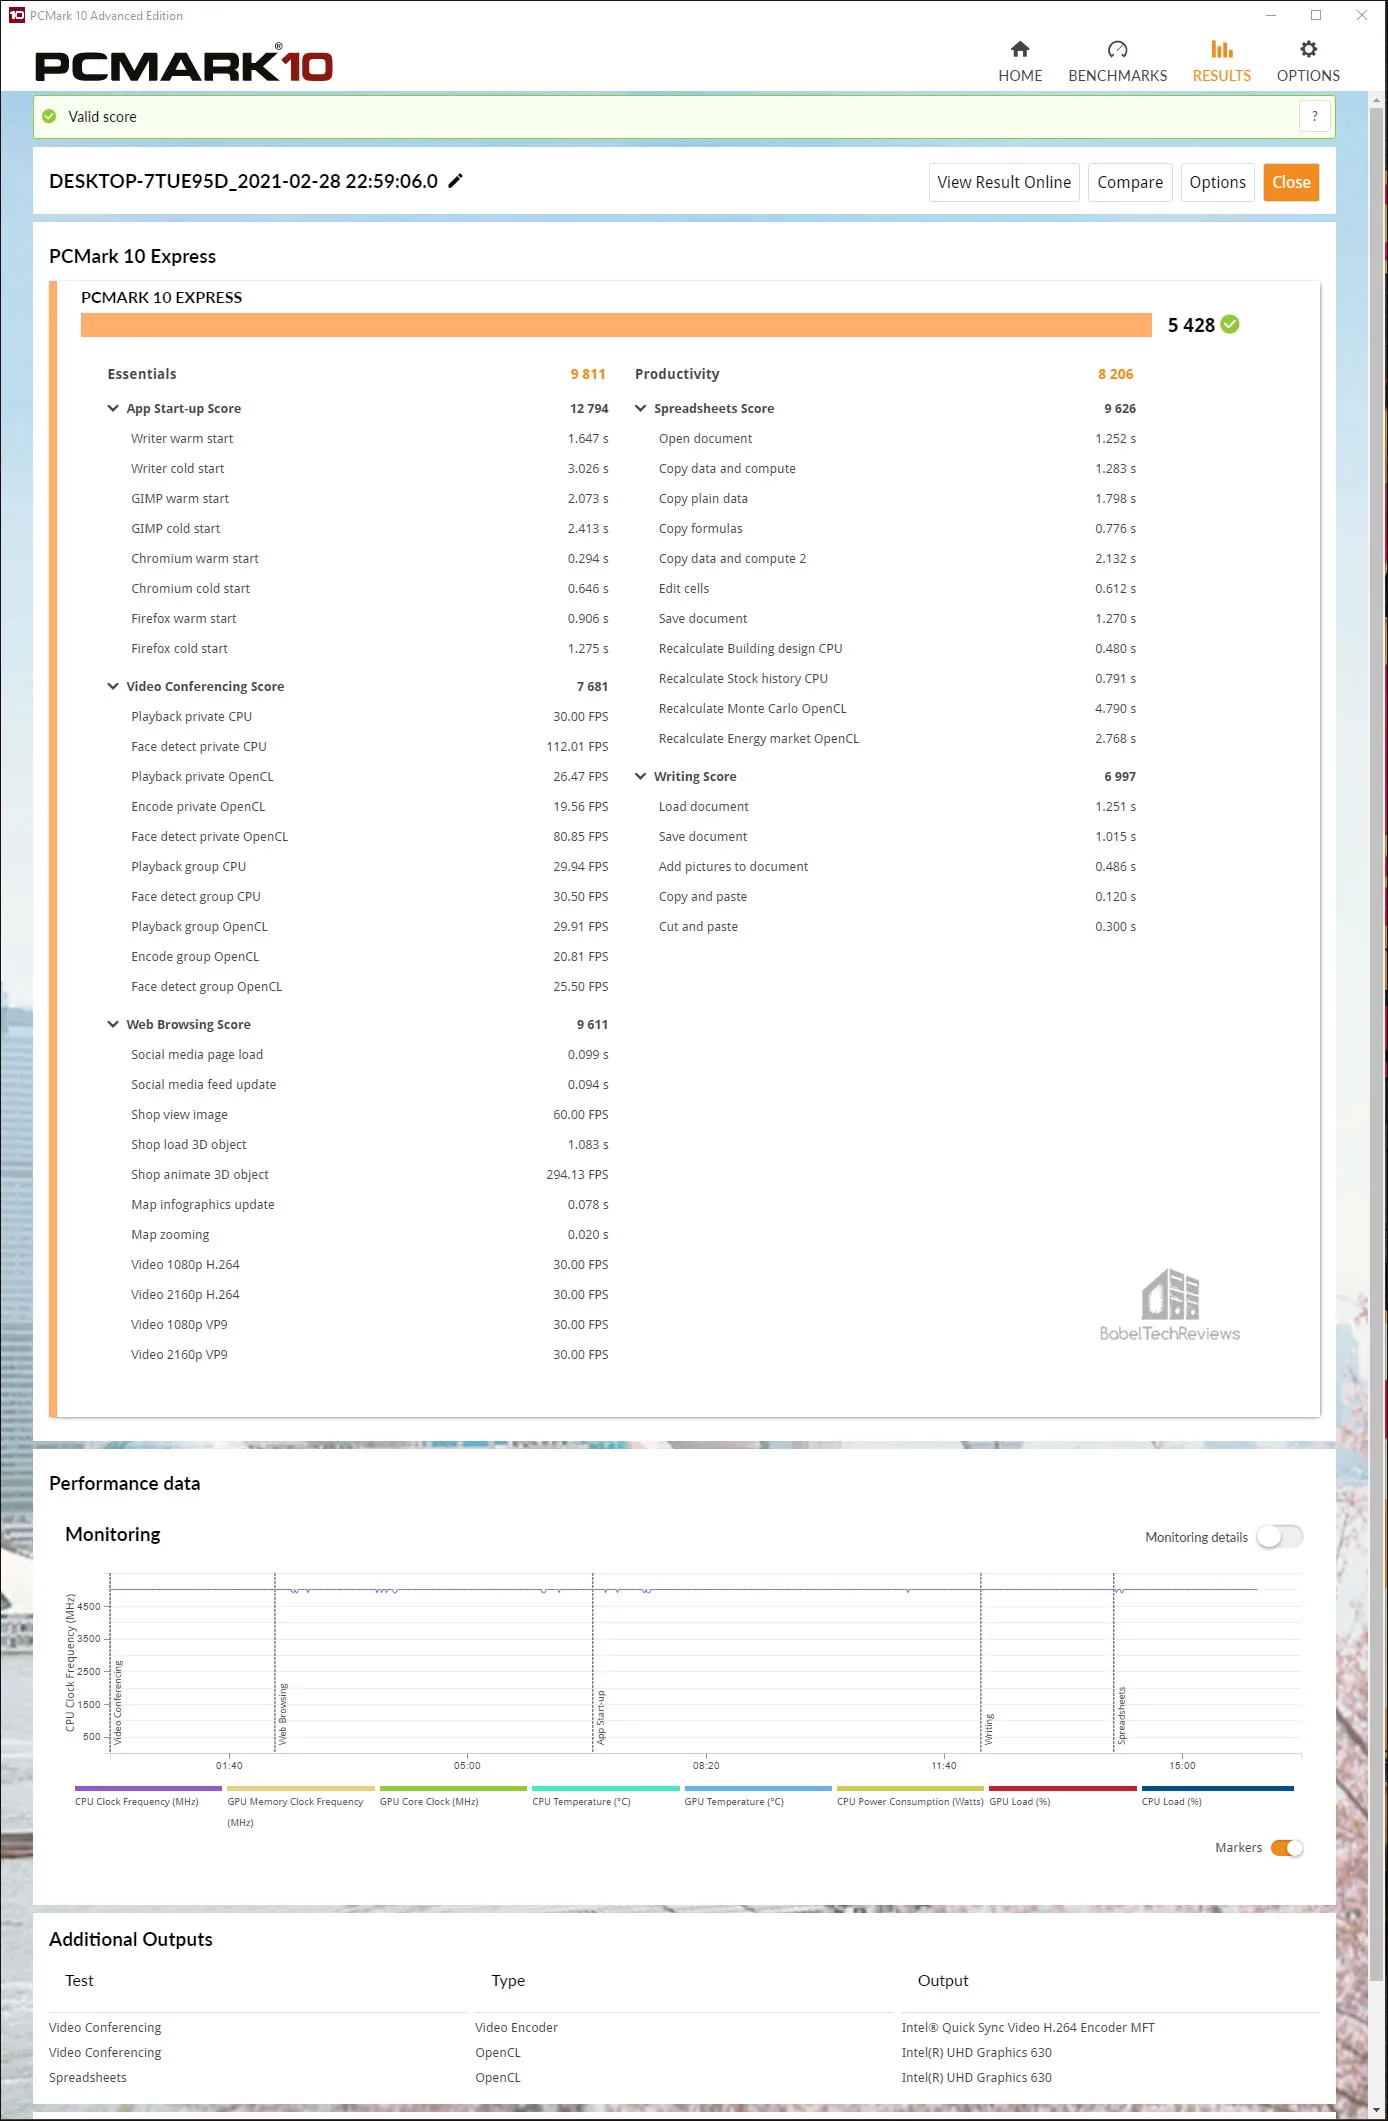 Here are the Liquid CARDEA Express results with 5475
 Next up is the CARDEA IOPS NVMe Express score with 5610.
  Finally, we see the CARDEA Ceramic NVMe Express score with 5562.
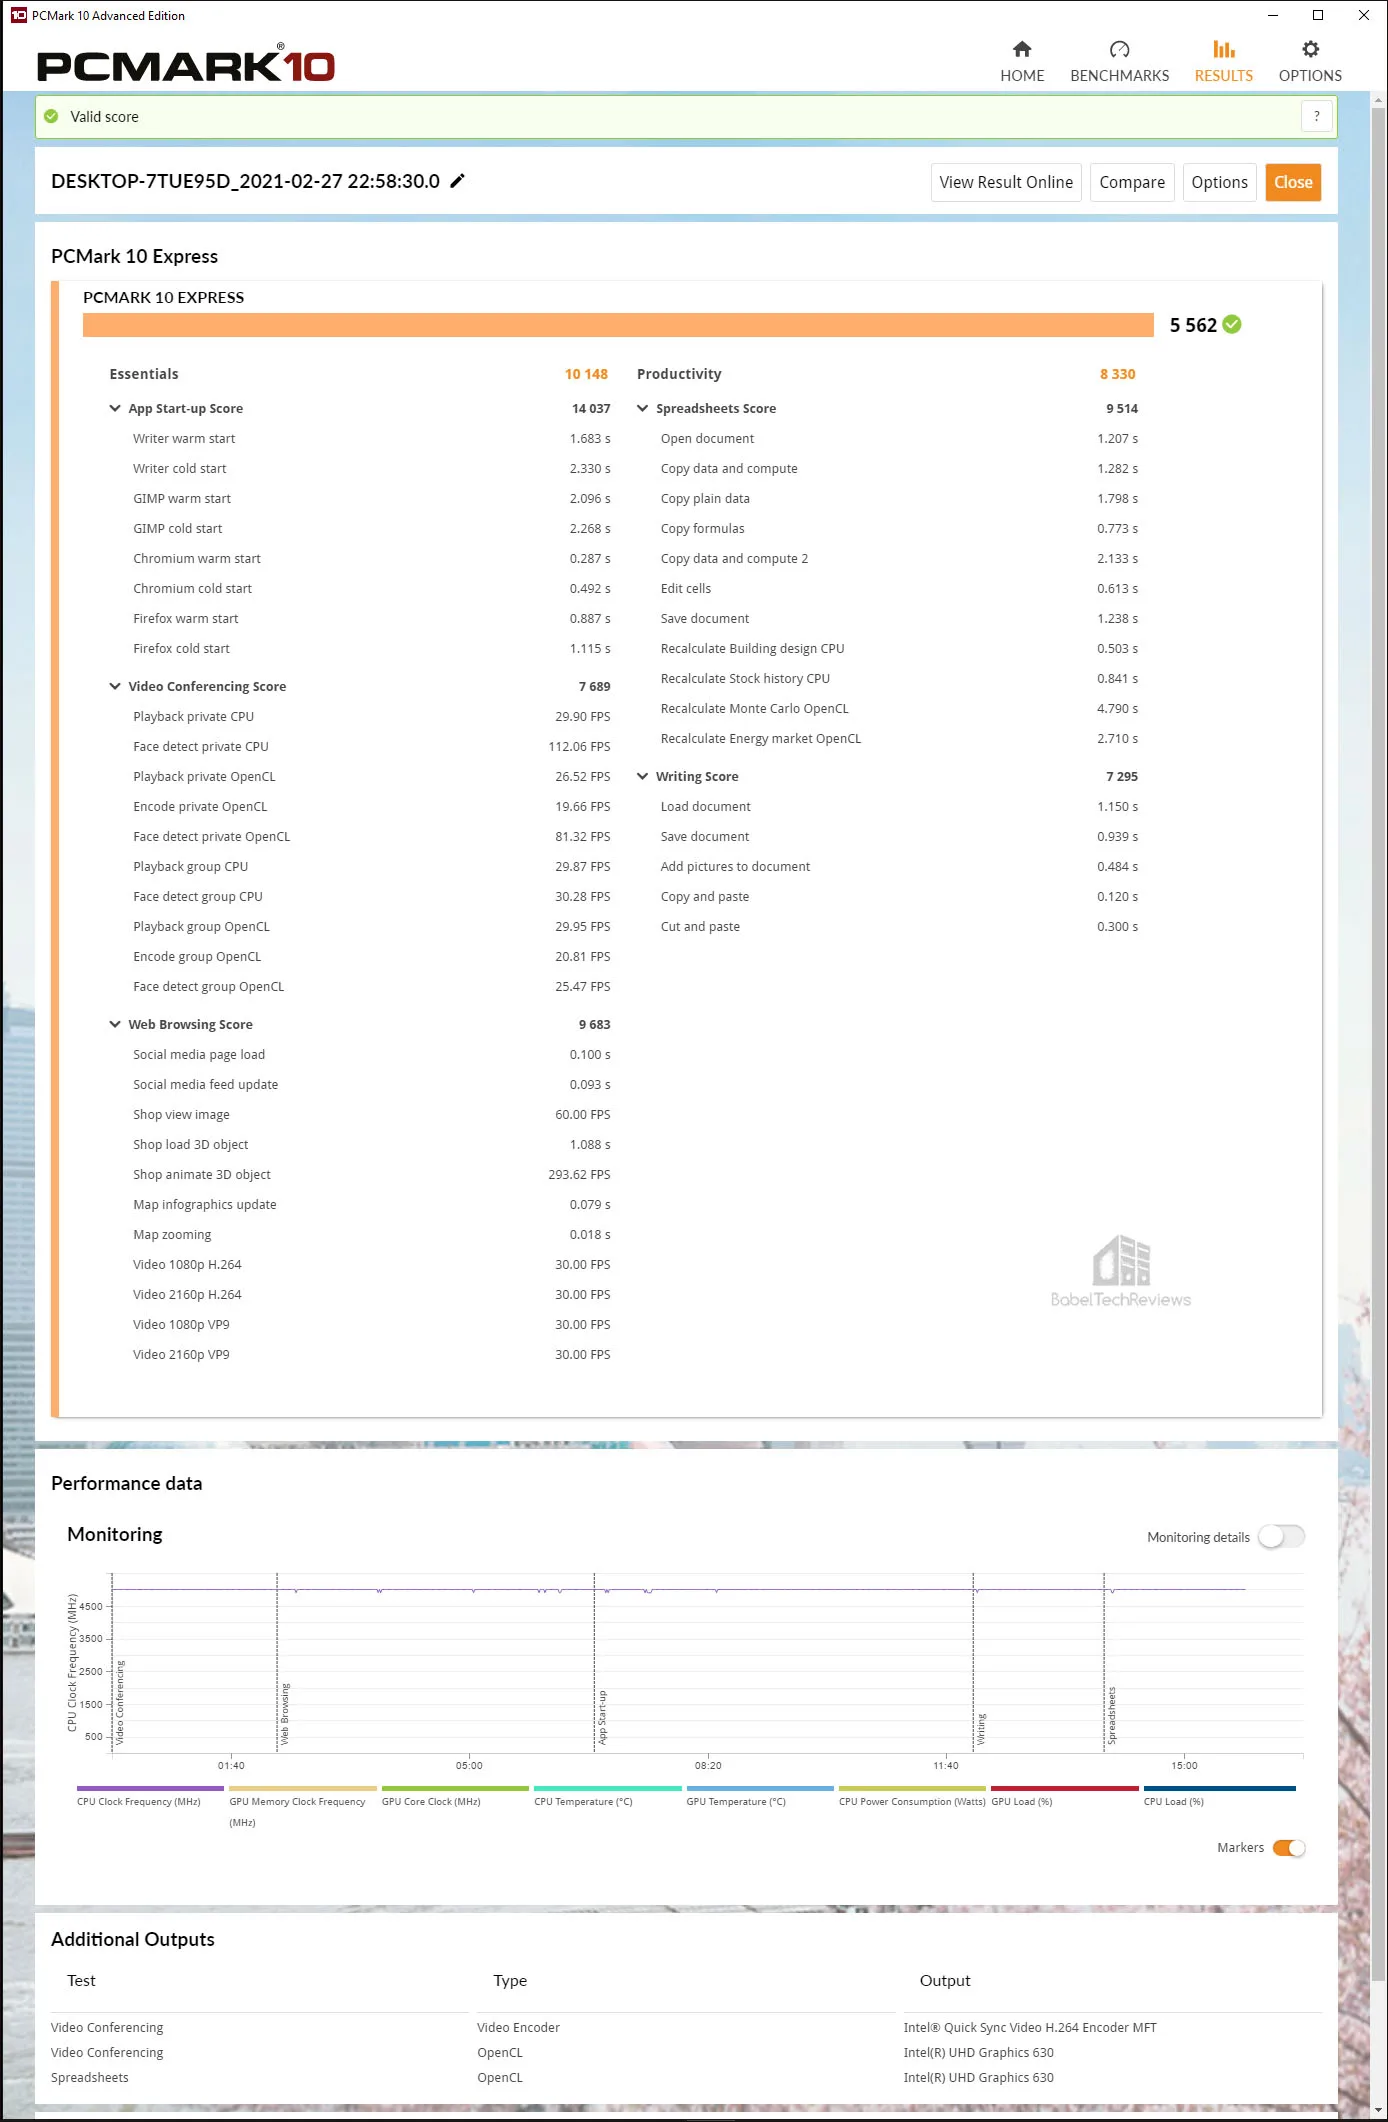
Extended benchmarks
First up is the EX2 Elite SATA III Extended score with 3733.
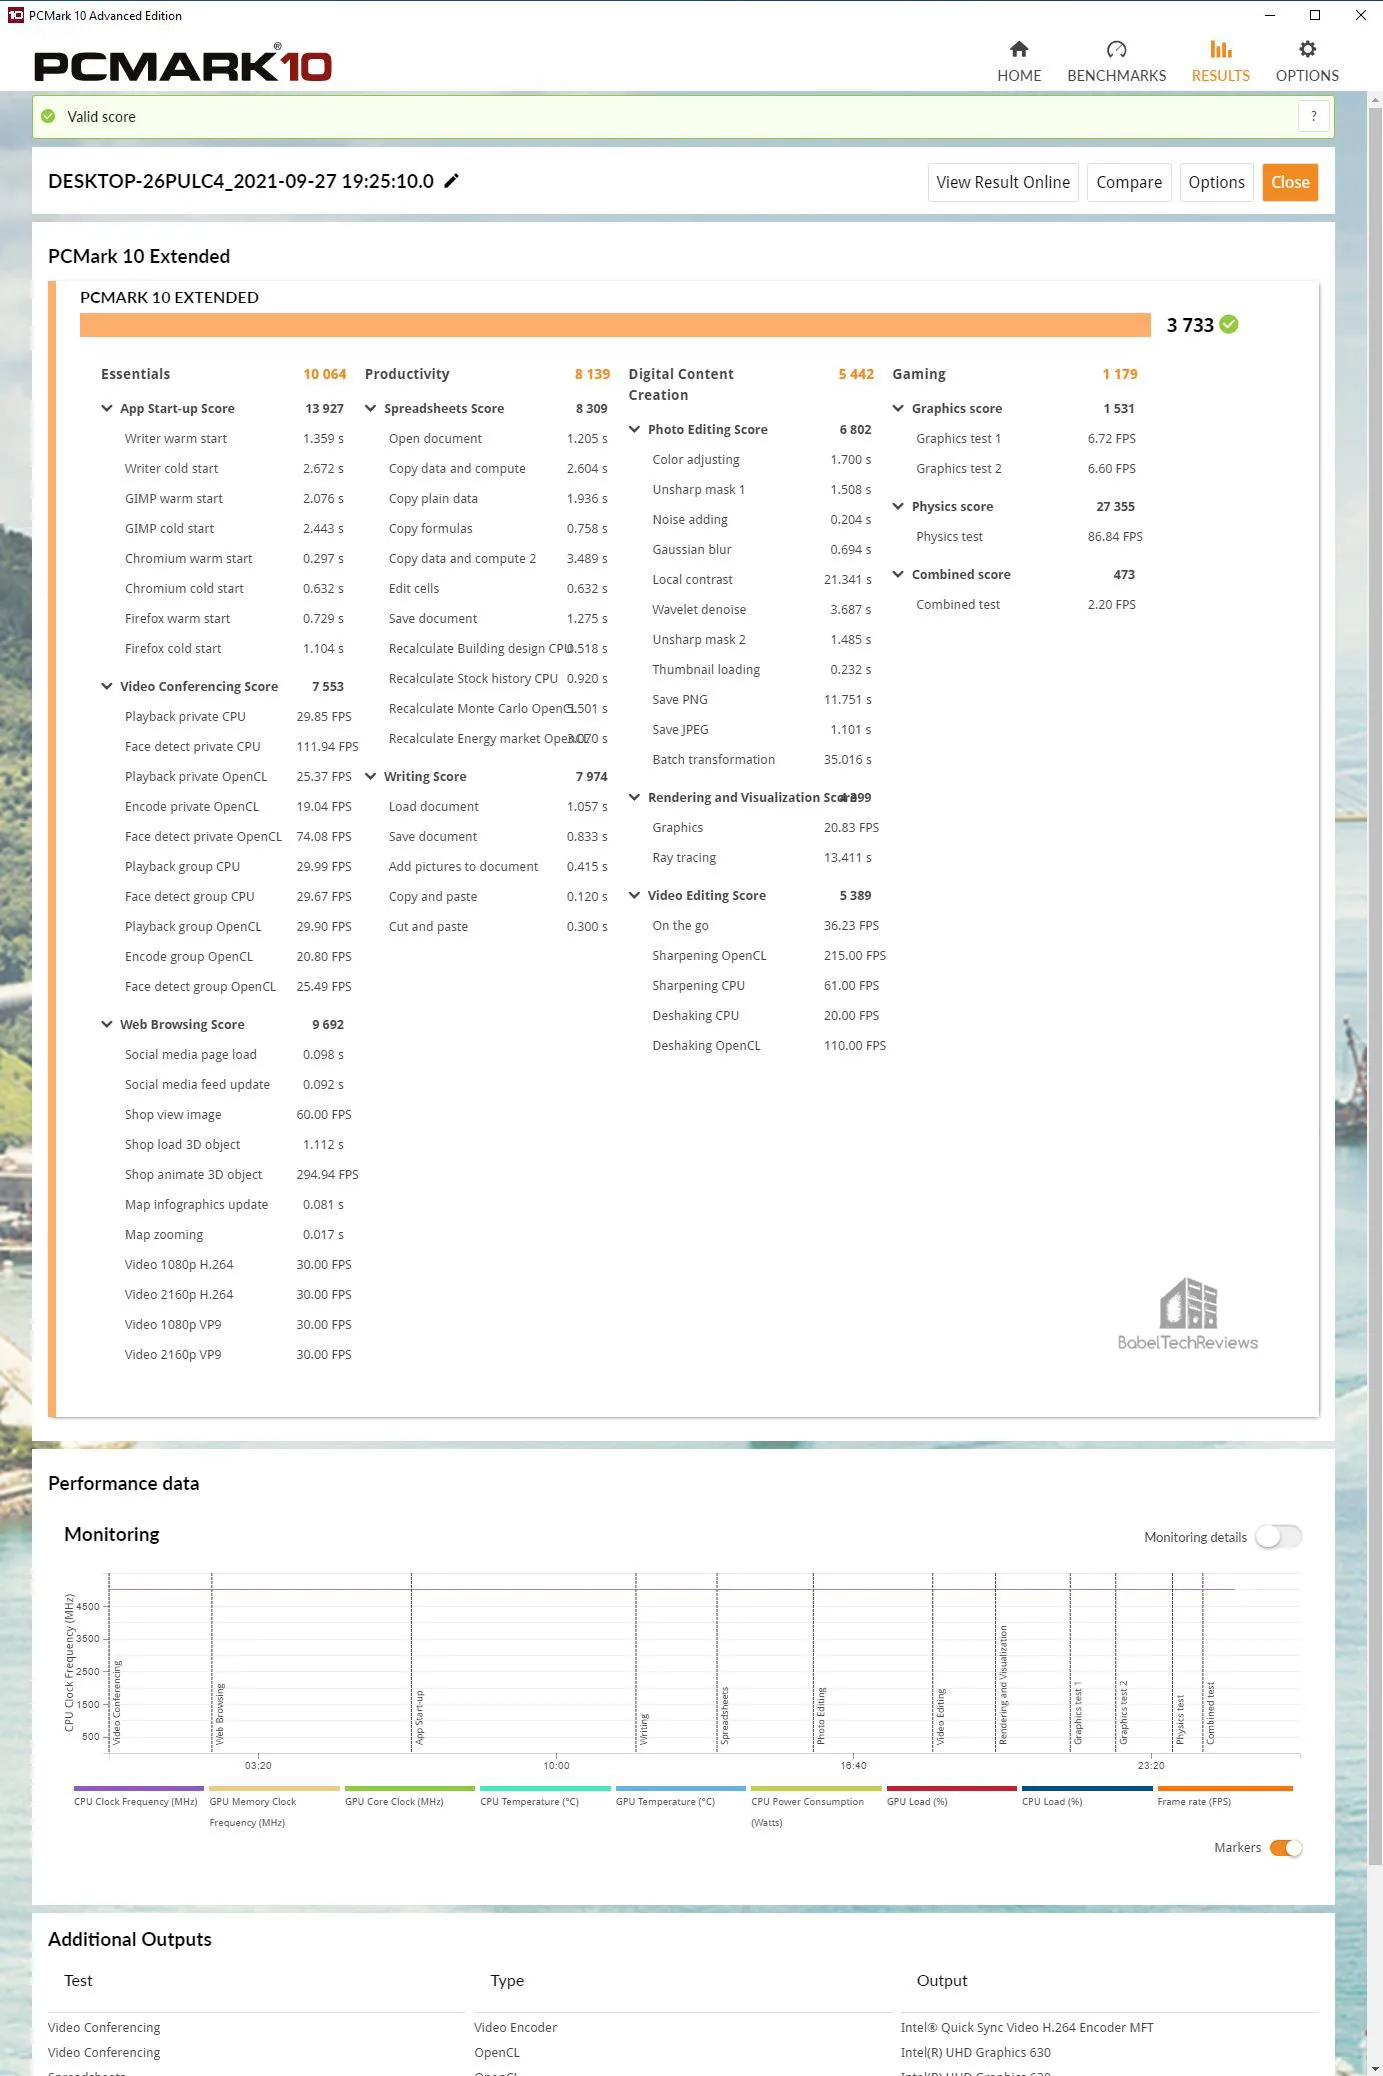
Next, the T-FORCE DELTA MAX White SATA III Extended score with 3530. 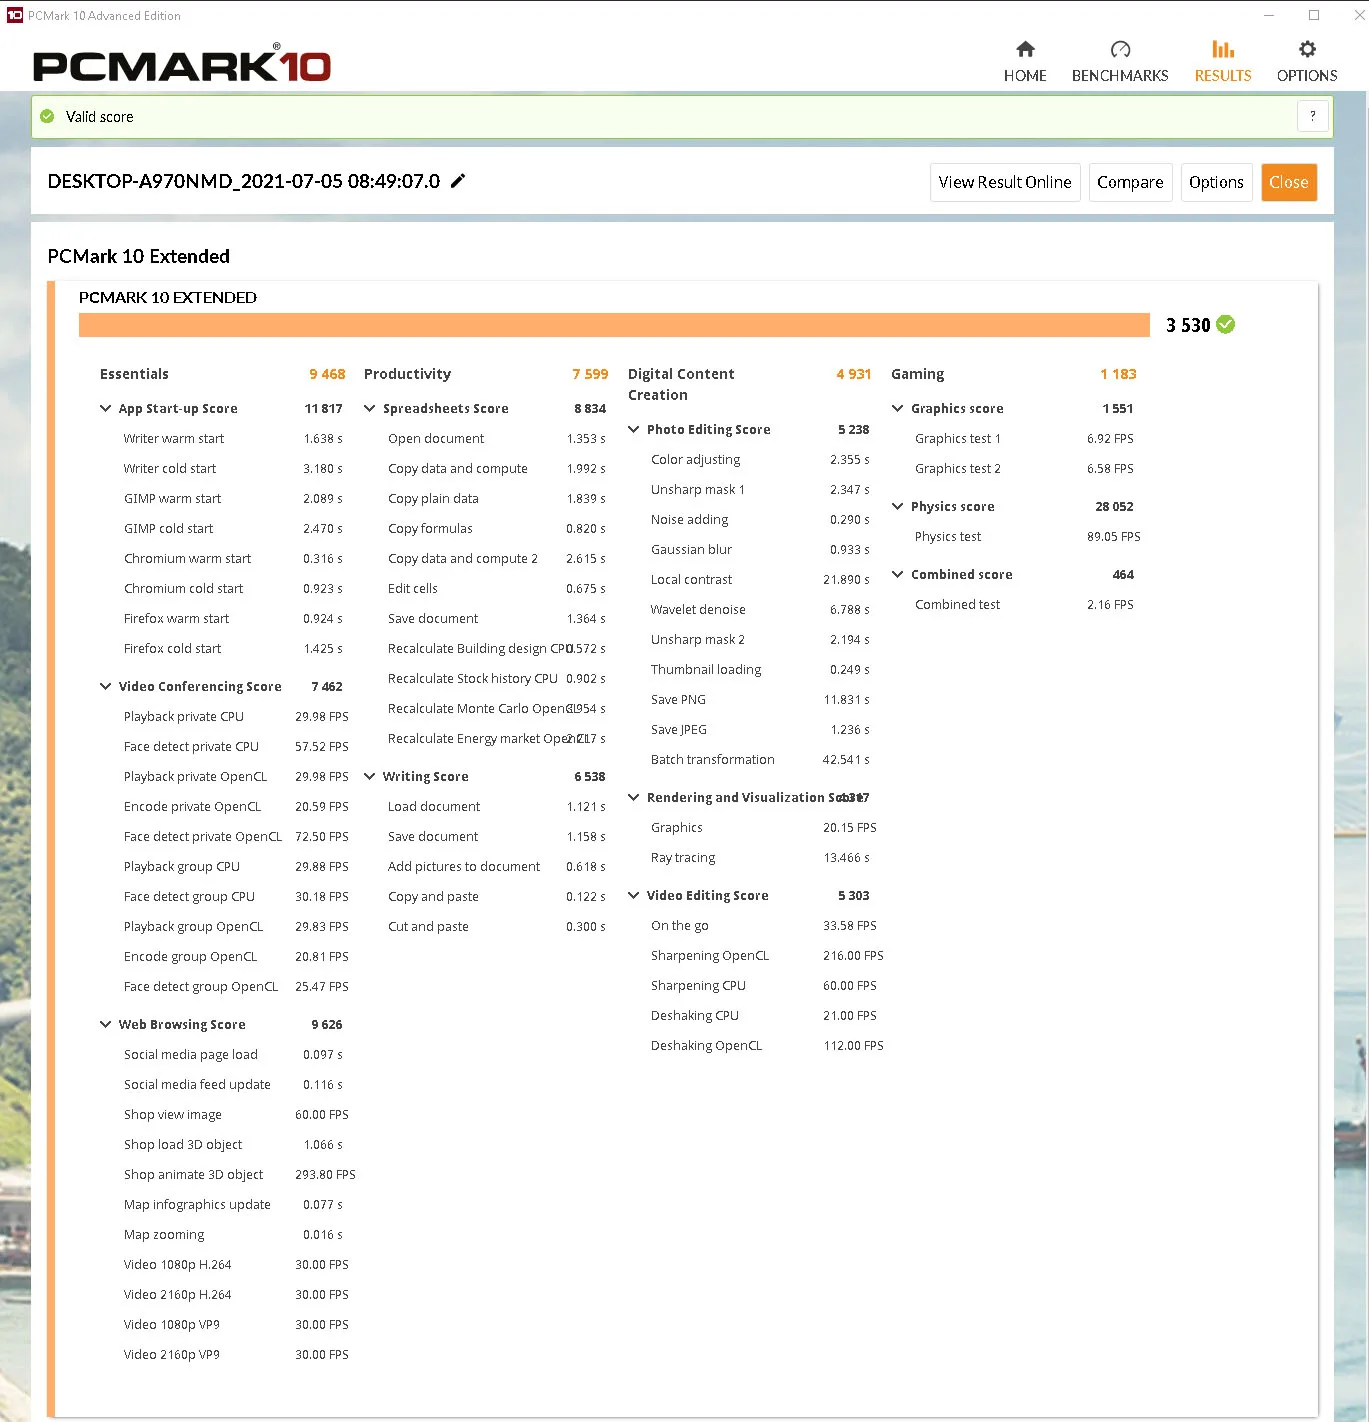 Again, we did not test the Vulcan SSD, so the Team Group MP33 M.2 PCIe 1TB SSD is next with 3699 on the Extended benchmark.
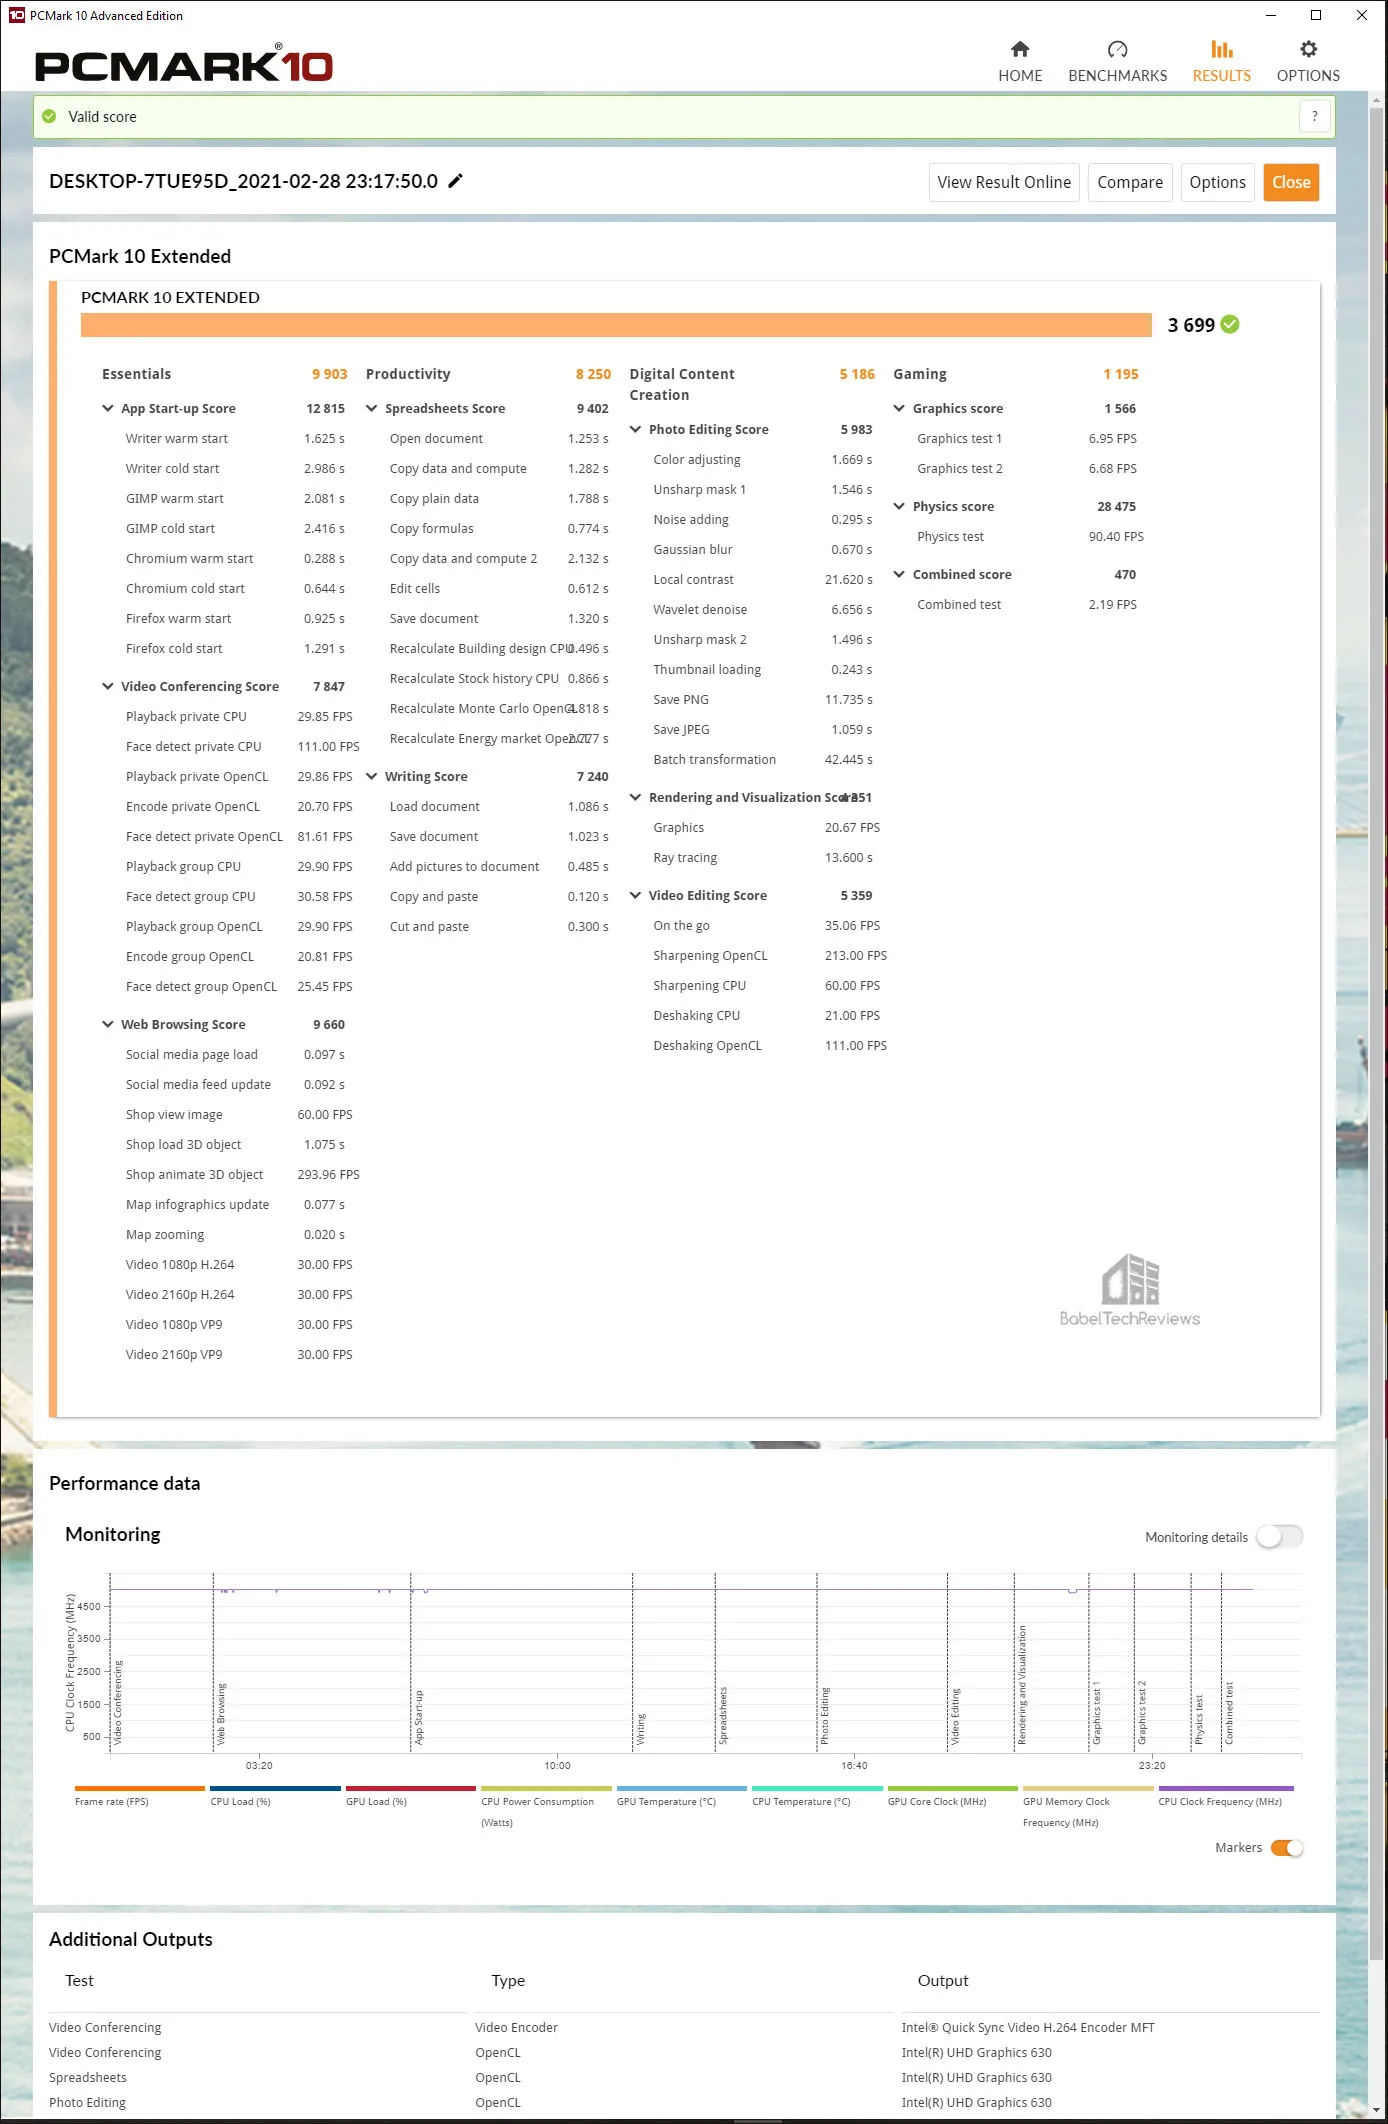 Here is the CARDEA Liquid Extended score with 3741.
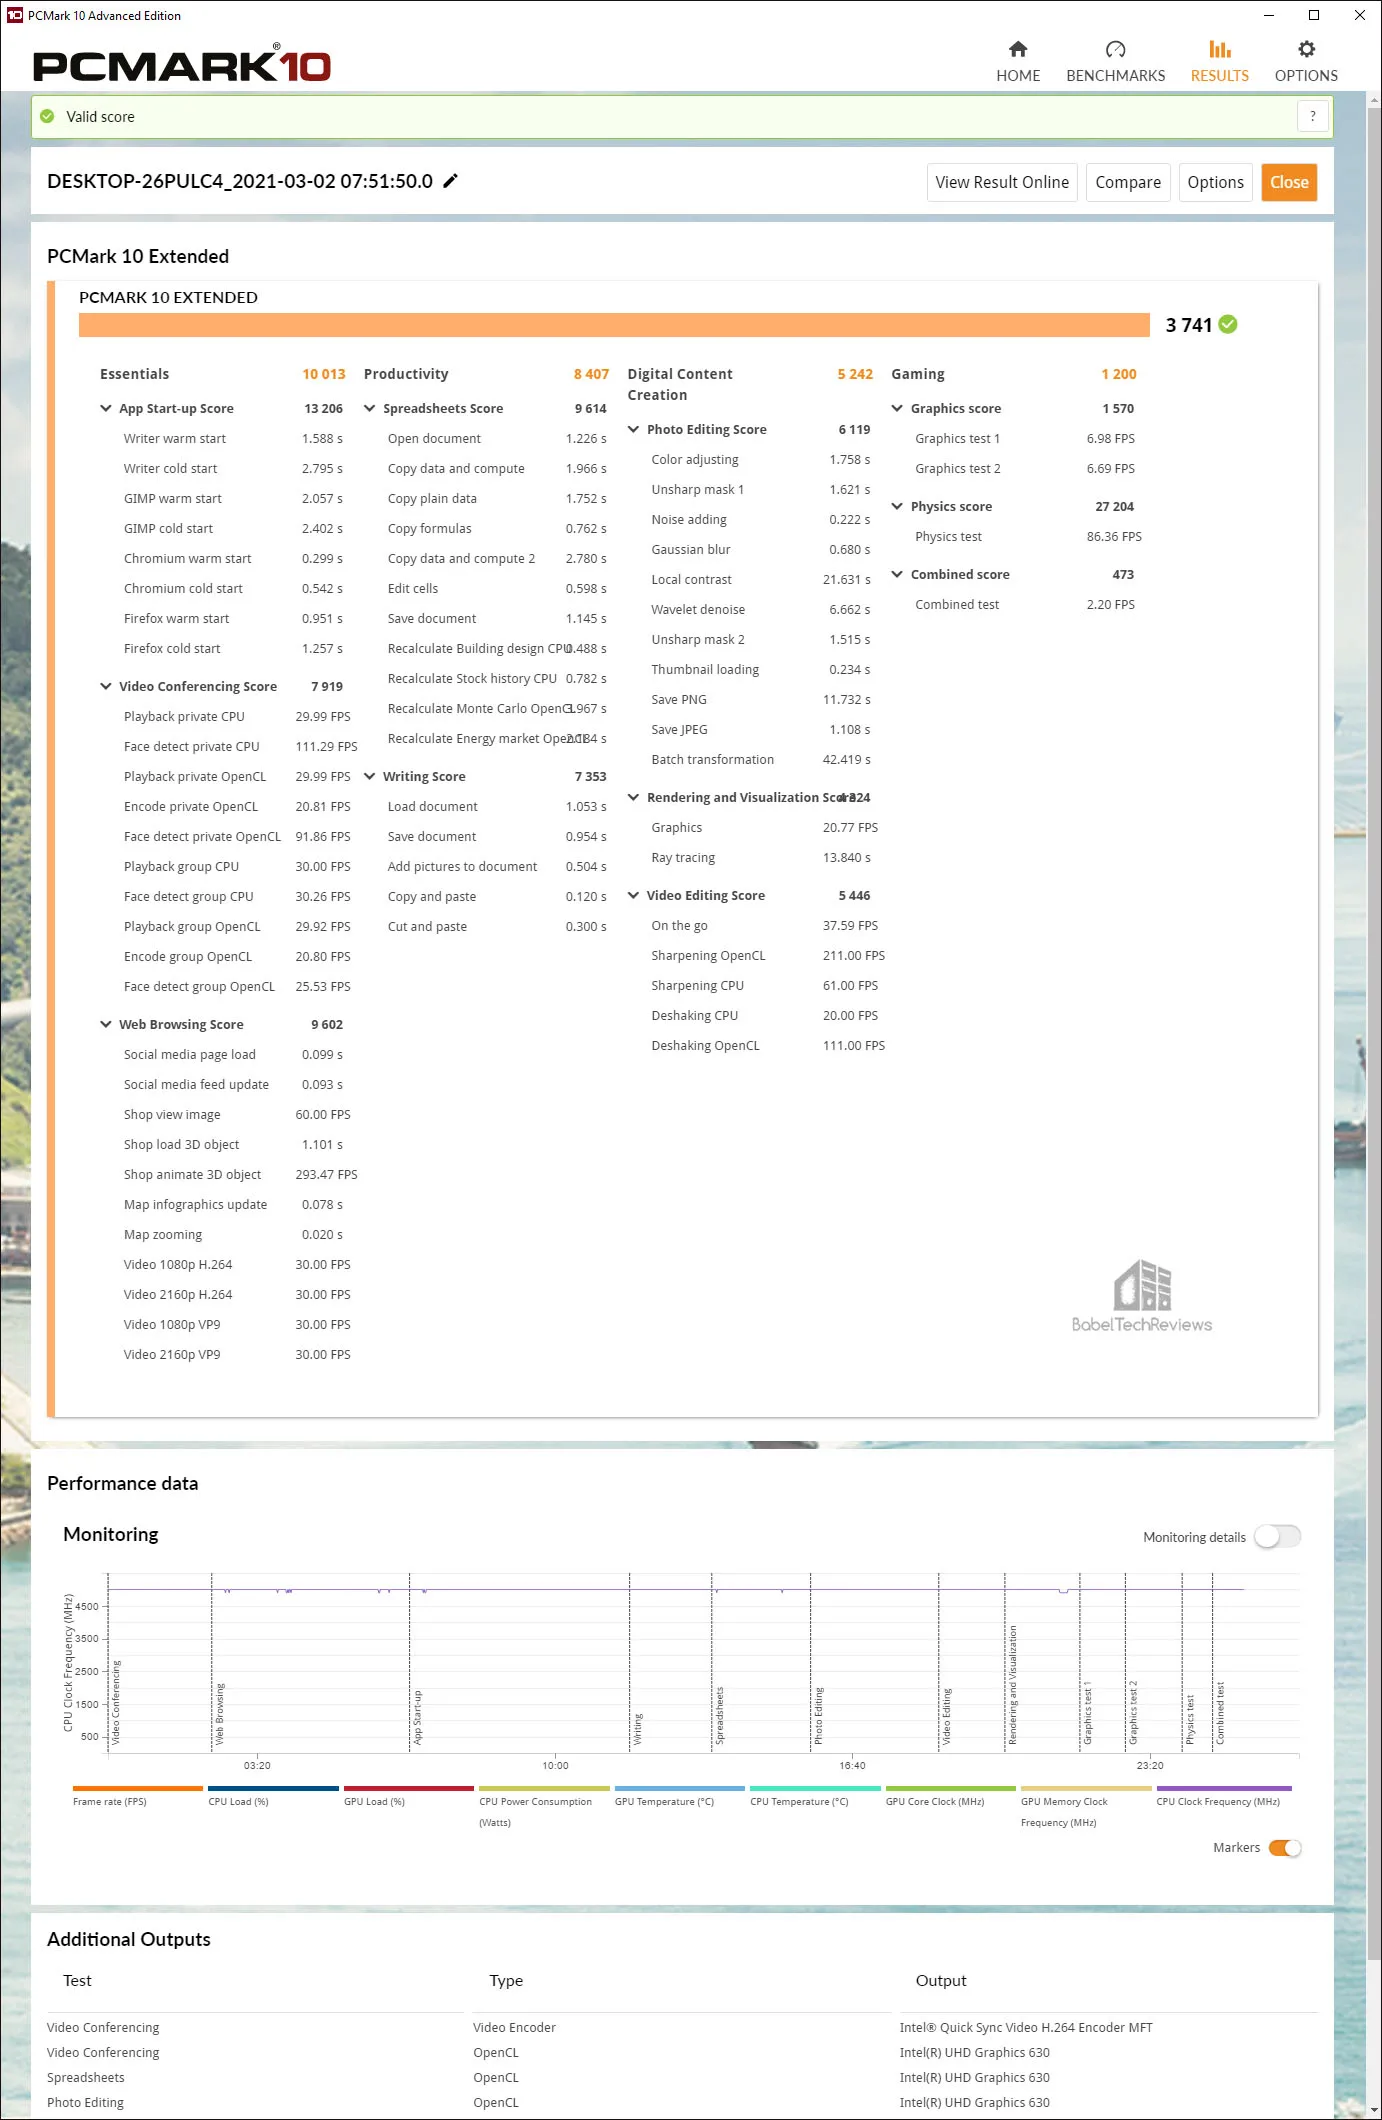 The CARDEA IOPS Extended scores 3725.
 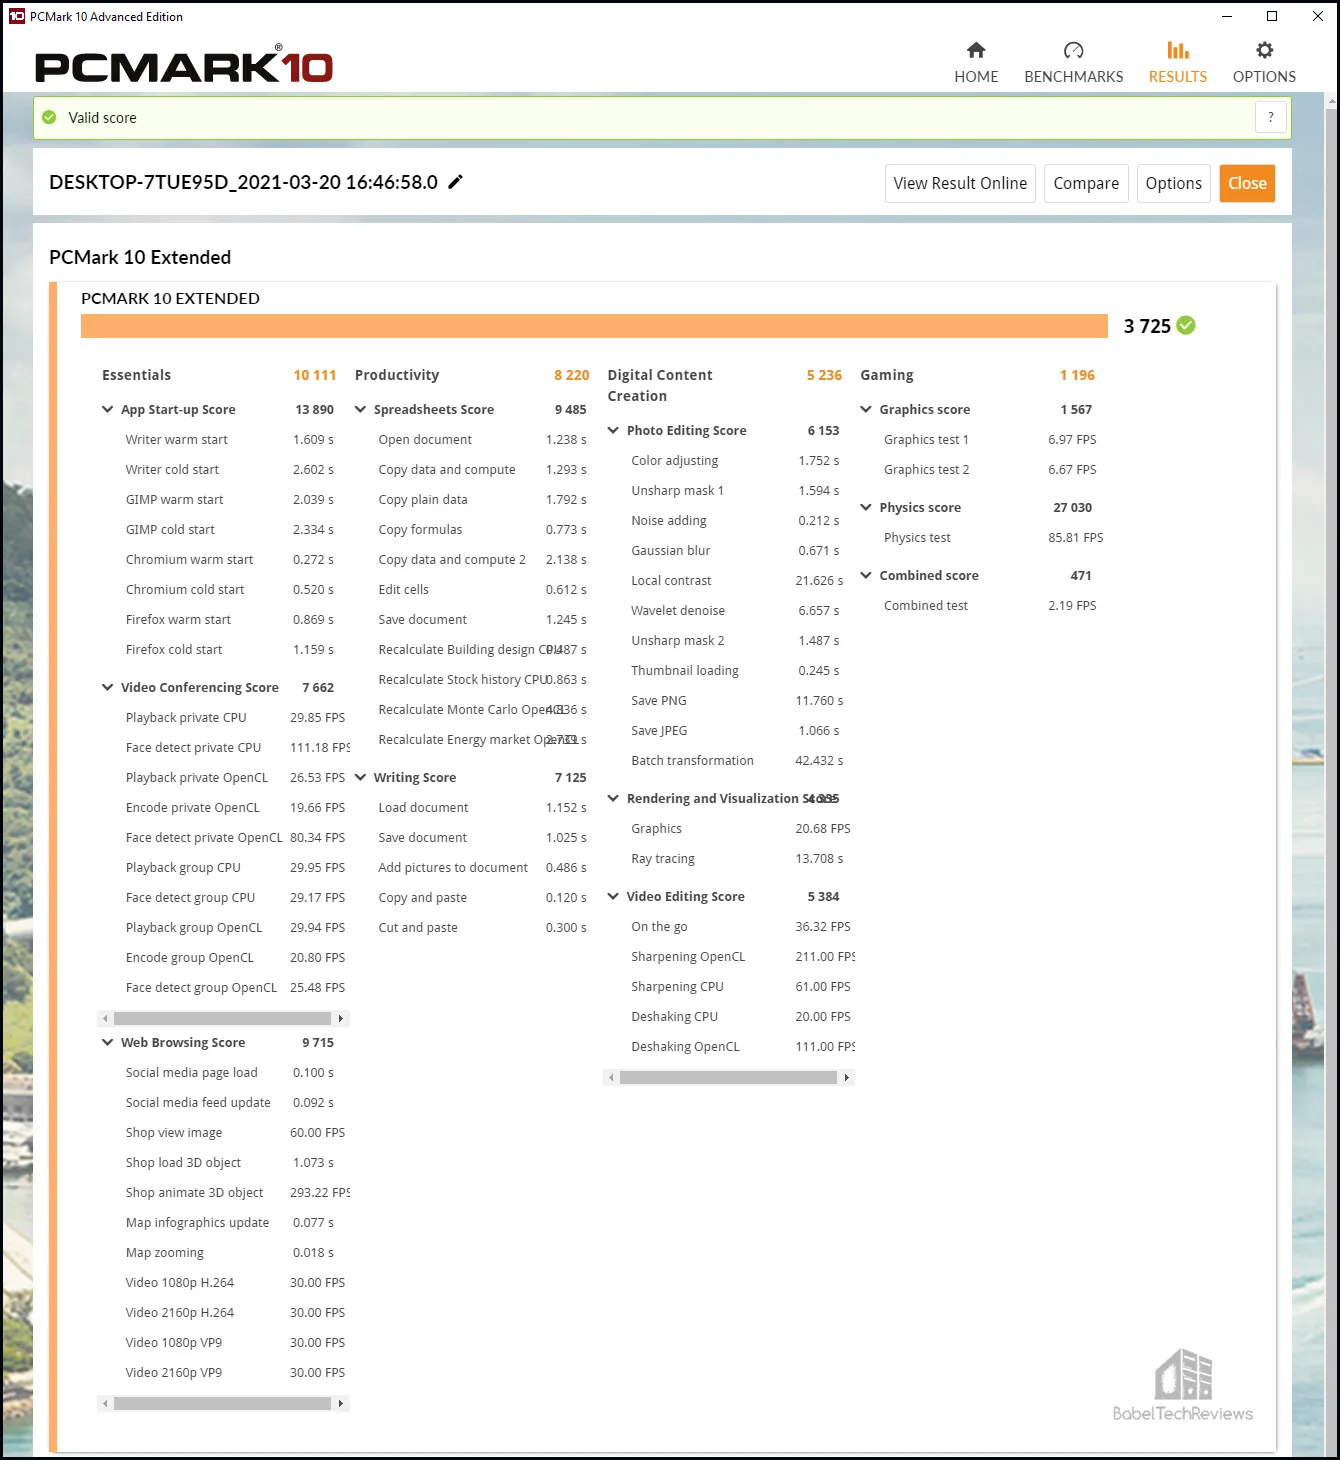 Finally, the CARDEA Ceramic Extended scores 3758.
 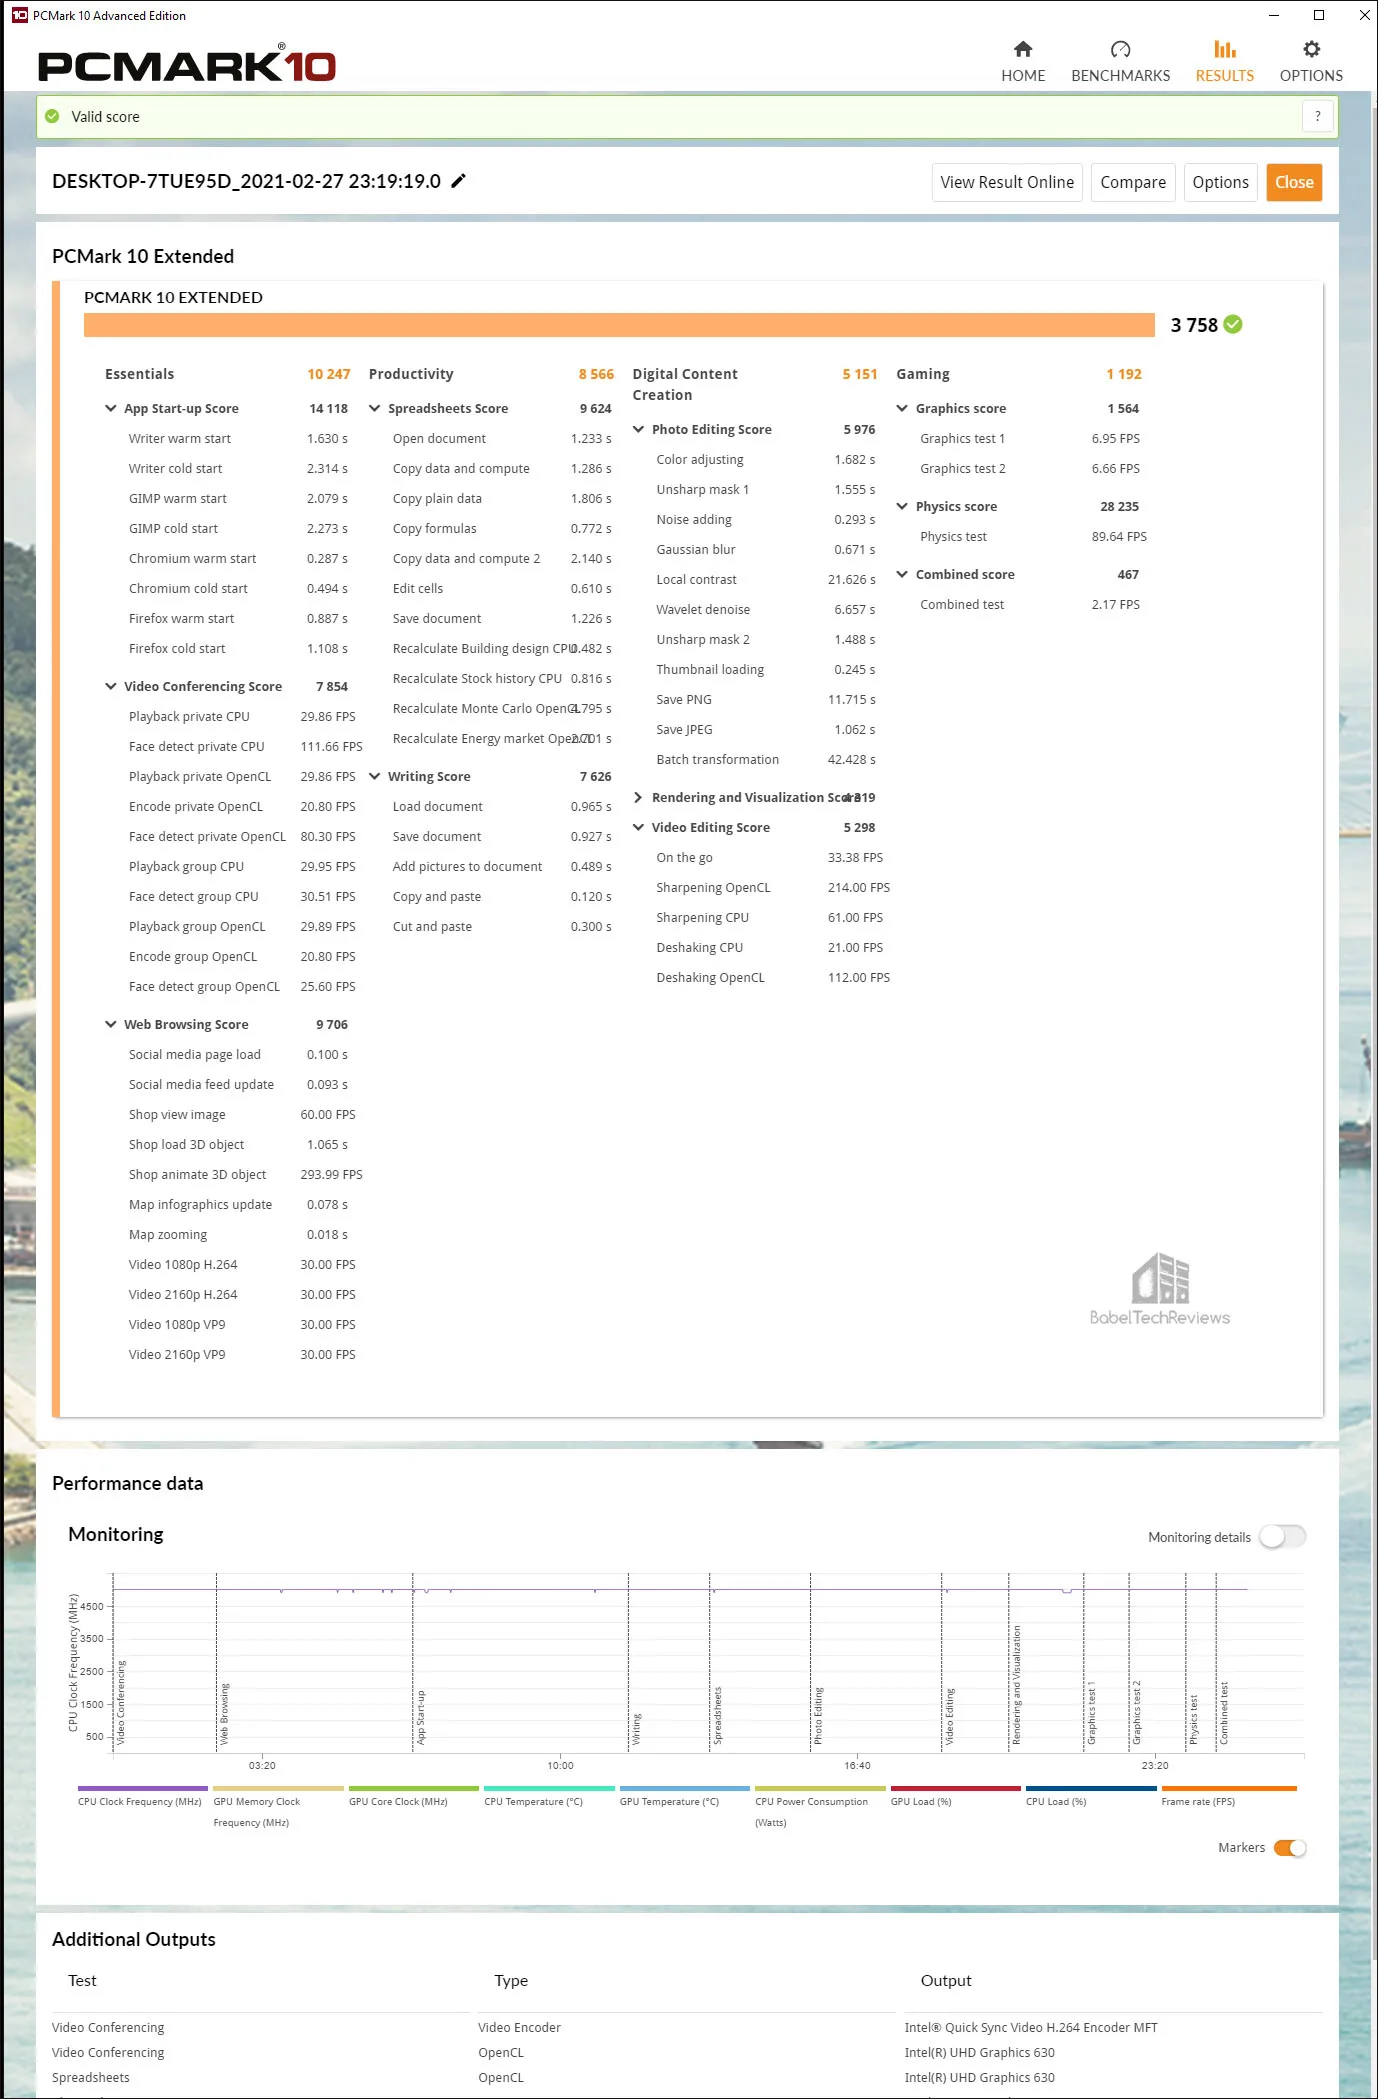 Here is the summary of the six drives that were tested.
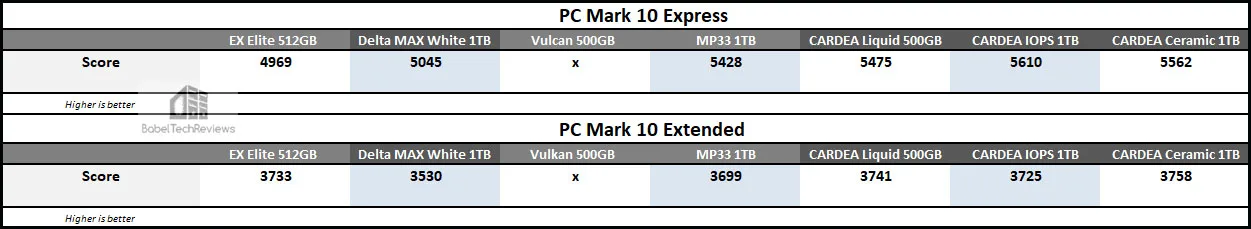
The EX2 Elite beats the DELTA MAX in the Extended benches as well as the entry-level MP33 PCIe NVMe SSD.
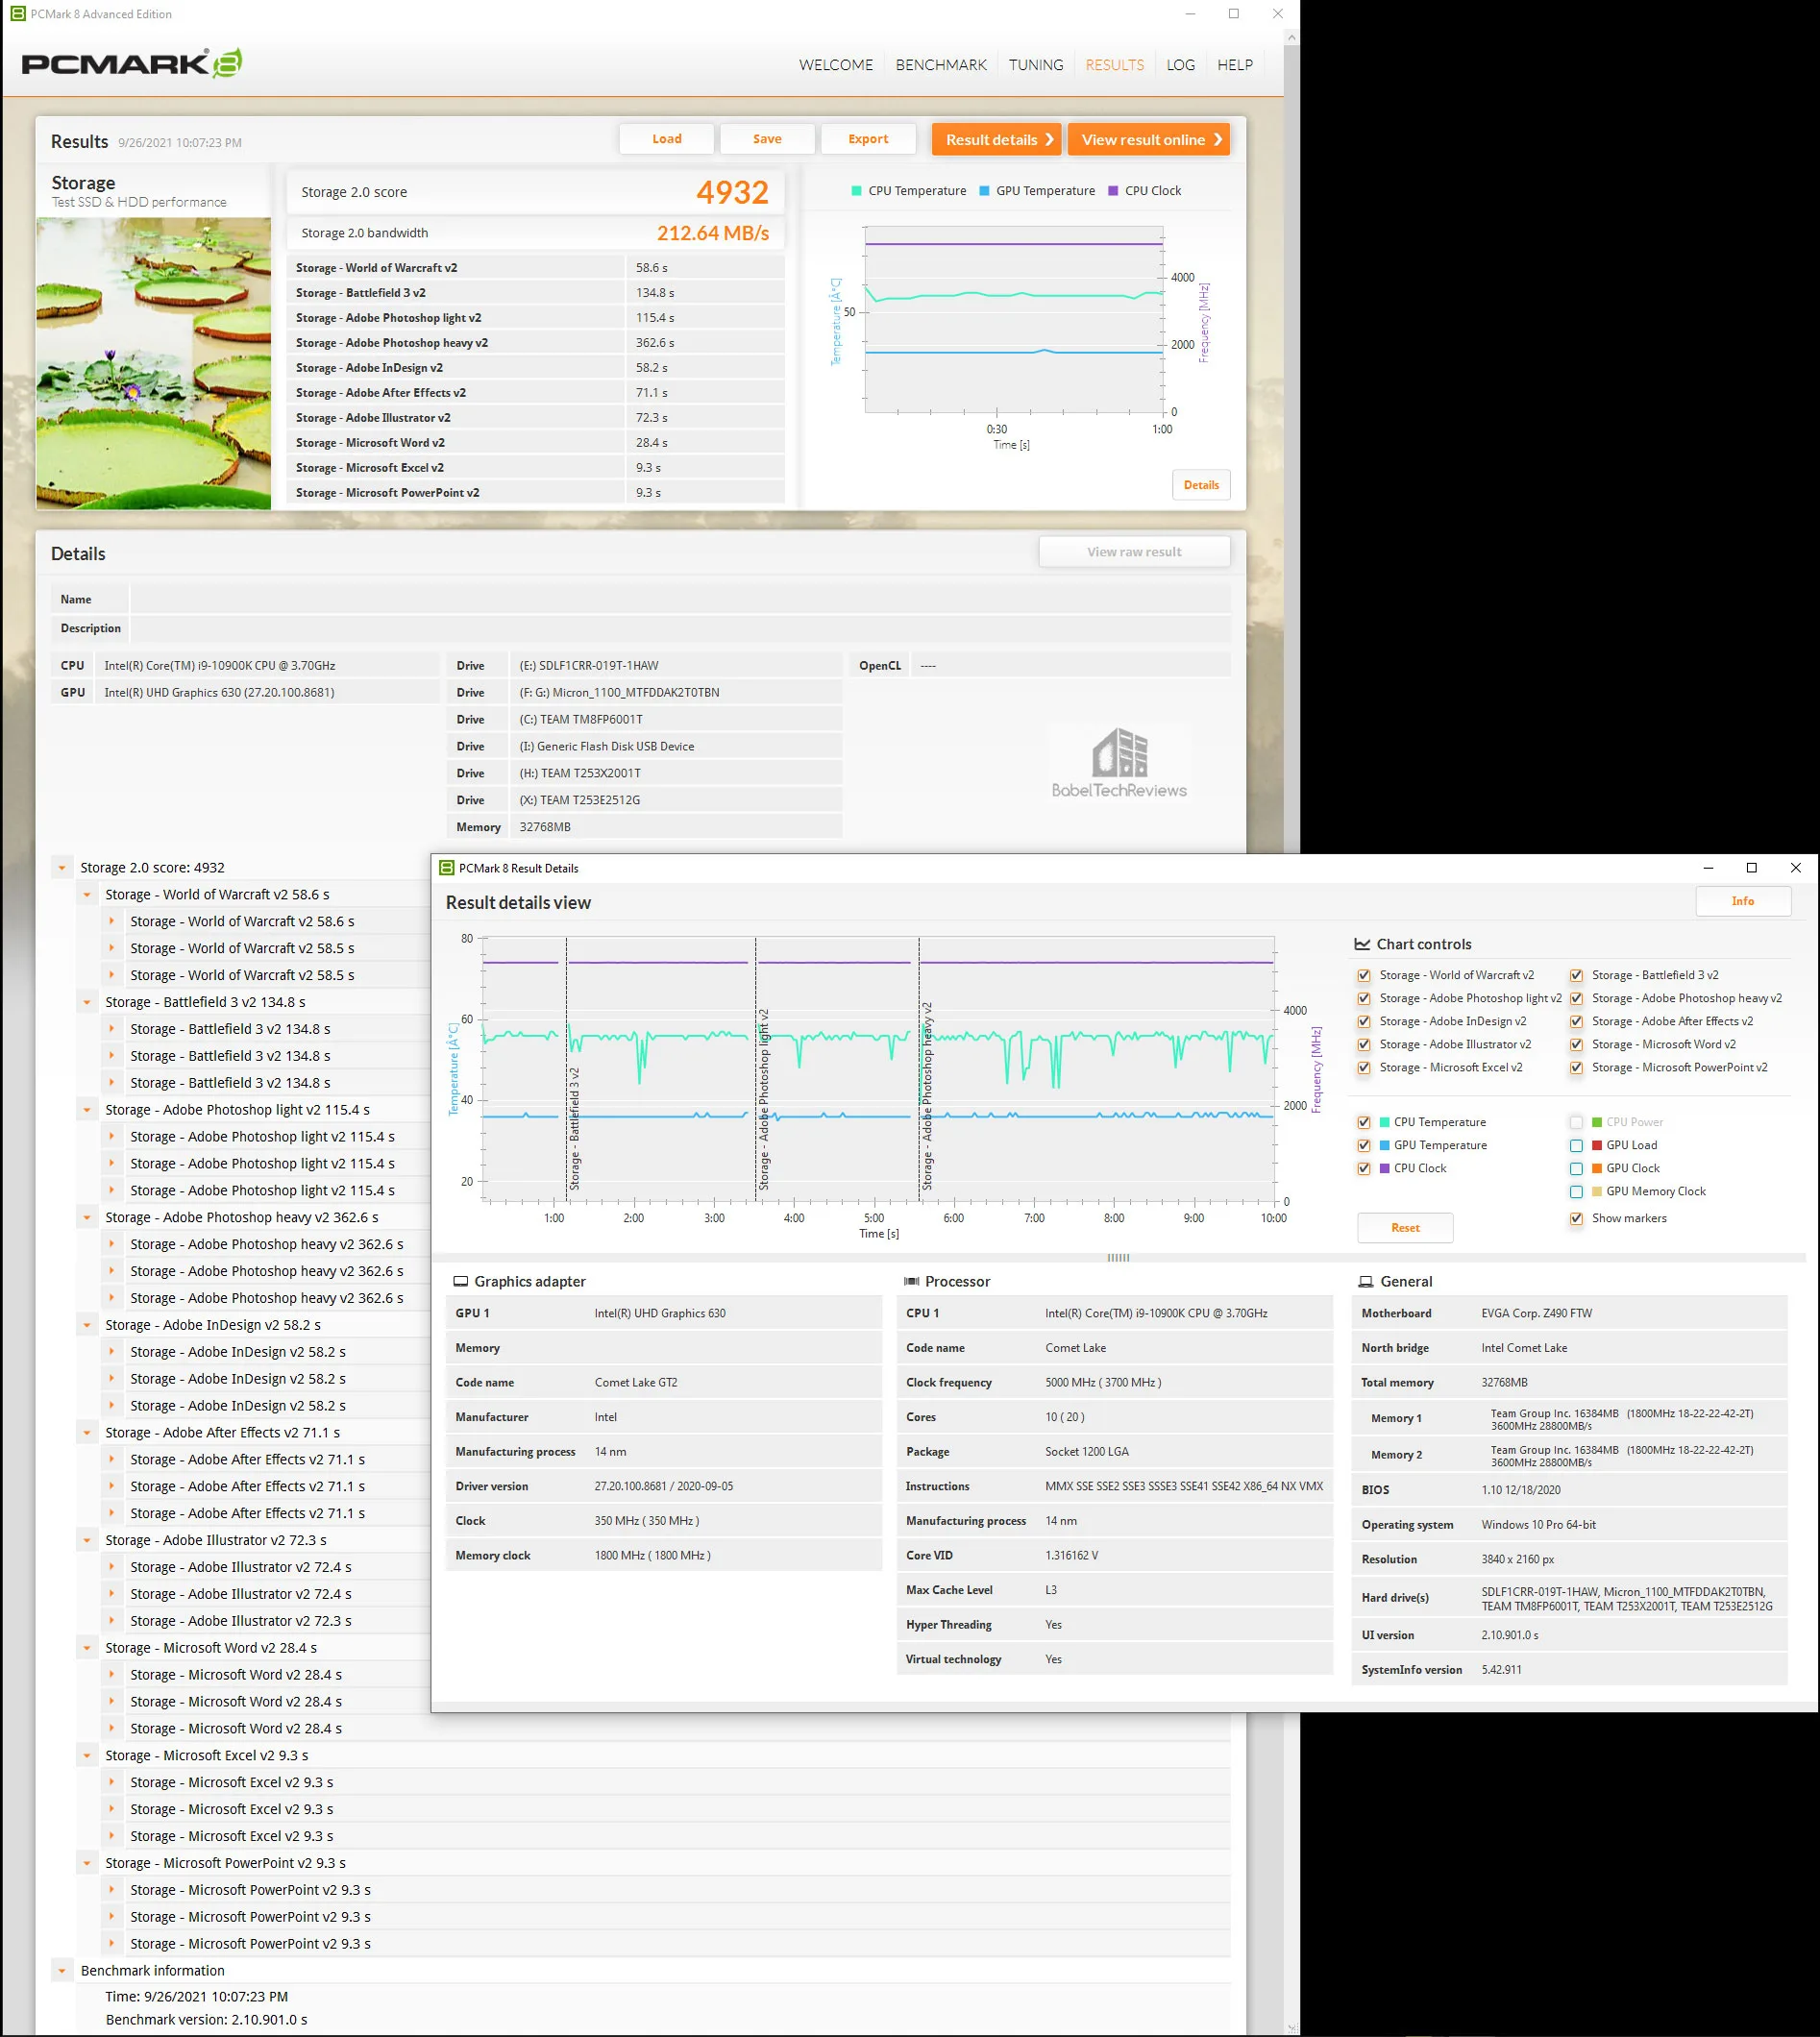
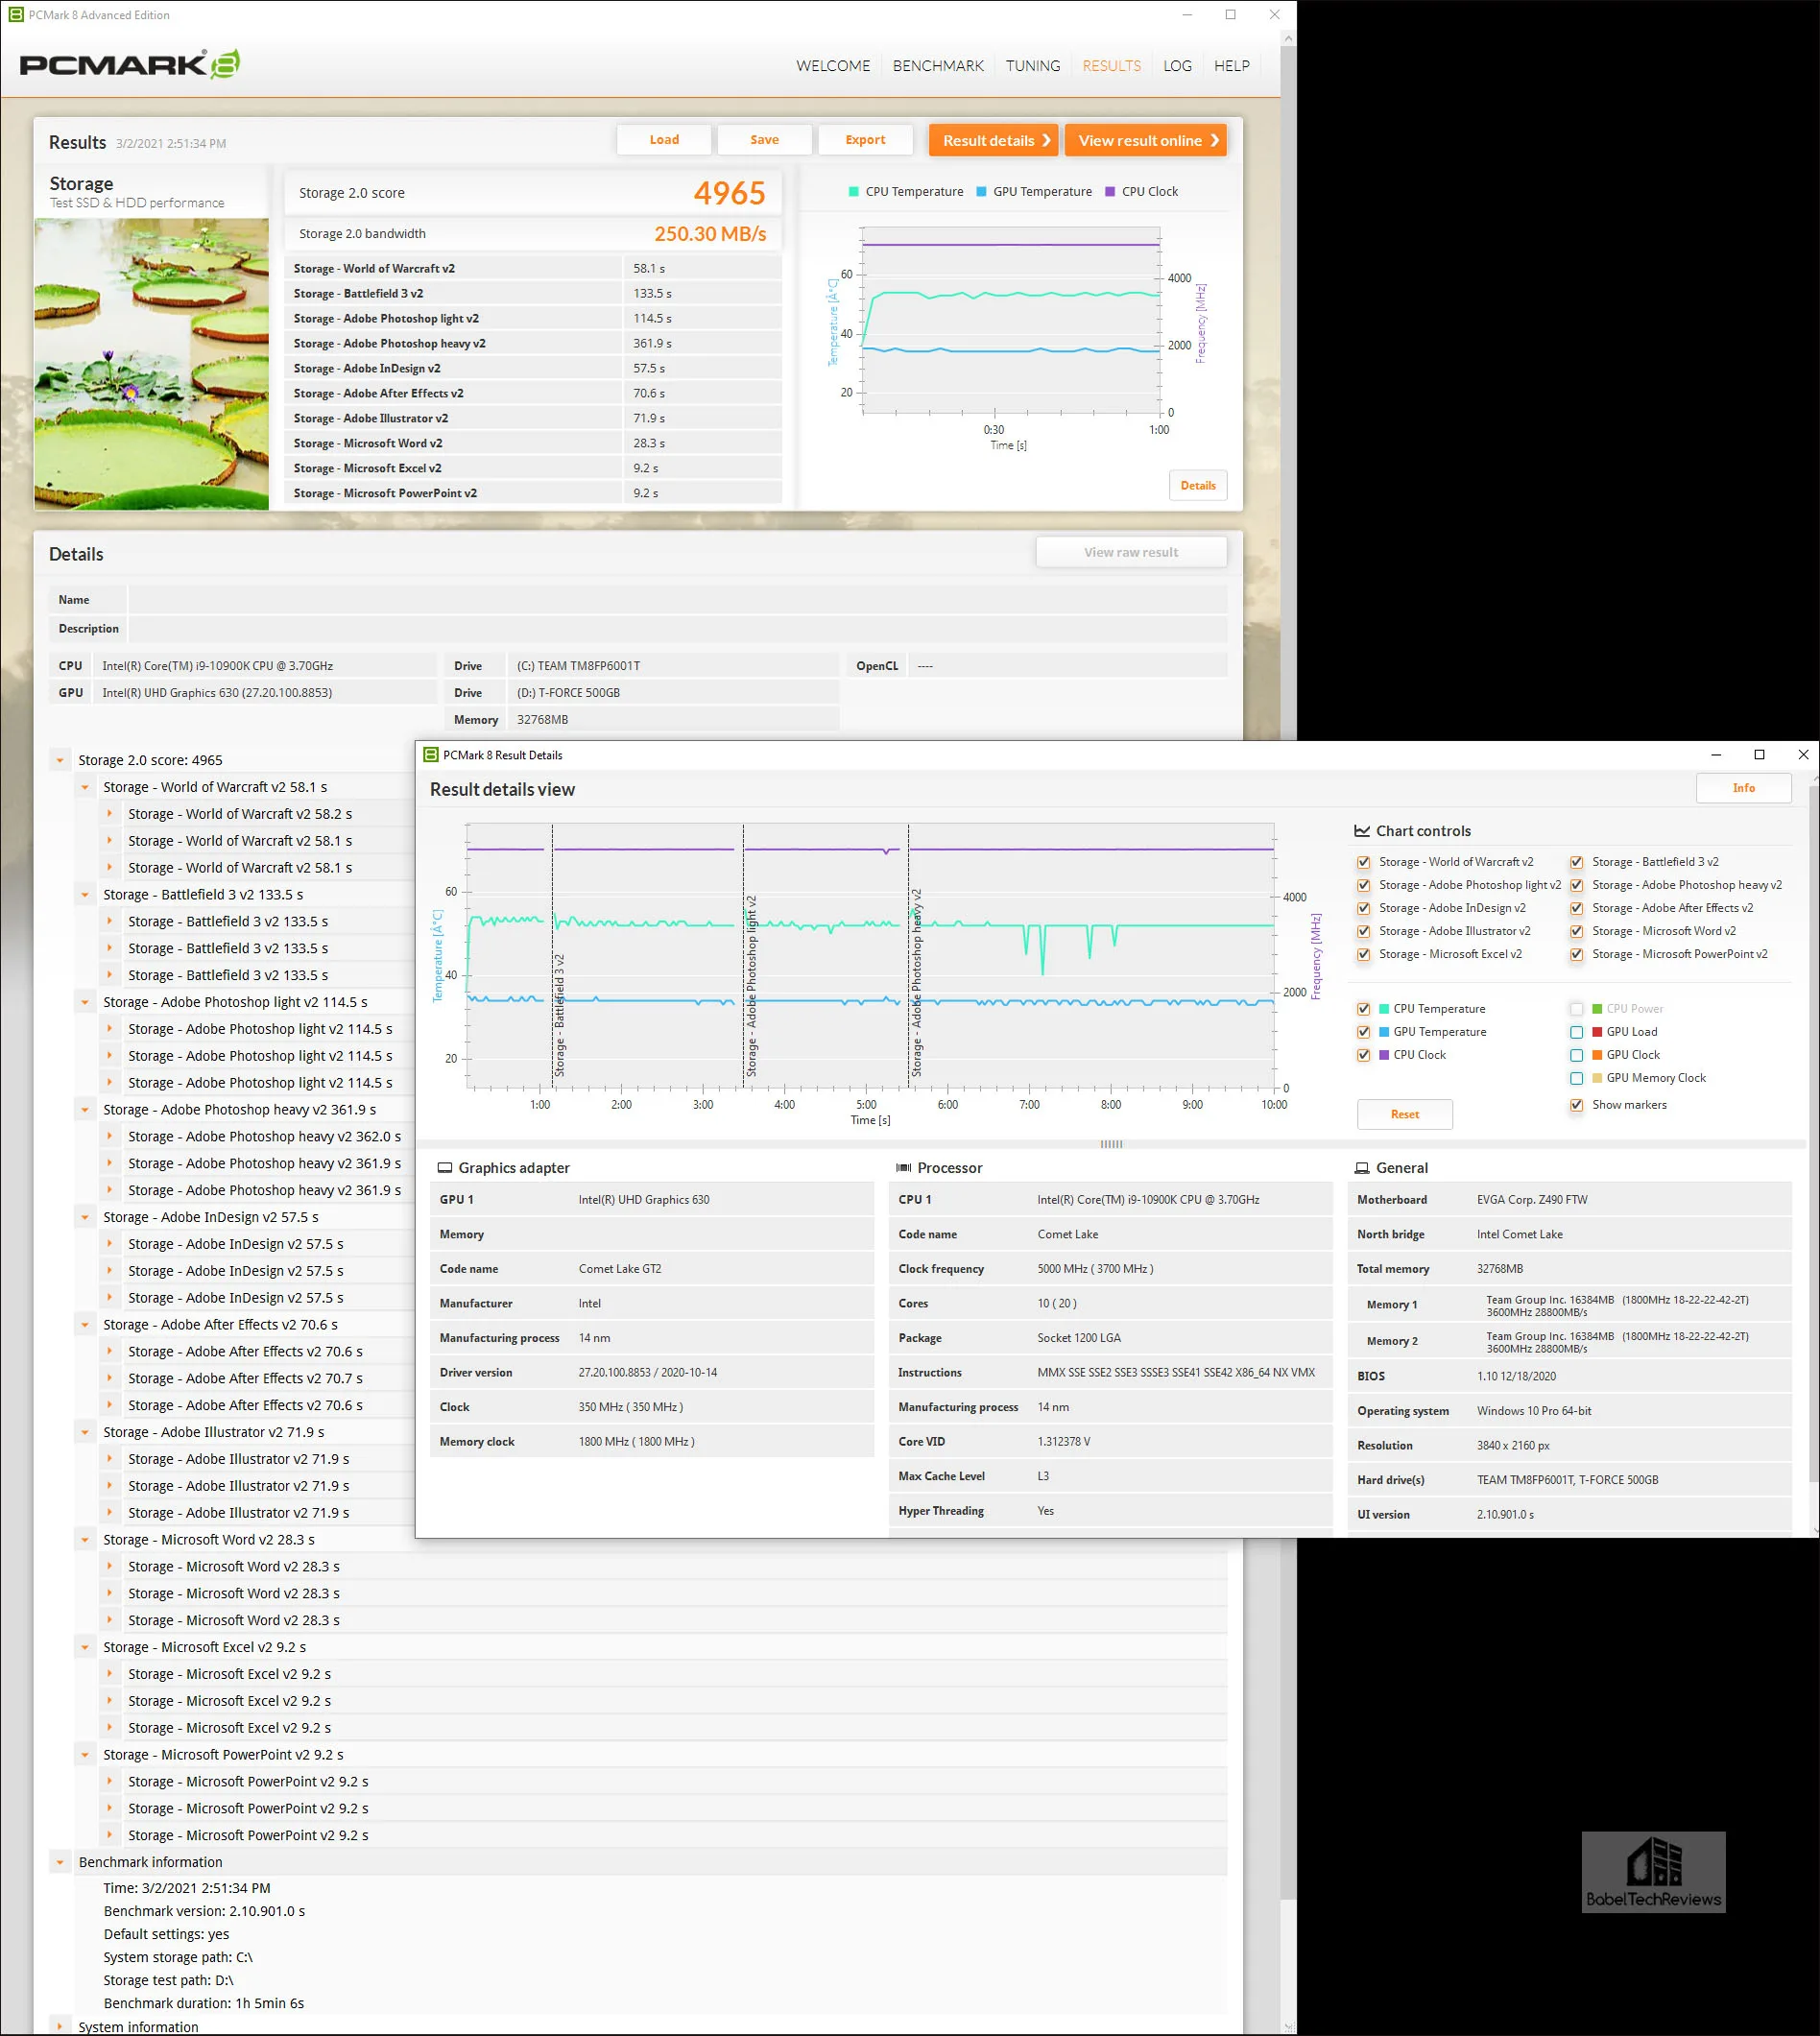
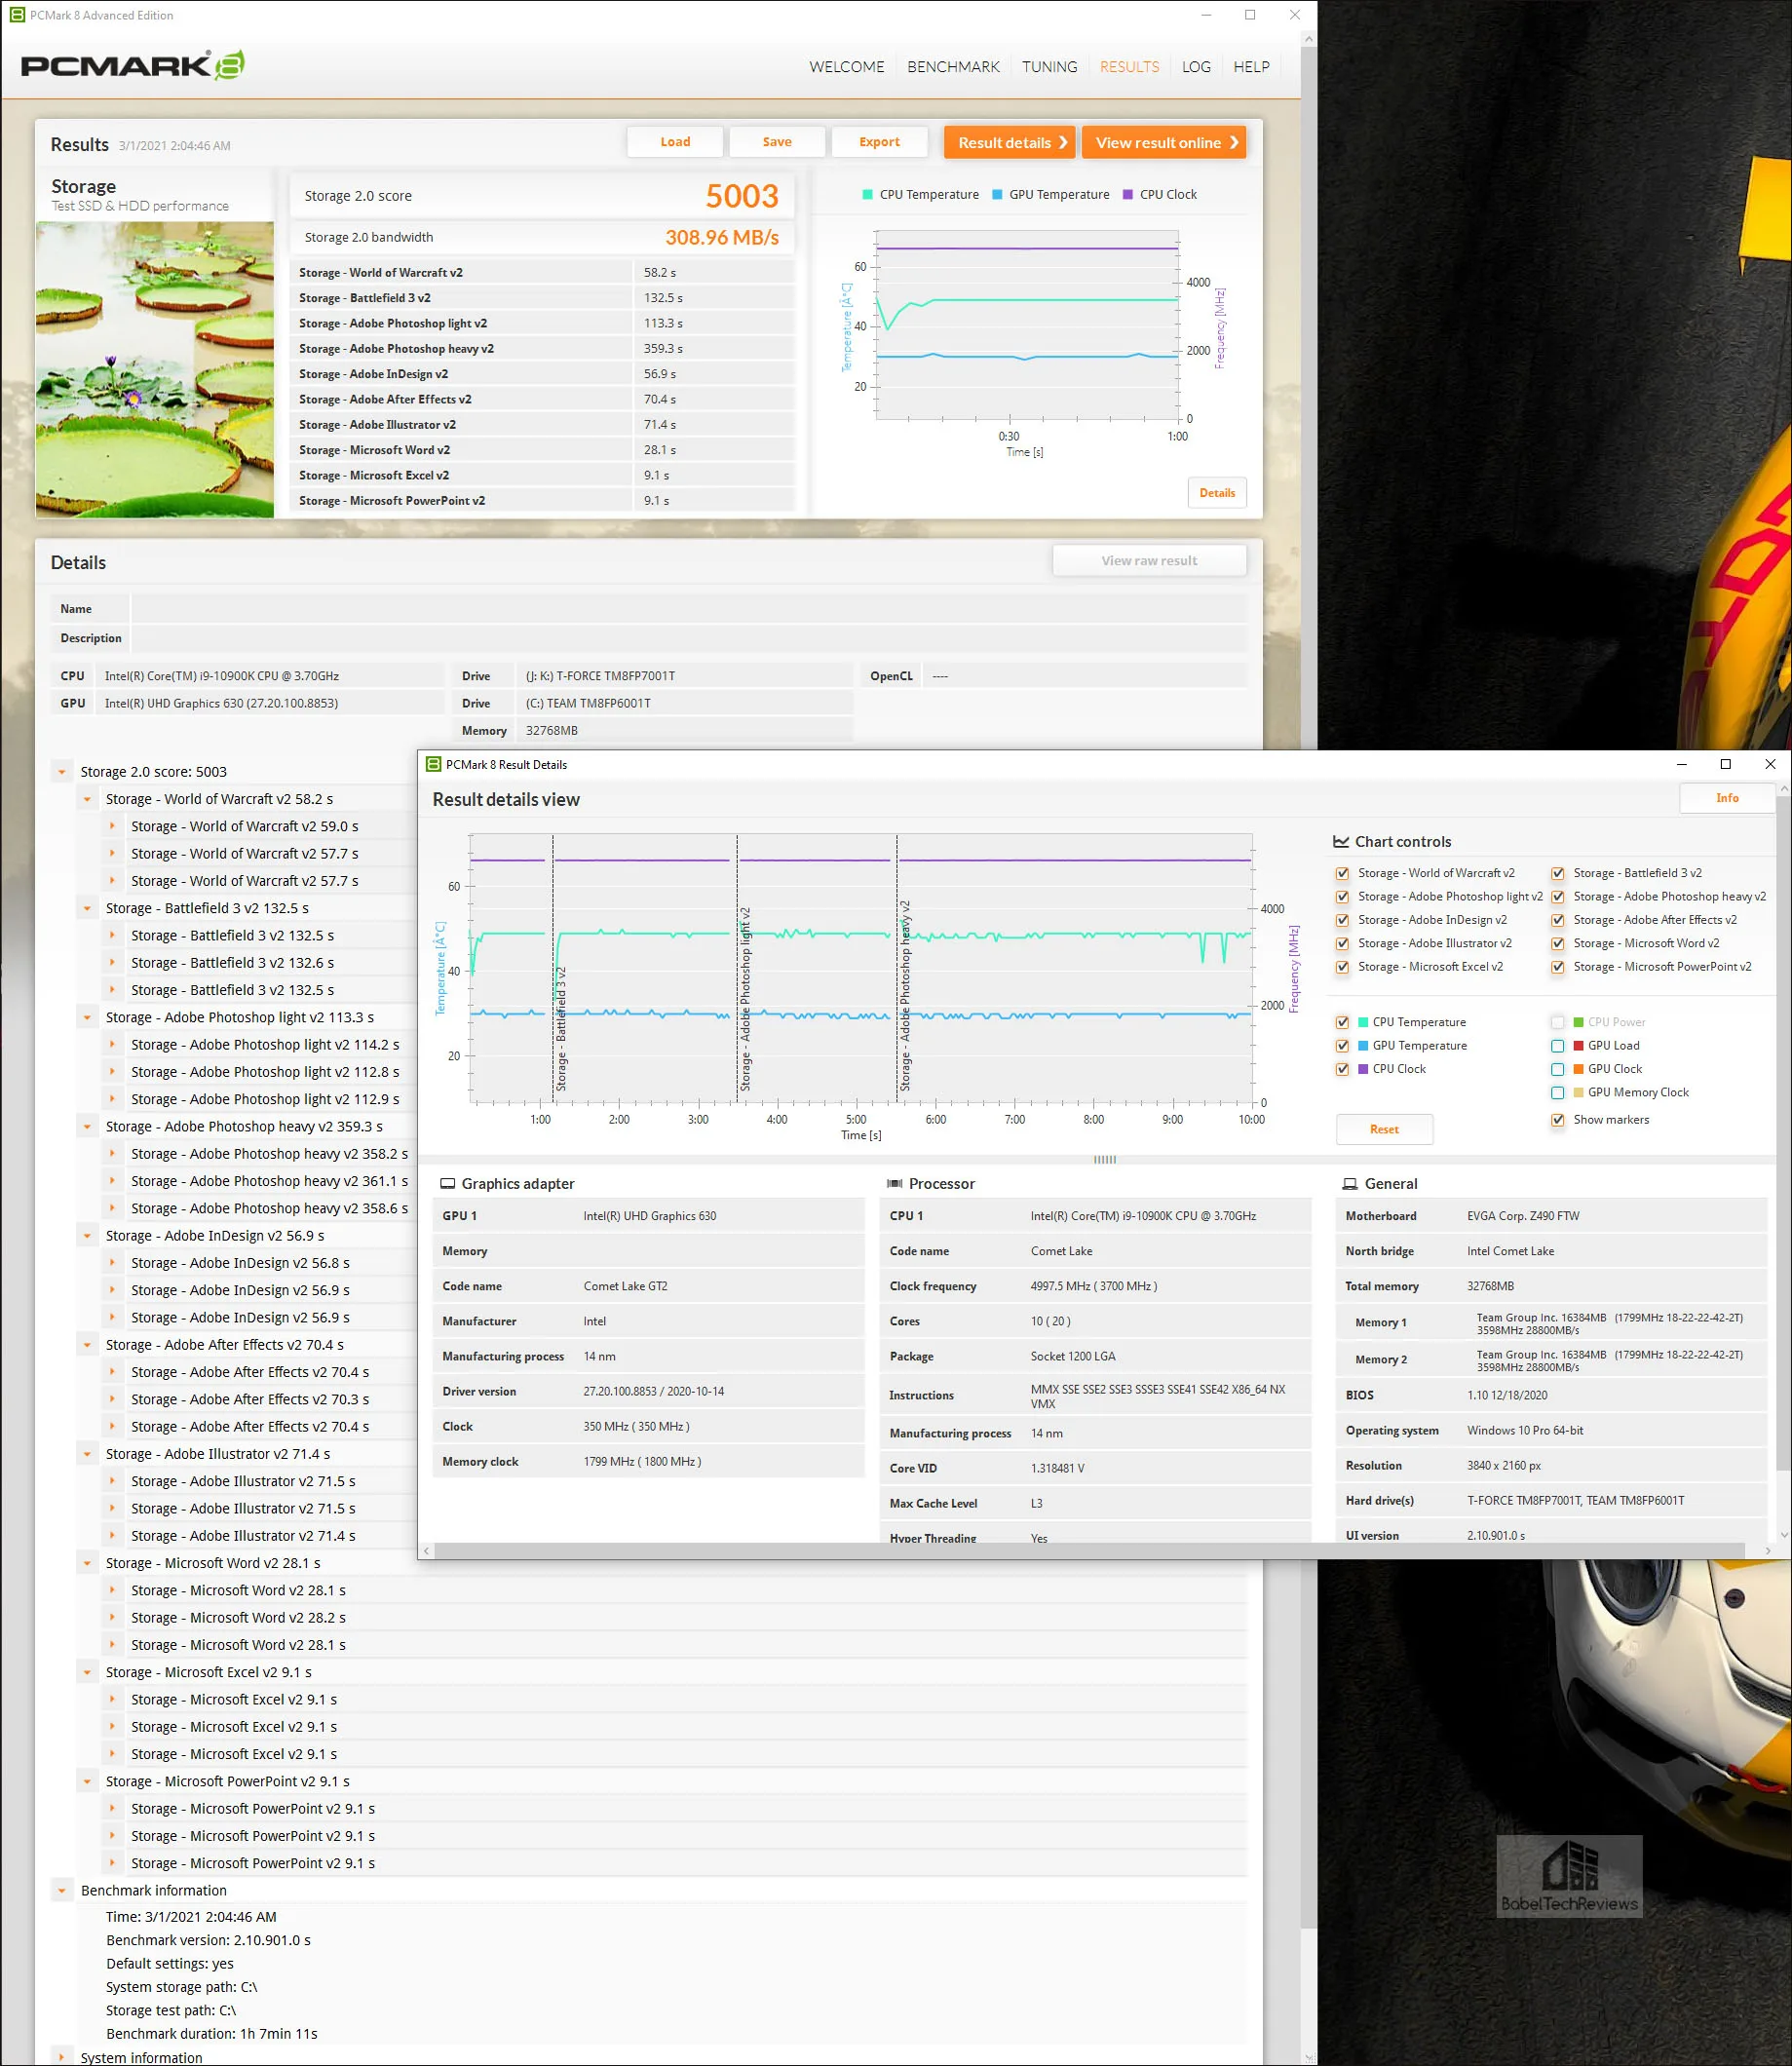
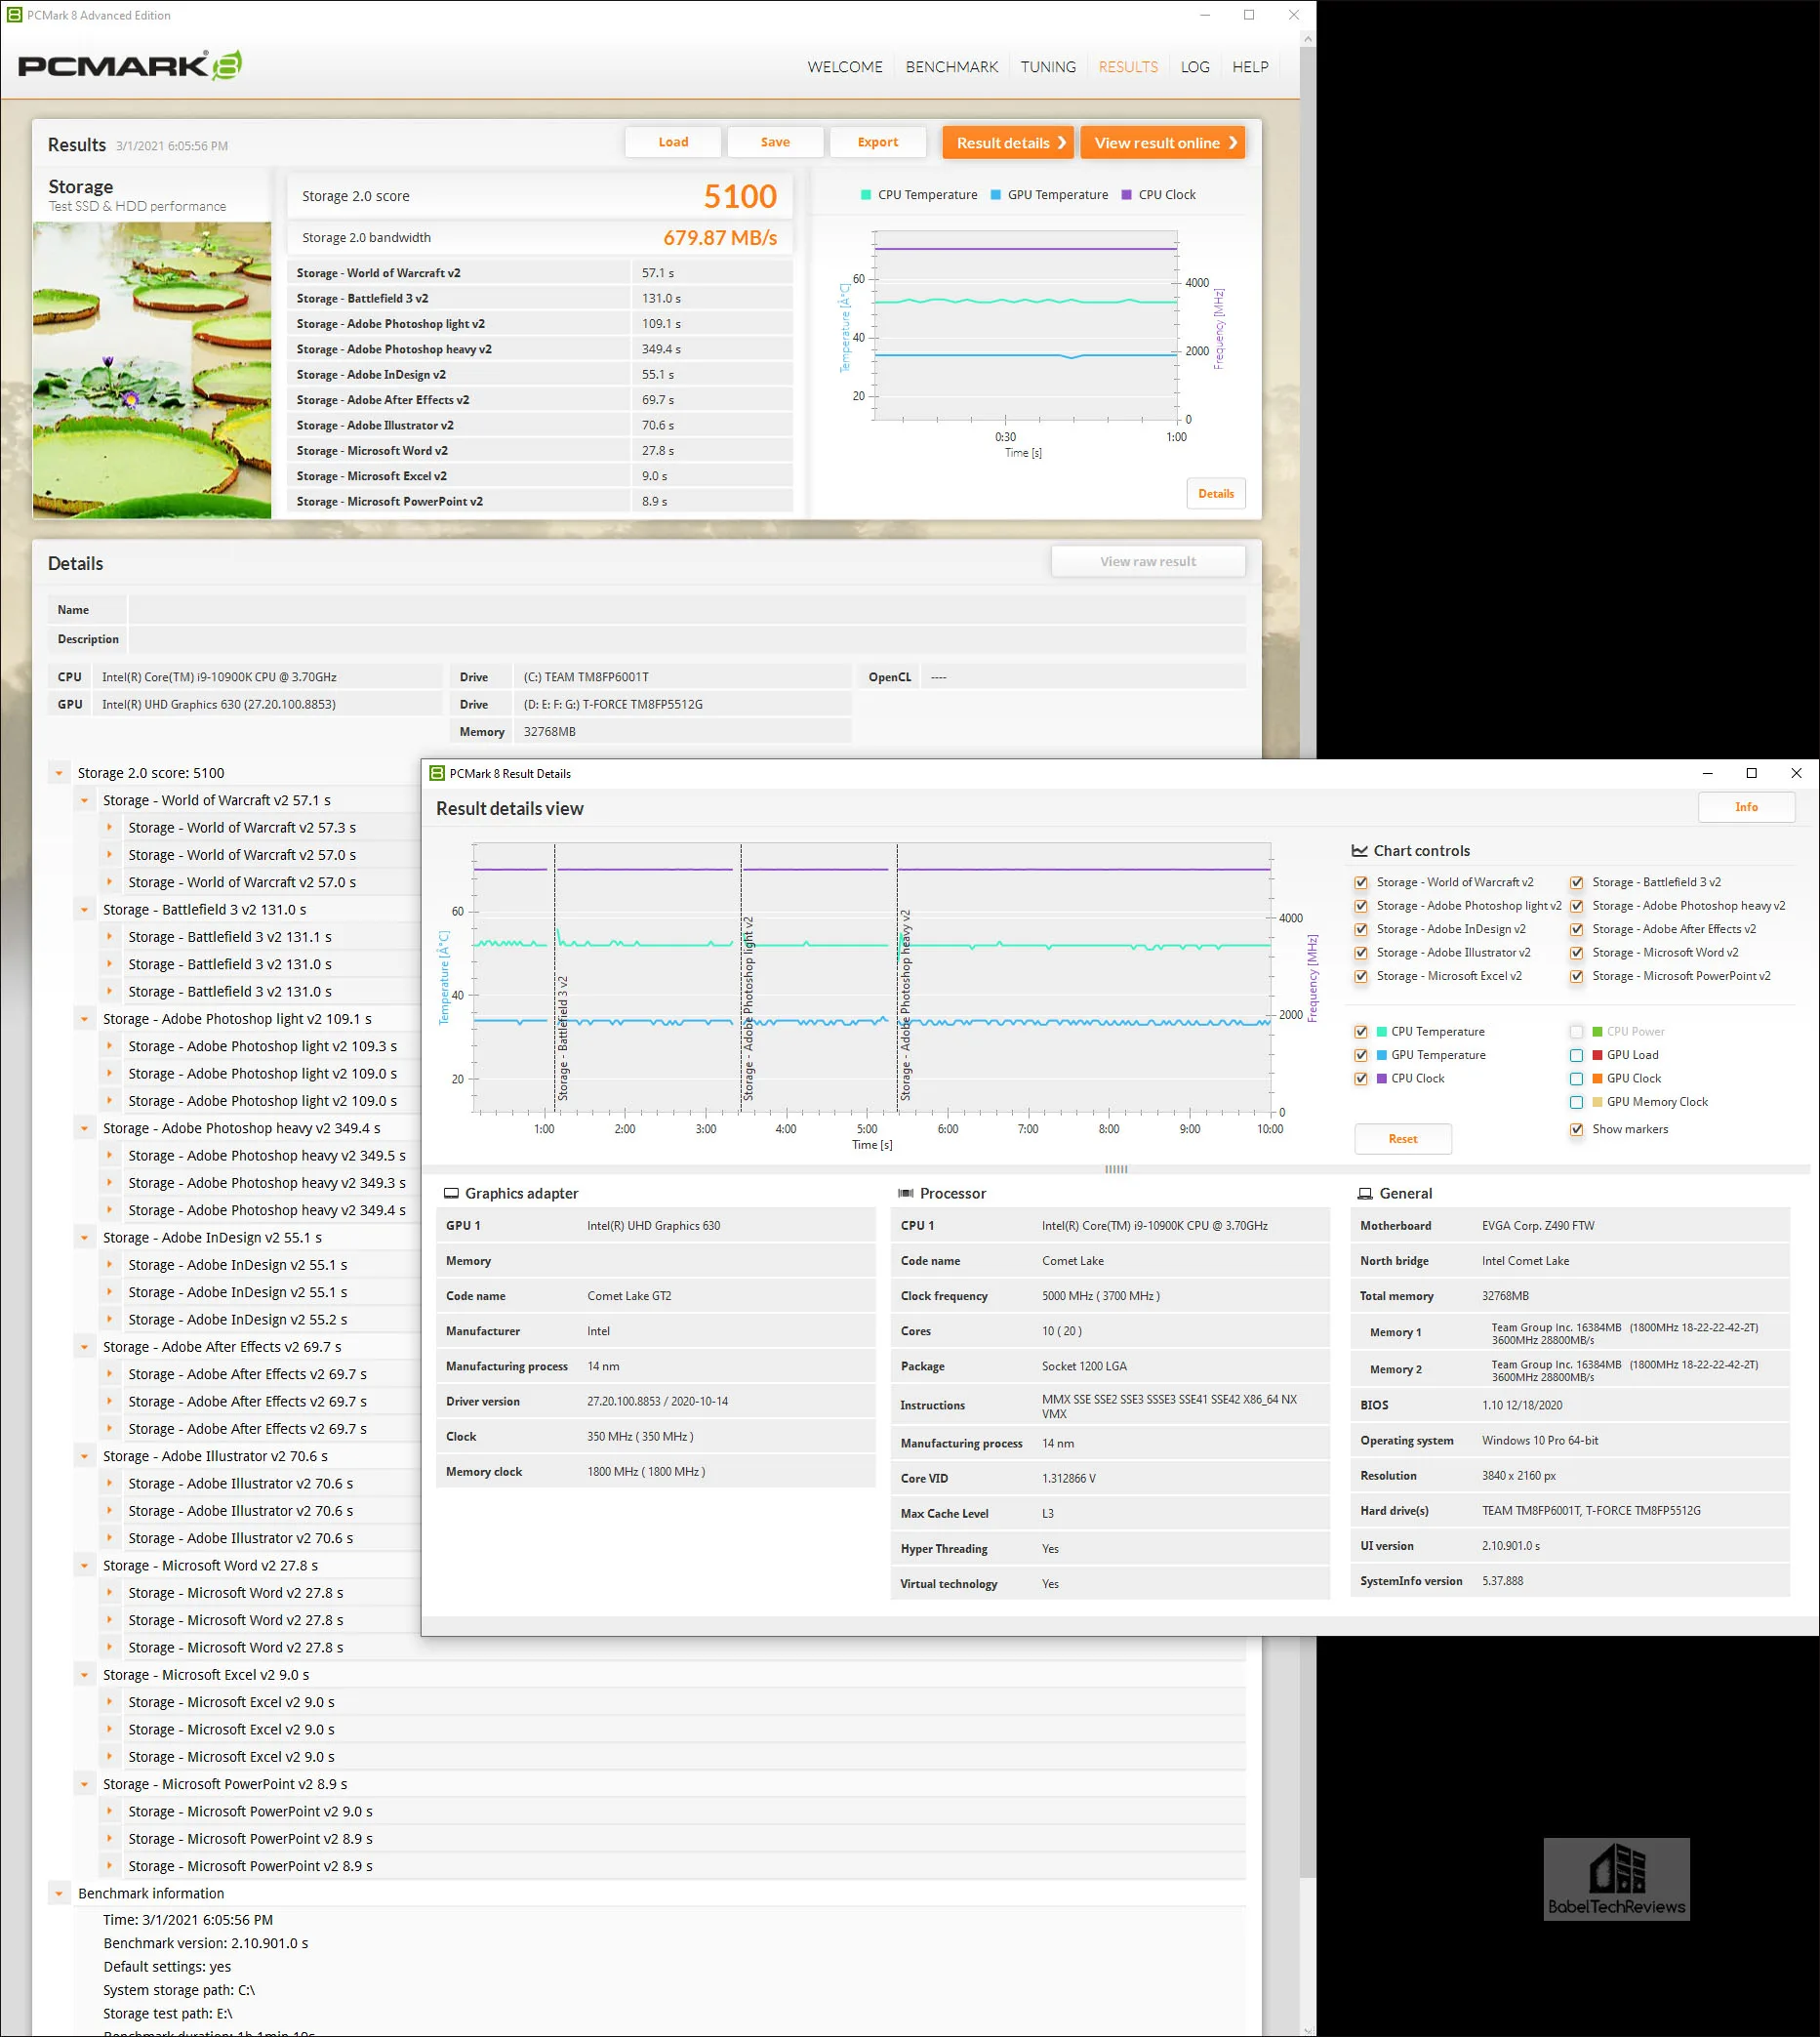
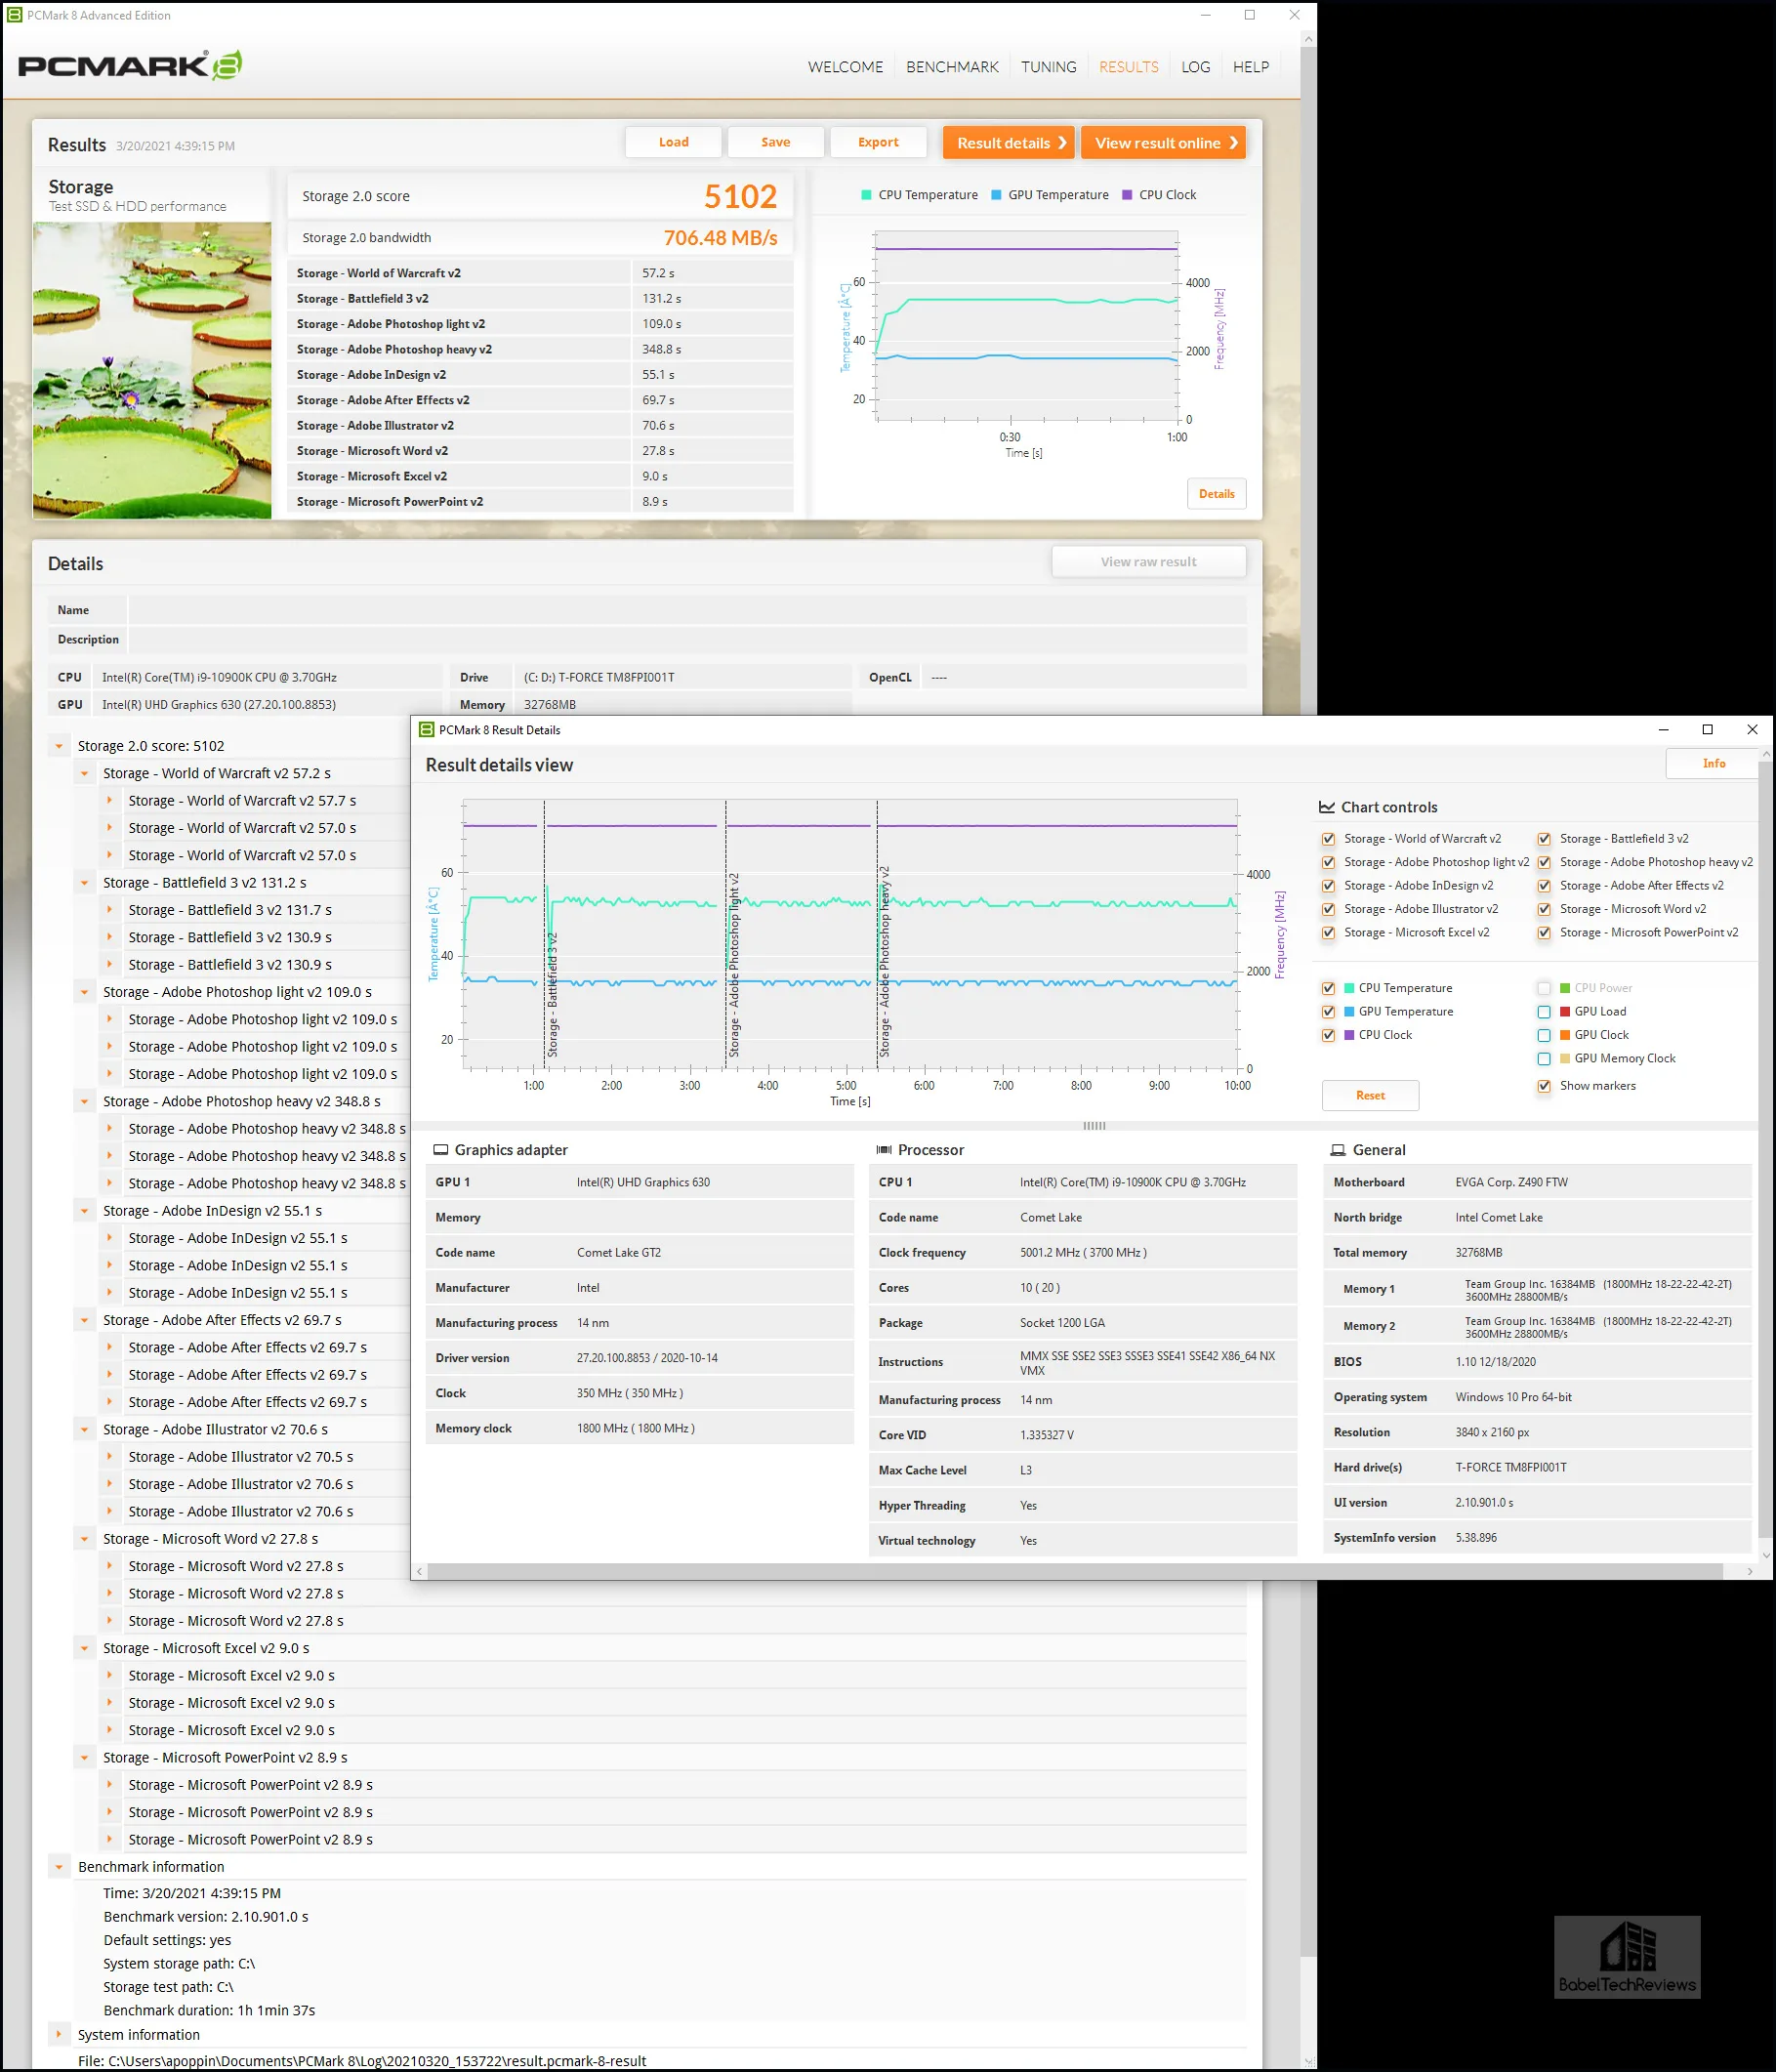
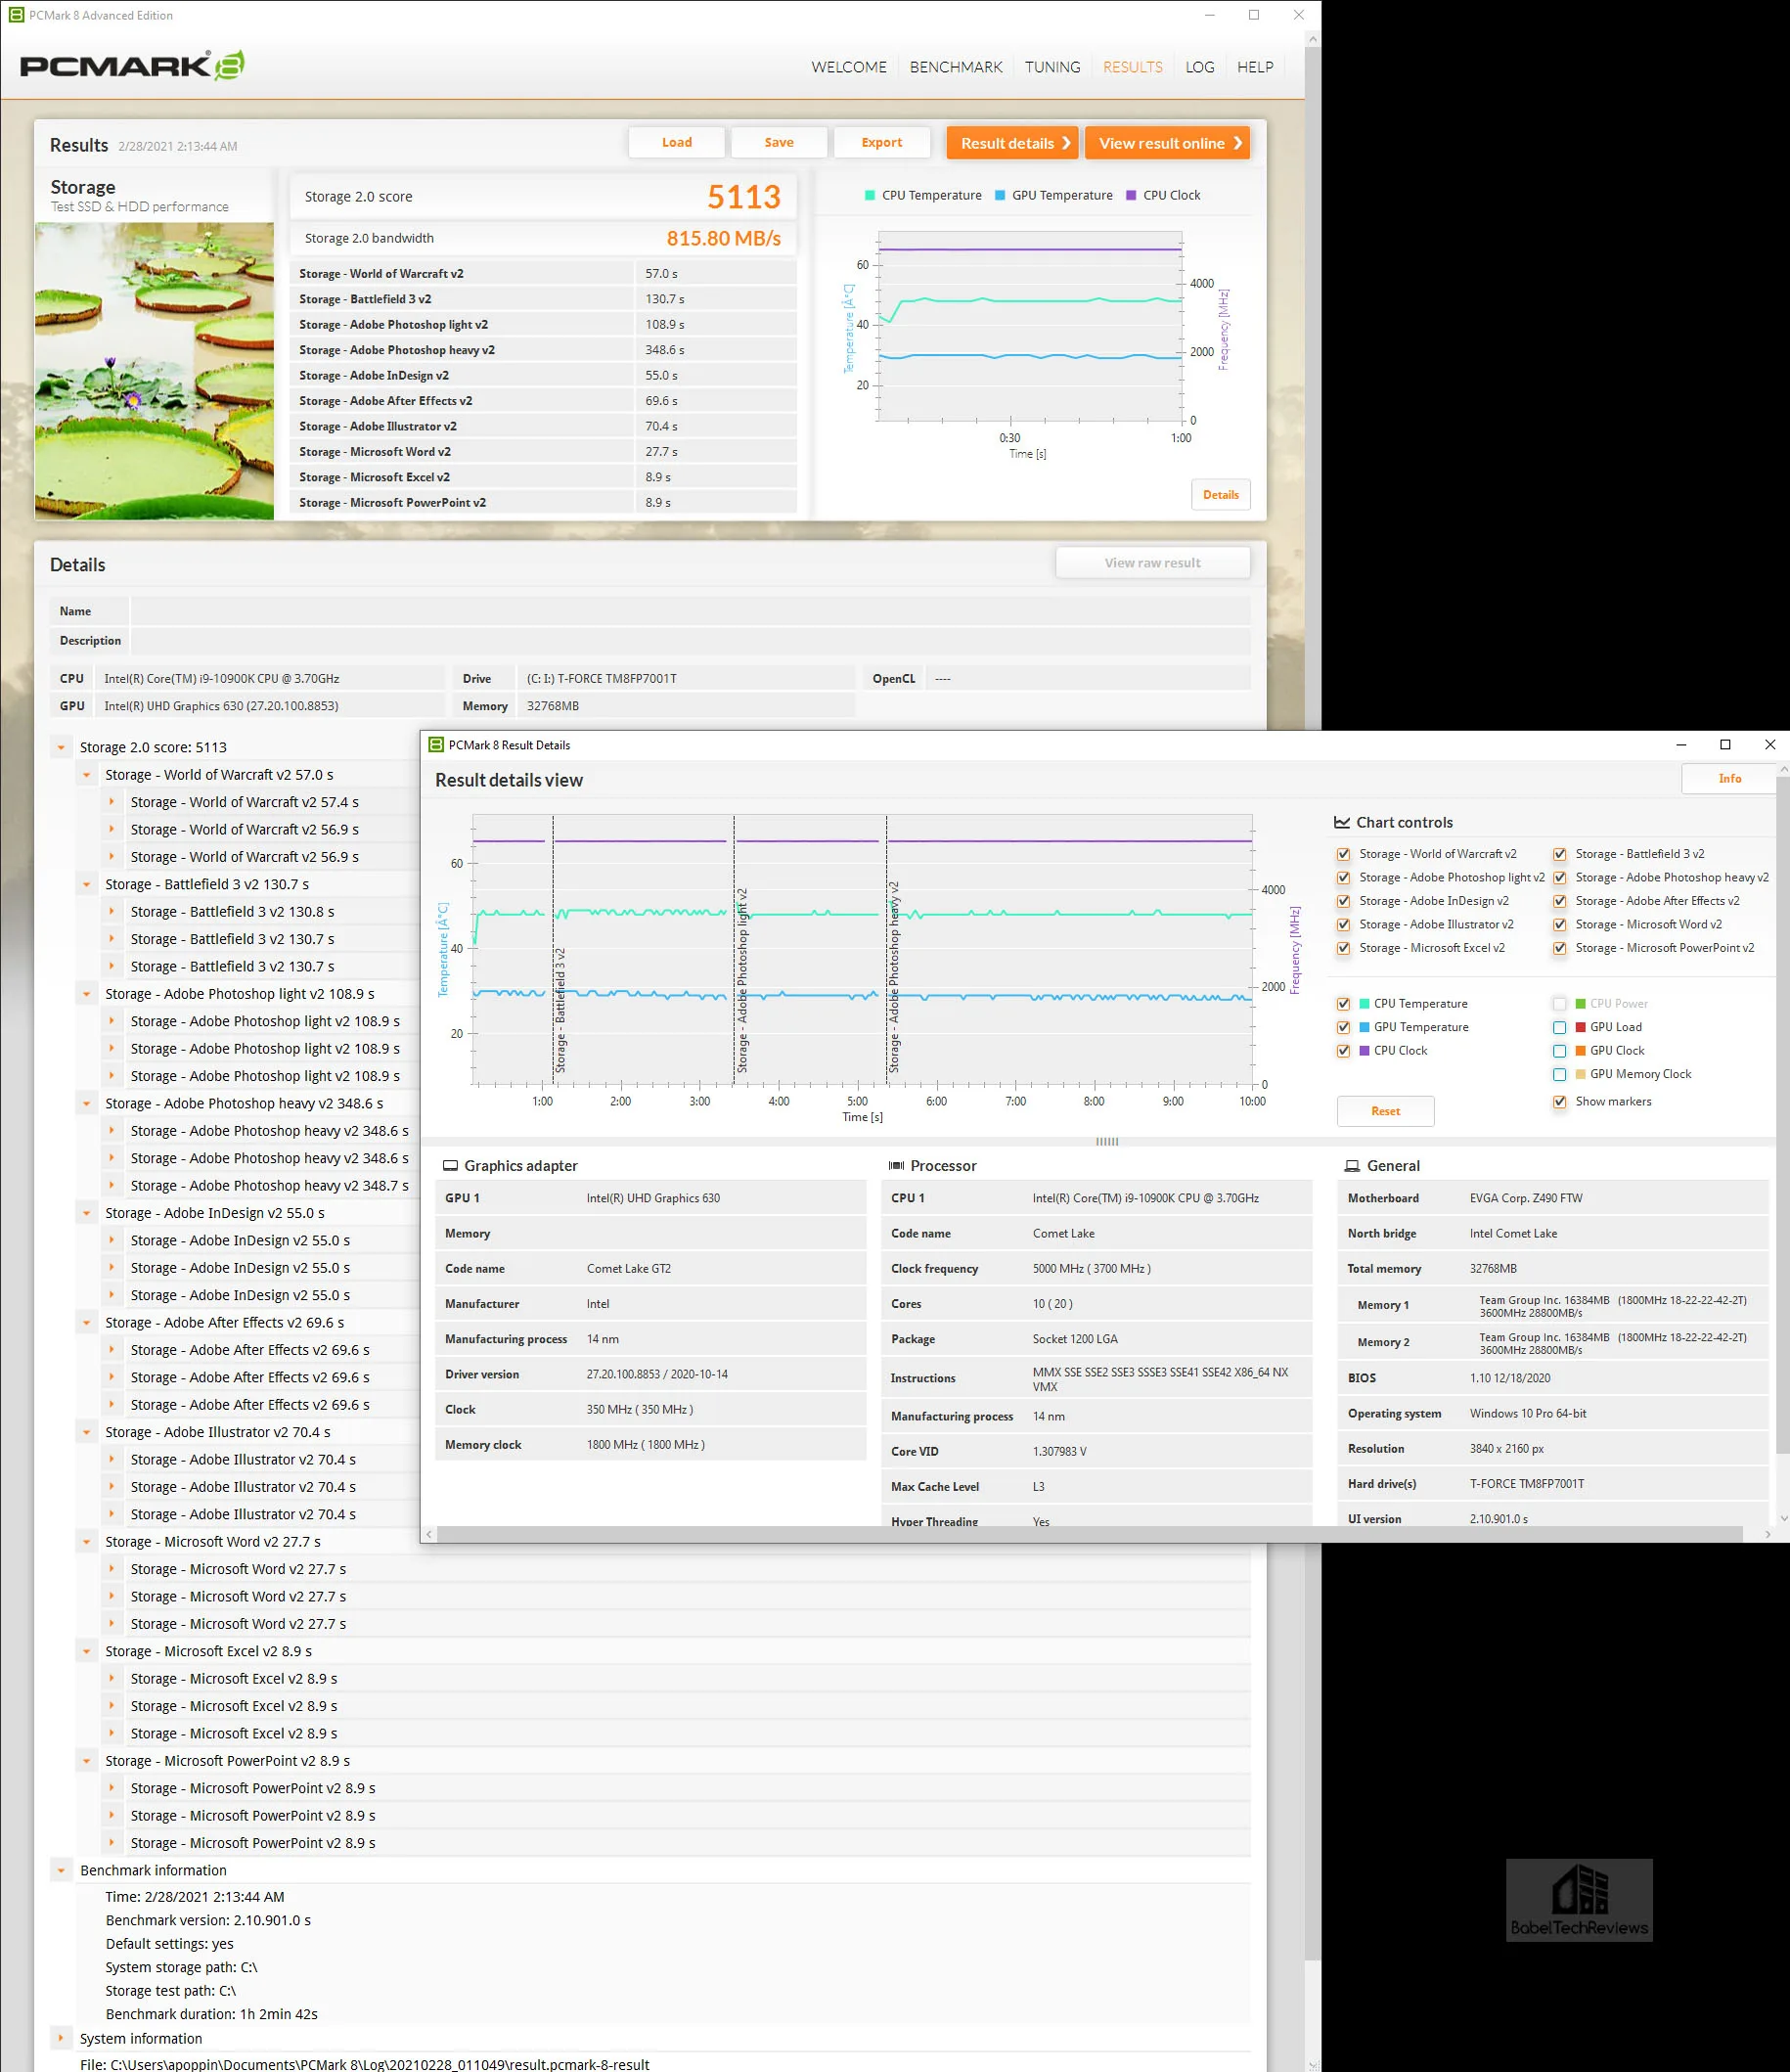
Let’s check out PCMark 8 which uses dedicated storage tests.
PCMARK 8


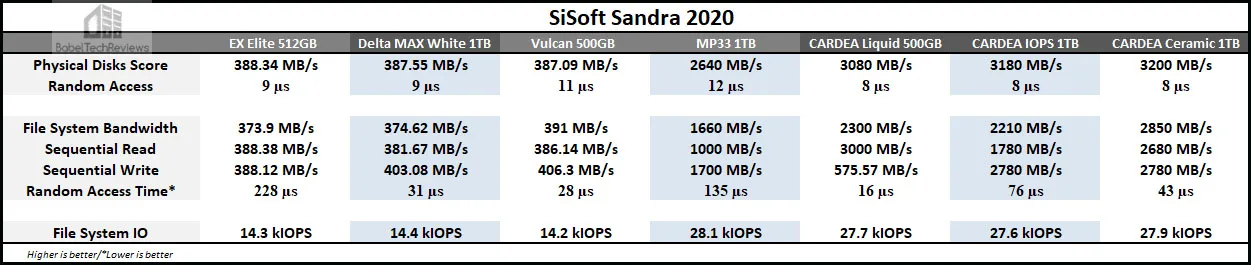
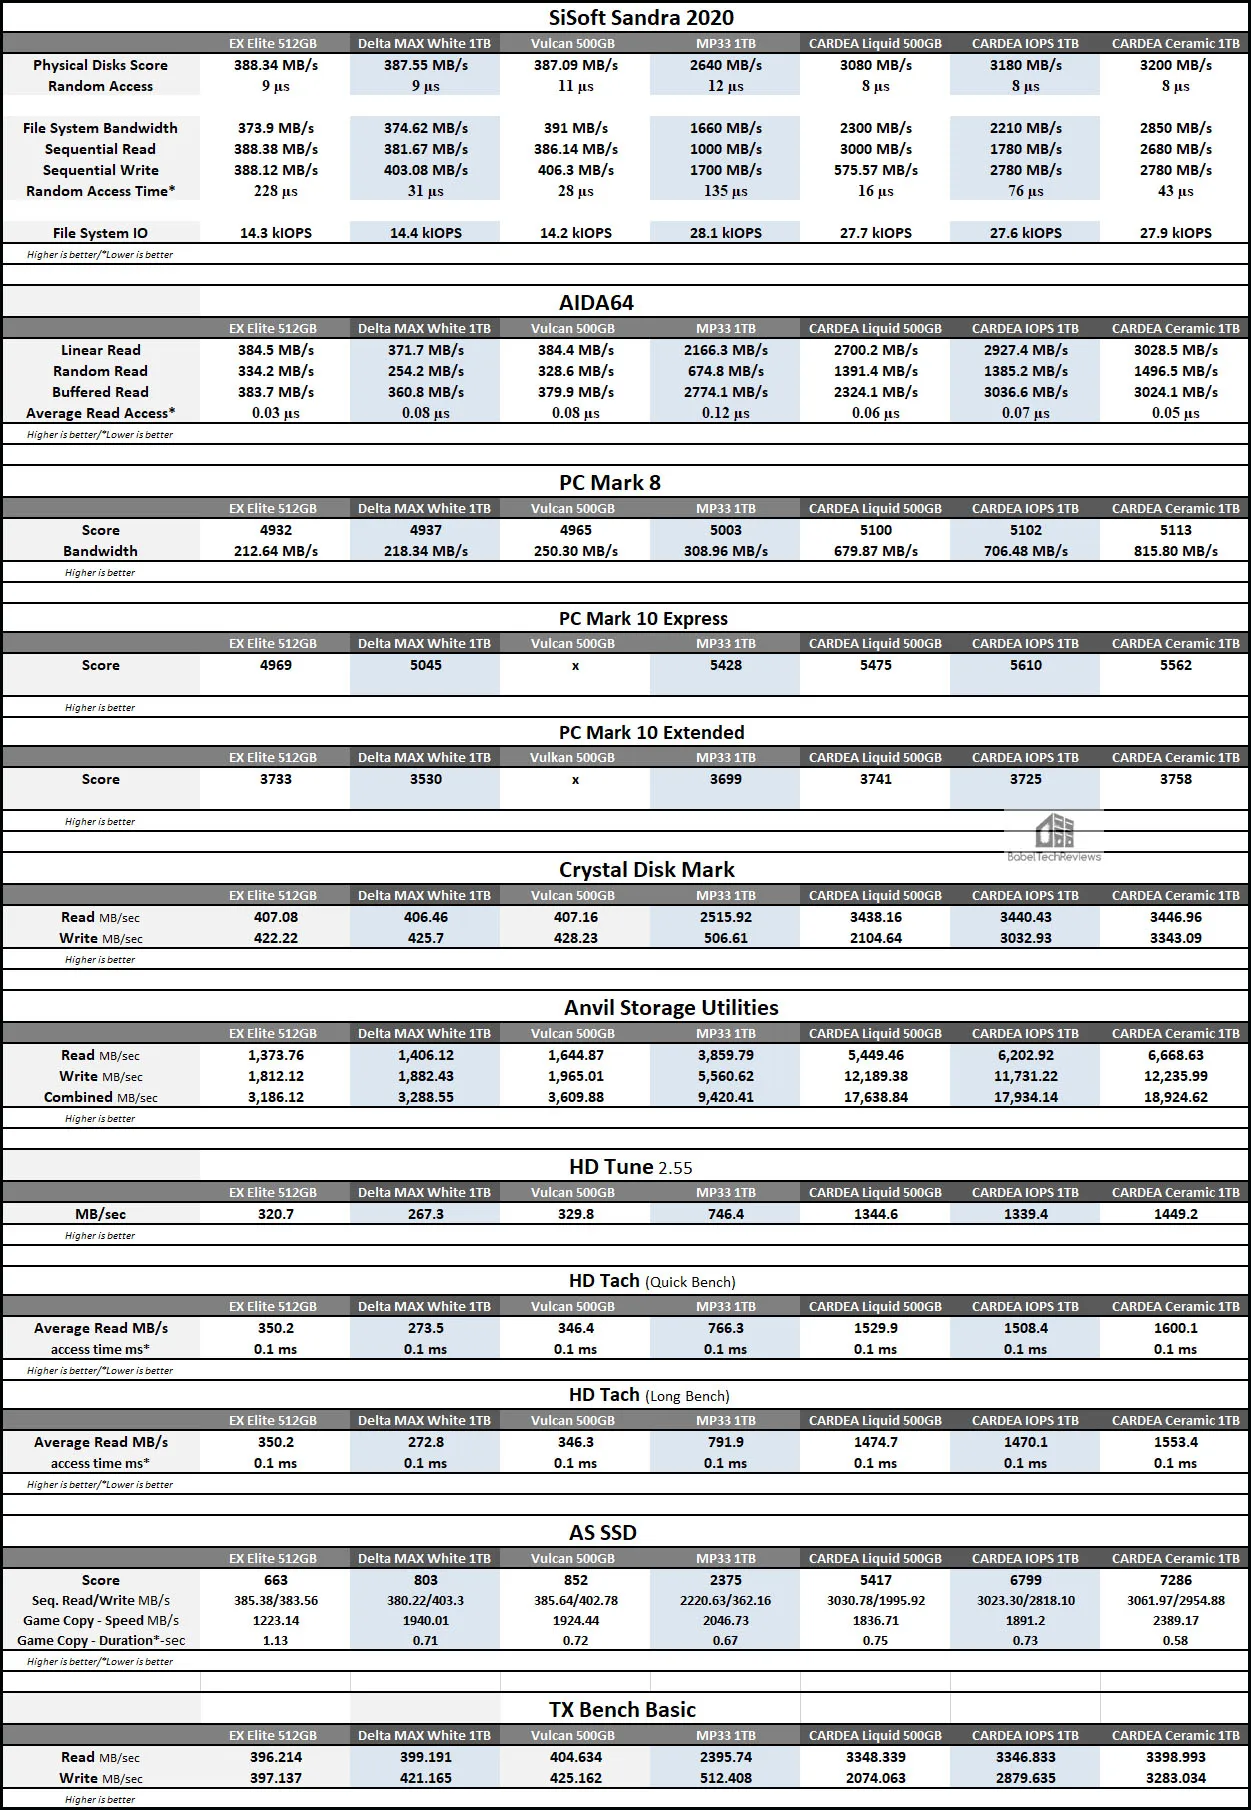
SiSoft Sandra 2020/2021
To see exactly where drive performance results differ, there is no better tool than SiSoft’s Sandra 2020. Sandra (the System ANalyser, Diagnostic and Reporting Assistant) is a complete information & diagnostic utility in one package. It is able to provide all of the information about your hardware, software, and other devices for diagnosis and for benchmarking.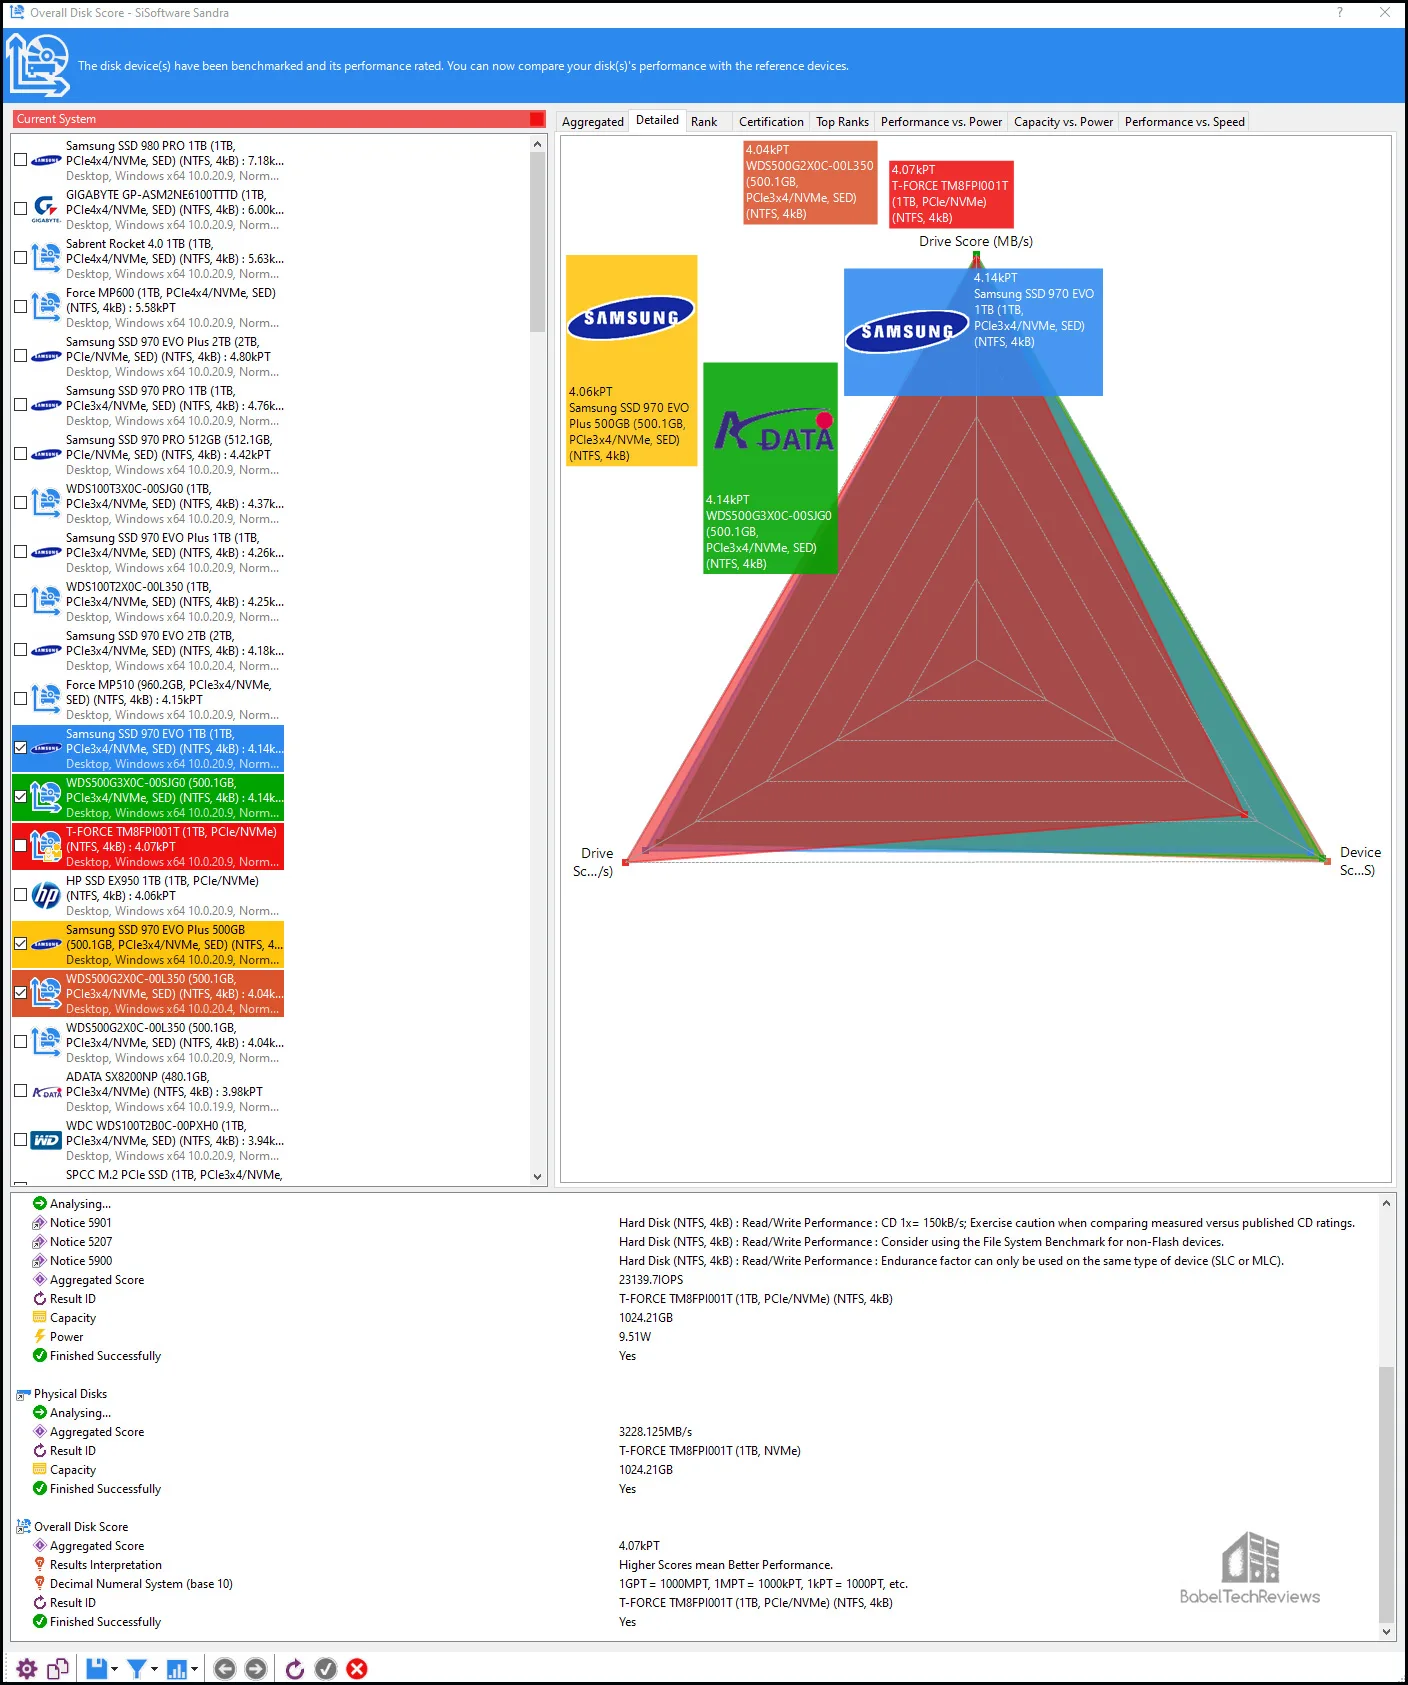
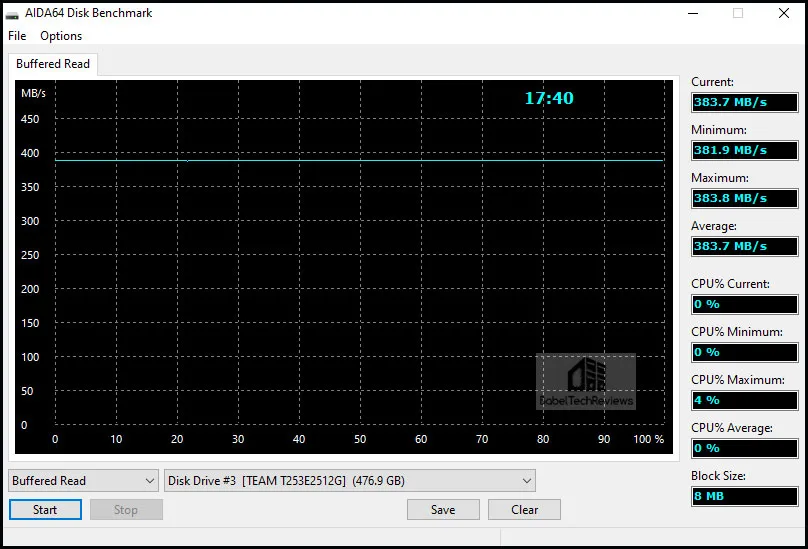
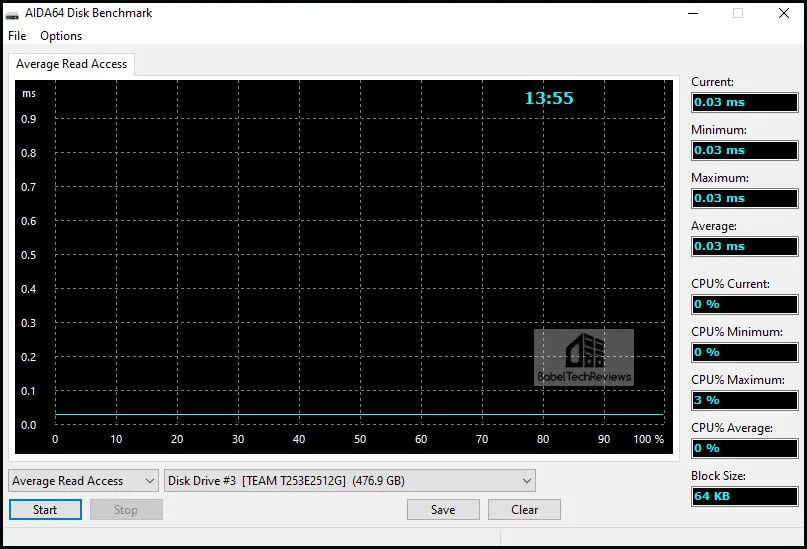
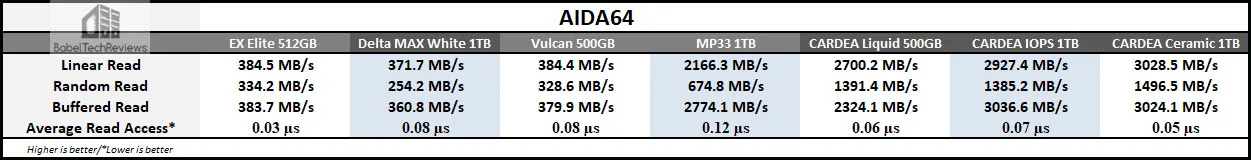
AIDA64 v6.32
AIDA64 is the successor to Everest and it is an important industry tool for benchmarkers. AIDA64’s benchmark code is written in Assembly language, and they are well-optimized for AMD, Intel and VIA processors by utilizing the appropriate instruction set extensions. We use the Engineer’s version of AIDA64 courtesy of FinalWire. AIDA64 is free to to try and use for 30 days.- The Linear Read test measure sequential performance by reading or writing all sectors without skipping any. It’s a linear view of the drives overall performance from its beginning to end.
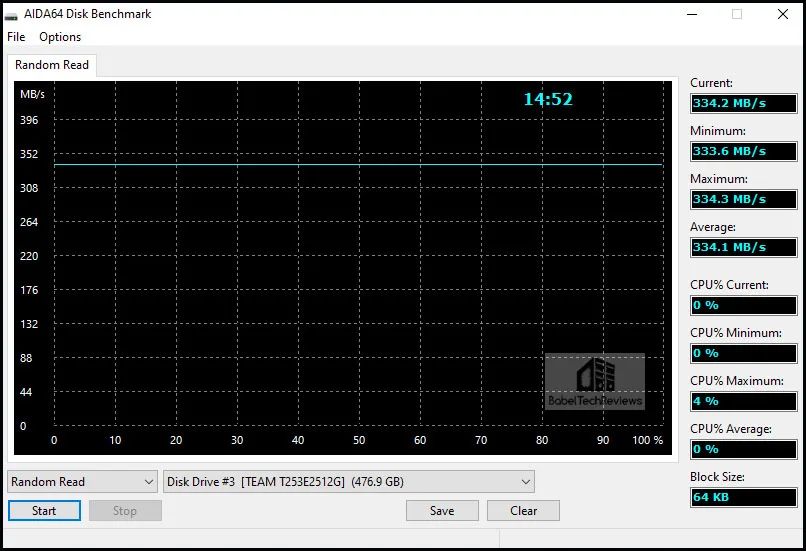
- The Random Read test measures the random performance by reading variable-sized data blocks at random locations on the drive and they are combination of both speed and access times as its position changes before each new operation.
- The Buffered Read test measures the drive caching.
- The Access time tests are designed to measure the data access performance by reading 0.5 KB data blocks at random drive locations
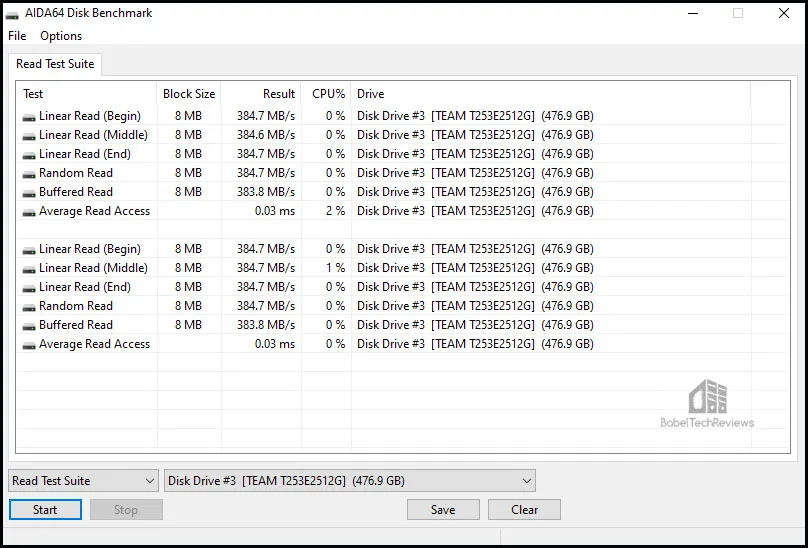
The individual benchmarks take much longer and they are more accurate and they are presented below without comment. 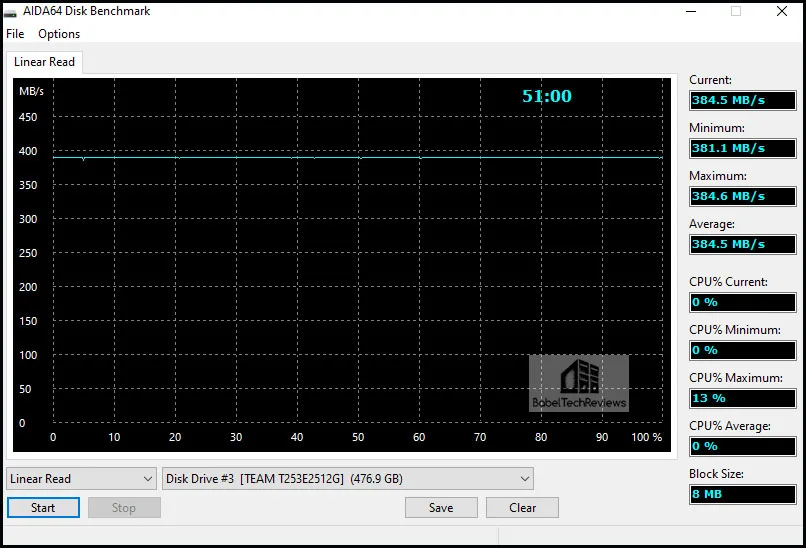
 Here is the summary chart comparing our six tested drives where higher is better except for the Average Read Access where lower is better.
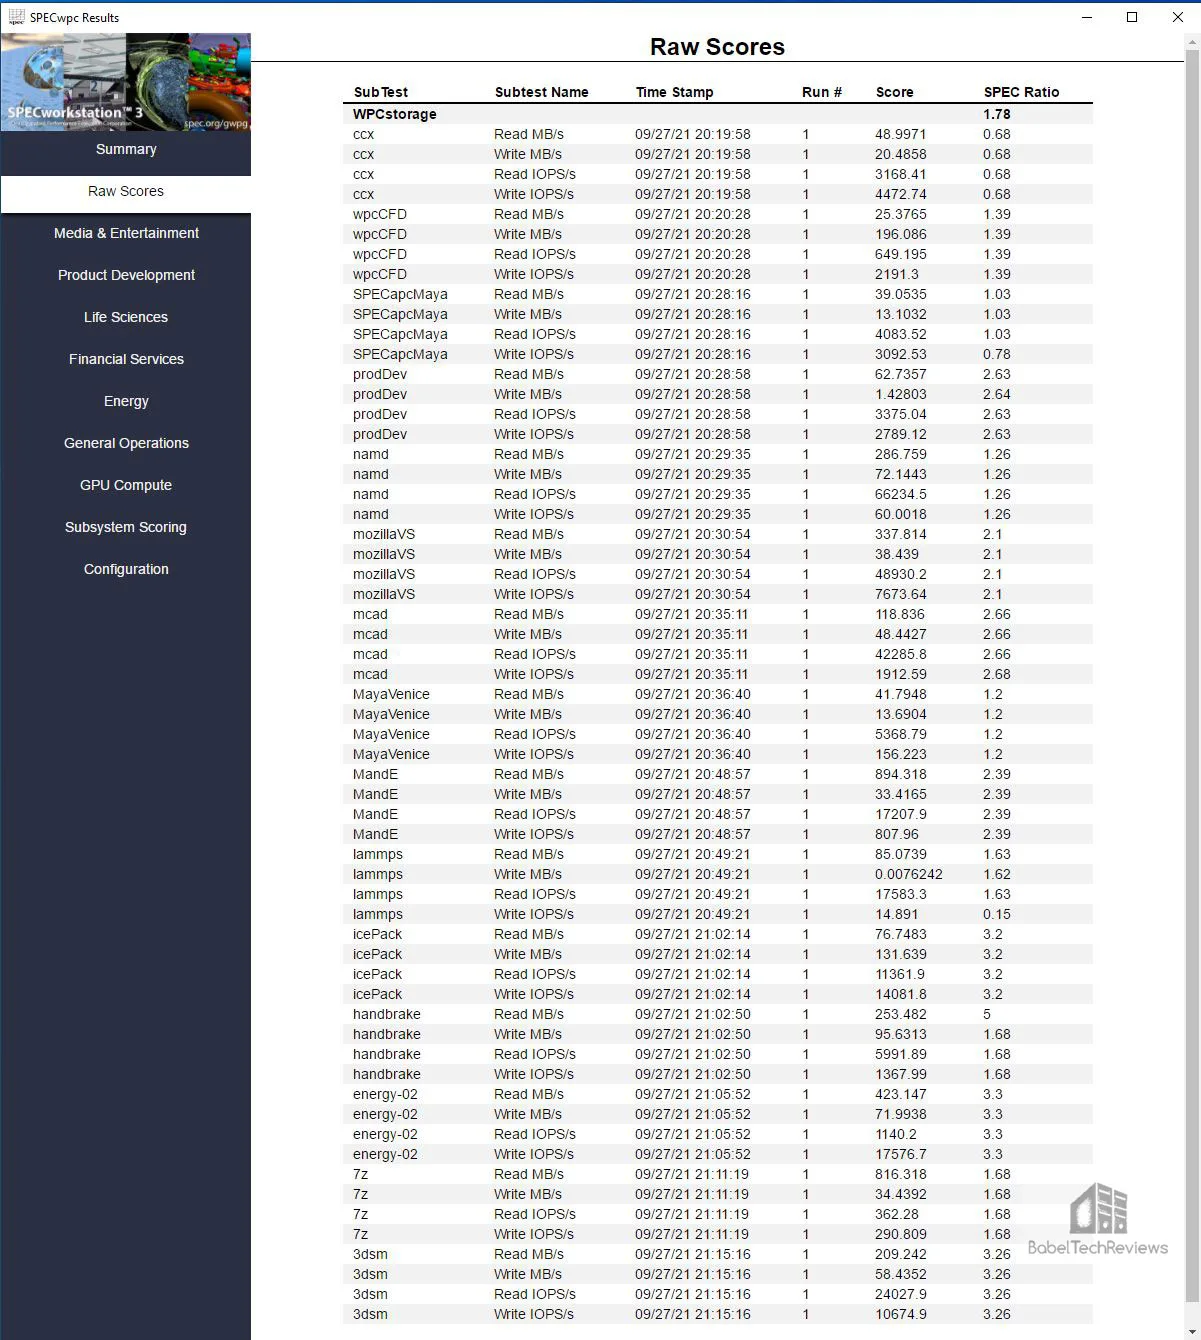
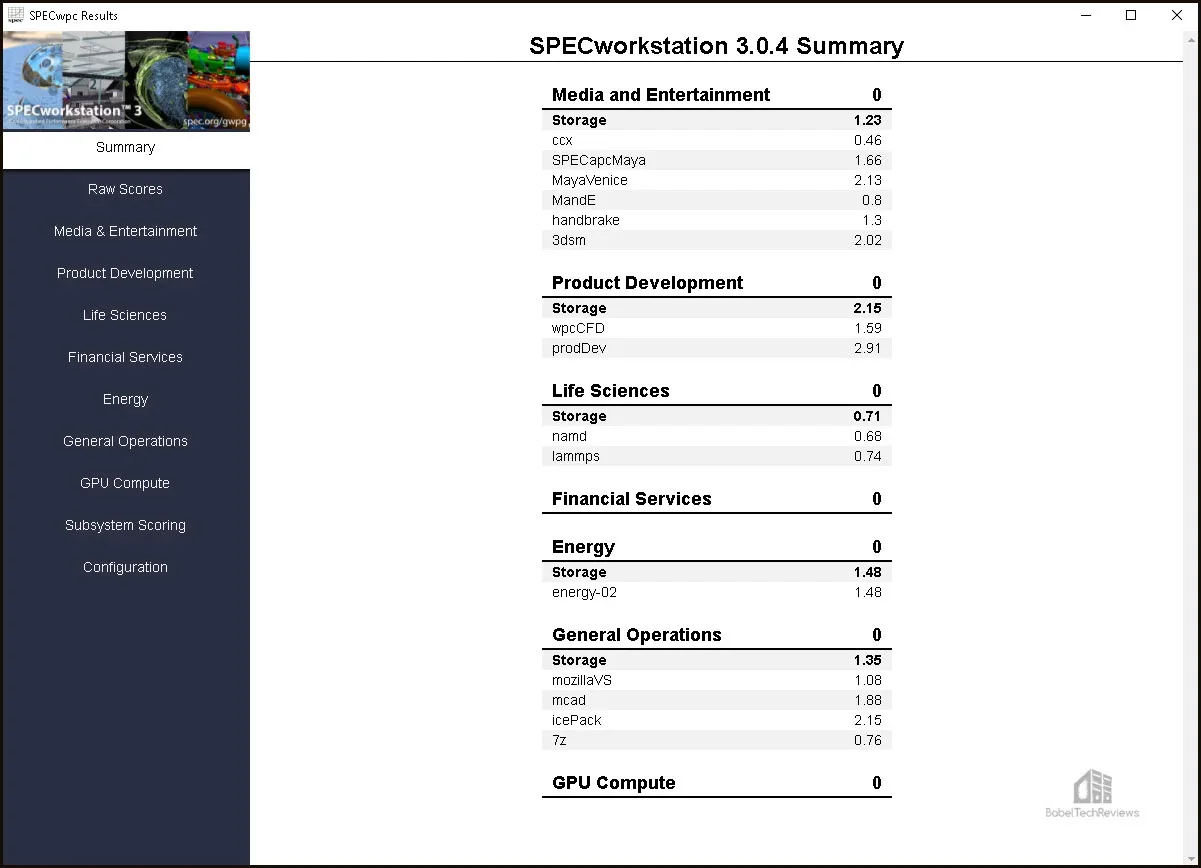
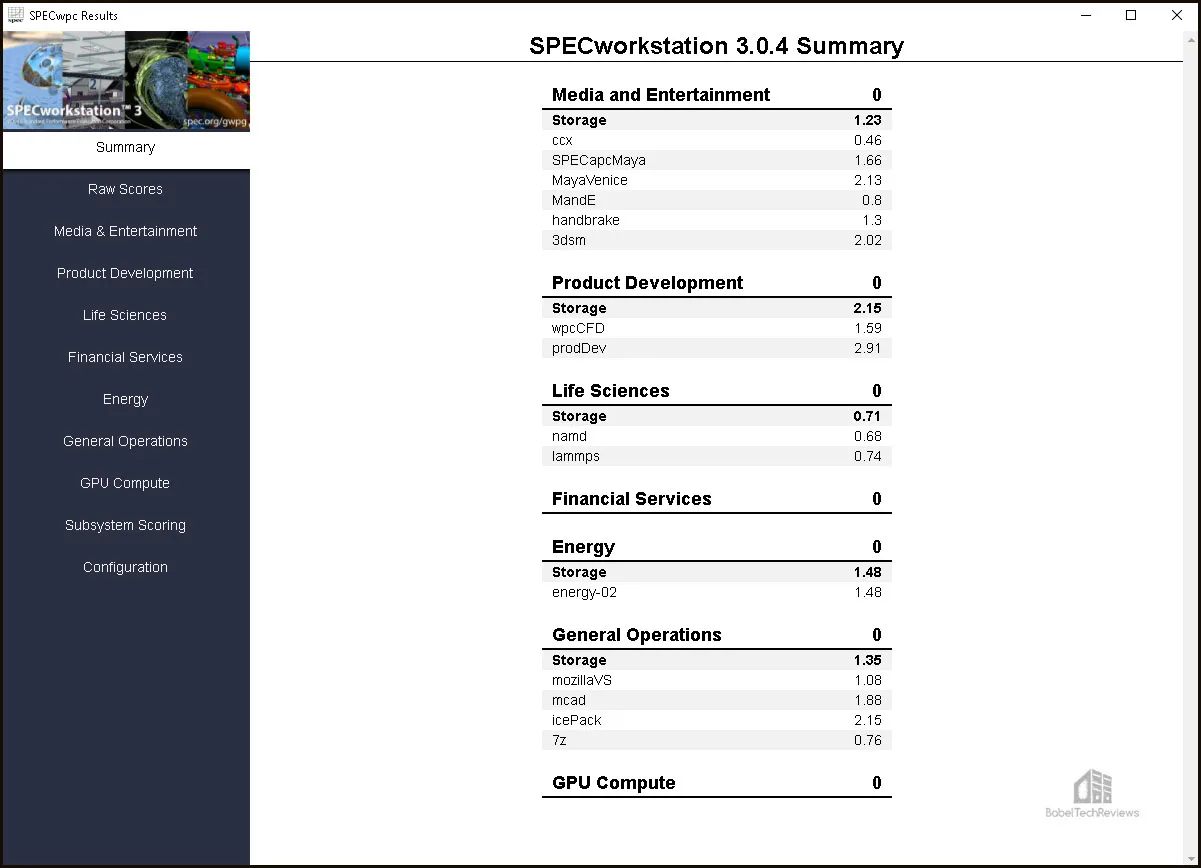
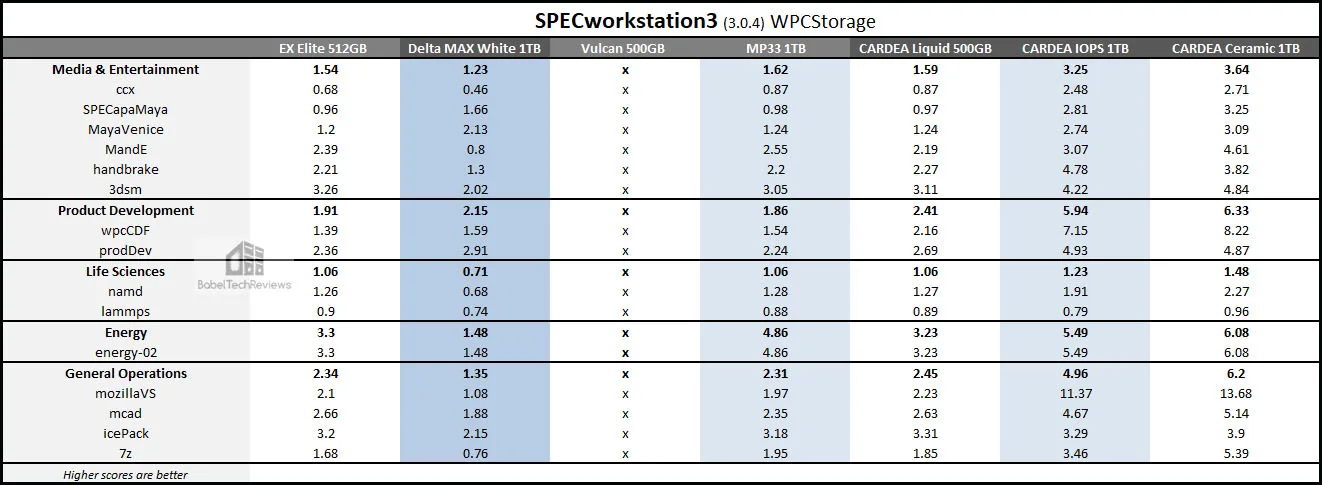
SPECworkstation3 (3.0.4) Disk Benchmarks
All the SPECworkstation3 benchmarks are based on professional applications, most of which are in the CAD/CAM or media and entertainment fields. All of these benchmarks are free except for vendors of computer-related products and/or services. The most comprehensive workstation benchmark is SPECworkstation3. It’s a free-standing benchmark which does not require ancillary software. It measures GPU, CPU, storage and all other major aspects of workstation performance based on actual applications and representative workloads. SPECworkstation Disk benchmarks are perhaps more demanding than the 3DMark tests and only WPCstorage was performed. It was not possible to run it on the Vulcan SSD since there is no operating system installed on it.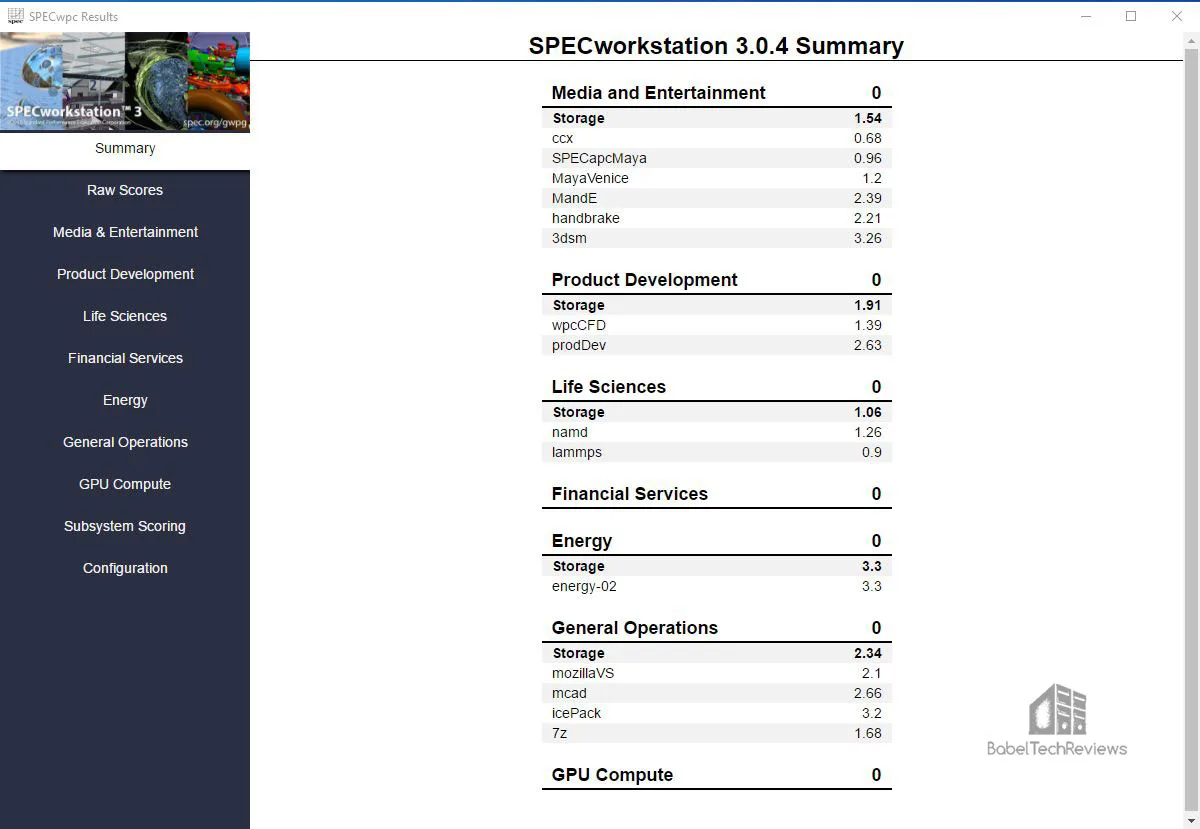


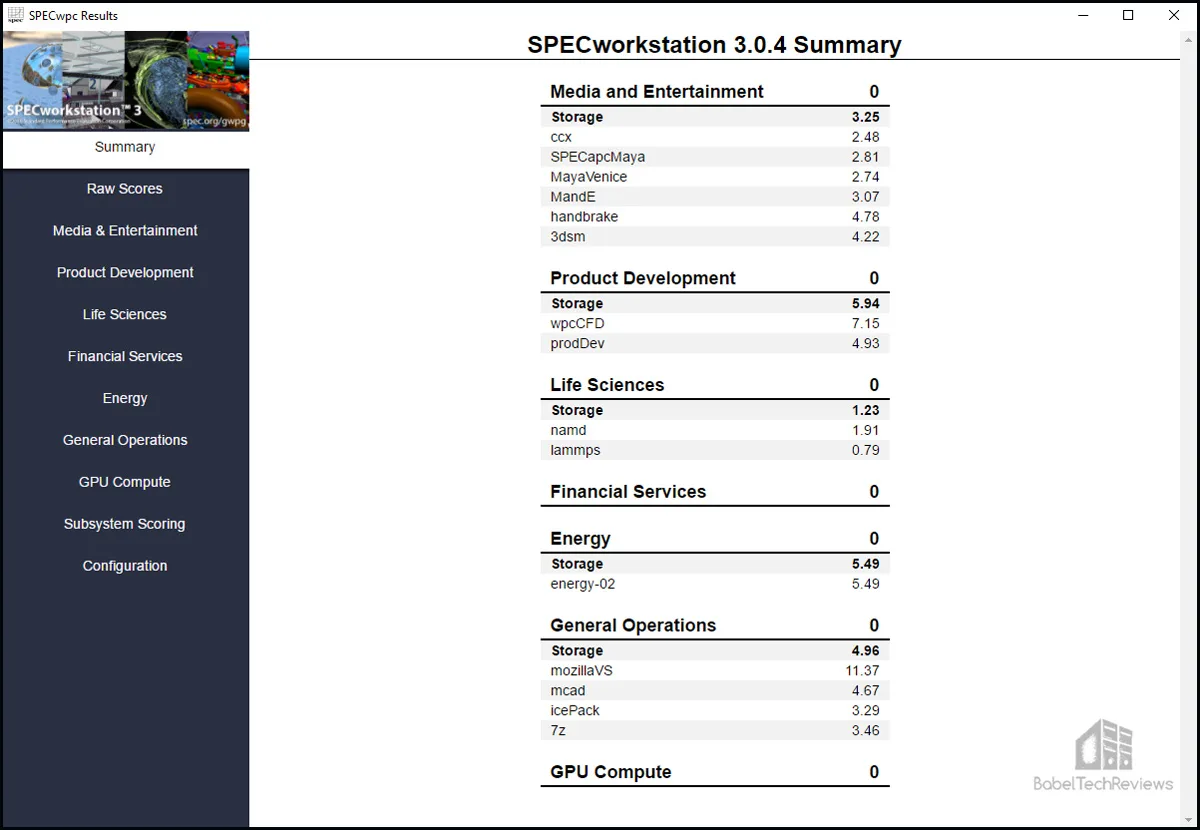 Finally up is the CARDEA Ceramic C440 summary.
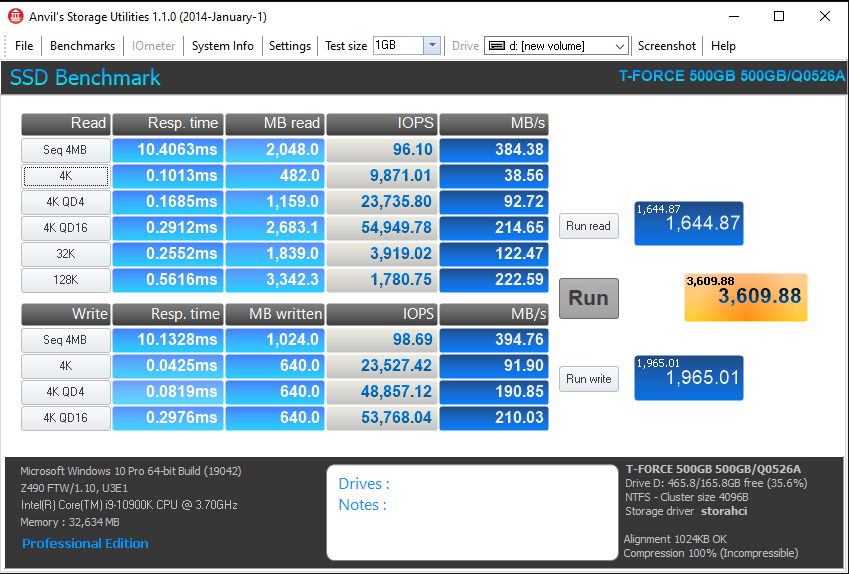
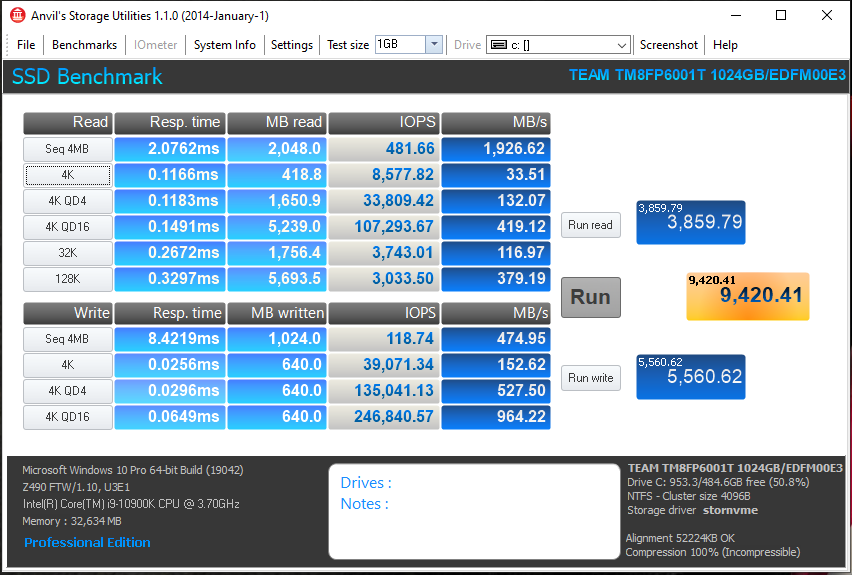
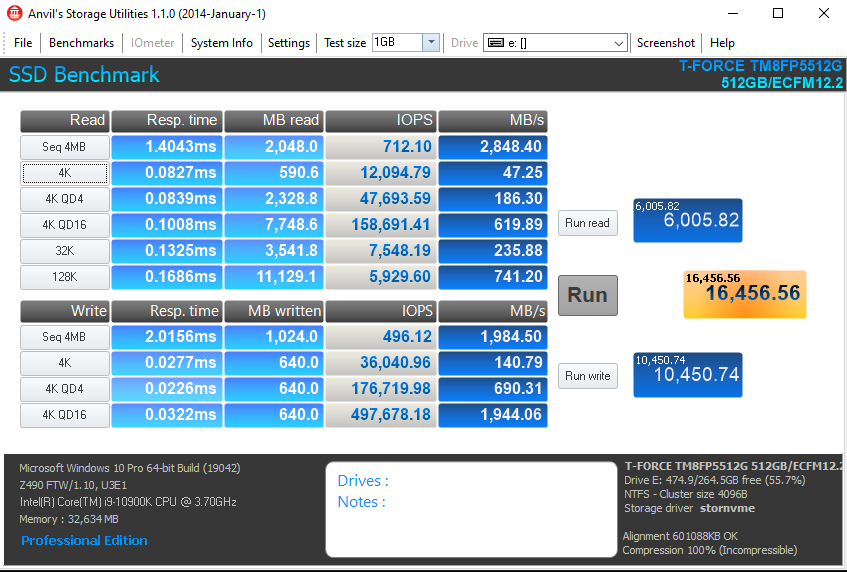
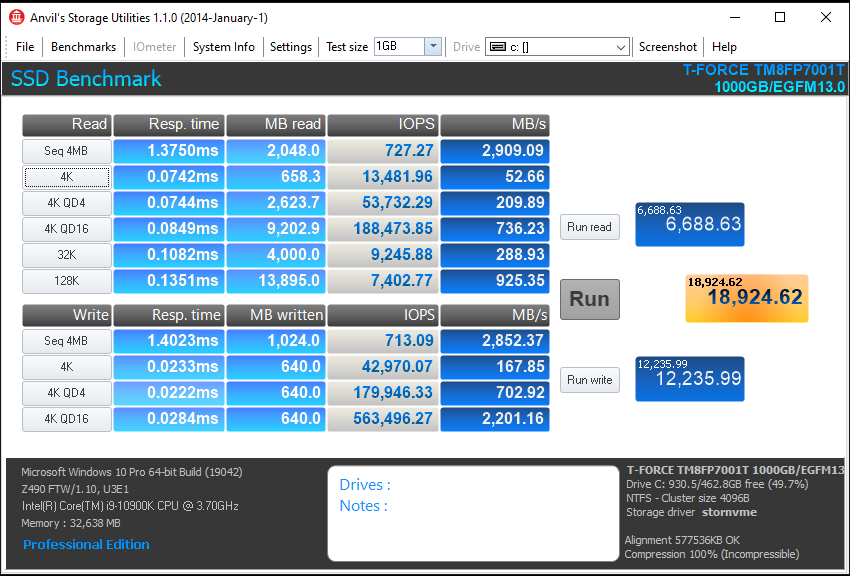
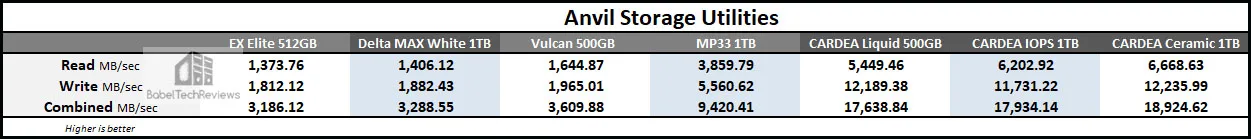
Anvil’s Storage Utilities
Anvil’s Storage Utilities is a tool designed to benchmark and evaluate the Read and Write performance of SSDs and HDDs. It gives overall bandwidth as well separate Read and Write scores, the response times, and IOPS capabilities.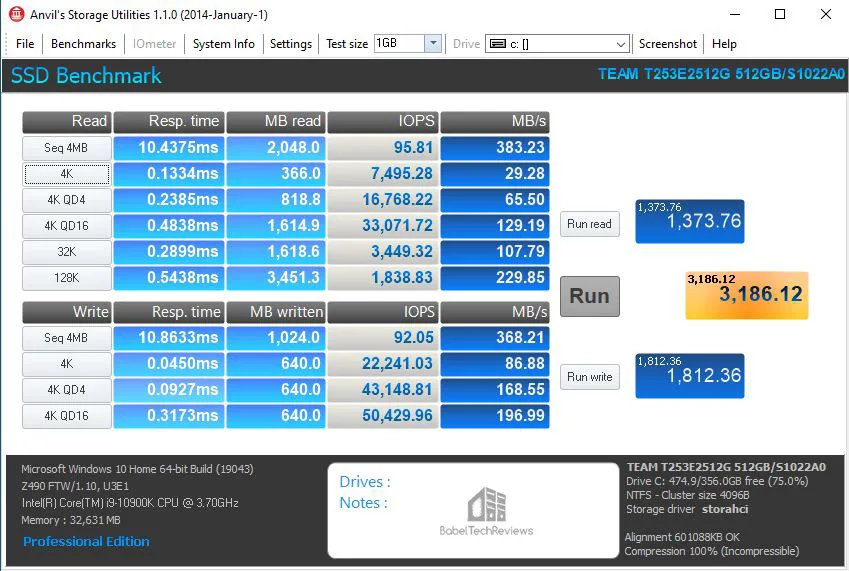


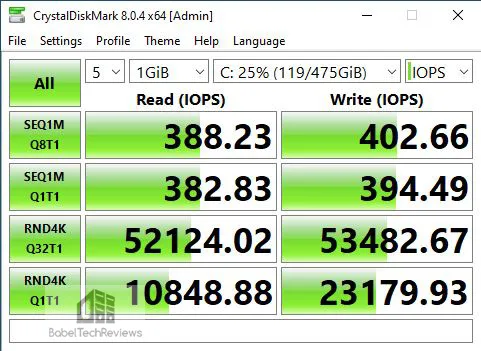
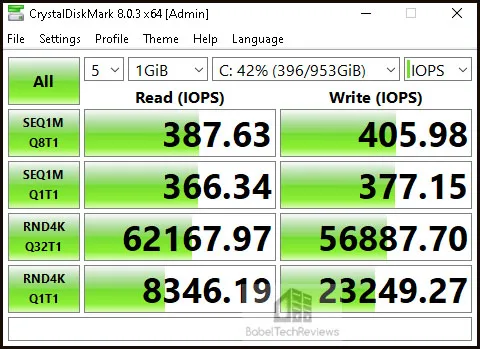
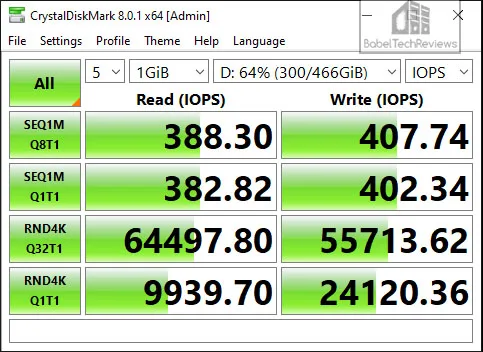
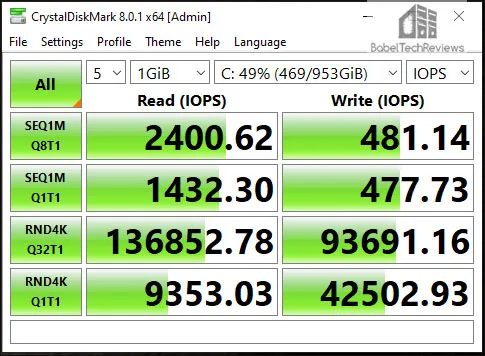
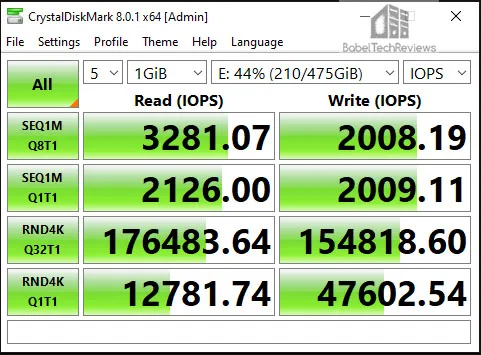
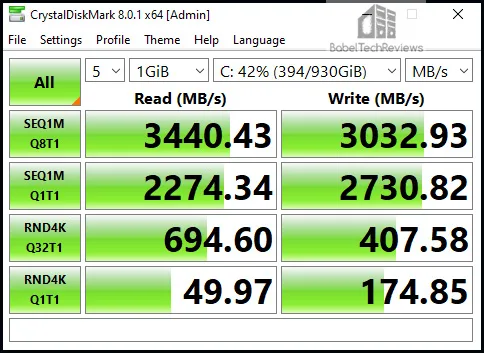
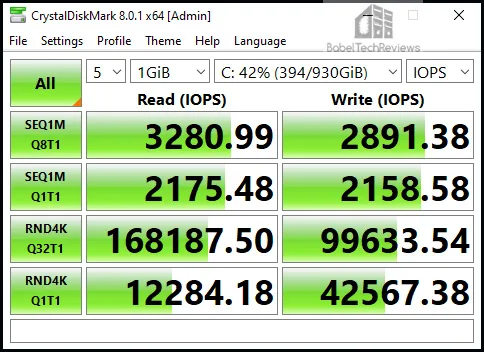
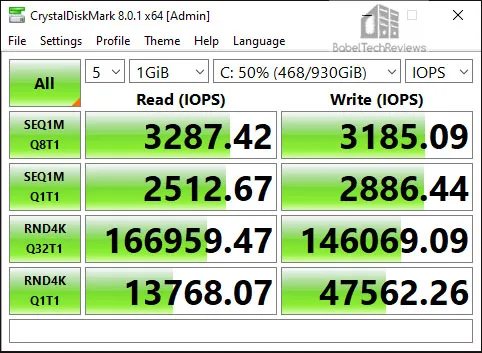
CrystalDiskMark 8.0.1
CrystalDiskMark is a HDD benchmark utility for your drives that measure sequential and random read/write speeds. Here are some key features of “CrystalDiskMark”:- Measure sequential reads/writes speed
- Measure random 512KB, 4KB, 4KB (Queue Depth=32) reads/writes speed
- Results given in IOPS or MB/s


 Here are the CARDEA Ceramic C440 SSD results showing its results next.

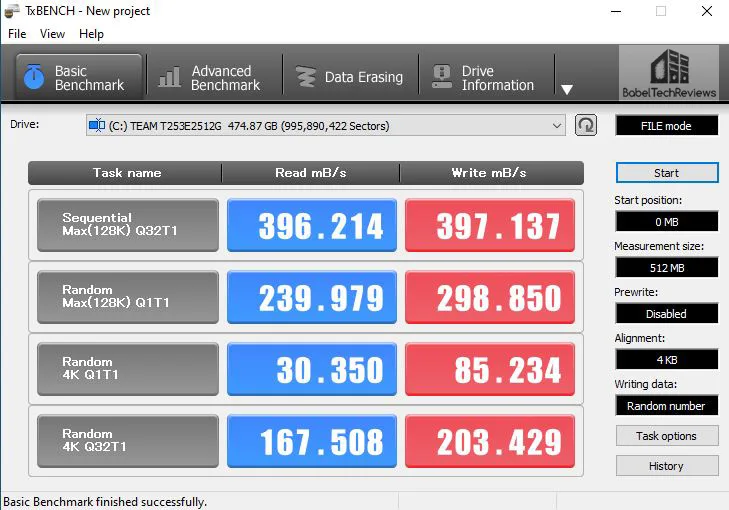
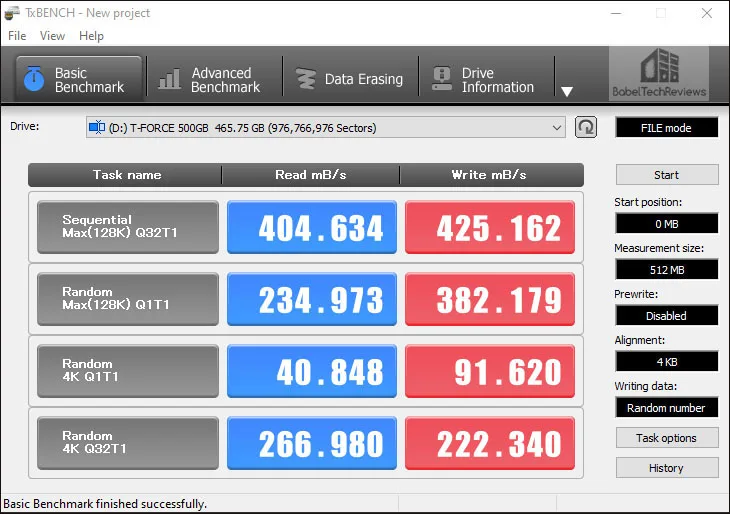
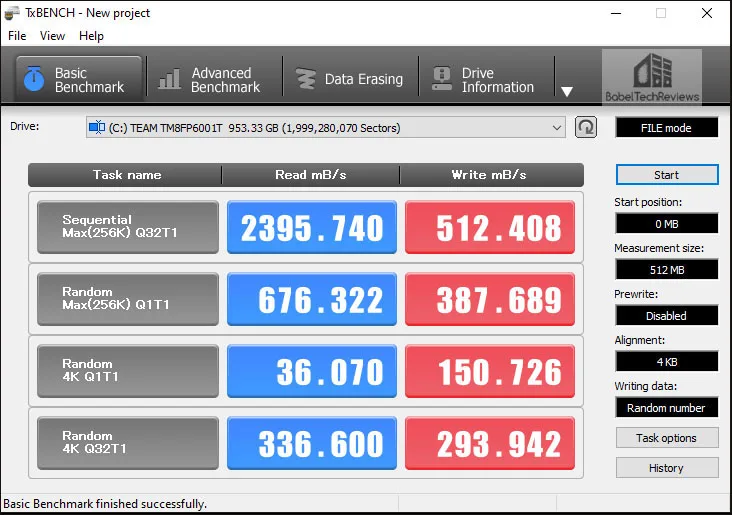
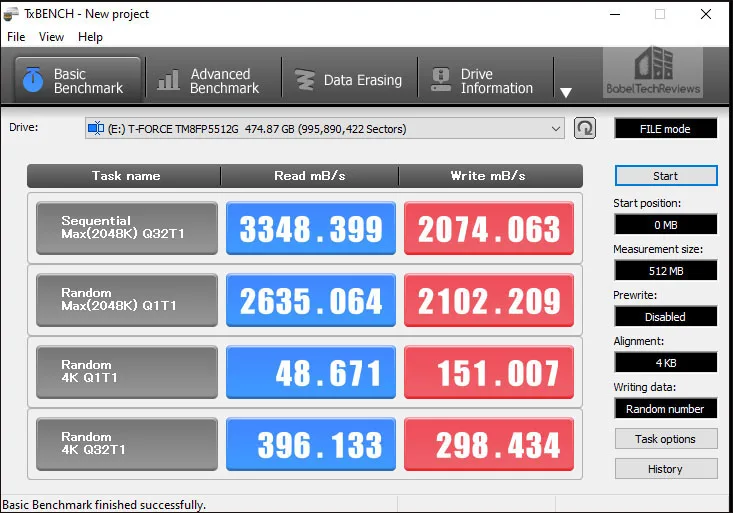
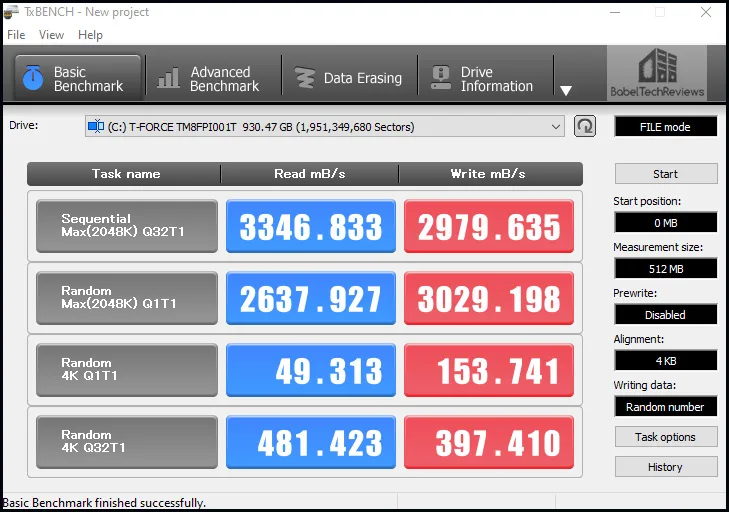
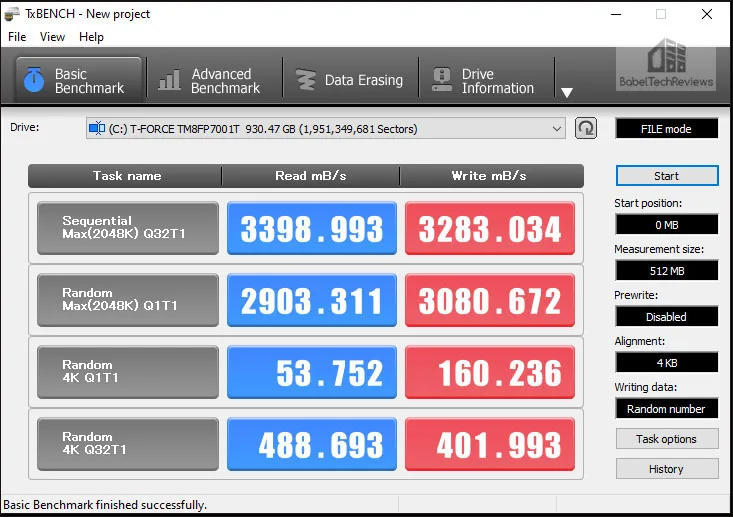
TxBENCH
TxBENCH is similar to CrystalDiskMark but with additional features including secure erase. According to the website, “It not only measures the performance of storage easily but also performs detailed speed measurements based on specified access patterns and long-period speed measurements. It also allows you to see each drive’s supported features, enabled features, and S.M.A.R.T. information.”
First we test the 512MB T-Force EX2 Elite2 SATA III.
Next, we test the 1TB T-Force DELTA MAX SATA III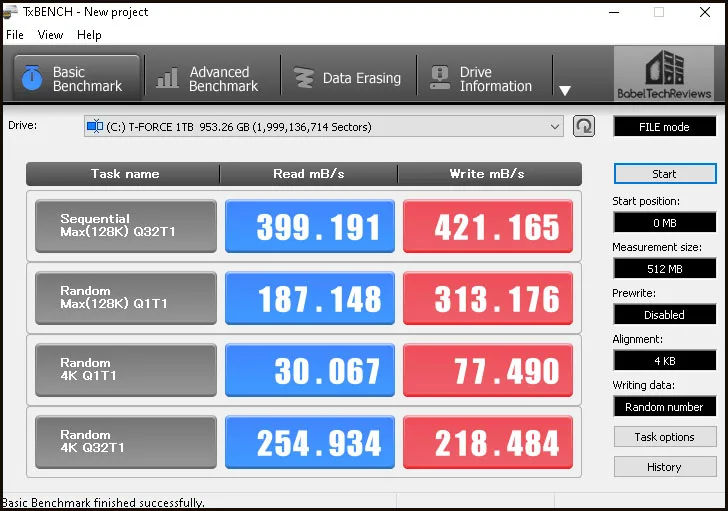

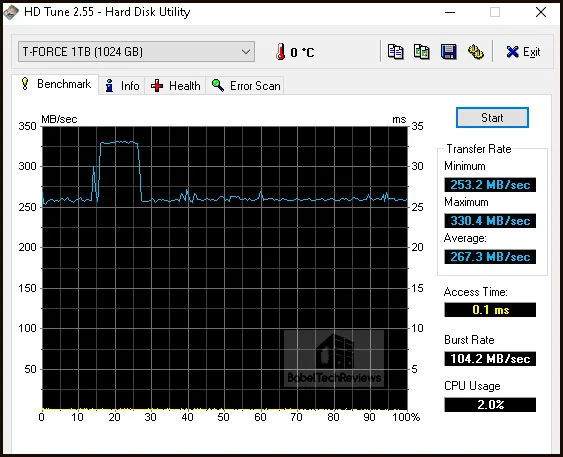
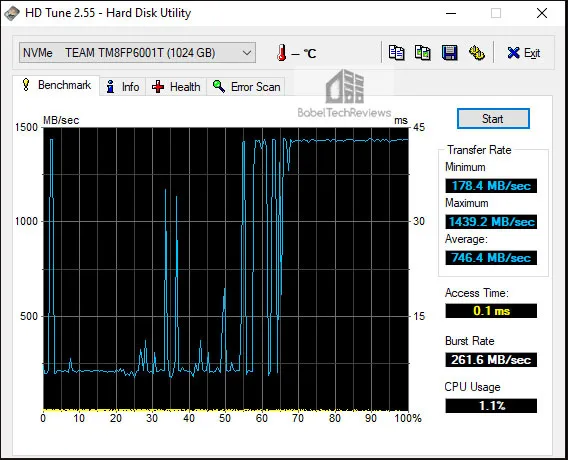
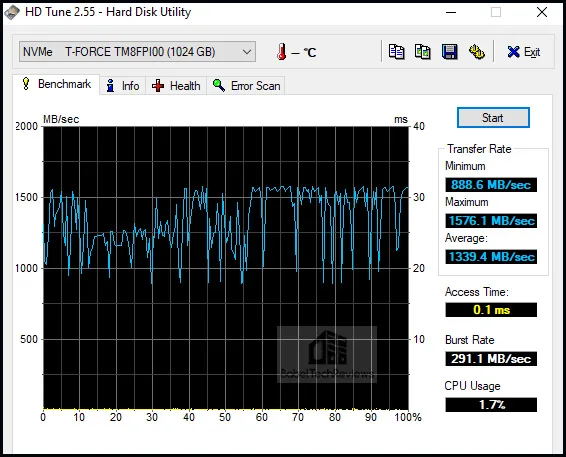
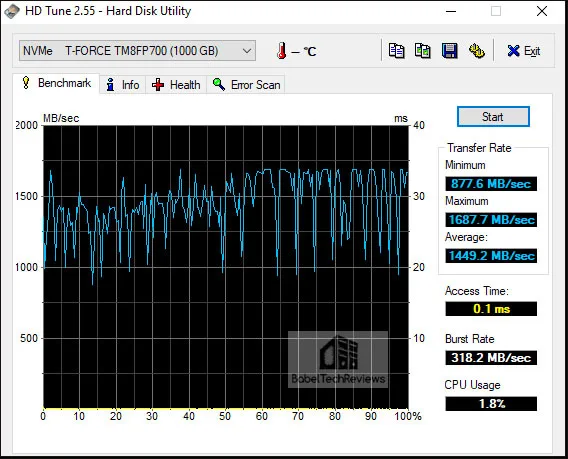
HD Tune
This free standalone synthetic test is old and it doesn’t represent real world performance but it does test some important drive metrics. There is also a pay-for HD Tune Pro which is up-to-date and offers more functionality. We tried the Pro trial recently just to make sure the free version is still relevant. HD Tune has the following functions, and it measures the performance of:- Transfer Rate
- Access Time
- CPU Usage
- Burst Rate
- Random Access test
- Write benchmark
- Hard Disk Health
- S.M.A.R.T. Information (Self-Monitoring Analysis and Reporting Technology)
- Power On Time
- Error scan
- Temperature display


Next, we benchmark using AS SSD.
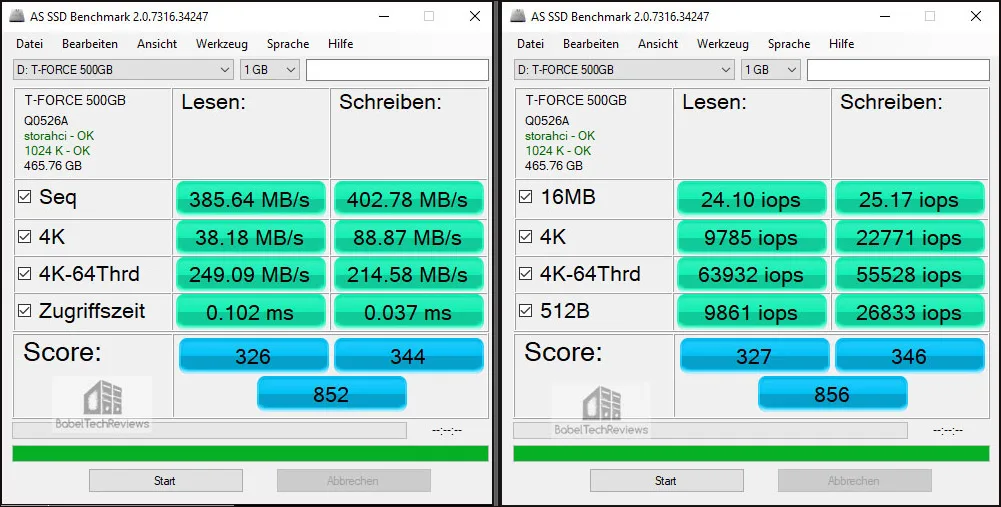
AS SSD
AS SSD is designed for Solid State Drives (SSD). This tool contains synthetic and practice tests. The synthetic tests determine the sequential and random read and write performance of the SSD without using operating system caches. In Seq-test the program measures how long it takes to read and write a 1GB file.
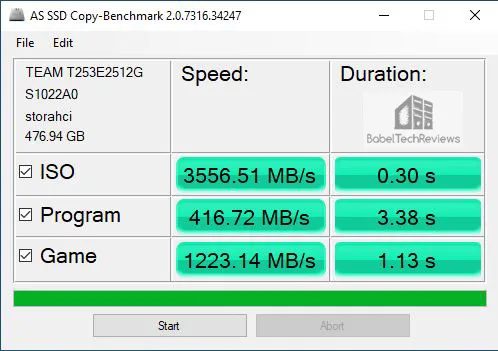
In the 4K test, read and write performance for random 4K blocks are determined. The 4K-64-thrd test are similar to the 4K procedure except that the read and write operations on 64 threads are distributed as in the usual start of a program. For the copy test, two large ISO file folders are created, programs with many small files, and a games folder with small and large files. These three folders are copied by the OS copy command with the cache turned on. AS SSD gives an overall score after it runs the benchmarks.
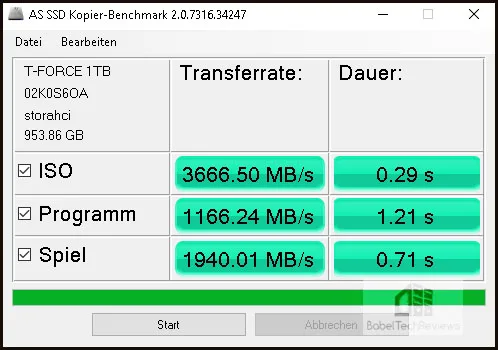
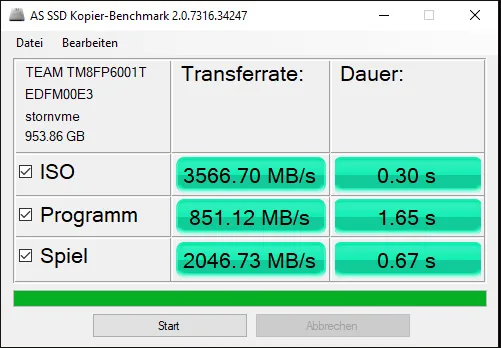
Here are the 512mB T-Force EX2 Elite SATA III AS SSD results showing the results in MB/s next to IOPS, and below, the copy speeds.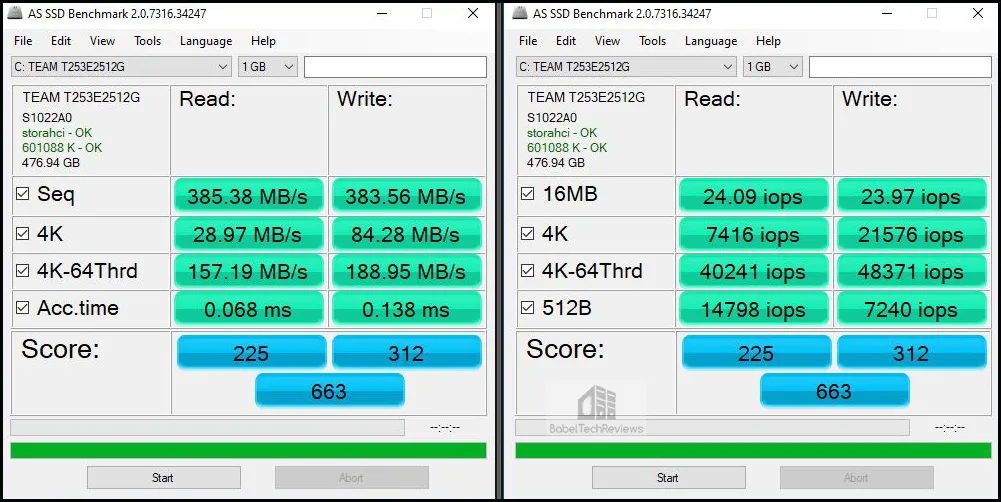
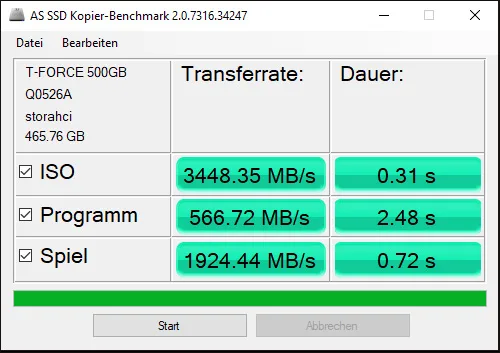
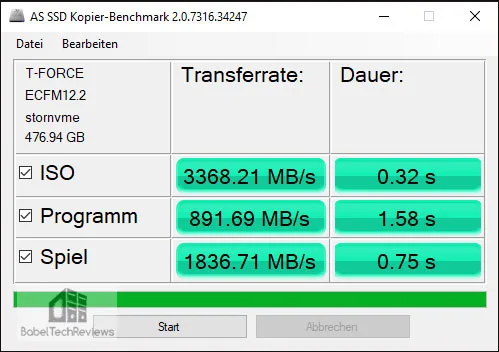
Here are the 1TB T-Force DELTA MAX SATA III AS SSD results also showing MB/s next to IOPS and below them, copy speeds.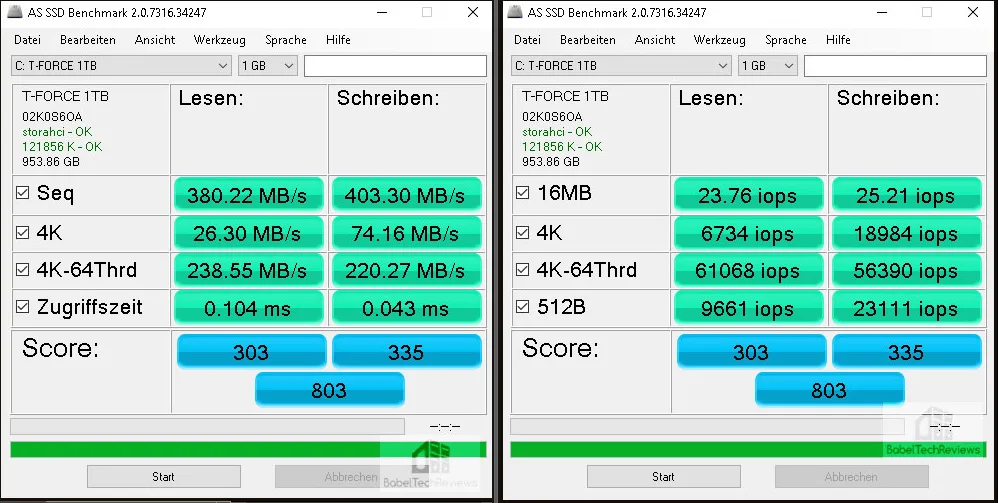
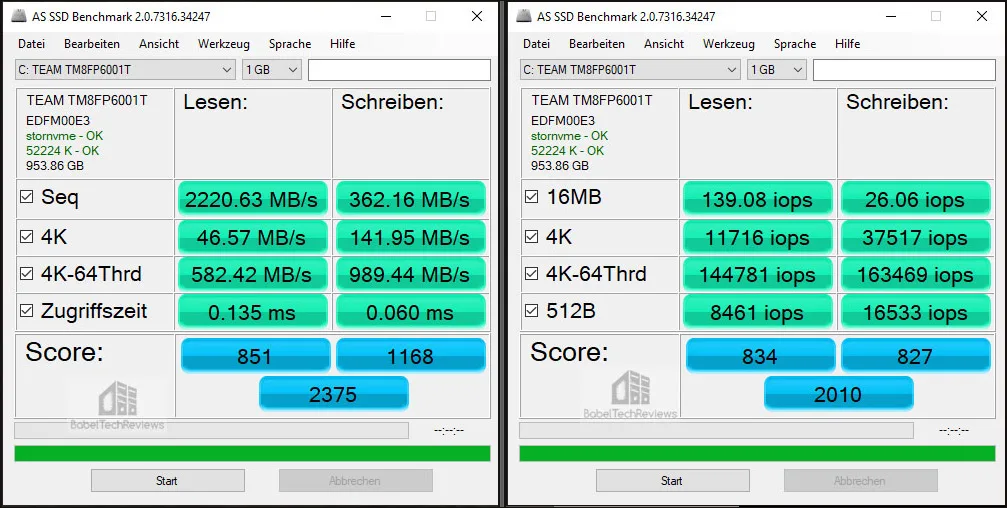
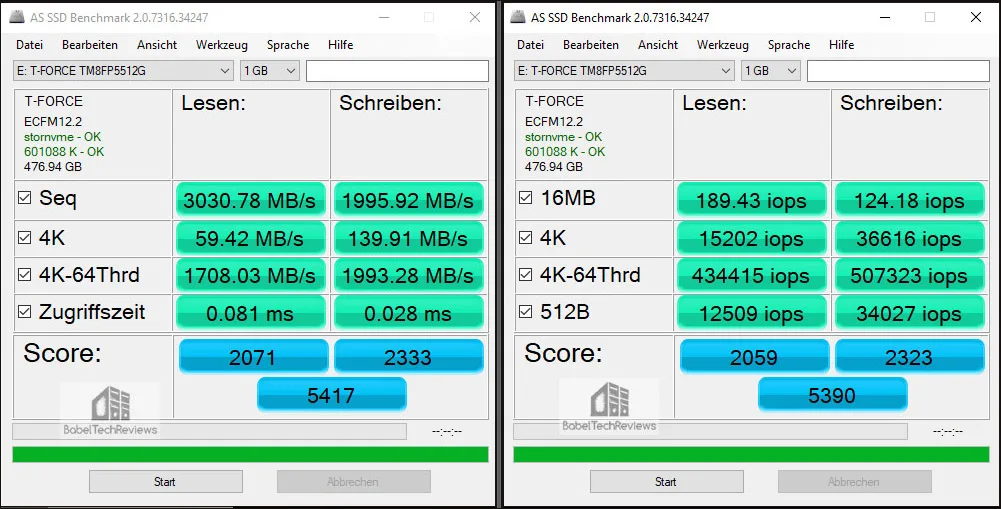

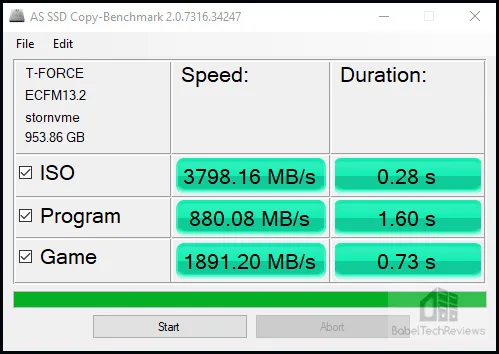
Finally, here are the T-FORCE CARDEA Ceramic C440 AS SSD results.
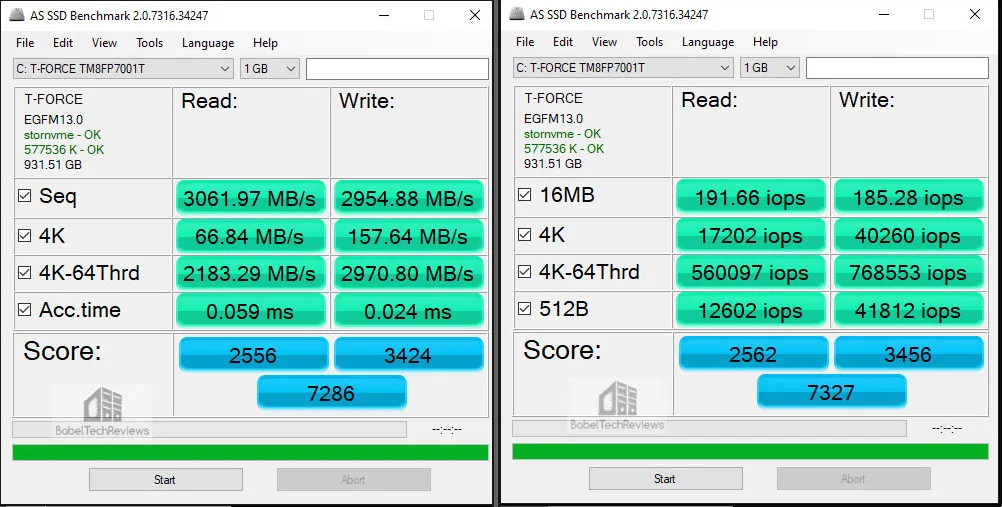
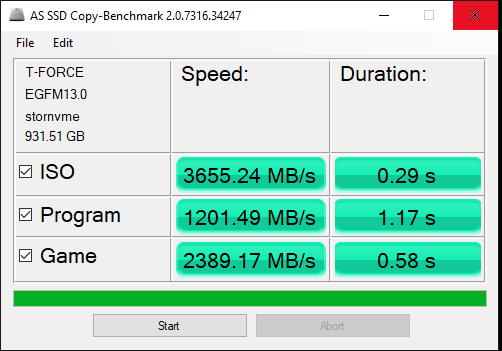
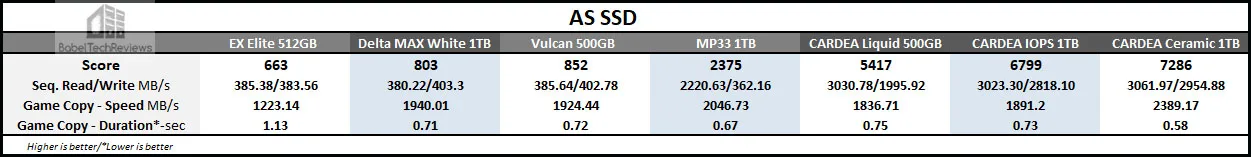
Again, the CARDEA Ceramic C440 stands out even though it’s bandwidth is limited by Intel’s latest enthusiast motherboards which brings it’s performance just ahead of the IOPS. The CARDEA Liquid has a slower Write speed, but it is much faster than the MP33 or the Vulcan SATA SSD which again edges out the DELTA MAX and the EX2 SSD which is in last place. Game copy speeds are generally closer for all tested SSDs.
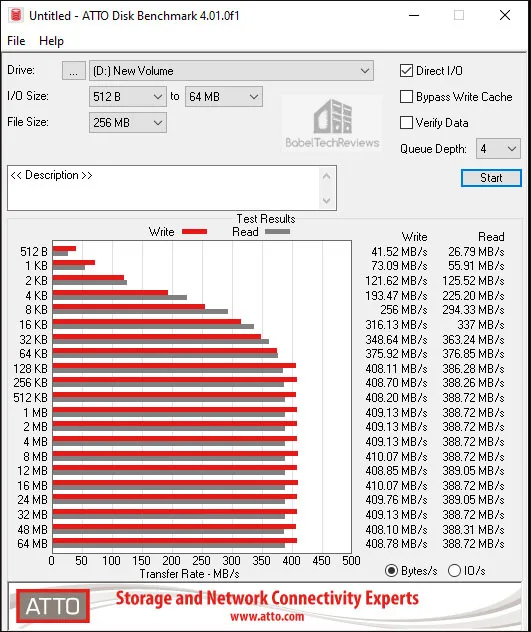
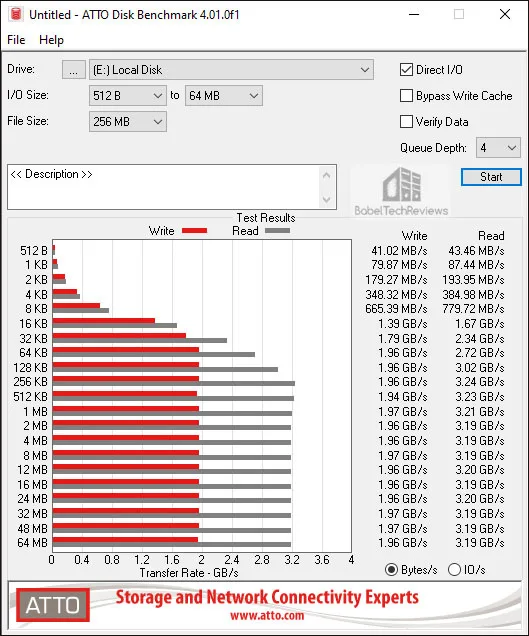
Next up, ATTO.
ATTO
ATTO is a low level hardware benchmark for random access read/write storage devices including for SSDs and HDDs. HD Tach uses custom device drivers and low level Windows interfaces to determine the physical performance of the device.
The T-FORCE EX2 Elite 512MB SATA III ATTO results are first.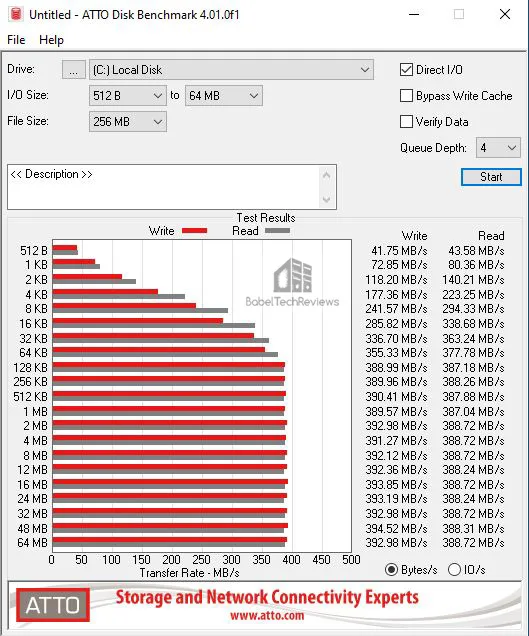 The T-FORCE DELTA MAX SATA III ATTO results are presented next.
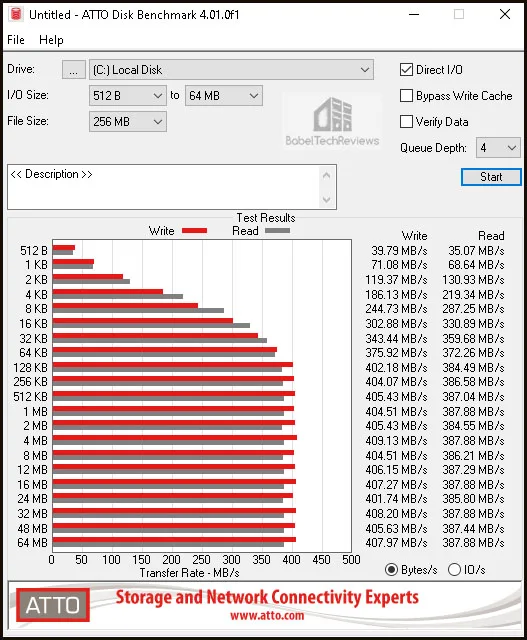
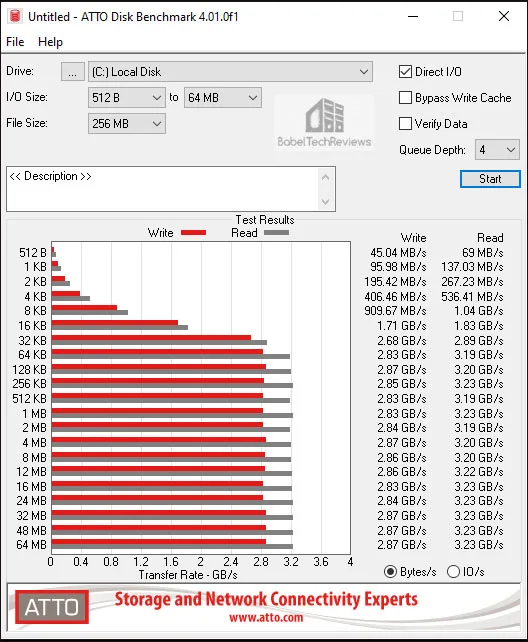
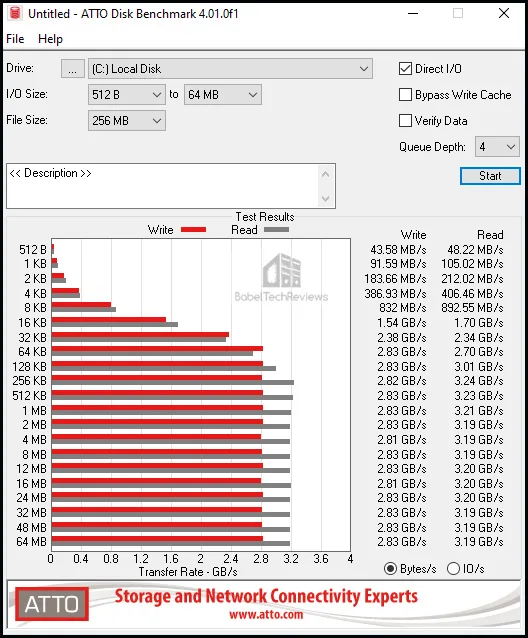 Finally, the T-FORCE CARDEA Ceramic C440 ATTO results are presented last.
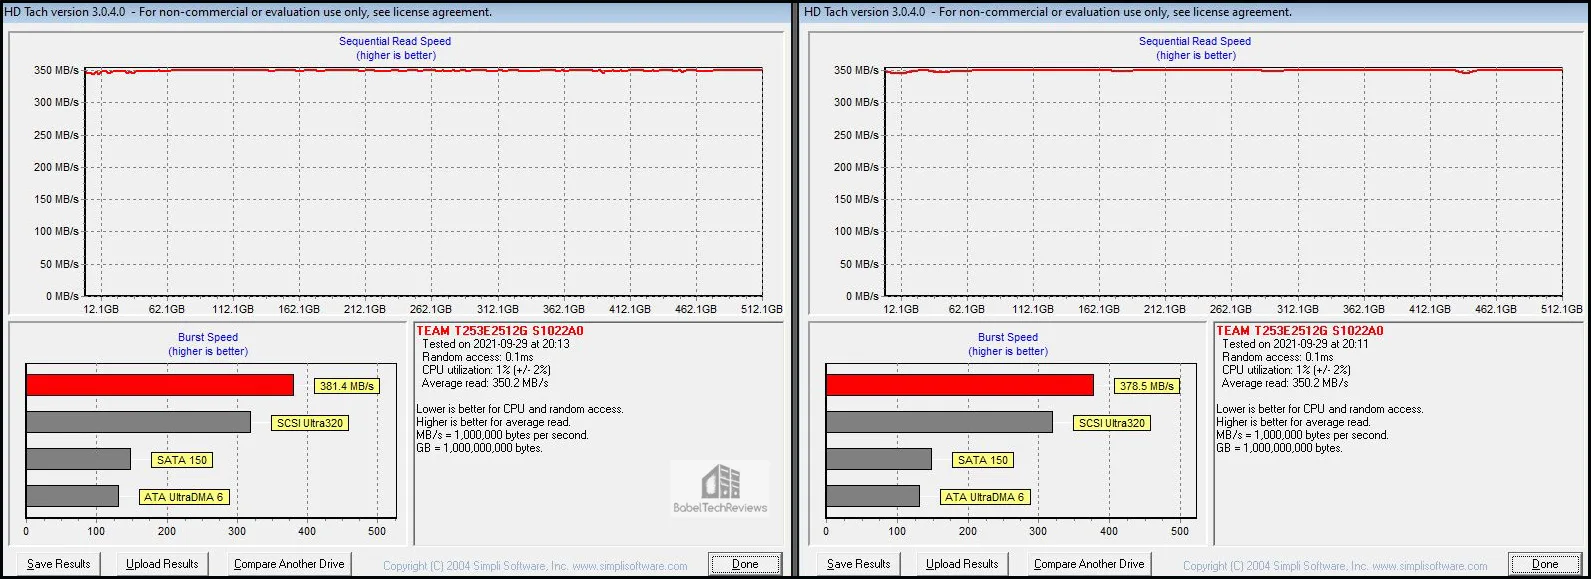
HD Tach is up next.
HD Tach
HD Tach is a low level hardware benchmark for random access read/write storage devices that was developed by Simpli Software. HD Tach uses custom device drivers and low level Windows interfaces to determine the physical performance of the device. It is no longer supported and needs to be run in compatibility mode for Windows 10.
We present the benchmarks first with the Quick benchmark (8MB zones) on the left and the Long benchmark (32MB zones) on the Right.
Here are the EX2 Elite SATA III HD Tach results with an average read of 350.2MB/s for the Quick bench and 350.2MB/s for the Long bench.
The DELTA MAX SATA III HD Tach results give an average read of 273.5MB/s for the Quick bench and 272.8MB/s for the Long bench. 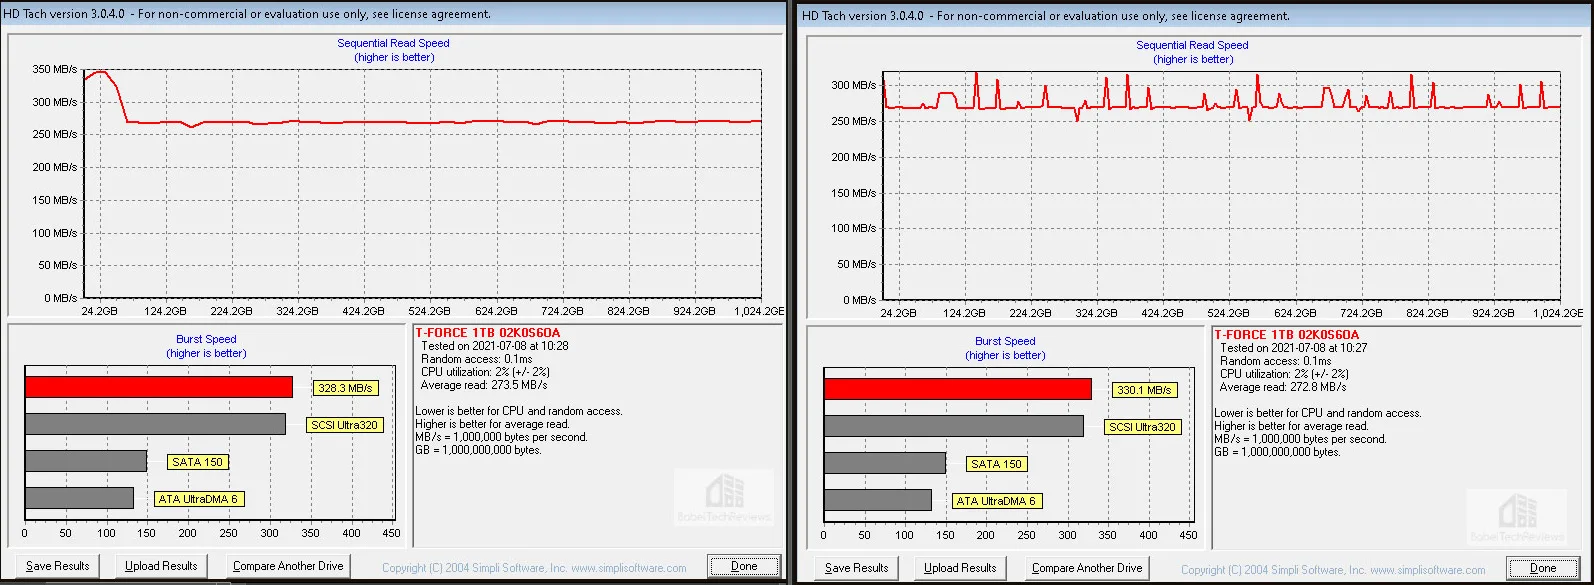 Here are the T-FORCE Vulcan SATA HD Tach results with an average read of 346.4MB/s for the Quick bench and 346.3MB/s for the Long bench.
 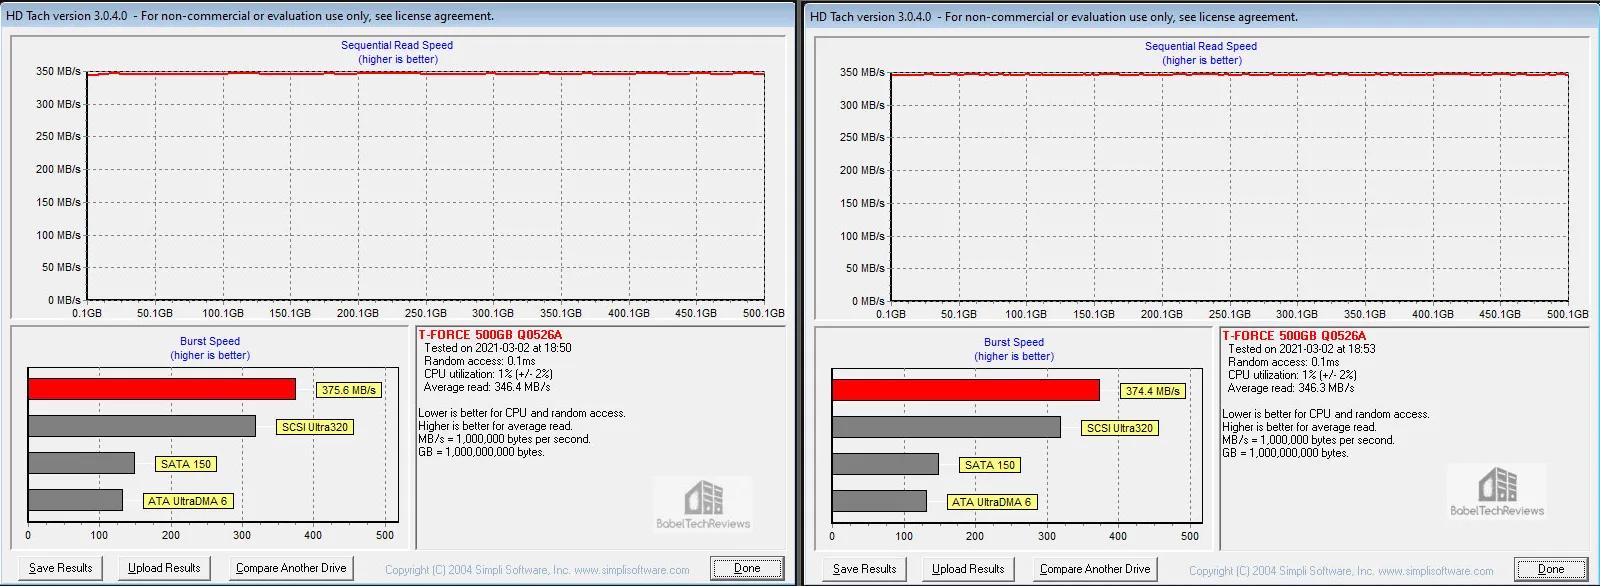 Next, the TeamGroup MP33 HD Tach results with an average read of 766.3MB/s for the Quick bench and 791.9MB/s for the Long bench.
 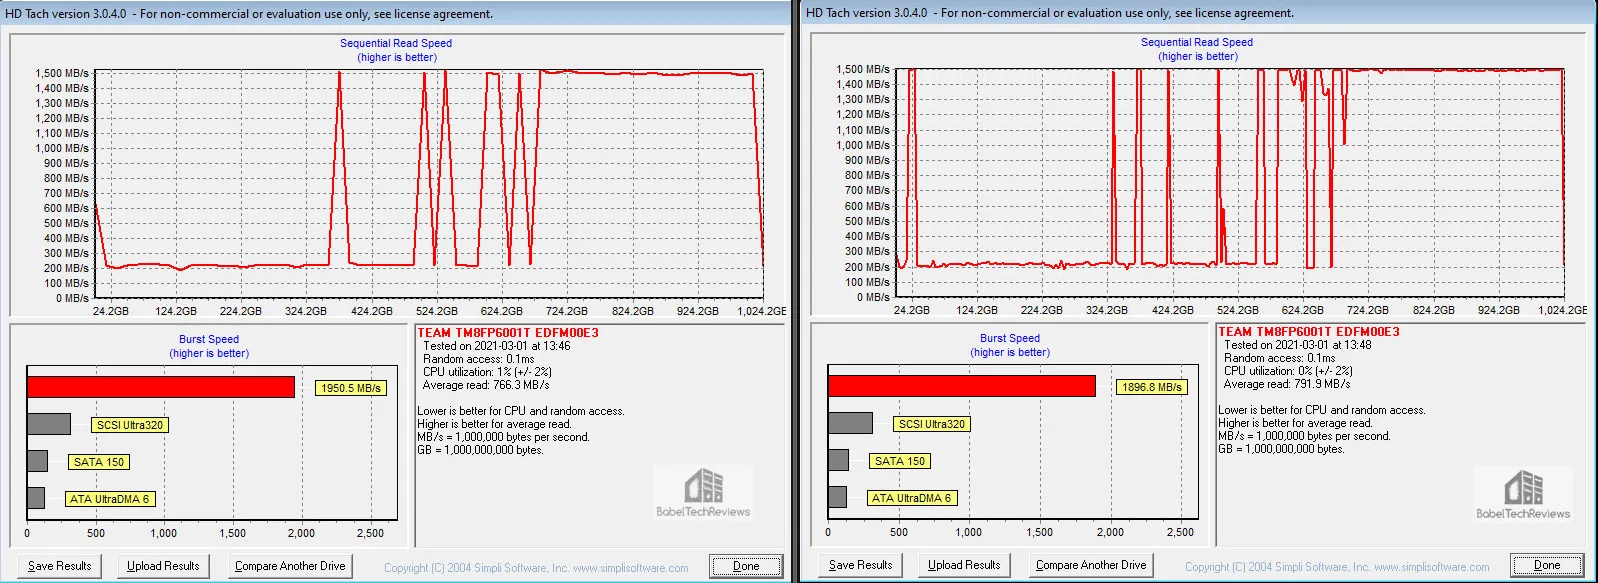 Here are the T-FORCE CARDEA Liquid with an average read of 1529.9MB/s for the Quick bench and 1474.7MB/s for the Long bench.
 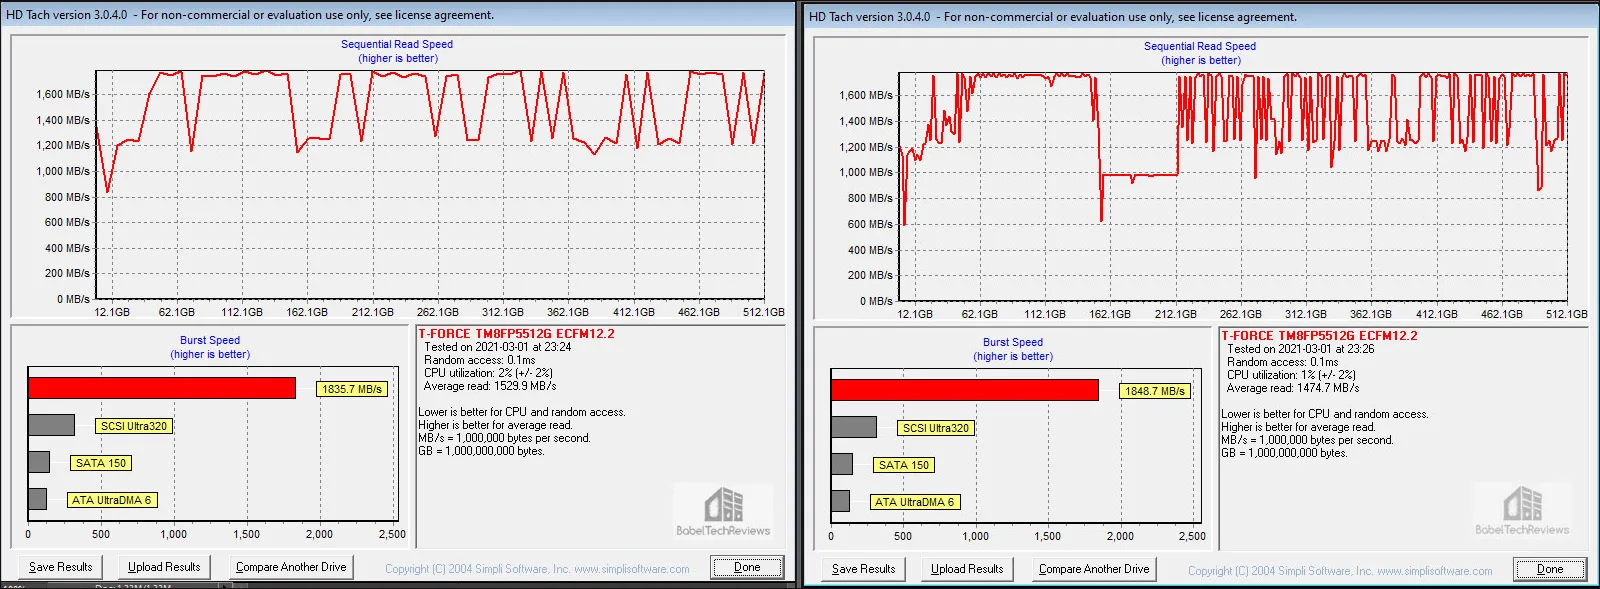 Below are the T-FORCE CARDEA IOPS HD Tach results with an average read of 1508.4MB/s for the Quick bench and 1470.1MB/s for the Long bench.
 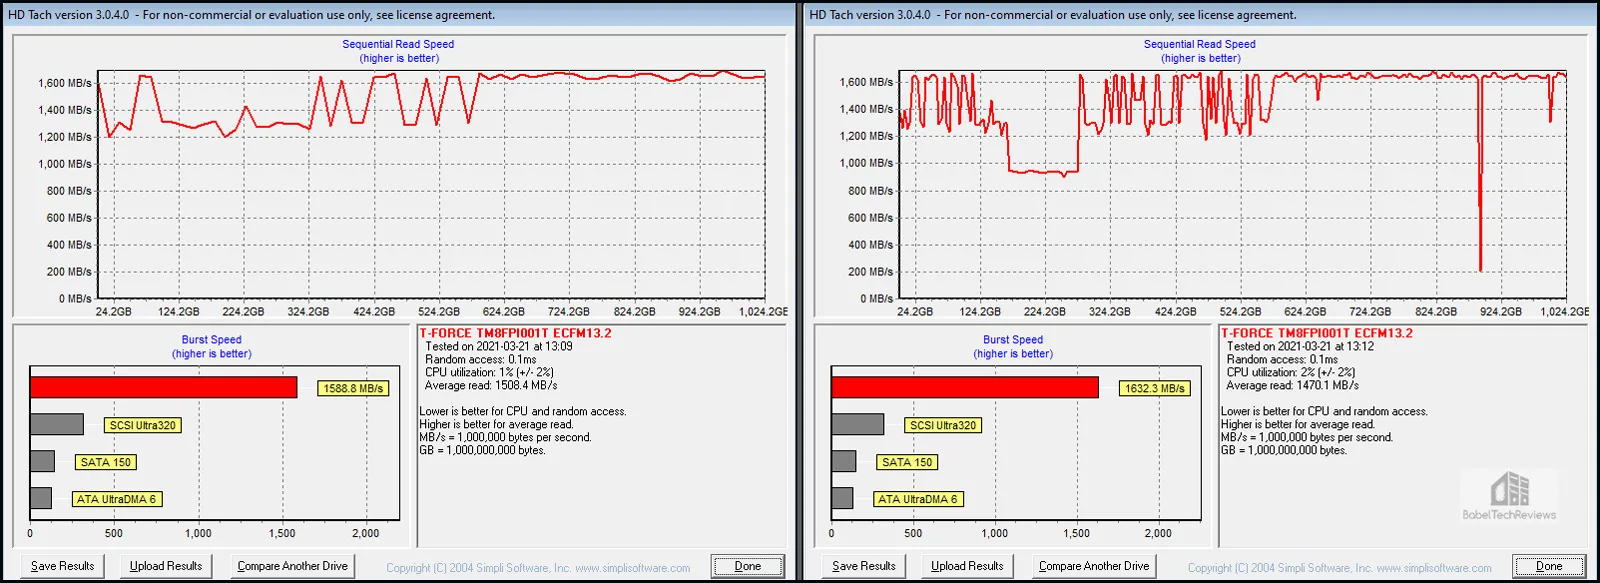 Finally, here are the T-FORCE CARDEA Ceramic C440 HD Tach results with an average read of 1600.1MB/s for the Quick bench and 1553.4MB/s for the Long bench.
 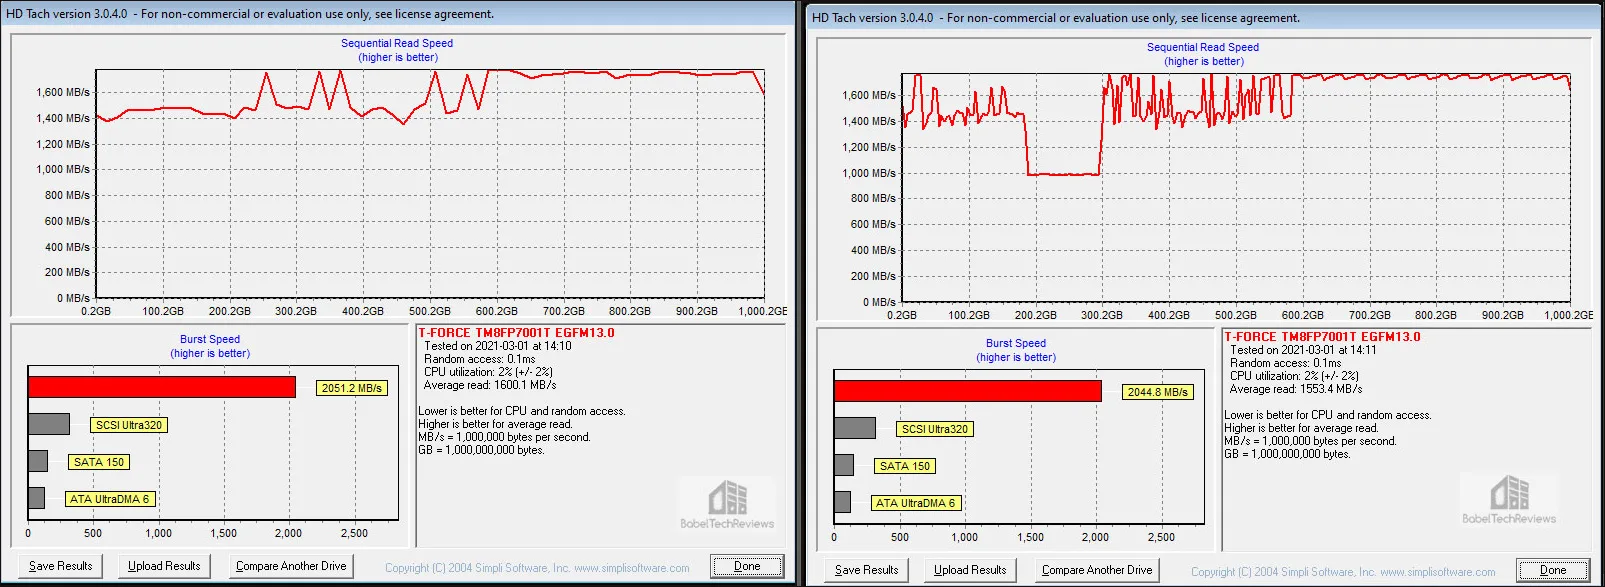 Here are the HD Tach Disk benches summarized in a chart comparing our five drives. For read speeds, higher is better but for access times, lower is better.
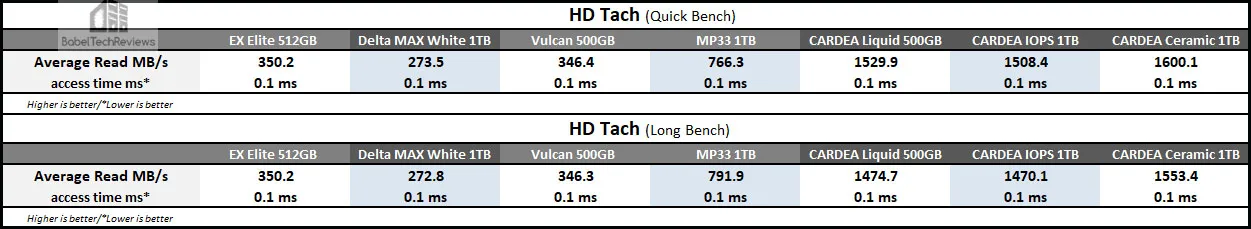
The CARDEA Ceramic C440 again scores the fastest in HD Tach, and the Cardea Liquid is next followed closely by the IOPS, then by the MP33 SSD while the SATA III SSDs take the last two places where the EX2 is faster than either the Vulcan SSD or the DELTA MAX .
Next we look at game/level loading speeds.
The Game/Level Loading Timed Results
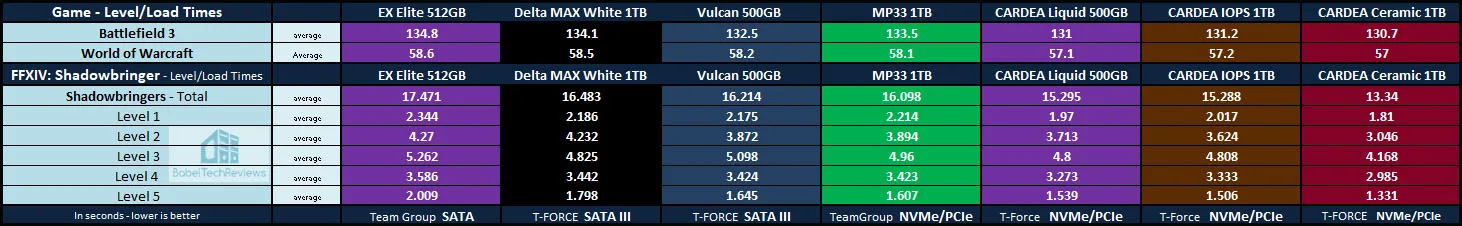
Game and game level loading time results are difficult to measure precisely but generally SSDs perform similarly with regard to game loading times and they load significantly faster than any HDD. Even SSHDs require loading the same level or program over-and-over to get quicker. We tested 3 games using the World of Warcraft and Battlefield 3 loading times again as measured precisely by PCMark 8’s storage test as well as 5 levels and overall loading times accurately by using the Final Fantasy XIV: Stormbringer benchmark.
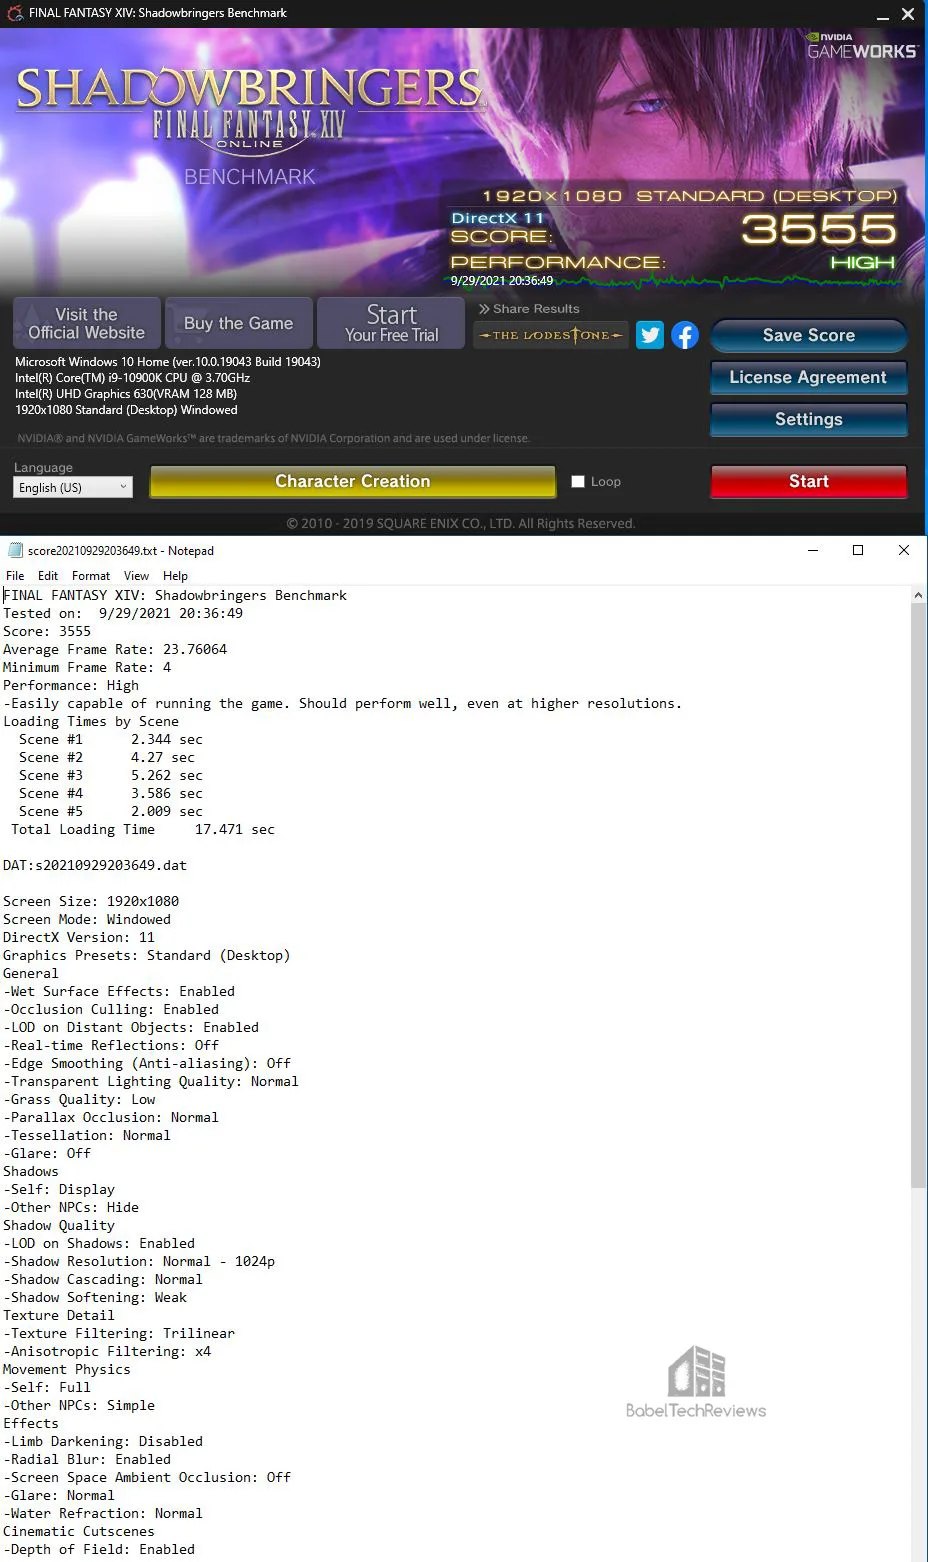
Let’s start with the Stormbringer benchmark – first with the EX2 Elite SATA III. Total Loading times are 17.471 seconds.
Next up, the Stormbringer benchmark with the DELTA MAX SATA III. Total Loading times are 16.483 seconds. 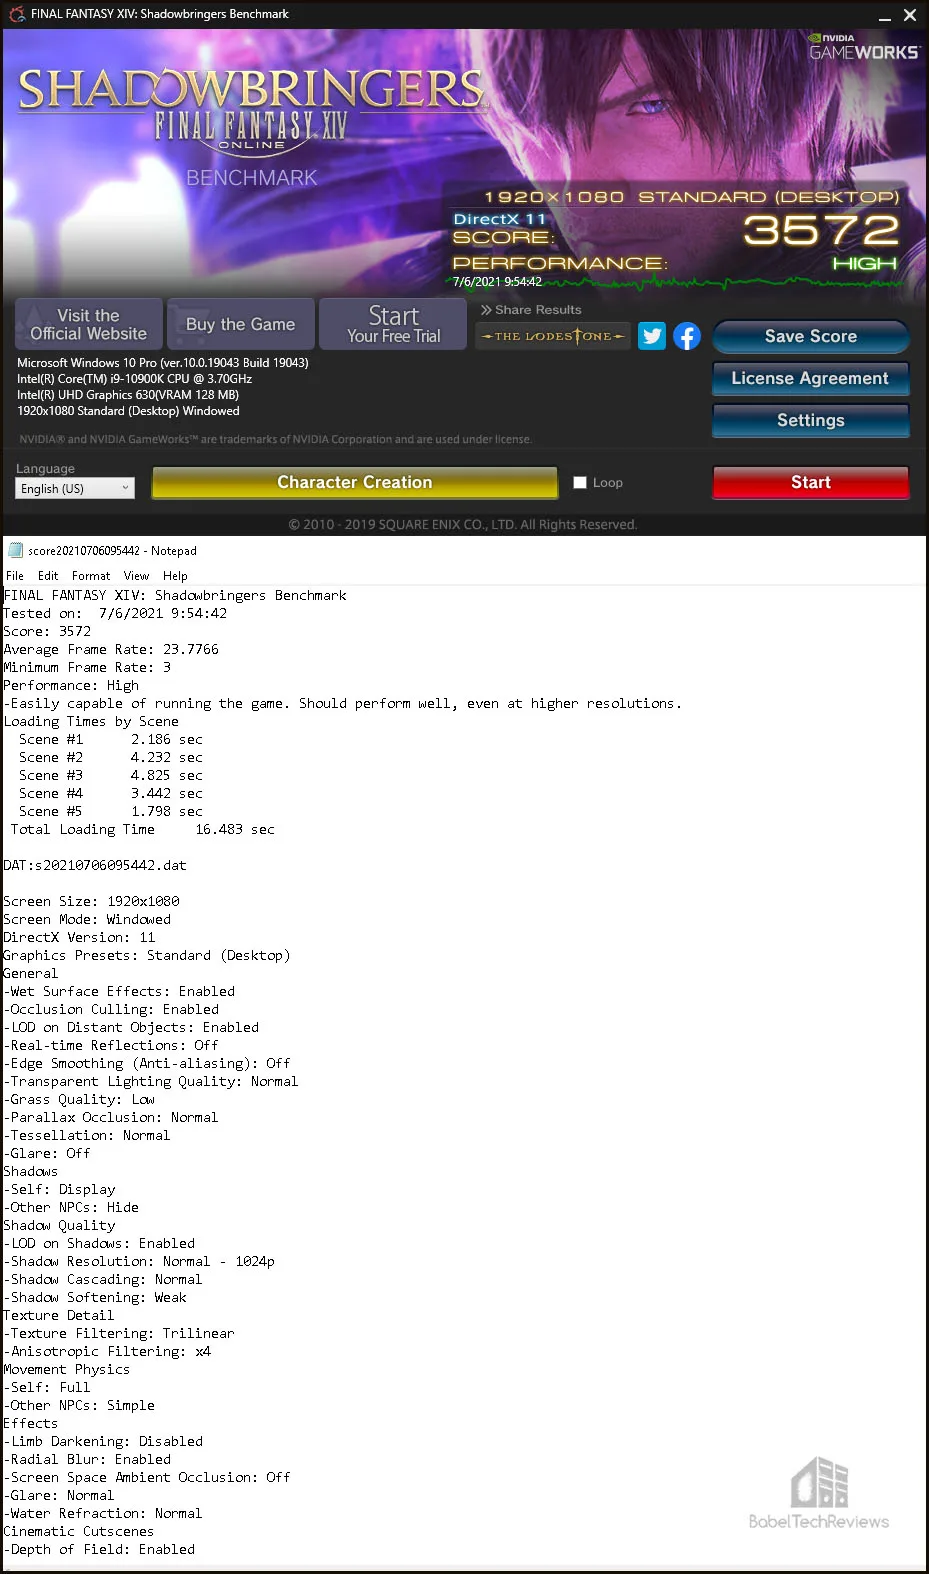 Now the Vulcan SATA III SSD with total loading times of 16.214 seconds.
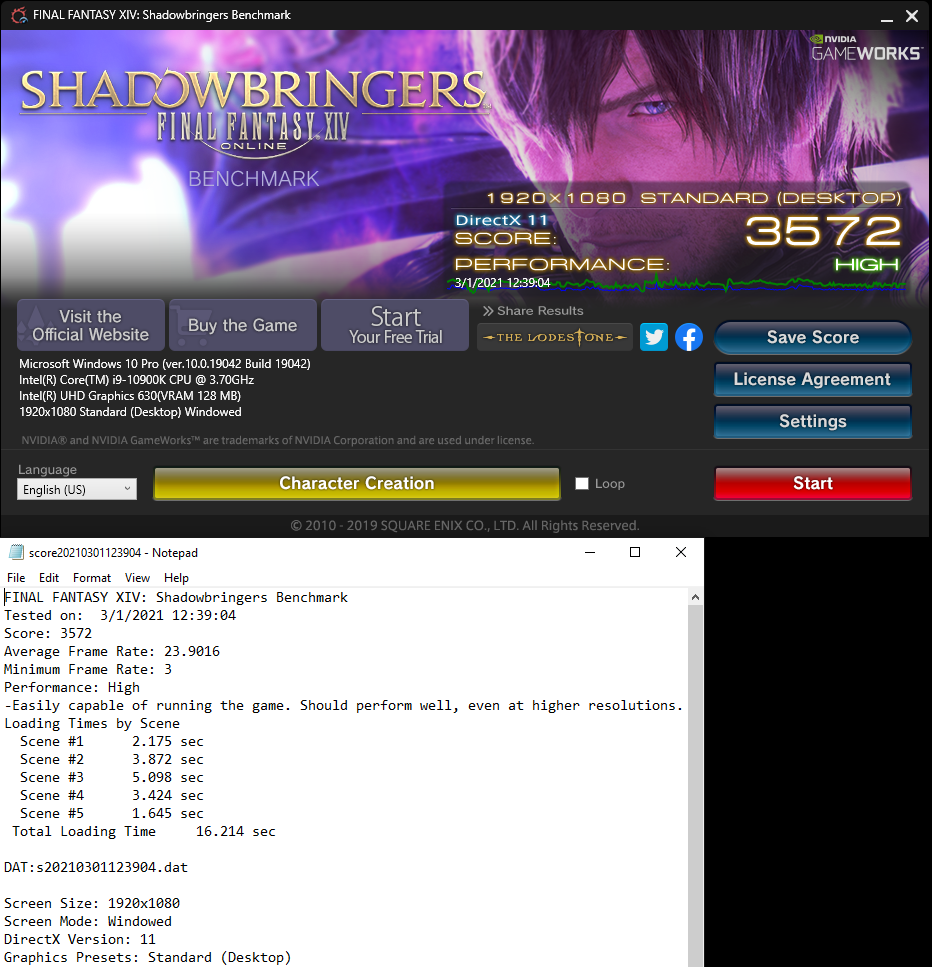 Below are the MP3 SSD results with total Loading times of 16.098 seconds.
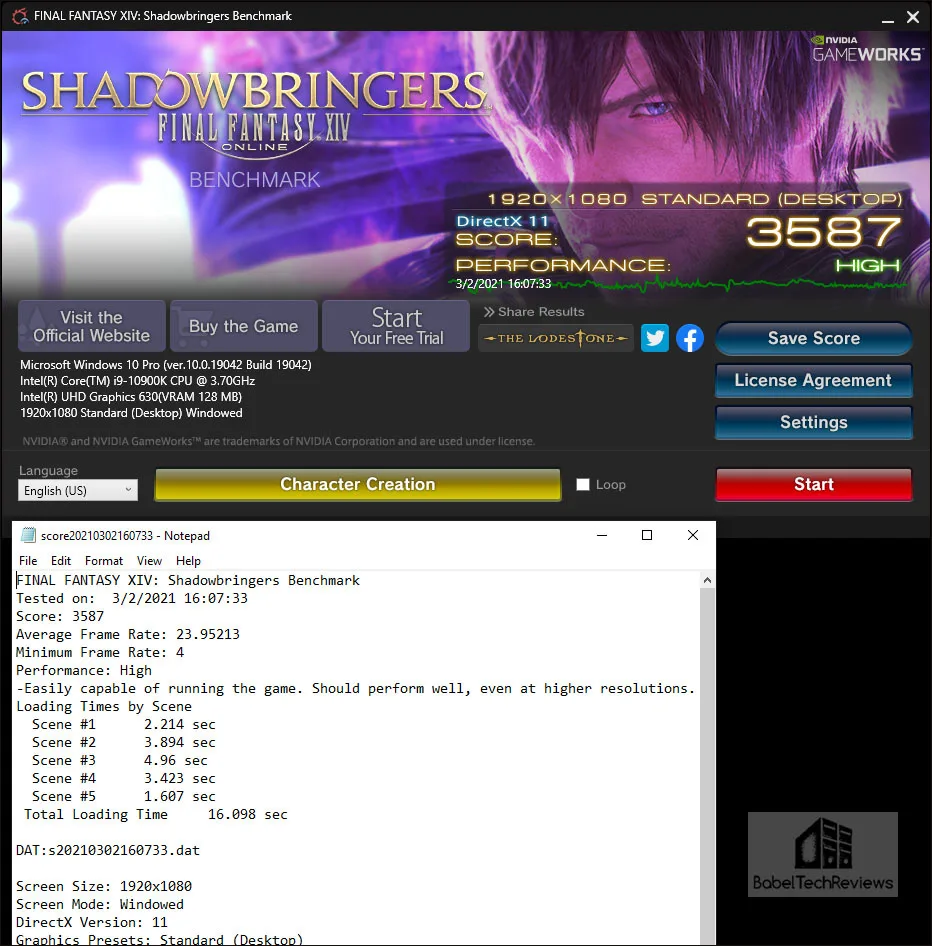 Next, the CARDEA Liquid SSD‘s total Loading times are 15.295 seconds.
 Here are the Stormbringer benchmark results with the CARDEA IOPS SSD. Total Loading times are 15.288 seconds.
 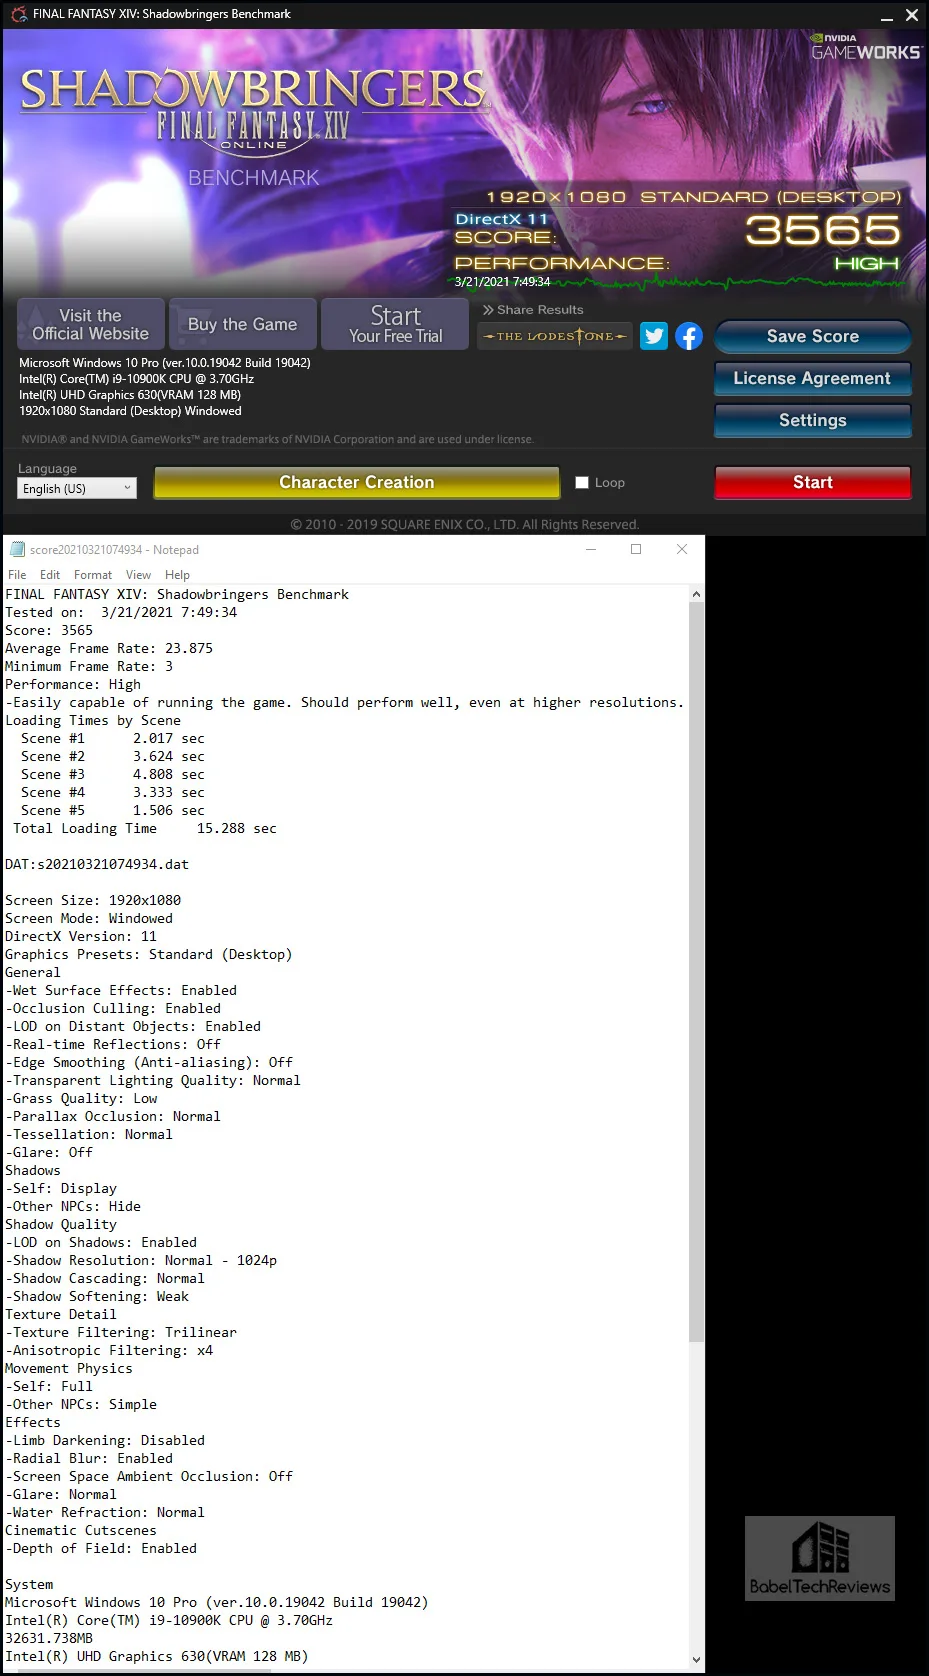 Below are the Stormbringer benchmark using the CARDEA Ceramic NVMe PCIe SSD and the total Loading times are 13.34 seconds.
 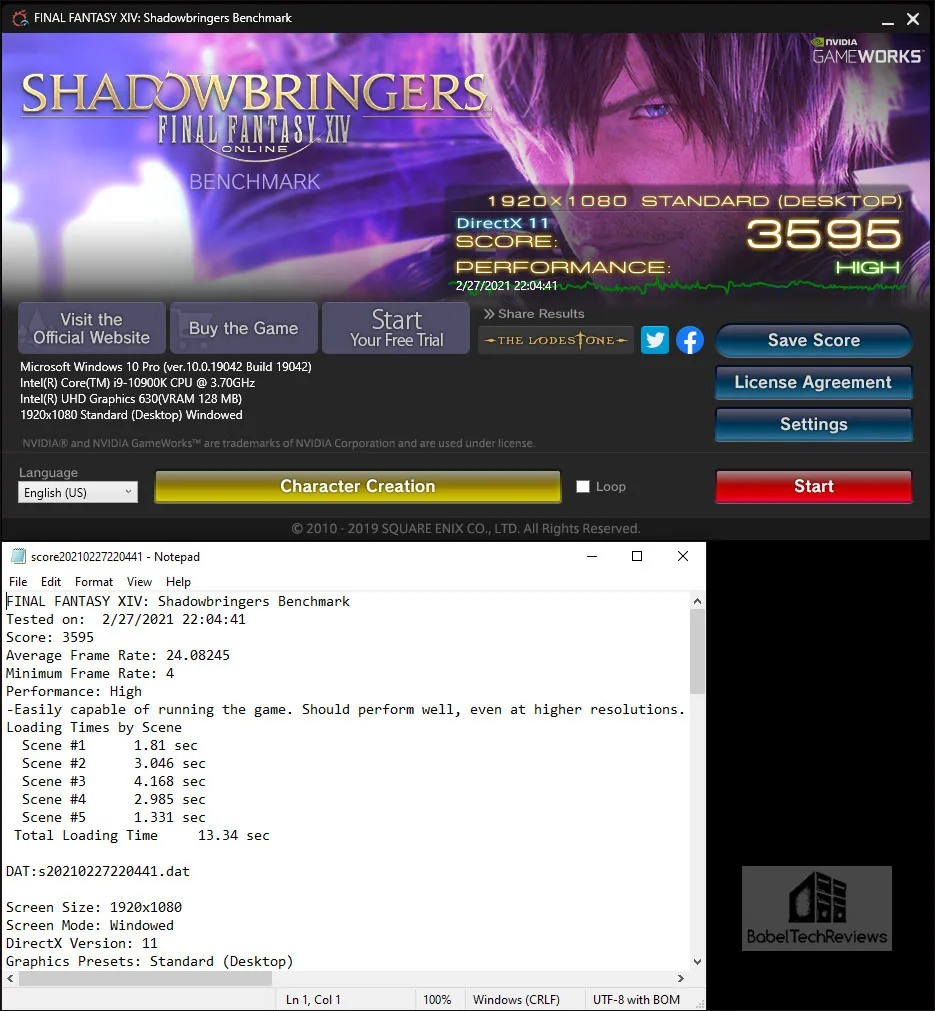 Below is the summary chart comparing the total loading times for each SSD including each of its 5 levels. Lower times in seconds are better which means the game or level will load more quickly and you will not have to wait as long to begin or to get back into the game.
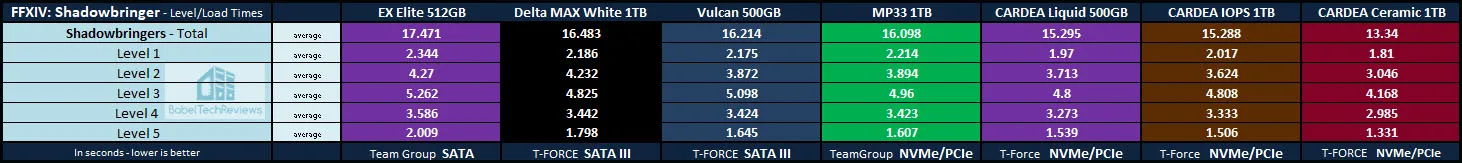 The EX2 is the slowest SSD for loading levels.
Let’s also use the newer Endwalker benchmark using the EX2 Elite SATA III. Total Loading times are 17.794 seconds.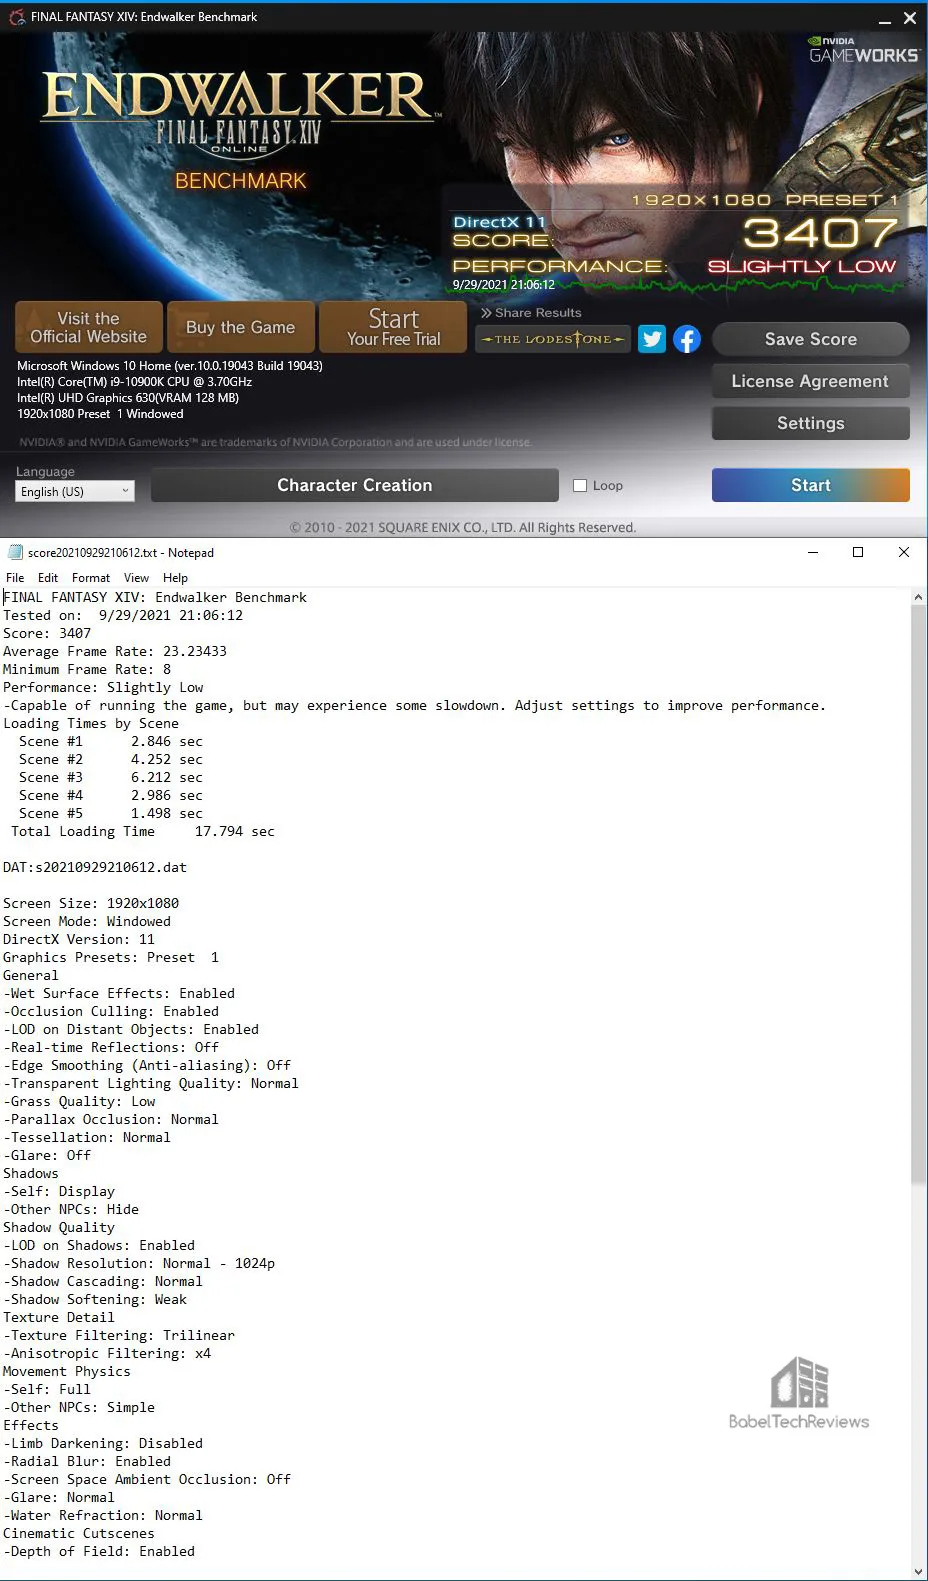
We also used the Endwalker benchmark with the MP33 NVMe SSD . Total Loading times are 16.389 seconds.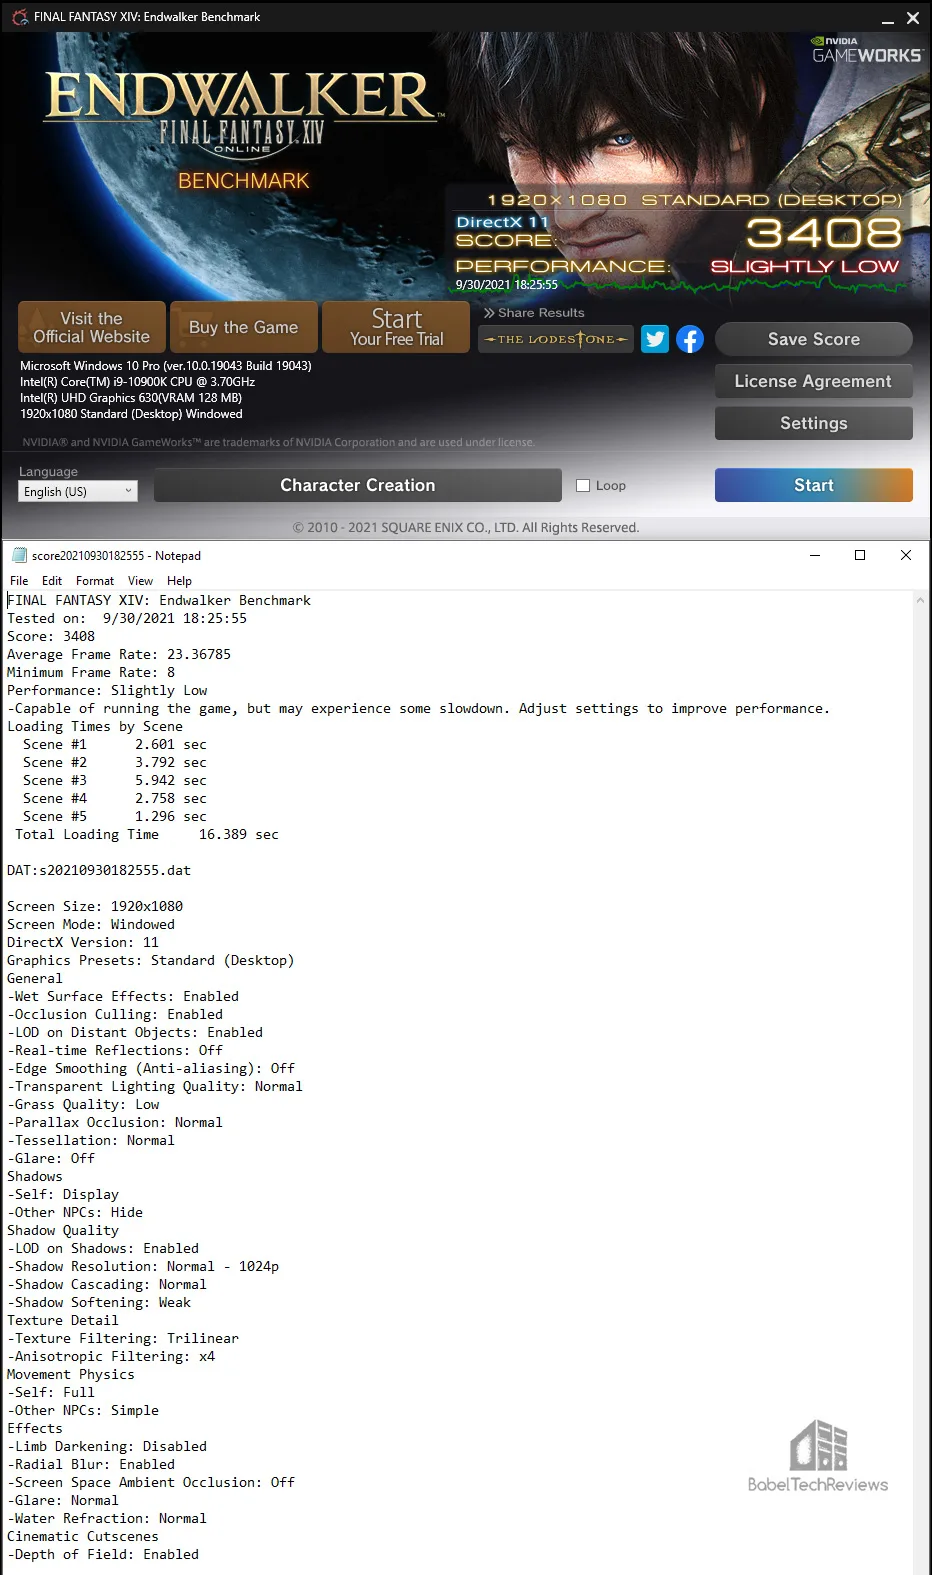
For Endwalker, our slowest game-loading SSD, the EX2 Elite, takes about 1.4 seconds longer to load than our entry-level PCIe NVMe SSD. All of the SSDs we tested load games quickly and there is very little difference between them although the CARDEA Ceramic C440 is the fastest followed by the CARDEA IOPS and Liquid SSDs, then the MP33 and finally by the SATA III SSDs.
Until developers start to target SSDs for game storage, or perhaps after this new generation of consoles have moved away from hard disk drives, we may see SSDs achieve the game loading performance they are capable of on Windows. However, faster is better when a gamer is waiting to get back into a game. Lets look at file copy speeds next.
File Copy
File copy speeds are important to gamers especially when they want to quickly transfer their game files from one location to another.
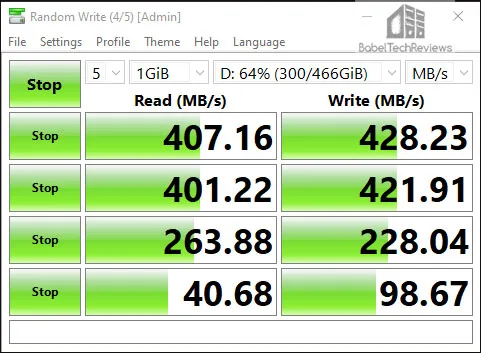
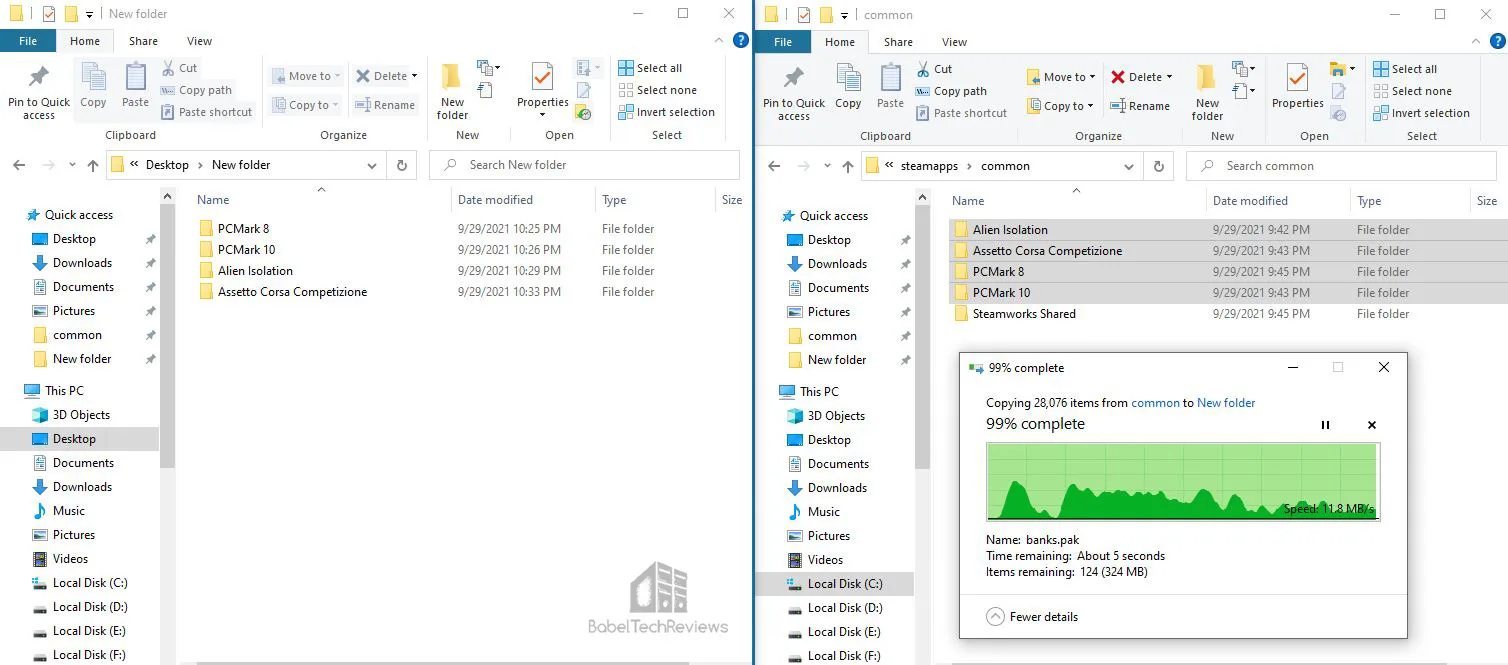
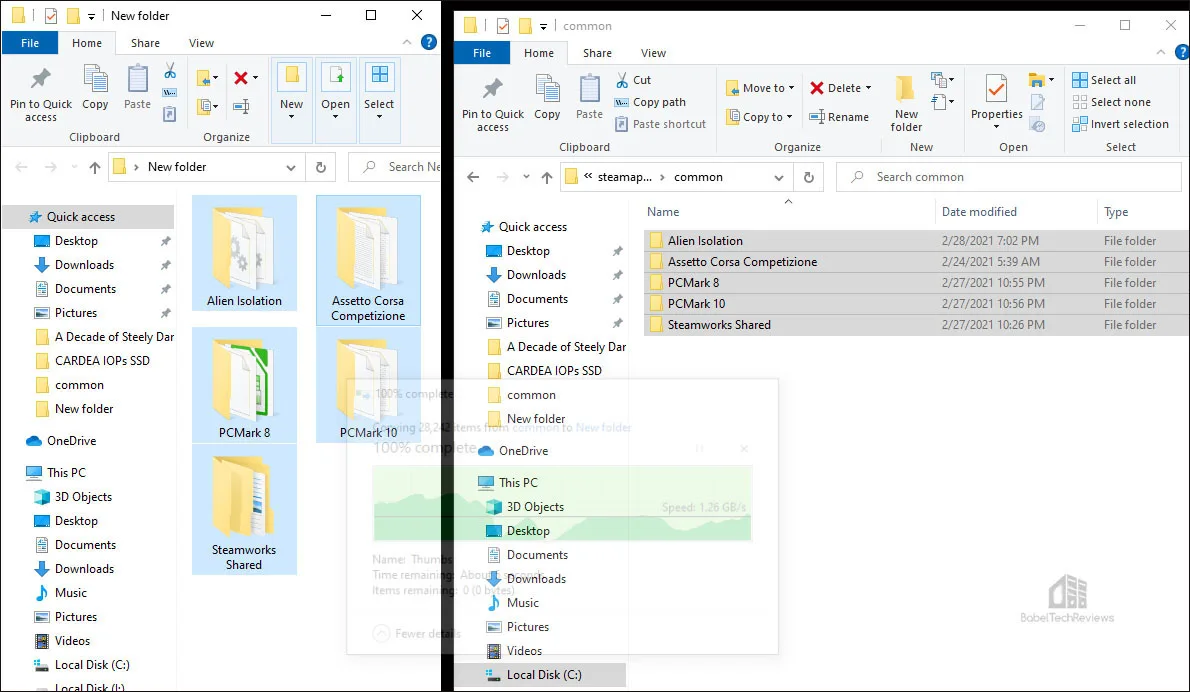
First we copy a 22.8GB folder containing Alien Isolation from its Steam folder to a desktop folder which is something we do regularly when setting up Steam games on multiple PCs. Pay careful attention to the charts (in green) that show the consistency and speed of file copies. They tend to show the ups and downs where each SSD runs out of cache and how long it takes to empty it and refill it.
22.8GB File Copy

The EX2 Elite 512MB SATA III SSD took 2 minutes and 22.0 seconds. to copy 22.8GB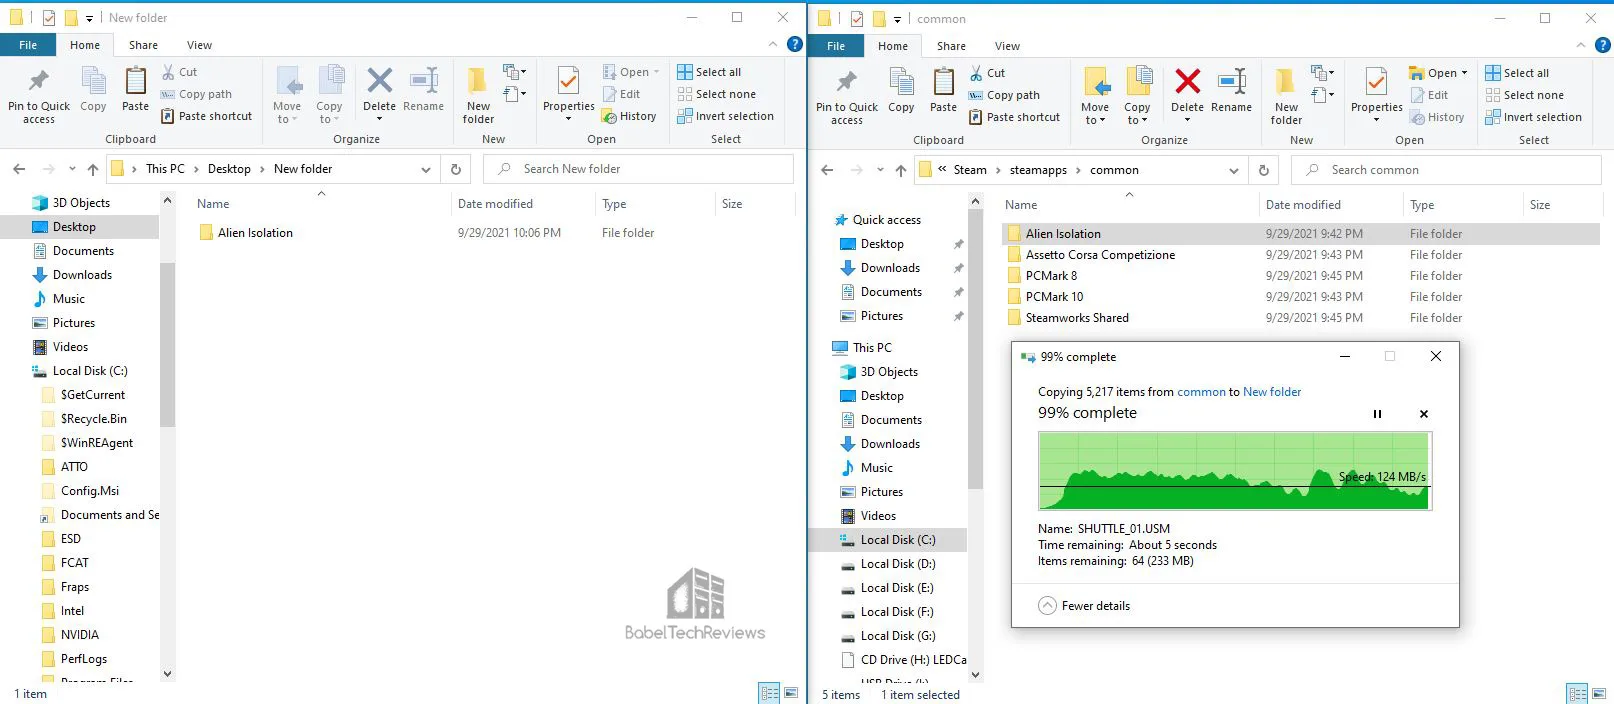
The DELTA MAX took 2 minutes and 27.7 seconds. to copy 22.8GB 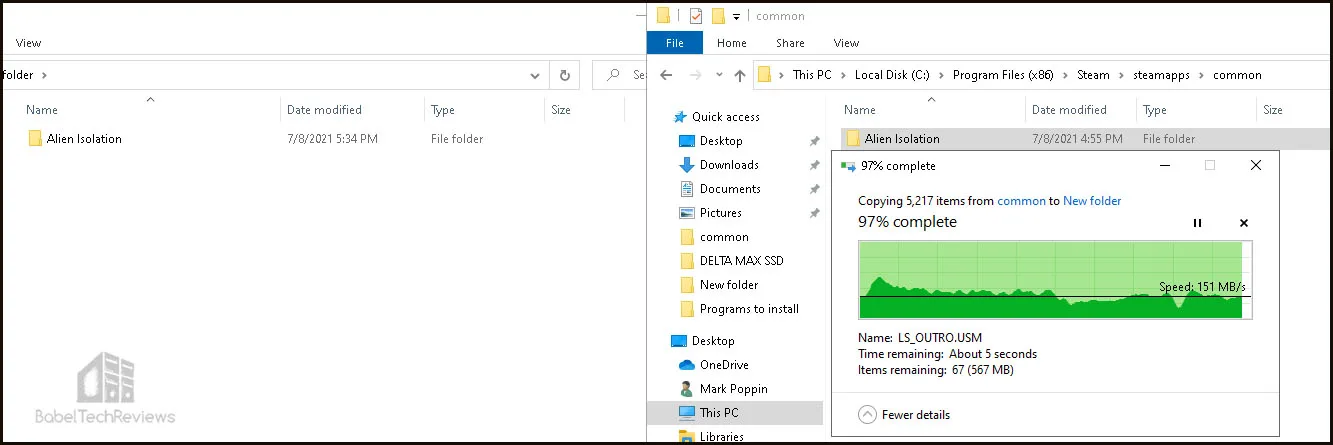 It took about 2 minutes and 22.5 seconds to copy the same Alien Isolation 22.6GB Steam folder from program files to the desktop using the Vulcan SSD.
 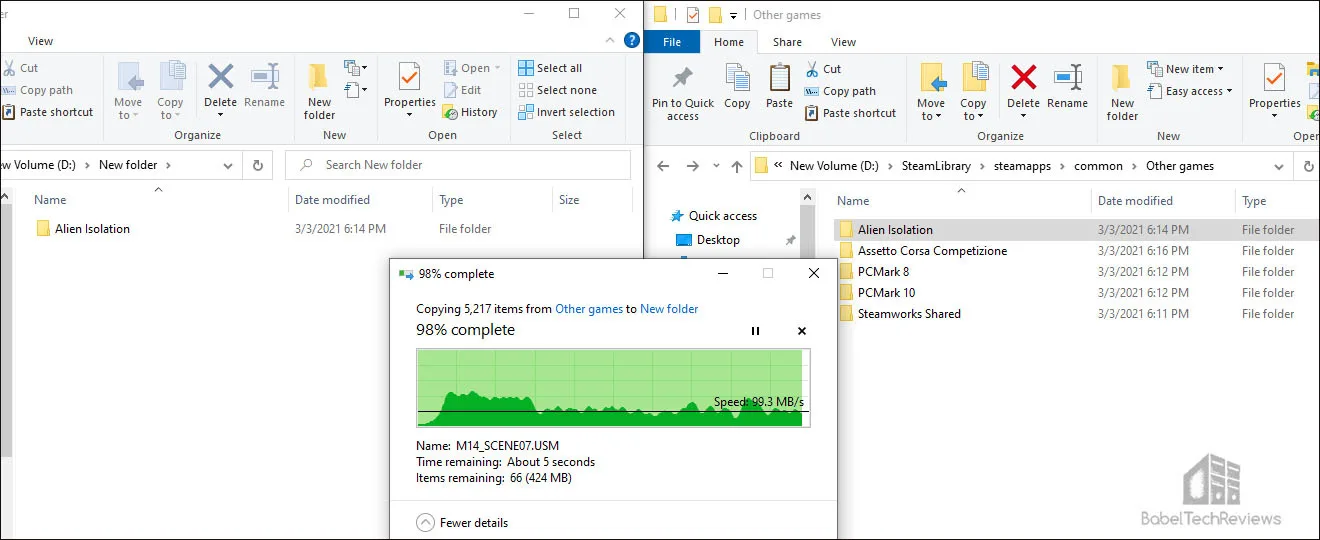 The Team Group MP33 M.2 PCIe 1TB SSD is weak in Read but rather fast for Write evidenced by taking 1 minute and 9.3 seconds (69.3 seconds) for the Alien Isolation Copy.
  The Liquid CARDEA took 40.9 seconds for the same copy.
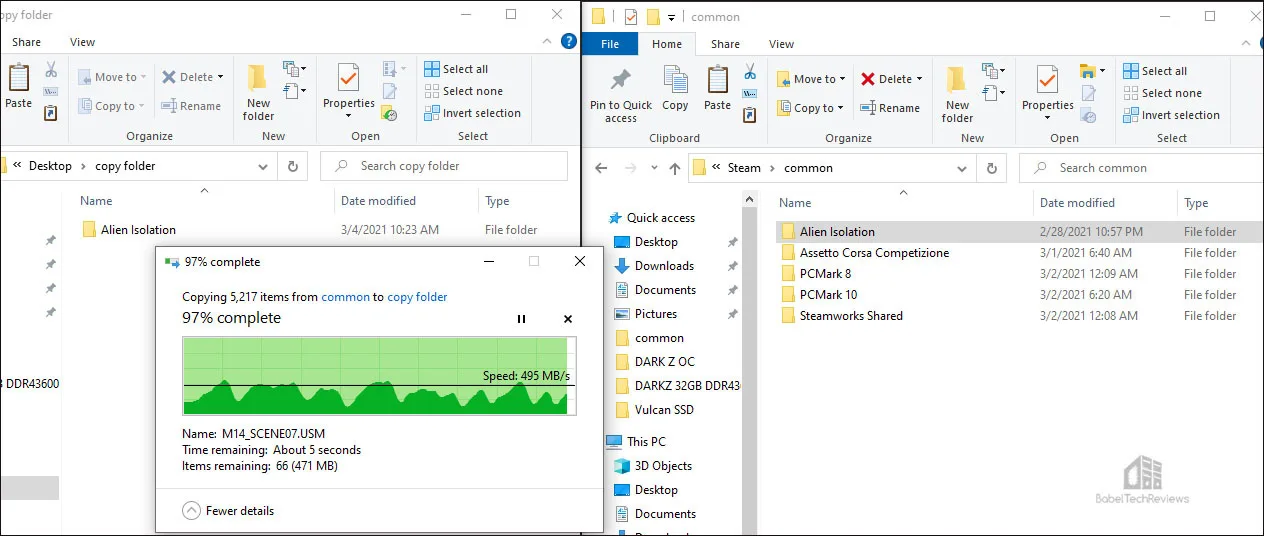 The CARDEA IOPS took 25.6 seconds.
 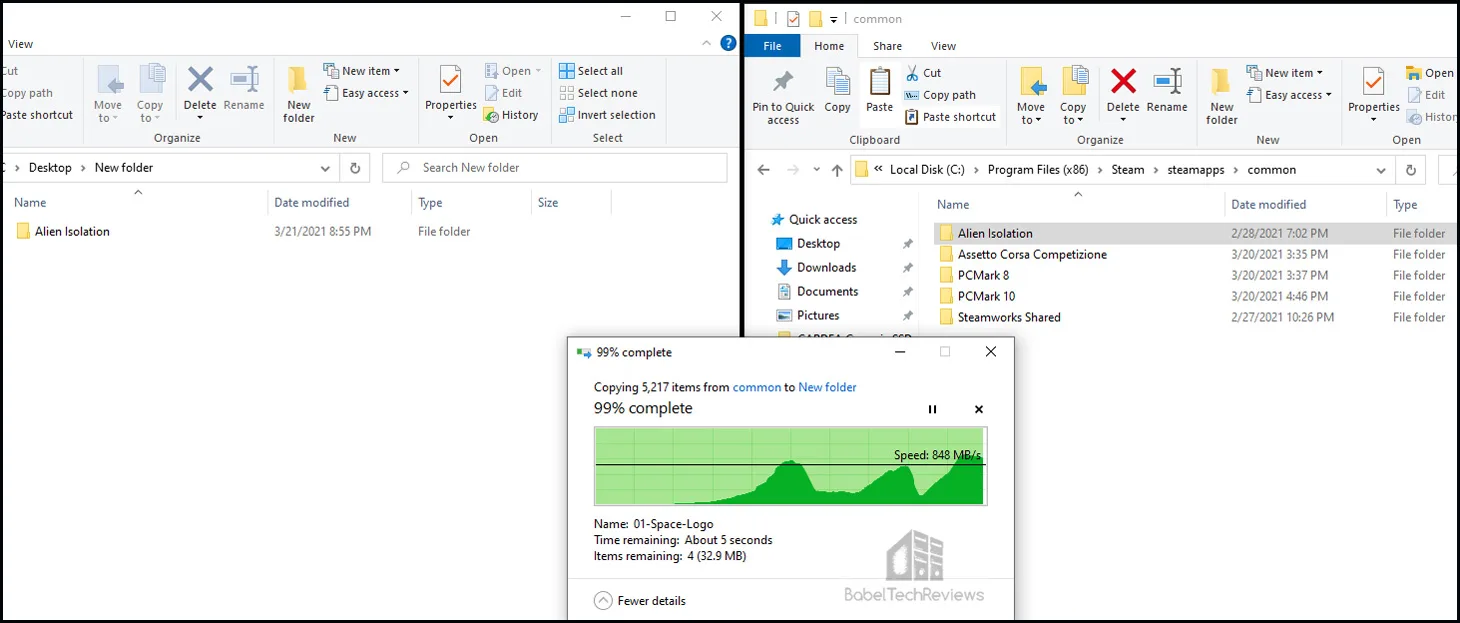 The CARDEA Ceramic C440 took 20.5 seconds or about 5 seconds faster than the IOPS.
 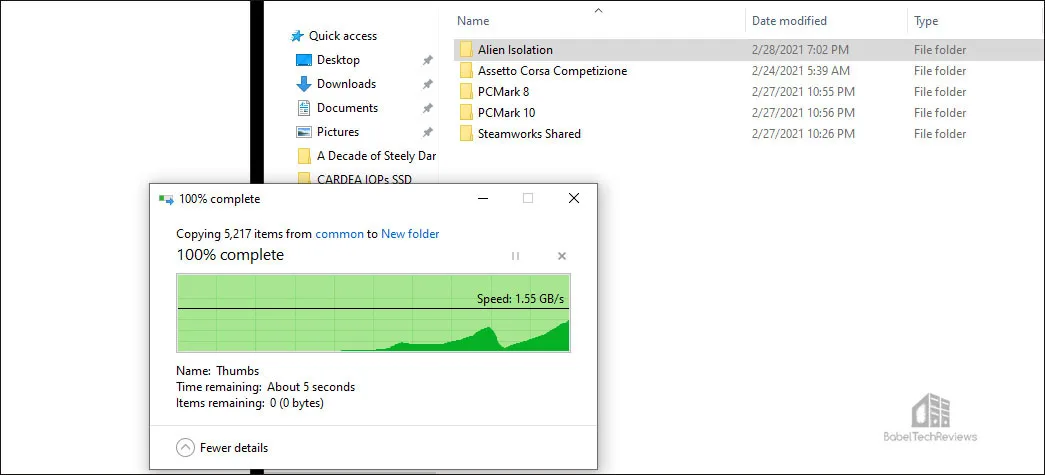 Next, we try something more time consuming when we copy multiple folders totaling 44.2GB from from Steam’s common files to a desktop folder.
44.2GB File Copy
The EX2 Elite 512MB SATA III SSD took 6 minutes and 59.0 seconds. to copy 44.2GB
The DELTA MAX took 7 minutes and 4.0 seconds. to copy a 44.2GB Steam folder from program files to the desktop. 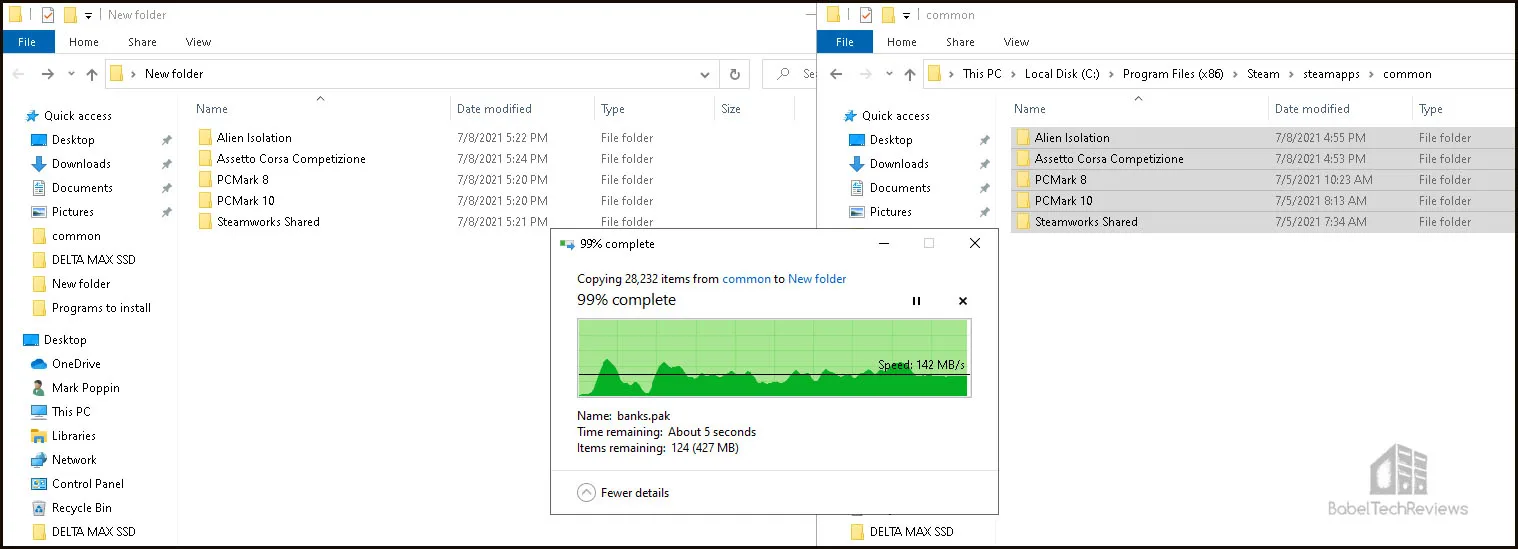


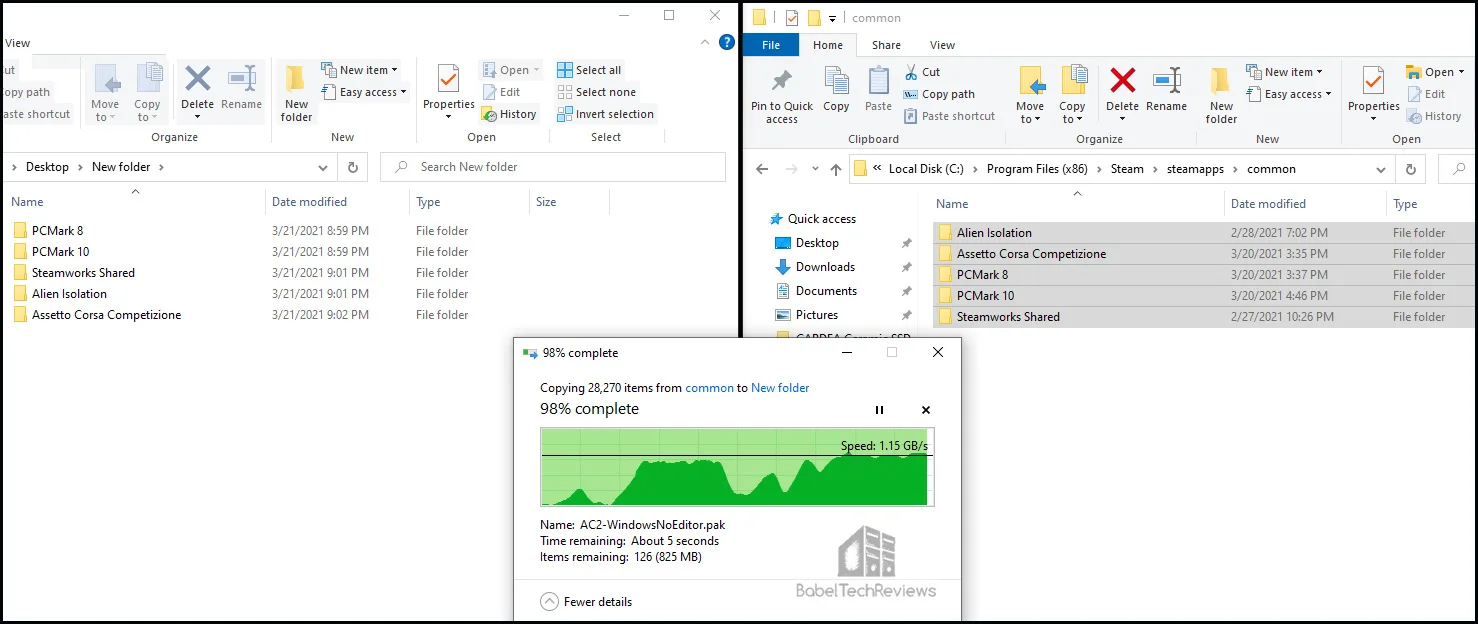

Even when the CARDEA Ceramic C440 SSD is constrained by the Intel platform’s limited bandwidth, it still excels at copying compared to any of our other tested SSDs. The IOPS comes in second place well ahead of the CARDEA Liquid and MP33 PCIe SSDs which are in turn faster than either SATA III SSD which are relatively slow unless compared with any HDD.
Finally, let’s revisit game/level loading times plus all of our Summary charts and then reach our conclusion.
Summary Charts and Conclusion
Here are all of the gaming and summary charts again for easy reference followed by our conclusion.
The Game/Level Loading Time Results
Game and game level loading time results are difficult to measure precisely (such as by using a stopwatch) but our tests are far more precise.
Even SSHDs require loading the same level or program over-and-over to get quicker. Here are the World of Warcraft and Battlefield 3 loading times again as measured precisely by PCMark 8’s storage test and accurately by Final Fantasy XIV: Stormbringer’s benchmark. Lower (quicker/faster) loading times (measured in seconds) are better.
 All five SSDs load games quickly and there is very little difference between them although the T-FORCE CARDEA Liquid C440 is undisputedly the fastest followed closely by the T-FORCE CARDEA IOPS and Liquid SSDs, then the TeamGroup MP33 SSD, and finally by the T-FORCE Vulcan and the DELTA MAX and EX2 Elite SATA III SSDs. Until developers start to target SSDs for game storage, only then may we see SSDs achieve the game loading performance they are really capable of reaching.
Non-Gaming Summary Charts
Here are all of the summary charts presented again in one place.
A gamer who wishes to have the very fastest PC will choose an internal PCIe NVMe SSD, and the CARDEA Ceramic C440 SSD is the fastest drive even when its bandwidth is curtailed by the PCIe bandwidth limitations of tenth generation Intel enthusiast motherboards. Generally the CARDEA IOPS slots into second place just ahead of the CARDEA Liquid SSD. Next fastest is the TeamGroup NVMe MP33 SSD, and finally the T-FORCE Vulcan, EX2 Elite, and DELTA MAX SATA III SSDs are grouped closely together.
For gaming and for regular tasks on current Intel platforms, any SSD will provide similar game and level loading performance well above that of mechanical hard drives or even hybrid drives. Let’s head for our conclusion.
The Conclusion & Verdict
We would suggest that 500GB is the minimum storage capacity for a gamer that includes the operating system, and 1TB is much better to have for a primary drive. It is not mandatory to have a SSD if you only use your PC for gaming and have a lot of patience. Games do not perform significantly better on SSDs since most developers still target HDDs for game performance optimization. However, games may take significantly longer to load from a HDD or SSHD than they do from any internal SATA III drive or even from an external USB 3.0 SSD.
If a gamer wants to get right back into the game, any SSD will improve immersion and decrease frustration compared with using a HDD or SSHD. Windows 10 is becoming more and more painful to use when installed on a mechanical or even on a hybrid solid state/hard disk drive. Indexing, Search, or Anti-malware Windows programs may often saturate the bandwidth of a mechanical drive, and even downloading or updating Steam games may slow your PC to an irritating crawl. This will not happen using a SATA III SSD. So let’s recap pricing.
The TeamGroup Elite EX2 is currently $51.99 at Amazon and priced at $86.99 for the 1TB capacity. The 1TB DELTA MAX WHITE is currently $120.99 at Amazon or $72.99 for the 512GB version but they offer RGB lighting. The 512GB T-FORCE Vulcan 500GB SATA III SSD can be found for $49.99 and the 1TB version is $99.99; the Liquid CARDEA NVMe2 512GB drive is $76.99 at Amazon and the 1TB version is $139.49 at Newegg; and the PCIe Team Group MP33 1TBB SSD is $86.99. or $53.99 for the 512GB version. The CARDEA Ceramic C440 1TB is a Gen 4 x4 drive currently priced $119.99 at Amazon as a 5000MBps/ 4400MBps drive; there is no 512GB version.
It’s clear that the EX2 is a decent choice for a gamer who has been holding out and still using a hard drive, but TeamGroup offers multiple other SATA III options with good prices. Look for a sale. Because of today’s close pricing and competition, choosing a SATA III SSD makes little sense over a PCIe-based SSD as a primary drive, but they offer excellent storage capabilities. Based on performance and price, we will recommend a 1TB EX2 Elite SATA SSD for storage especially if it is on sale, but not a 512GB drives because it is just too small to hold many games plus the operating system. We recommend that if a PCIe-based SSD is an option, pick it over SATA.
Pros
- 3-year warranty backed by TeamGroup support
- Fast game/level loading speeds and reasonable file copy speeds
Cons
- Price. Buy it on sale
- The Elite EX2 doesn’t meet its specifications for Read/Write
The Verdict
Stay tuned as Rodrigo is currently working on his Win 10 versus Win 11 performance analysis.
Happy Gaming!