The Team Group MP33 M.2 2280 1TB PCIe SSD Review
The Team Group MP33 M.2 PCIe SSD (Solid State Drive) is a midrange $129.99 1TB NVMe drive. Although its specifications indicate that it is significantly faster than SATA III-based SSDs, we want to see if this speed increase will make any practical difference for gamers. Our review sample came directly from Team Group and we will focus on the MP33’s performance by comparing it with seven other drives.
Three of BTR’s eight test drives are SATA III based SSDs, one is a portable 240GB USB 3.1 SSD, and one is a 2TB solid state hard drive (SSHD). The fastest two SSDs in BTR’s library are M.2 PCIe SSDs – a fast T-FORCE CARDEA Liquid 512GB and an entry-level 480GB Kingston A-1000.
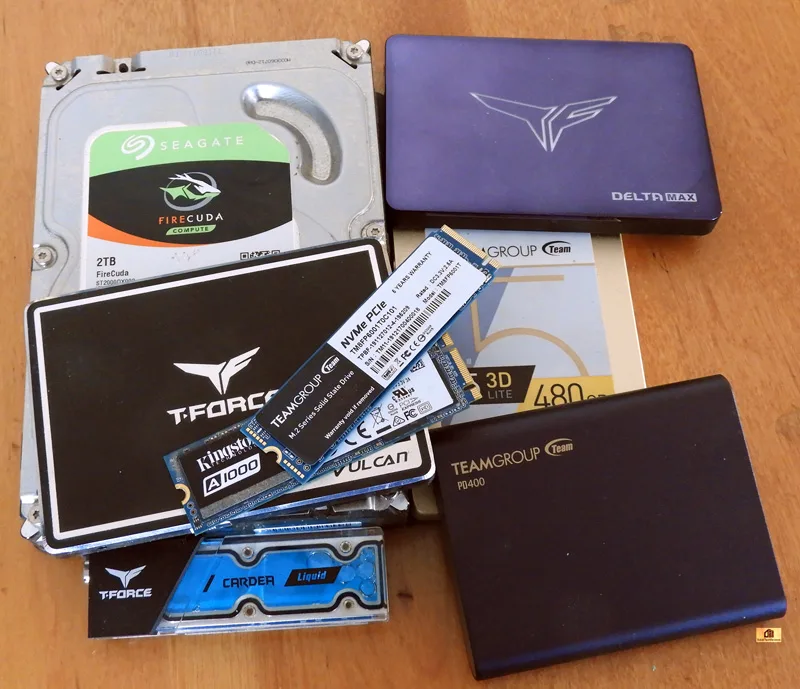
BTR uses two identical 480GB Team Group L5 LTE SATA III SSDs as boot drives – one for AMD and one for NVIDIA – together with a 1.92 TB SanDisk SATA III SSD and a 2 TB Micron 1100 SATA III SSD for our primary game storage. In addition, we also use a T-FORCE Vulcan SATA 500GB and a Delta Max 512GB SATA III SSDs for additional storage whereas previously we used a 2TB Seagate FireCuda Solid State Hard Drive (SSHD) for additional storage of BTR’s benching suite of more than 50 PC games plus many VR games.
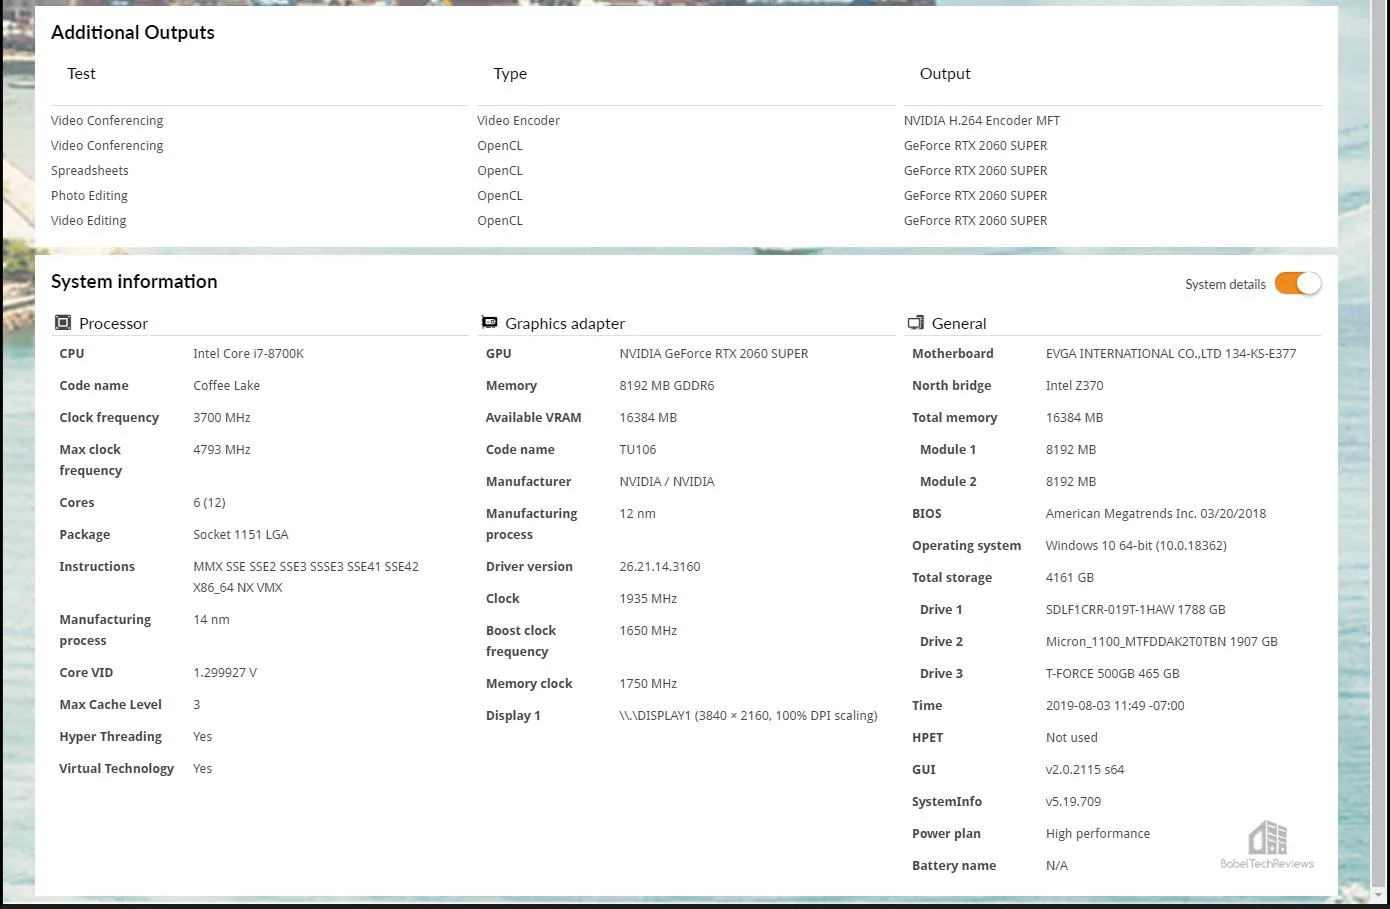
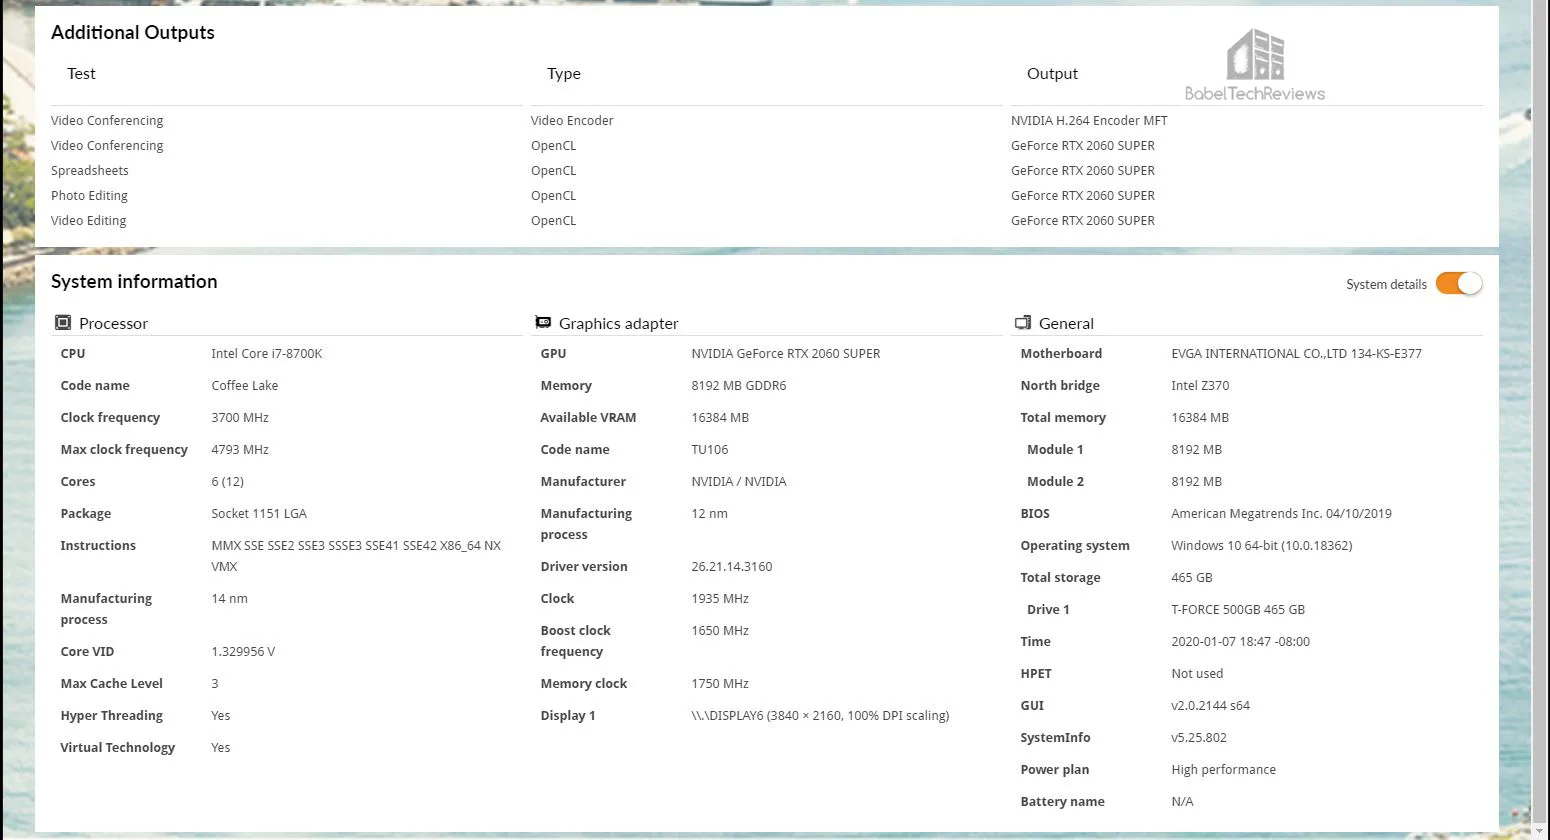
BTR’s test setup uses Windows 10 64-bit, featuring an Intel Core i7-8700K overclocked to 4.8GHz for all cores as set in the EVGA Z370 FTW motherboard’s BIOS, and 16 GB of T-FORCE XTREEM DDR4 at 3866MHz. The settings and hardware are identical except for the four drives being tested, and the graphics are powered by a RTX 2060 SUPER Founders Edition (FE). BTR’s January review of the CARDEA Liquid SSD and of the DELTA MAX SSD were set up using the same drivers and conditions, so we will reuse those results for this evaluation.
We benchmark with all of our drives at less than 90% capacity, and in addition, all of the drives have been in use for months except for the MP33 SSD which has been “dirtied” using IOmeter as well as being used for storage, so our testing tends to give more real world performance results.
Here are the features and specifications of the MP3 M.2 PCIe SSD taken directly from the Team Group website.
FEATURES
- Using new generation of 3D flash memory: Capacity, performance, and durability are greatly improved
- PCI-e interface – Supports latest NVMe 1.3 protocol
- M.2 2280 specification: Supports the next-generation platforms of Intel and AMD. Suitable for both desktop and notebook
- Supports SLC Caching technology. Greatly enhance computing performance
- Product warranty – 5-year product warranty. Free technical support service
Specifications
The MP33 specifications are also found on the Team Group website.
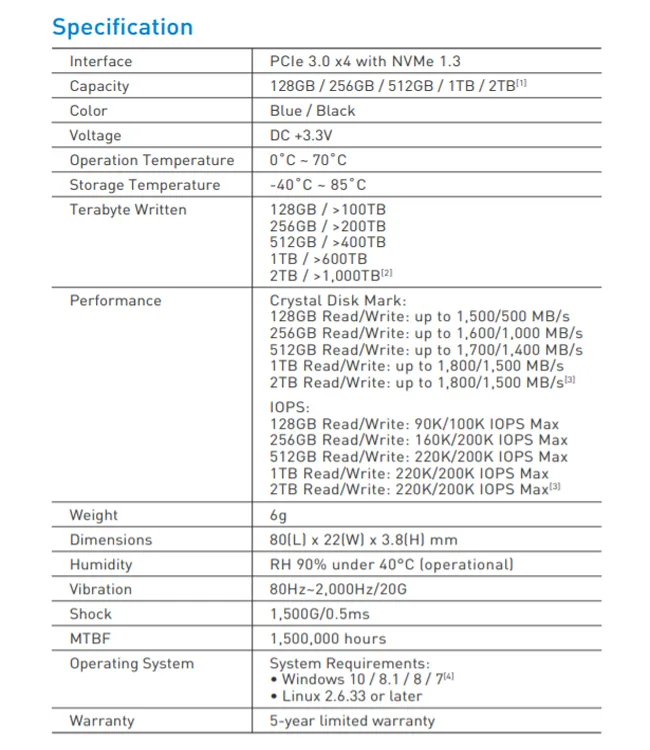

The key highlights are that the MP33 M.2 PCIe SSD is fast, durable, uses little power, and is backed by Team Group’s 5-year warranty.
Next we unbox the Team Group MP33 M.2 PCIe 1TB SSD.
Unboxing
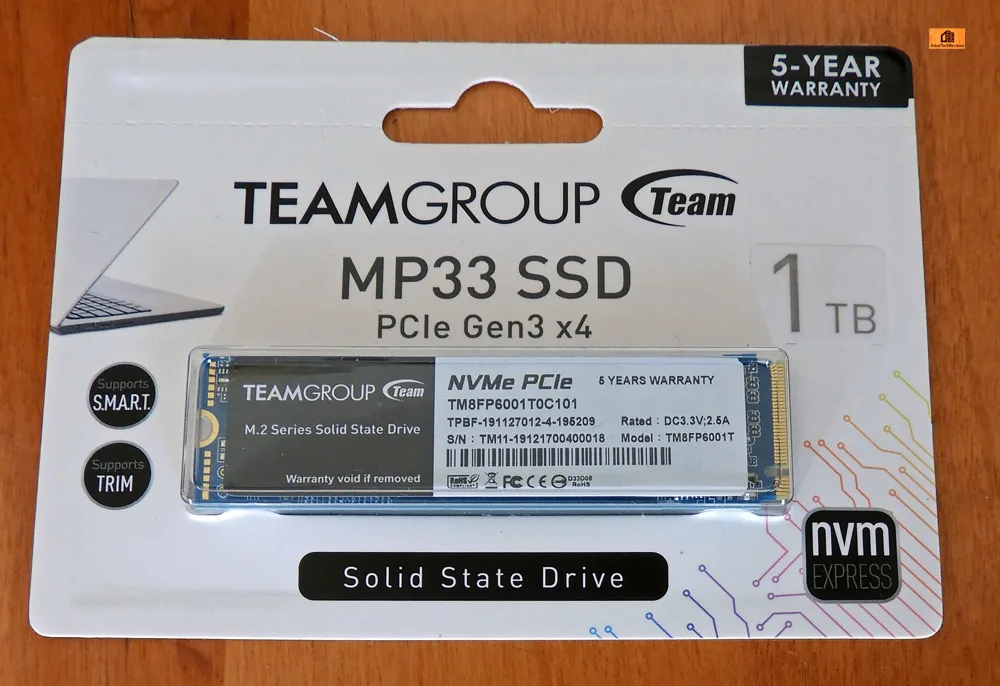
The Team Group MP33 M.2 2280 1TB PCIe SSD comes as a bare module that will fit most motherboards that support 2280 (W:22mm x L:80mm) PCIe M.2 drives. As befits a budget product, it comes in a blister pack that give some details and highlight Team Group’s new 5-year SSD warranty.
The other side of the pack gives some specifications that show it is certainly fast but not blazing fast for a NVMe M.2 PCIe SSD. 
The MP33 claims to be three times faster than SATA III based SSDs with Read speeds up to 1800MB/s and Write speeds up to 1500MB/s.
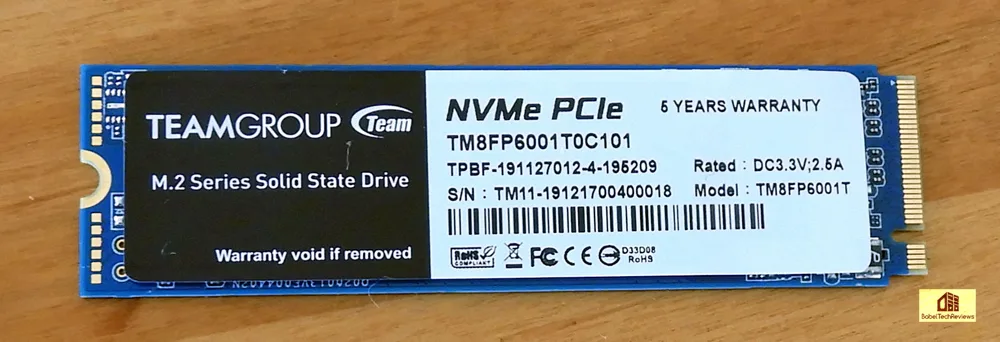
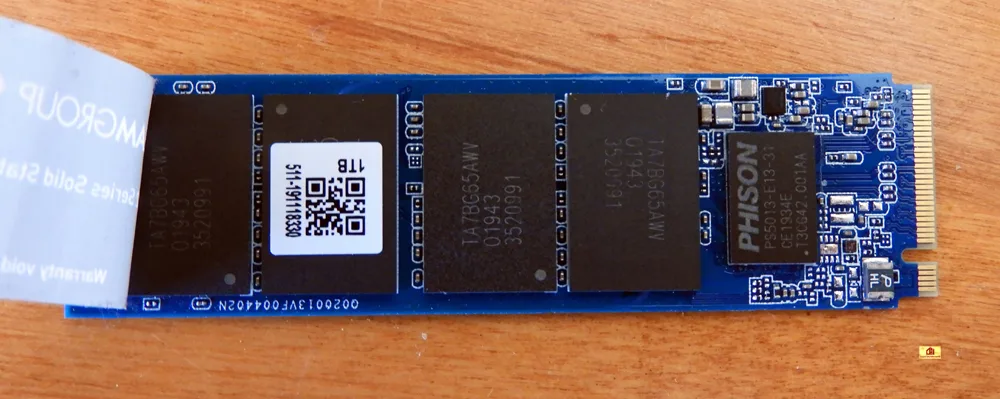
The Team Group MP33 M.2 PCIe 1TB SSD design is very basic on a blue PCB with no heatsinks. A sticker warns that the 5 year warranty will be void if it is removed … so we removed it anyway and you can see the Phison controller and the memory modules.
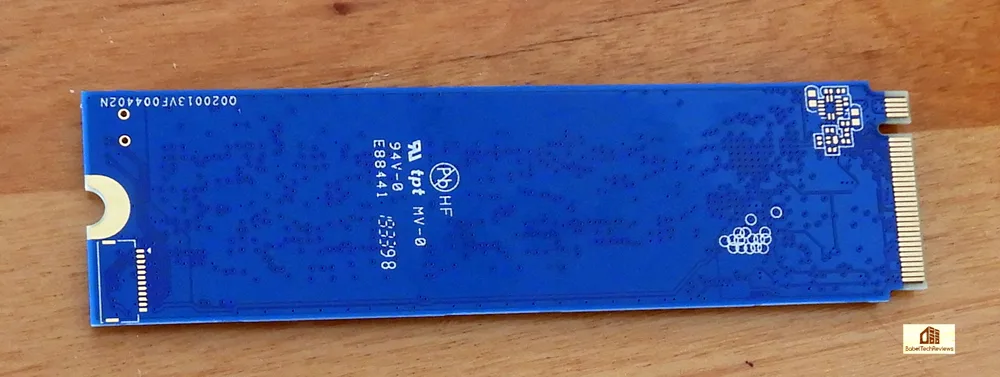
Turning it over just reveals more blue PCB.
Make sure to use a magnetic screwdriver to remove and install the screw that holds down the MP33 as it is tiny and quite easy to lose. After installing the MP33 SSD, the user may need to format it before using it. If you are planning to clone it, make sure the source and the target disks are both GUID or convert one of them so they are the same.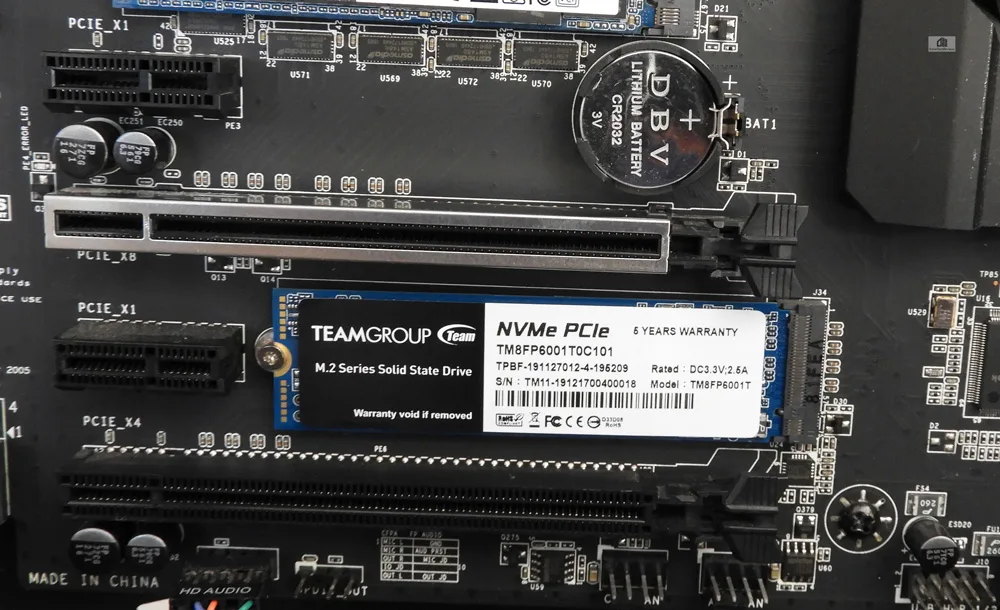
The Team Group MP33 M.2 PCIe SSD is very thin and it can easily fit behind a videocard or it can be displayed in another slot.
Lets look at our test configuration next.
Test Configuration – Hardware
- Intel Core i7-8700K (HyperThreading and Turbo boost is locked on to 4.8 GHz for all six cores. Coffee Lake DX11 CPU graphics.
- EVGA Z370 FTW motherboard (Intel Z370 chipset, latest BIOS, PCIe 3.0/3.1 specification, CrossFire/SLI 8x+8x), supplied by EVGA
- T-FORCE XTREEM 16GB DDR4 (2x8GB, dual channel at 3866MHz), supplied by Team Group
- RTX 2060 SUPER Founders Edition 8GB, stock clocks, on loan from NVIDIA
- Team Group MP33 1TB NVMe PCIe SSD, Supplied by Team Group
- T-FORCE CARDEA Liquid 512GB NVMe PCIe SSD, Supplied by Team Group
- T-FORCE DELTA MAX 500GB SSD Supplied by Team Group
- Team Group PD400 External/Portable 240GB SSD, Supplied by Team Group
- T-FORCE Vulcan 500GB SSD Supplied by Team Group
- Kingston A1000 480 GB NVMe PCIe SSD, supplied by Kingston
- Team Group L5 LITE 3D 2.5″ 480 GB SSD
- 2TB Seagate 7200 rpm SSHD (Solid State Hard Drive)
- Edifier R1280T active desktop speakers
- Monoprice Crystal Pro 4K
- ETEKCITY LaserGrip 774 infrared thermometer
Test Configuration – Software
- Nvidia’s GeForce 431.60 WHQL drivers were used. High Quality, prefer maximum performance, single display.
- VSync is off in the control panel.
- AA enabled as noted in games; all in-game settings are specified with 16xAF always applied.
- All results show loading time in seconds.
- Highest quality sound (stereo) used in all games.
- Windows 10 64-bit Home edition.
- Latest DirectX
- All games are patched to their latest versions at time of publication.
- MSI’s Afterburner, latest version.
- IOmeter
- HD Tach
- HD Tune
- AS SSD
- ATTO
- Crystal DiskMark
- Windows Explorer File copying
- MSI Afterburner to set the RTX 2060 Super’s power and temp limits to their maximums
PC Game & Level Loading Suite
- World of Warcraft (PCMark 8)
- Battlefield 3 (PCMark 8)
Synthetic Benching Suites
- SiSoft Sandra 2020
- AIDA64
- PCMark 8
Let’s head to our benching results.
Benchmarking the Team Group MP33 M.2 PCIe SSD
Benchmarking SSDs are not an exact science as there is usually some variability between runs. However, by using multiple real world and synthetic tests, it may be possible to get a good idea of the MP33 M.2 PCIe SSD’s relative performance across all eight of our tested drives.
First, we will will look at synthetic benchmark suites to highlight the differences between our drives and we shall start with PCMark 10.
PCMark 10
UL (formerly Futuremark) is well-respected as a developer and publisher of PC benchmark applications for nearly two decades. Although PCMark benches are synthetic tests, they provide a good measure of system performance. PCMark 10 is UL’s seventh major update to the PCMark series. PCMark 10 was primarily developed for Windows 10 and it builds upon the PCMark 8 platform for a complete package of vendor-neutral and easy-to-use benchmarks for home or office environments.
Unfortunately, in comparison to PCMark 8, PCMark 10 is missing key elements including detailed storage testing, and it is not possible to test attached drives as with the earlier suite. We use PCMark 10’s Extended settings.
To properly compare the PCMark 10 scores, look at the detailed results of each SSD you want to compare remembering that the MP33, the CARDEA Liquid and the Kingston A-1000 are the M2 PCIe SSDs, and the T-FORCE Vulcan would be the overall fastest SATA-based SSD followed by the Delta Max and then the L5 LTE SSDs. The PD400 is a portable USB SSD and the FireCuda 2TB drive is a solid state hard drive (SSHD) hybrid.
The results are presented in approximate order of the fastest to the slowest drive ending with the portable USB SSD and the solid state hard drive (SSHD). All of the eight SSD results screenshots are presented without comment. Open the images in separate tabs for easy comparison.
The Team Group MP33 M.2 PCIe 1TB SSD scores 8987, the highest PCMark 10 score of our eight tested SSDs.


Here are the online MP33 results.
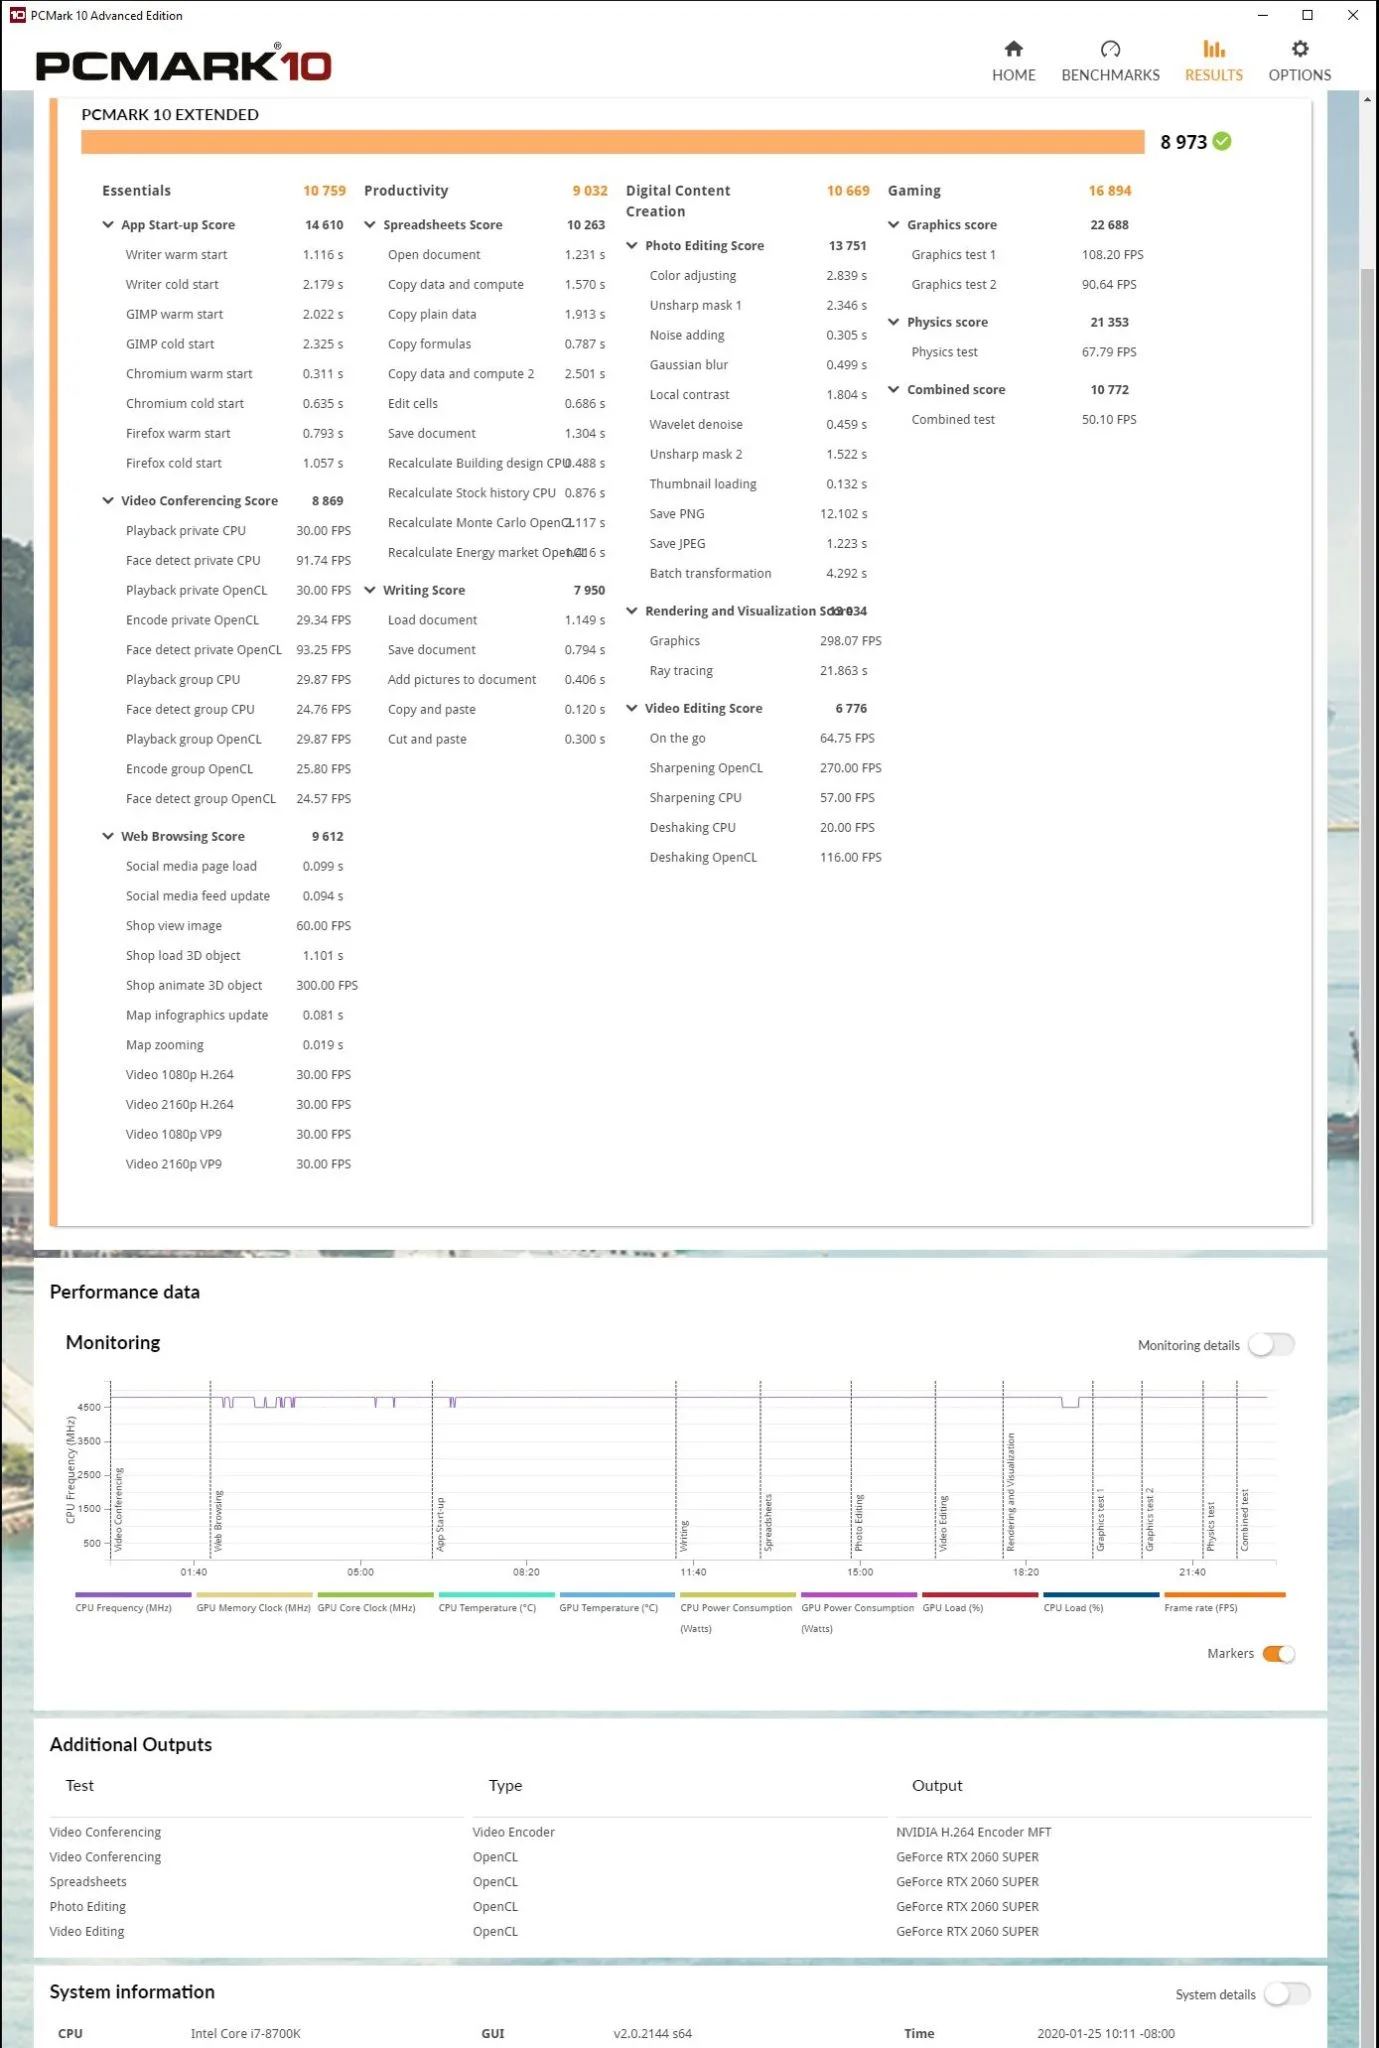
 The CARDEA Liquid 500 GB SSD system scores 8973 which is second as ranked by PCMark 10 even though it is the fastest SSD.
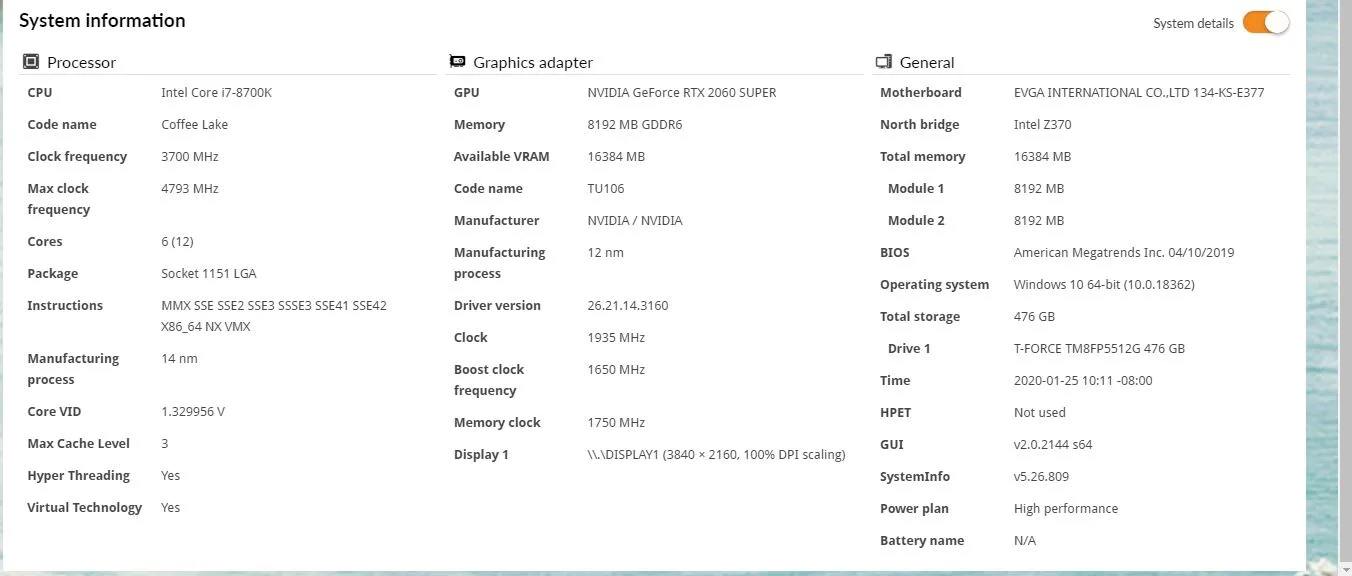
The same PC with the Kingston A1000 480 GB SSD scores 8863 which is ahead of the 480GB Team Group PC score, but it is a bit behind the T-FORCE Vulcan 500GB SSD results.
 The system with the T-FORCE Vulcan 500GB SSD scores 8880.
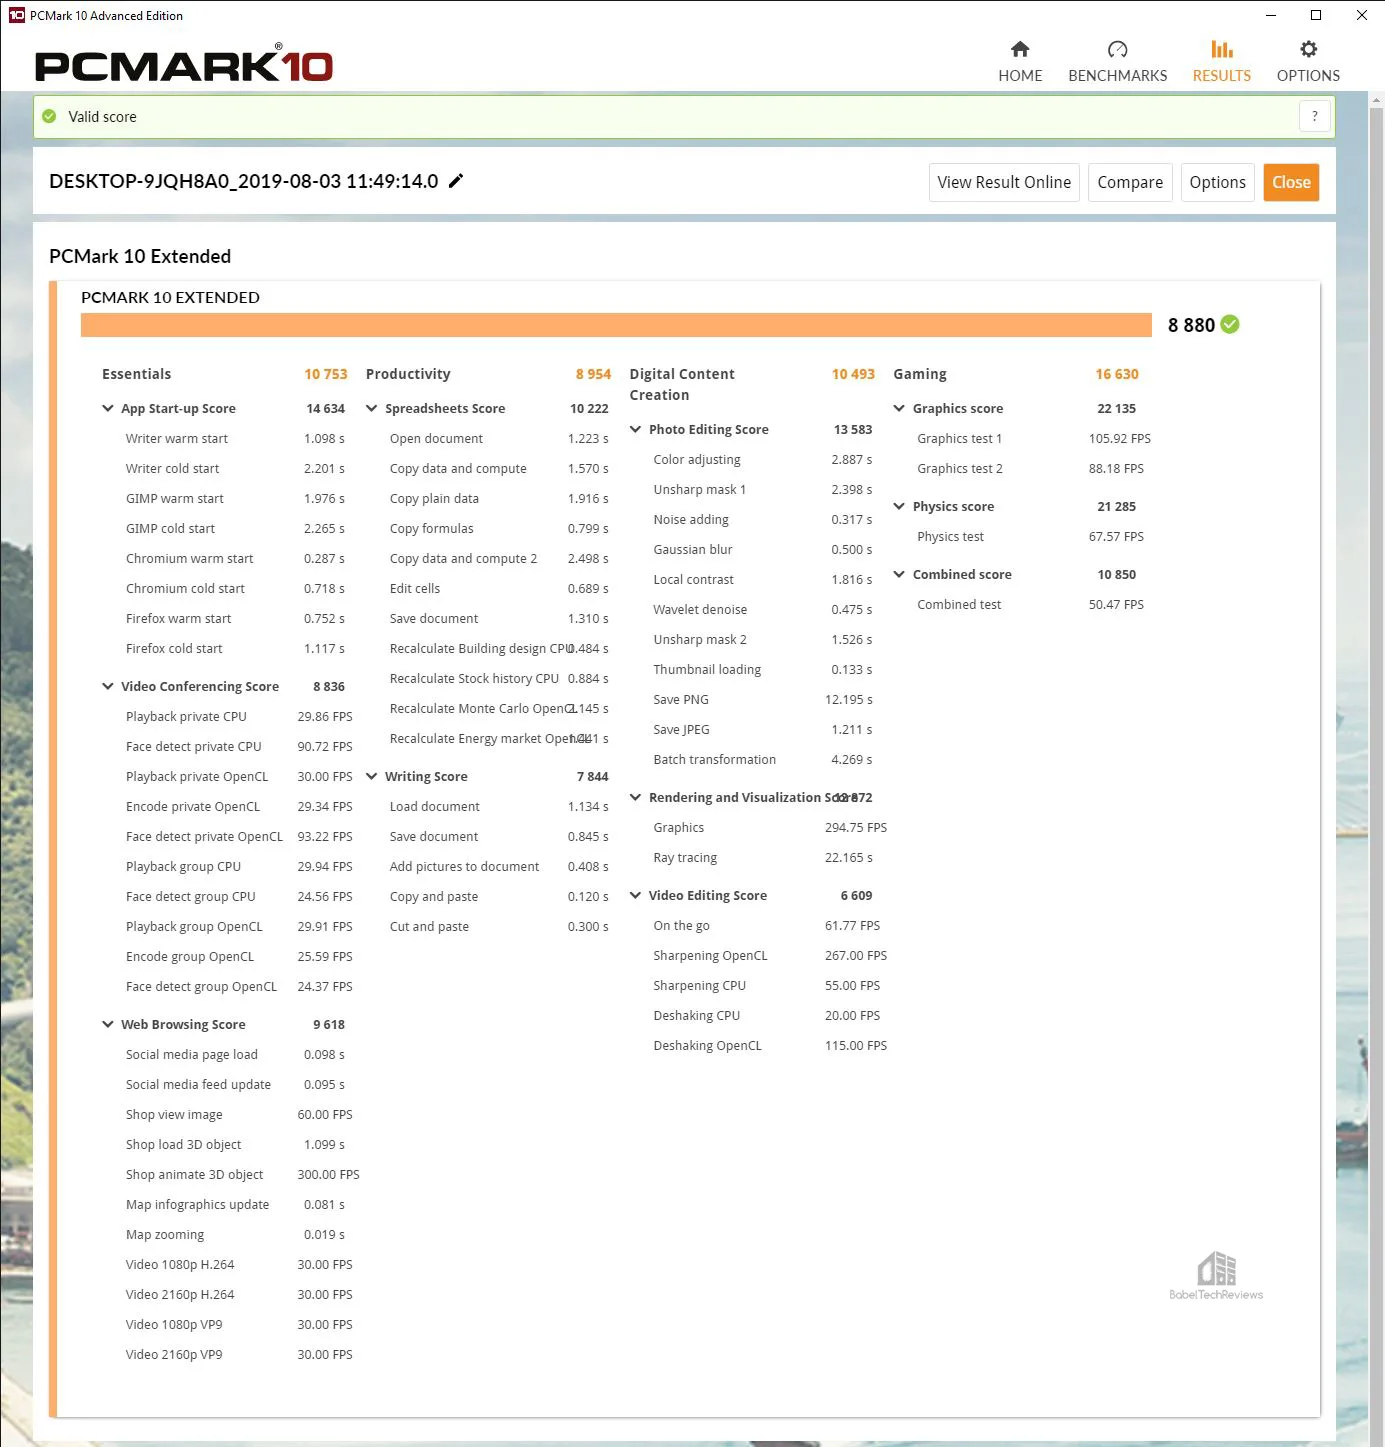
The system with the T-FORCE Delta Max 500GB SSD scores 8849
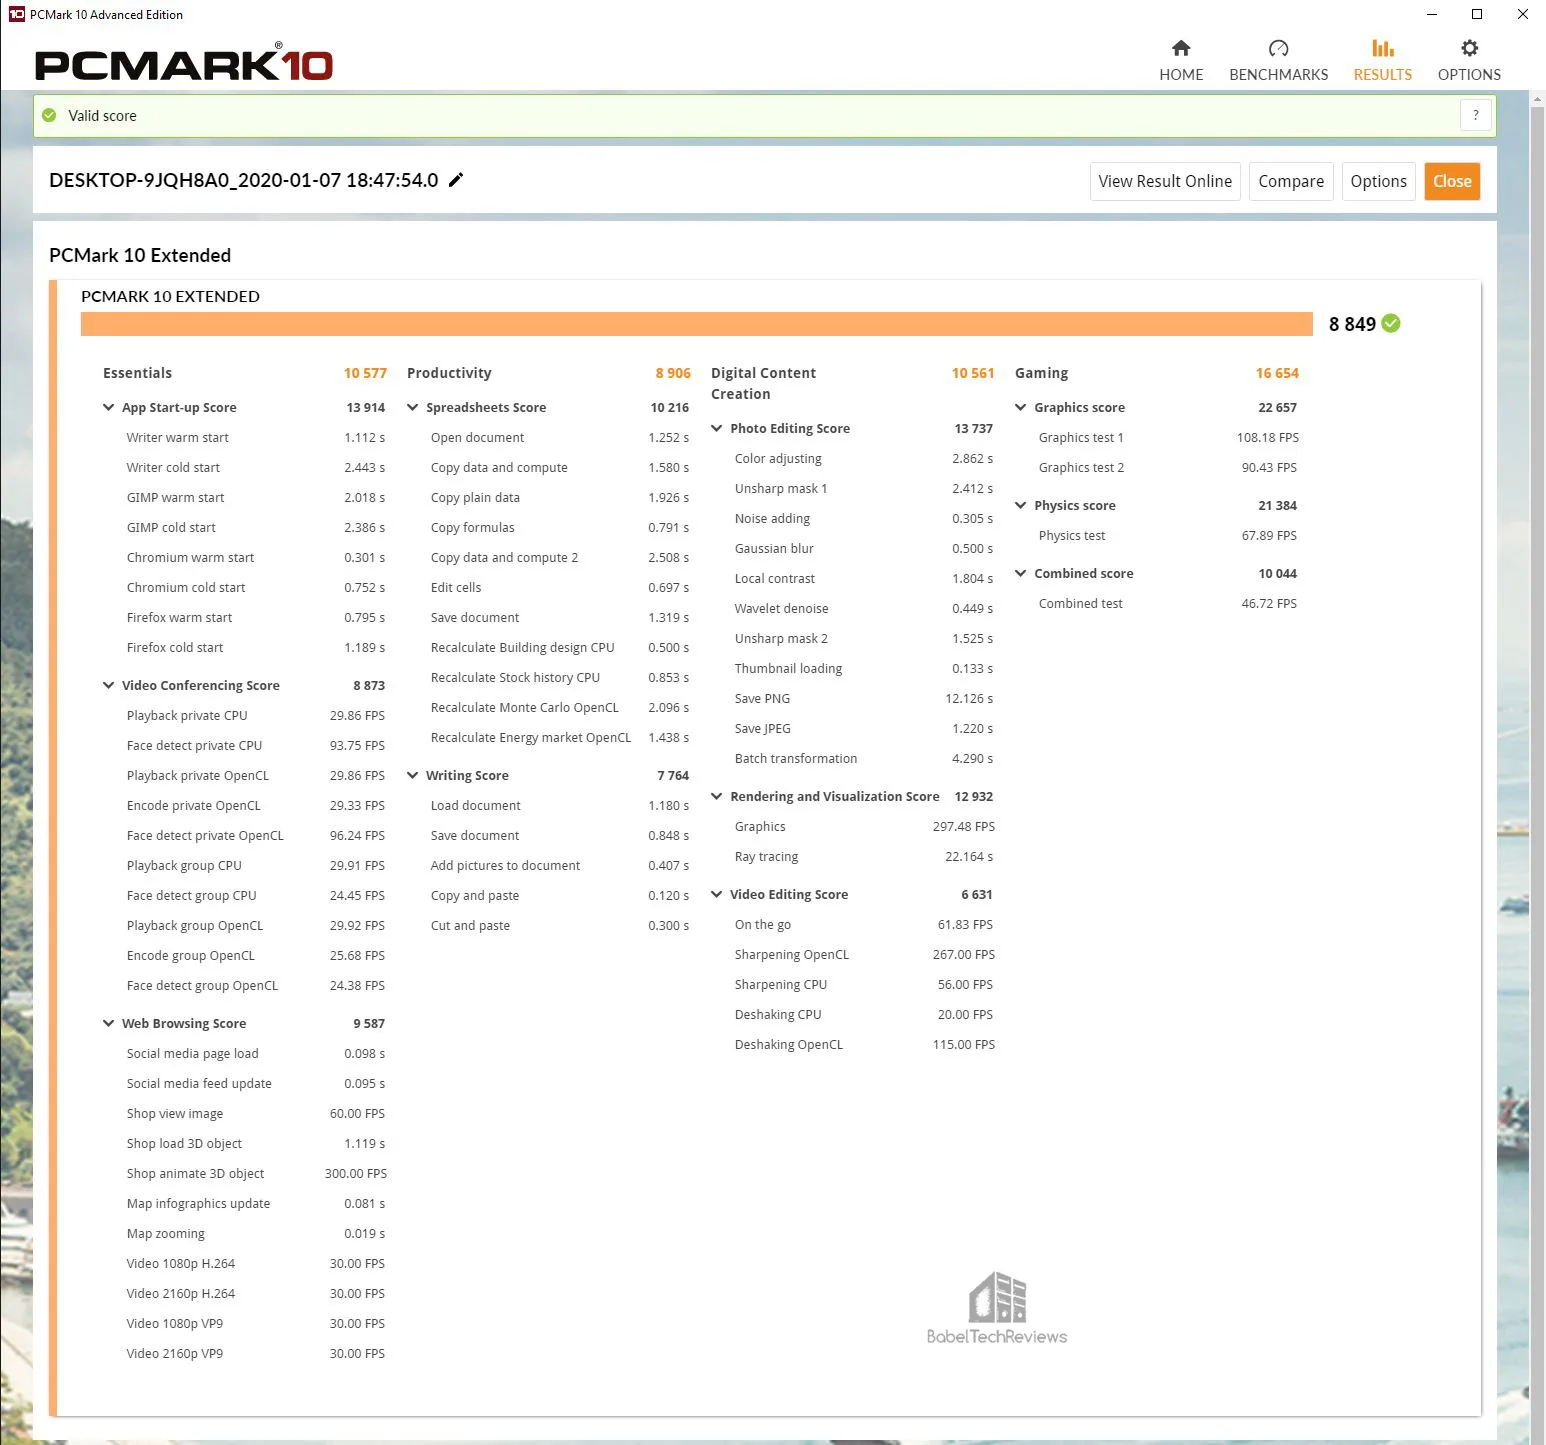
The same system with the Team Group 480 GB SSD scores 8831.
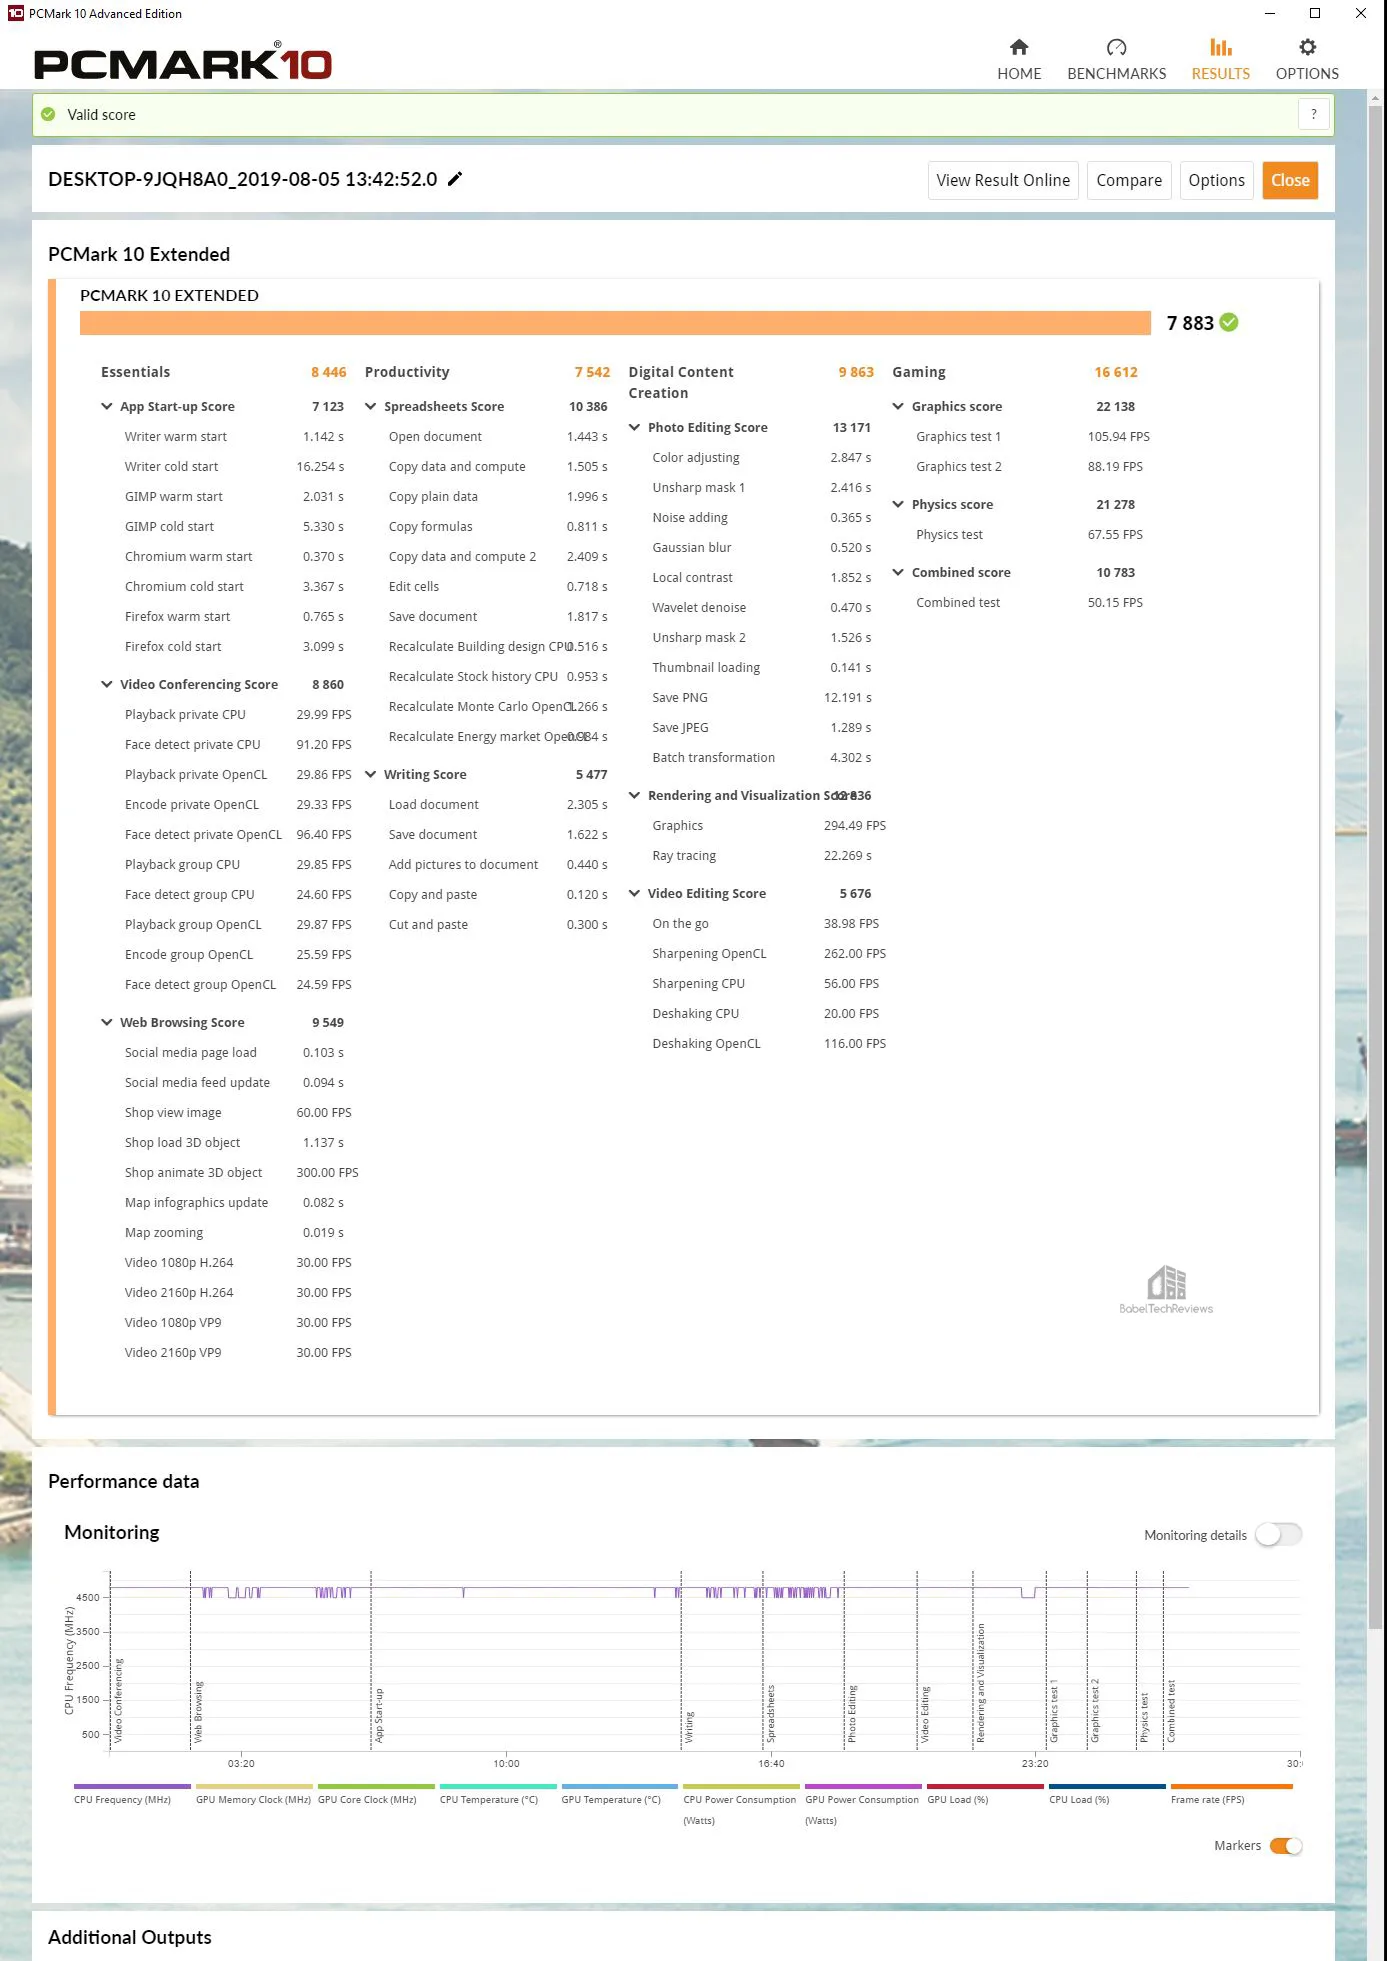
 The FireCuda 2TB SSHD scores 7883.
Here is the summary of the eight drives that were tested using PCMark 10.

PCMark 10’s Gaming results are mostly dependent on the graphic card, not the storage and there is some variability with the results. The Team Group MP33 M.2 PCIe SSD scores highest followed by the T-FORCE CARDEA Liquid which gets the second highest score. Next is a SATA SSD the T-FORCE Vulcan 500GB SSD PC followed by the M.2 PCIe Kingston A-1000 and then the DELTA MAX with the Team Group L5 LTE SSD as the slowest tested SSD.
There isn’t a lot of difference in overall performance between the SSDs nor is it easy to see exactly where one scores higher by looking at the individual tests. Fortunately, PCMark 8 is a better storage test and it is up next.
PCMARK 8
PCMark 8 has an excellent storage test which actually uses real world timed benchmarks that include loading World of Warcraft and Battlefield 3 as well as timing how long it takes to load popular Adobe and Microsoft apps.
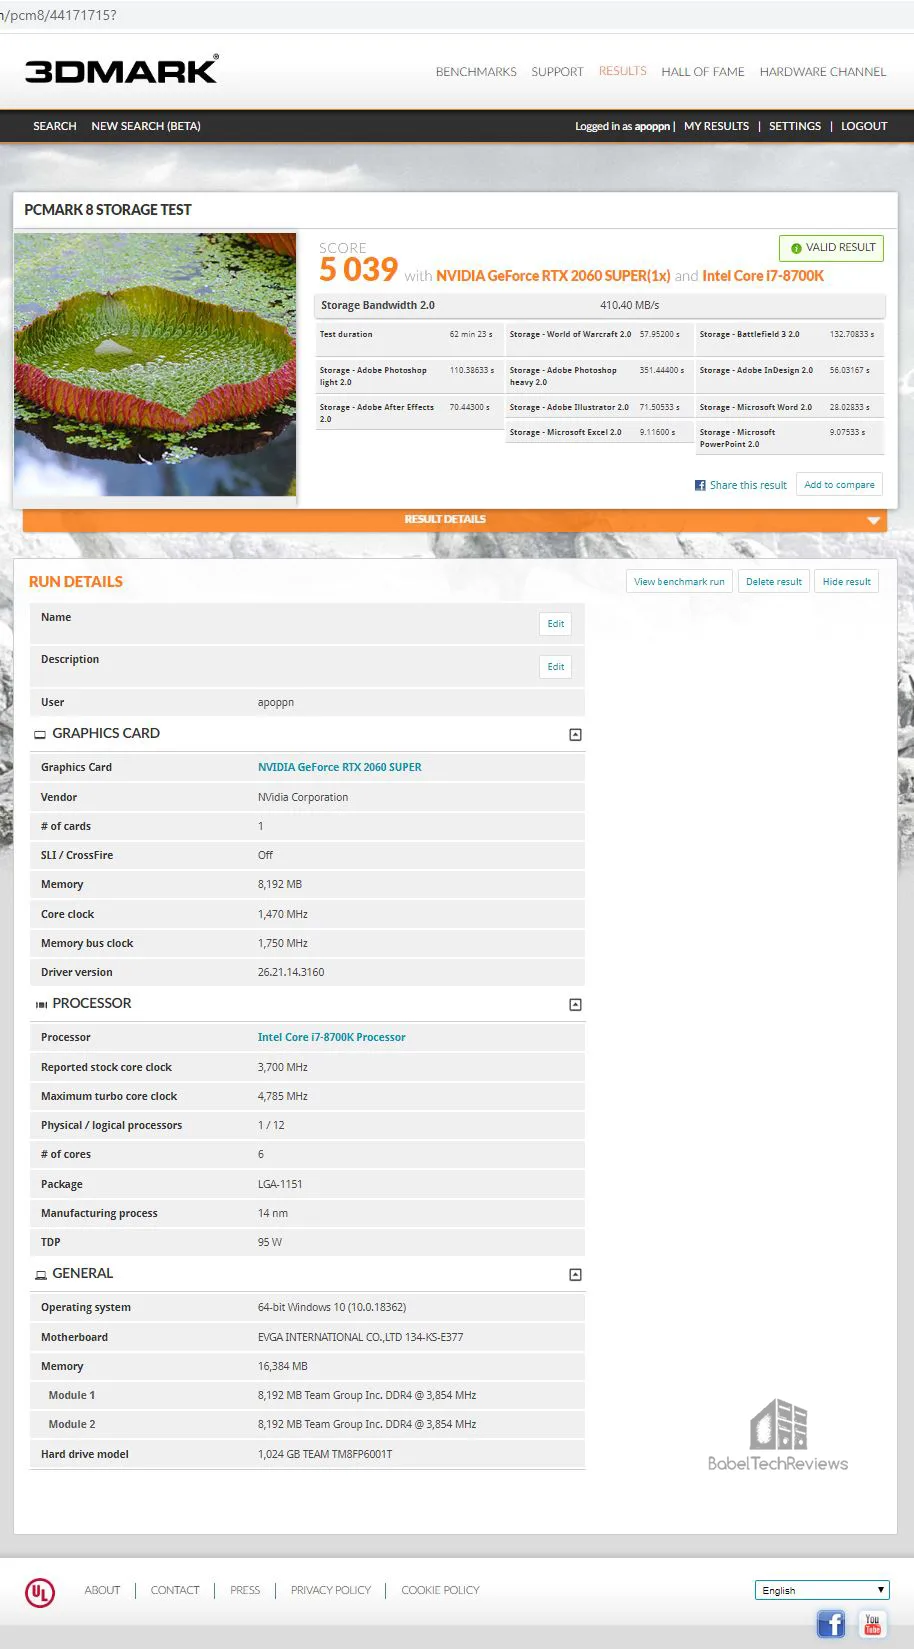
The Team Group MP33 M.2 PCIe 1TB SSD scores 5039 with a total Storage 2.0 Bandwidth of 410.40 MB/s. And for gamers, it took 58.2 seconds to load World of Warcraft and 132.7 seconds for Battlefield 3 to load.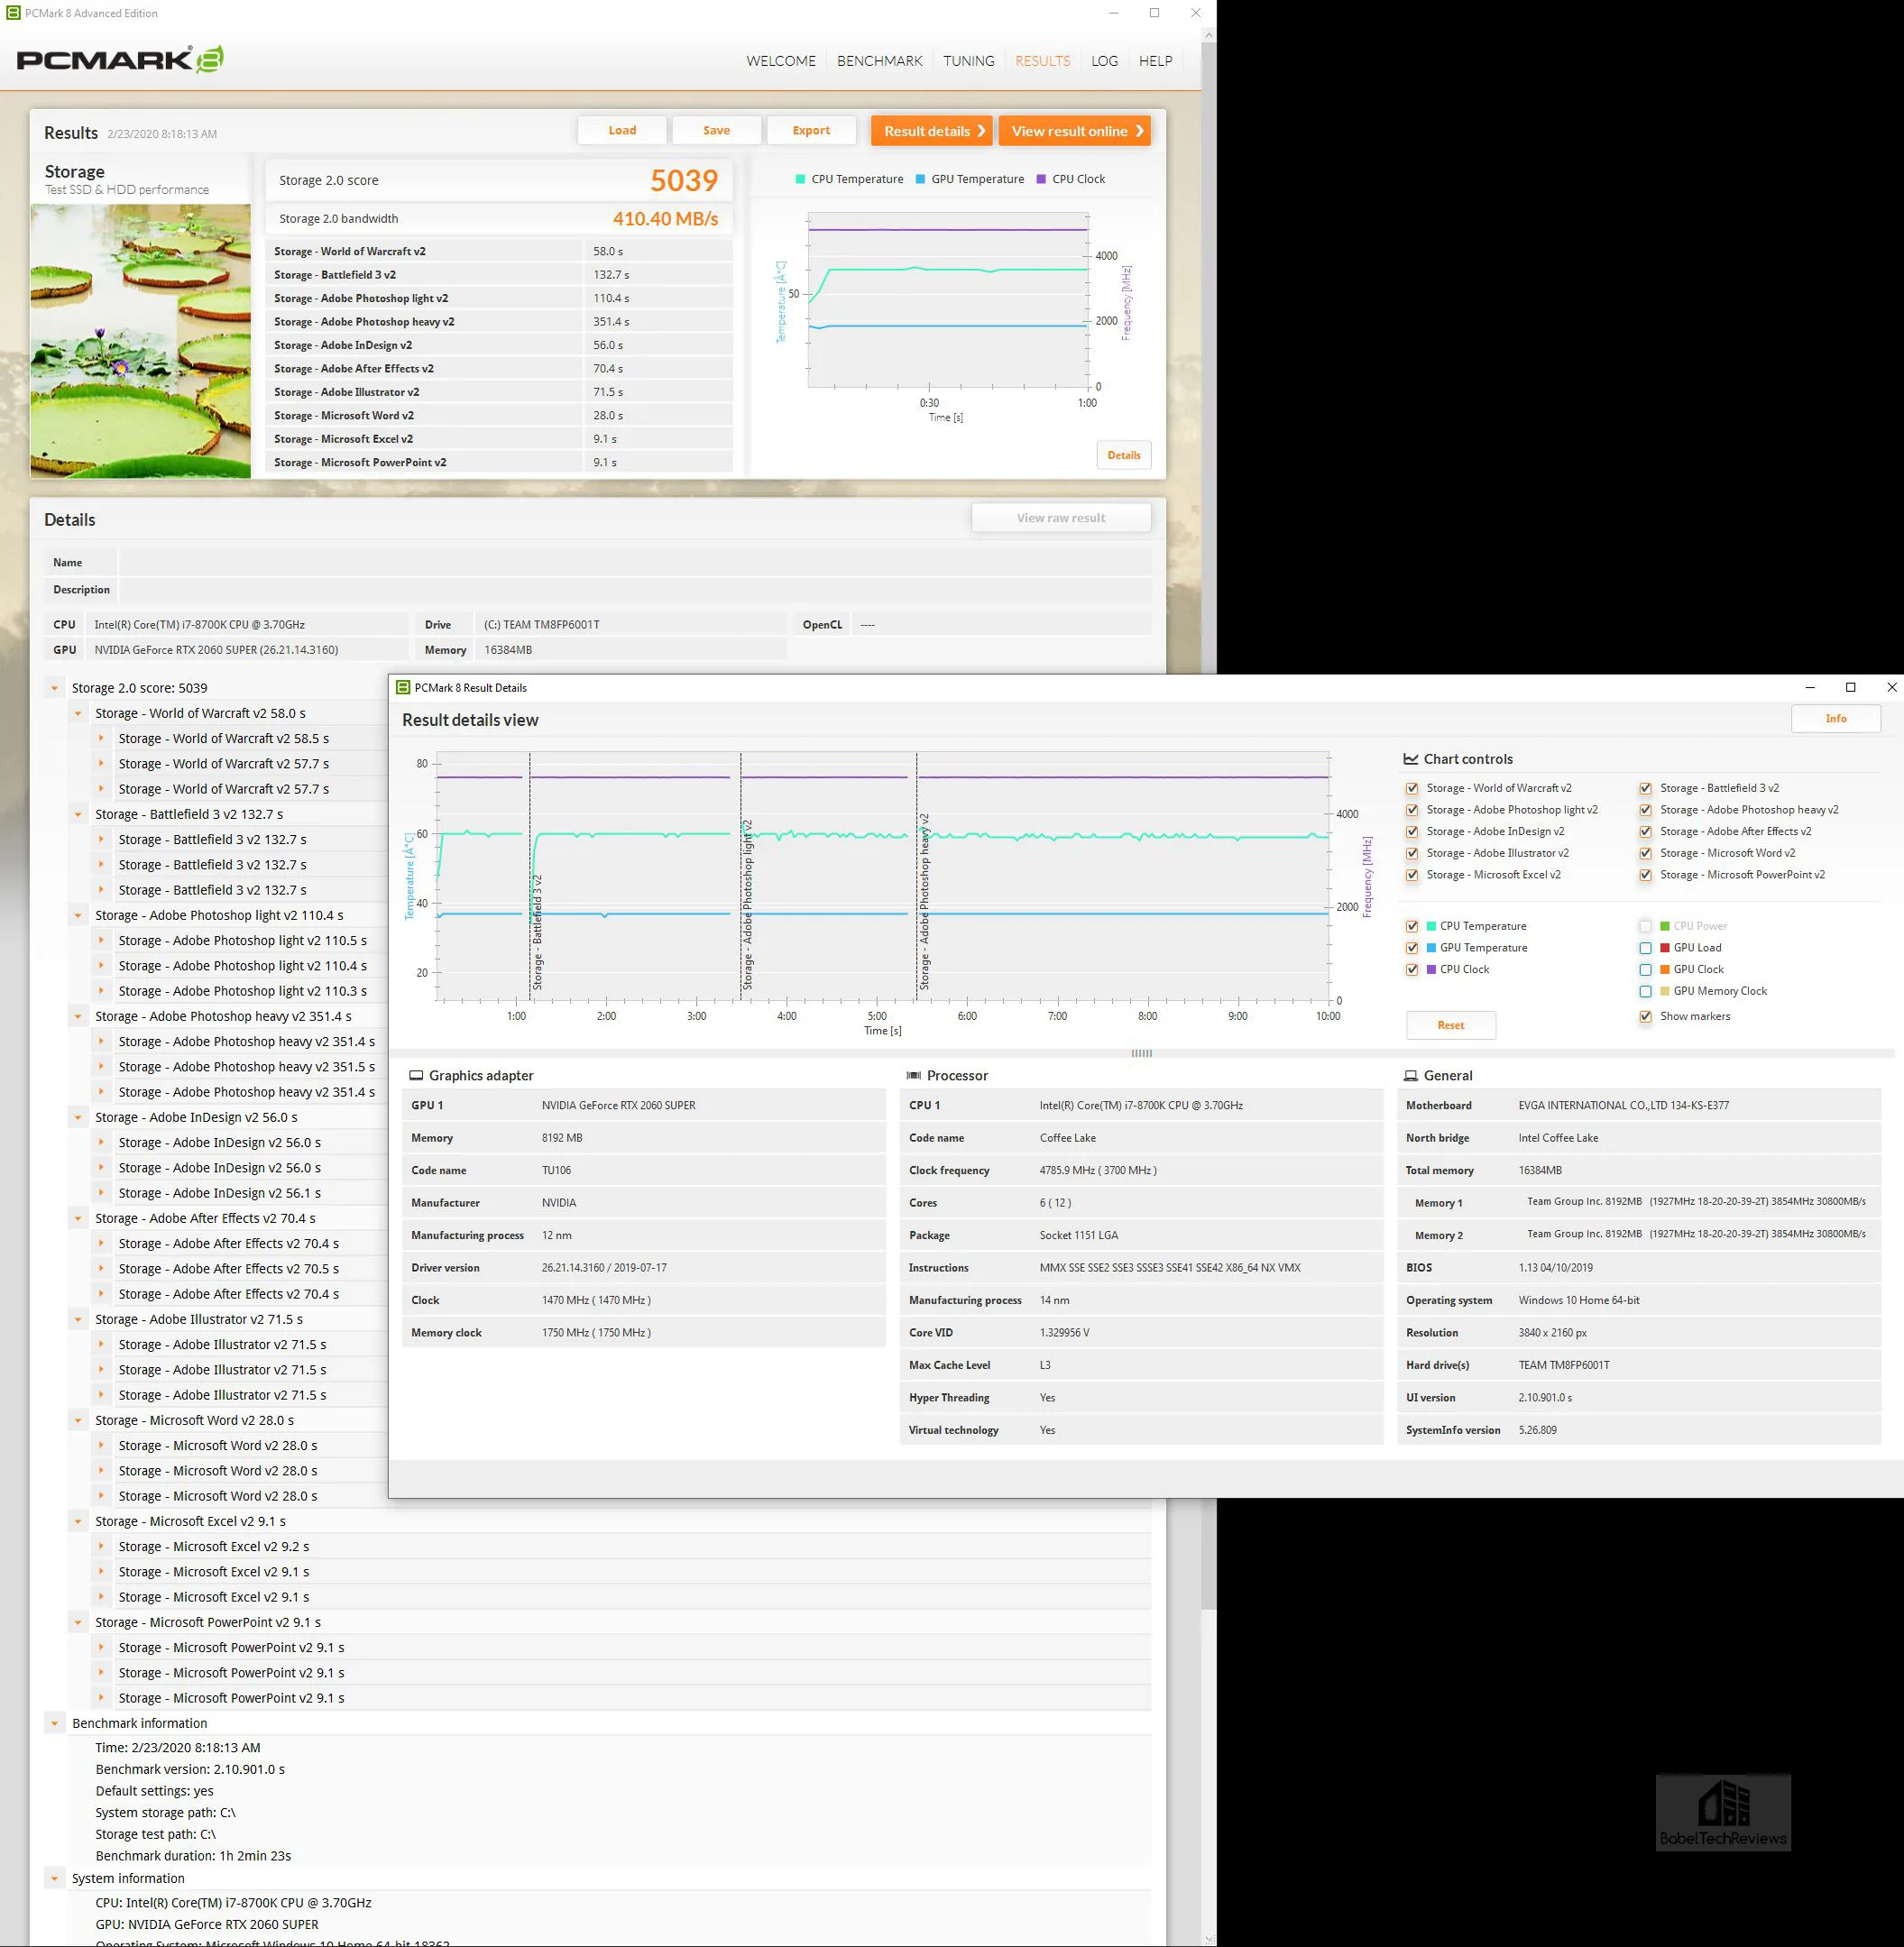
Here is the MP33 Online score.
 The T-FORCE CARDEA Liquid 500GB SSD scores 5076 with a total Storage 2.0 Bandwidth of 599.03 MB/s. And for gamers, it took 57.4 seconds to load World of Warcraft and 131.5 seconds for Battlefield 3 to load.
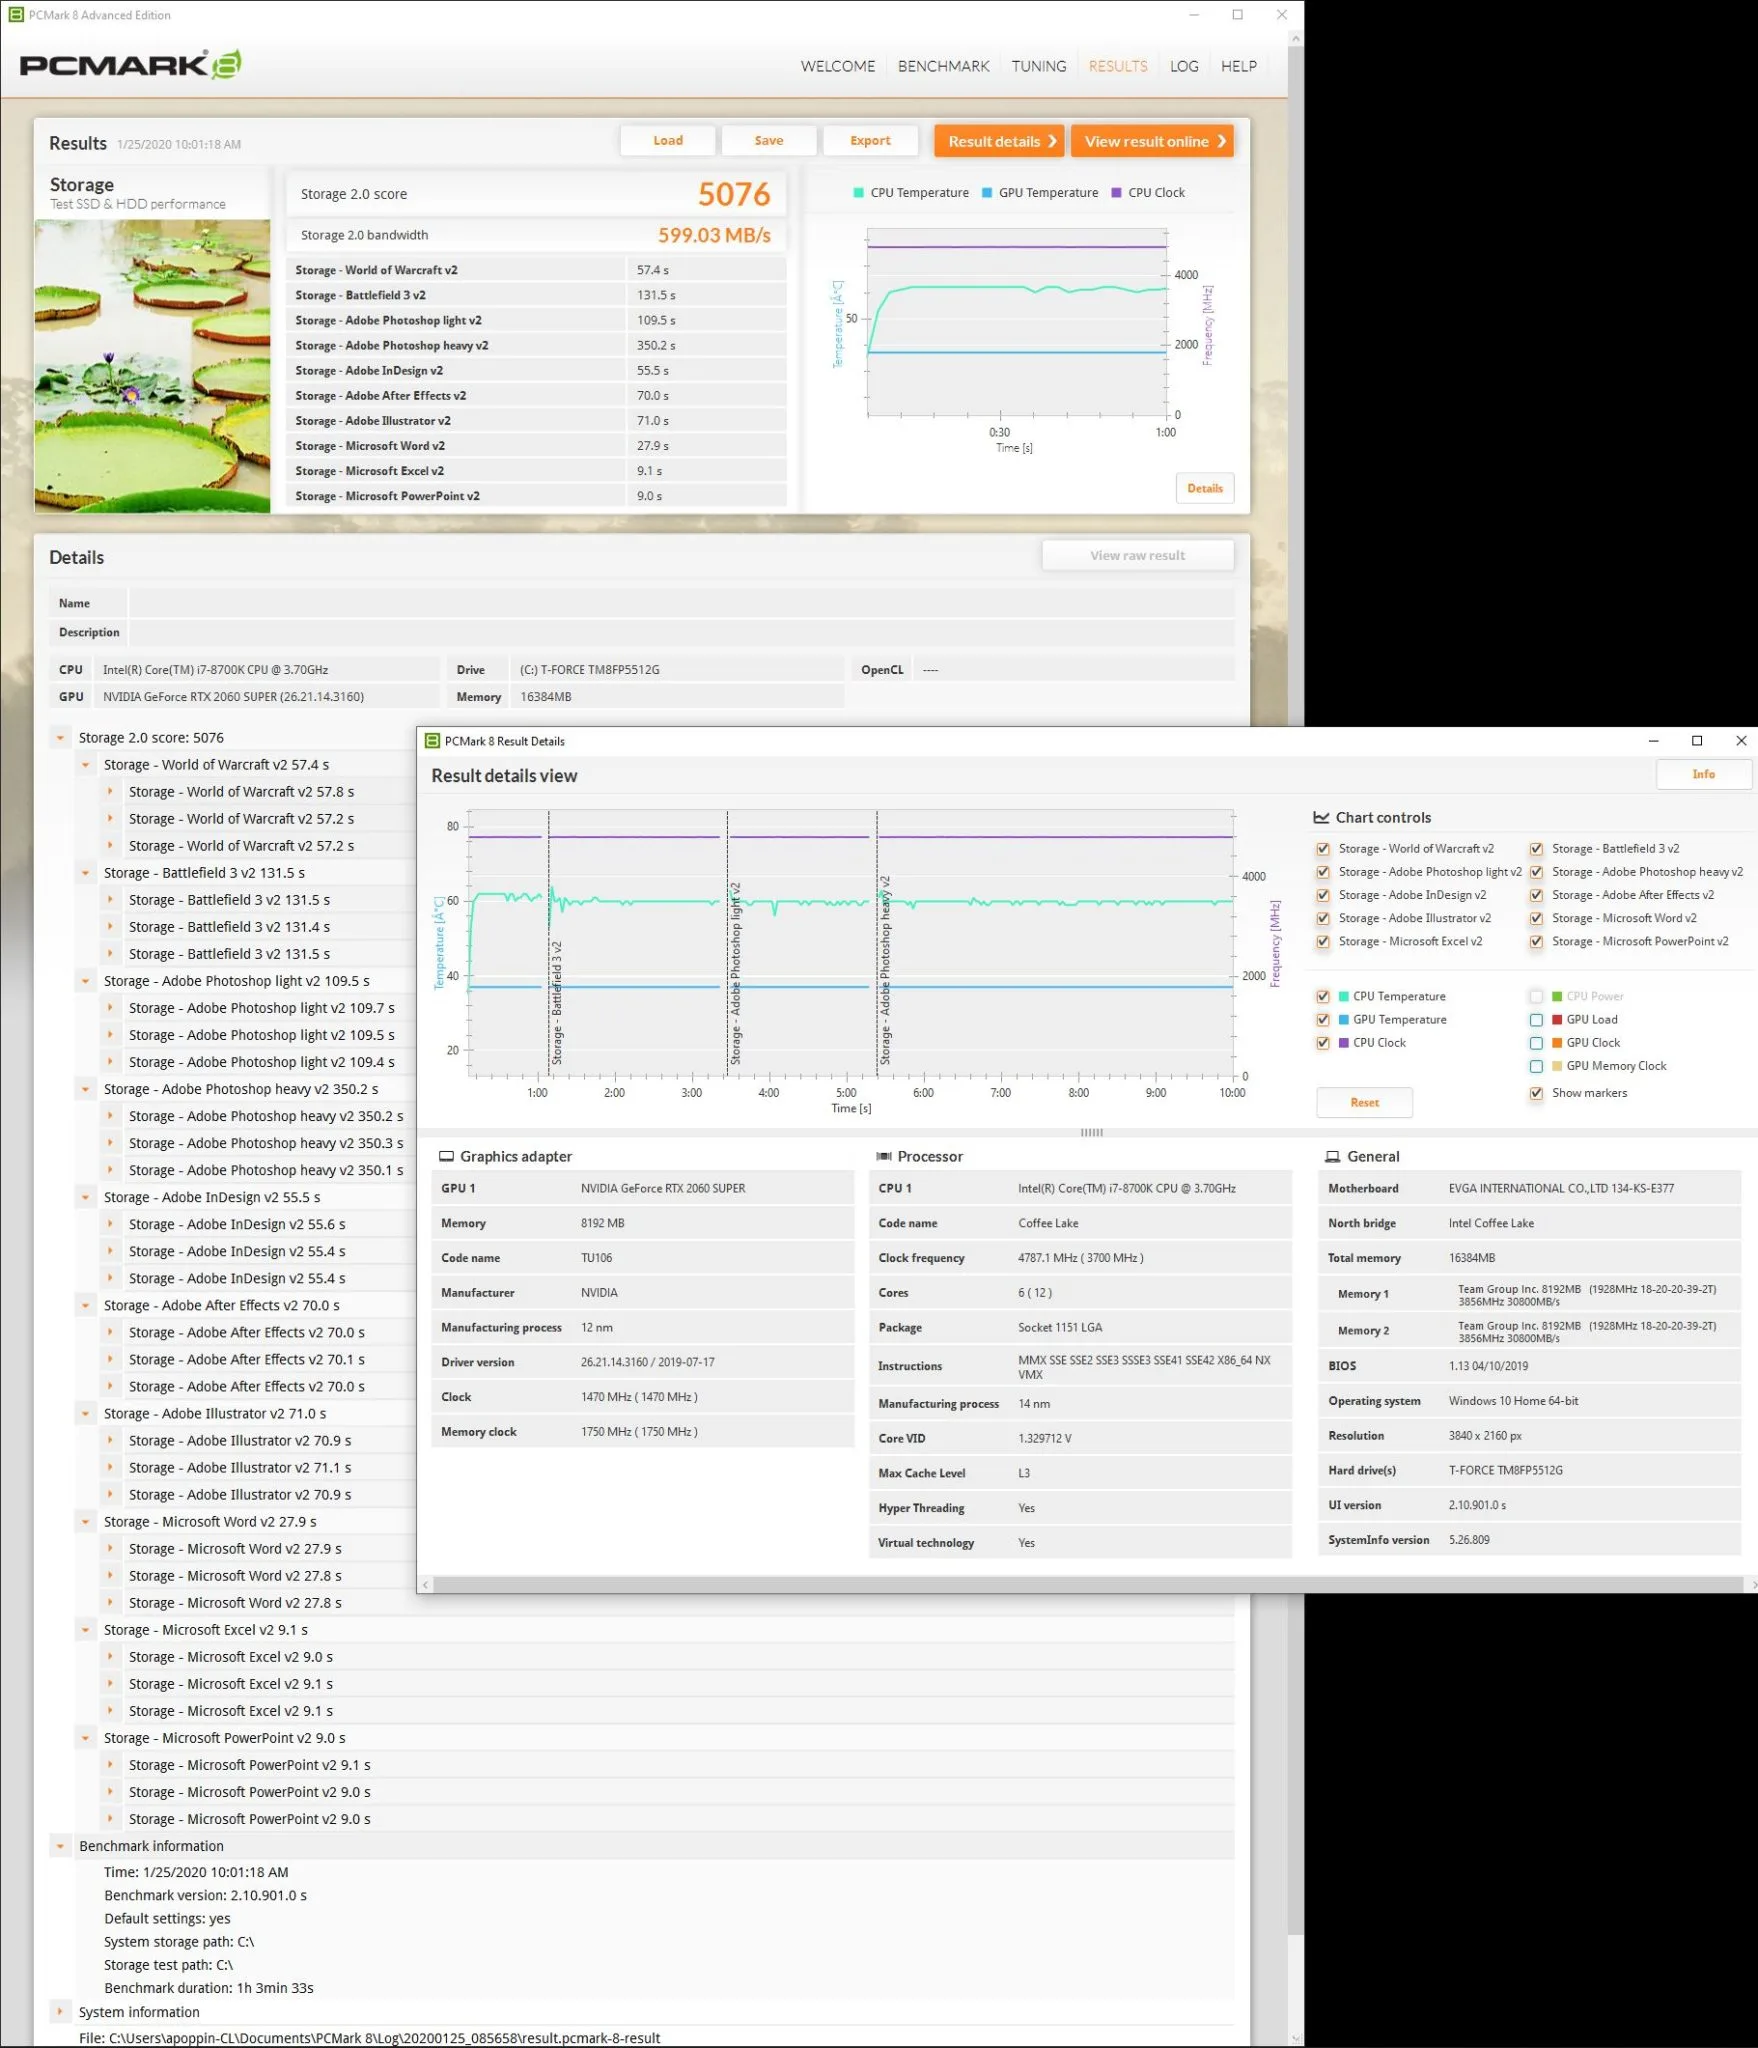
The Kingston A1000 480 GB SSD scores 5032 with a total Storage 2.0 Bandwidth of 401.30 MB/s. Of primary interest to gamers, it took 58.0 seconds to load World of Warcraft and 132.6 seconds for Battlefield 3 to load.

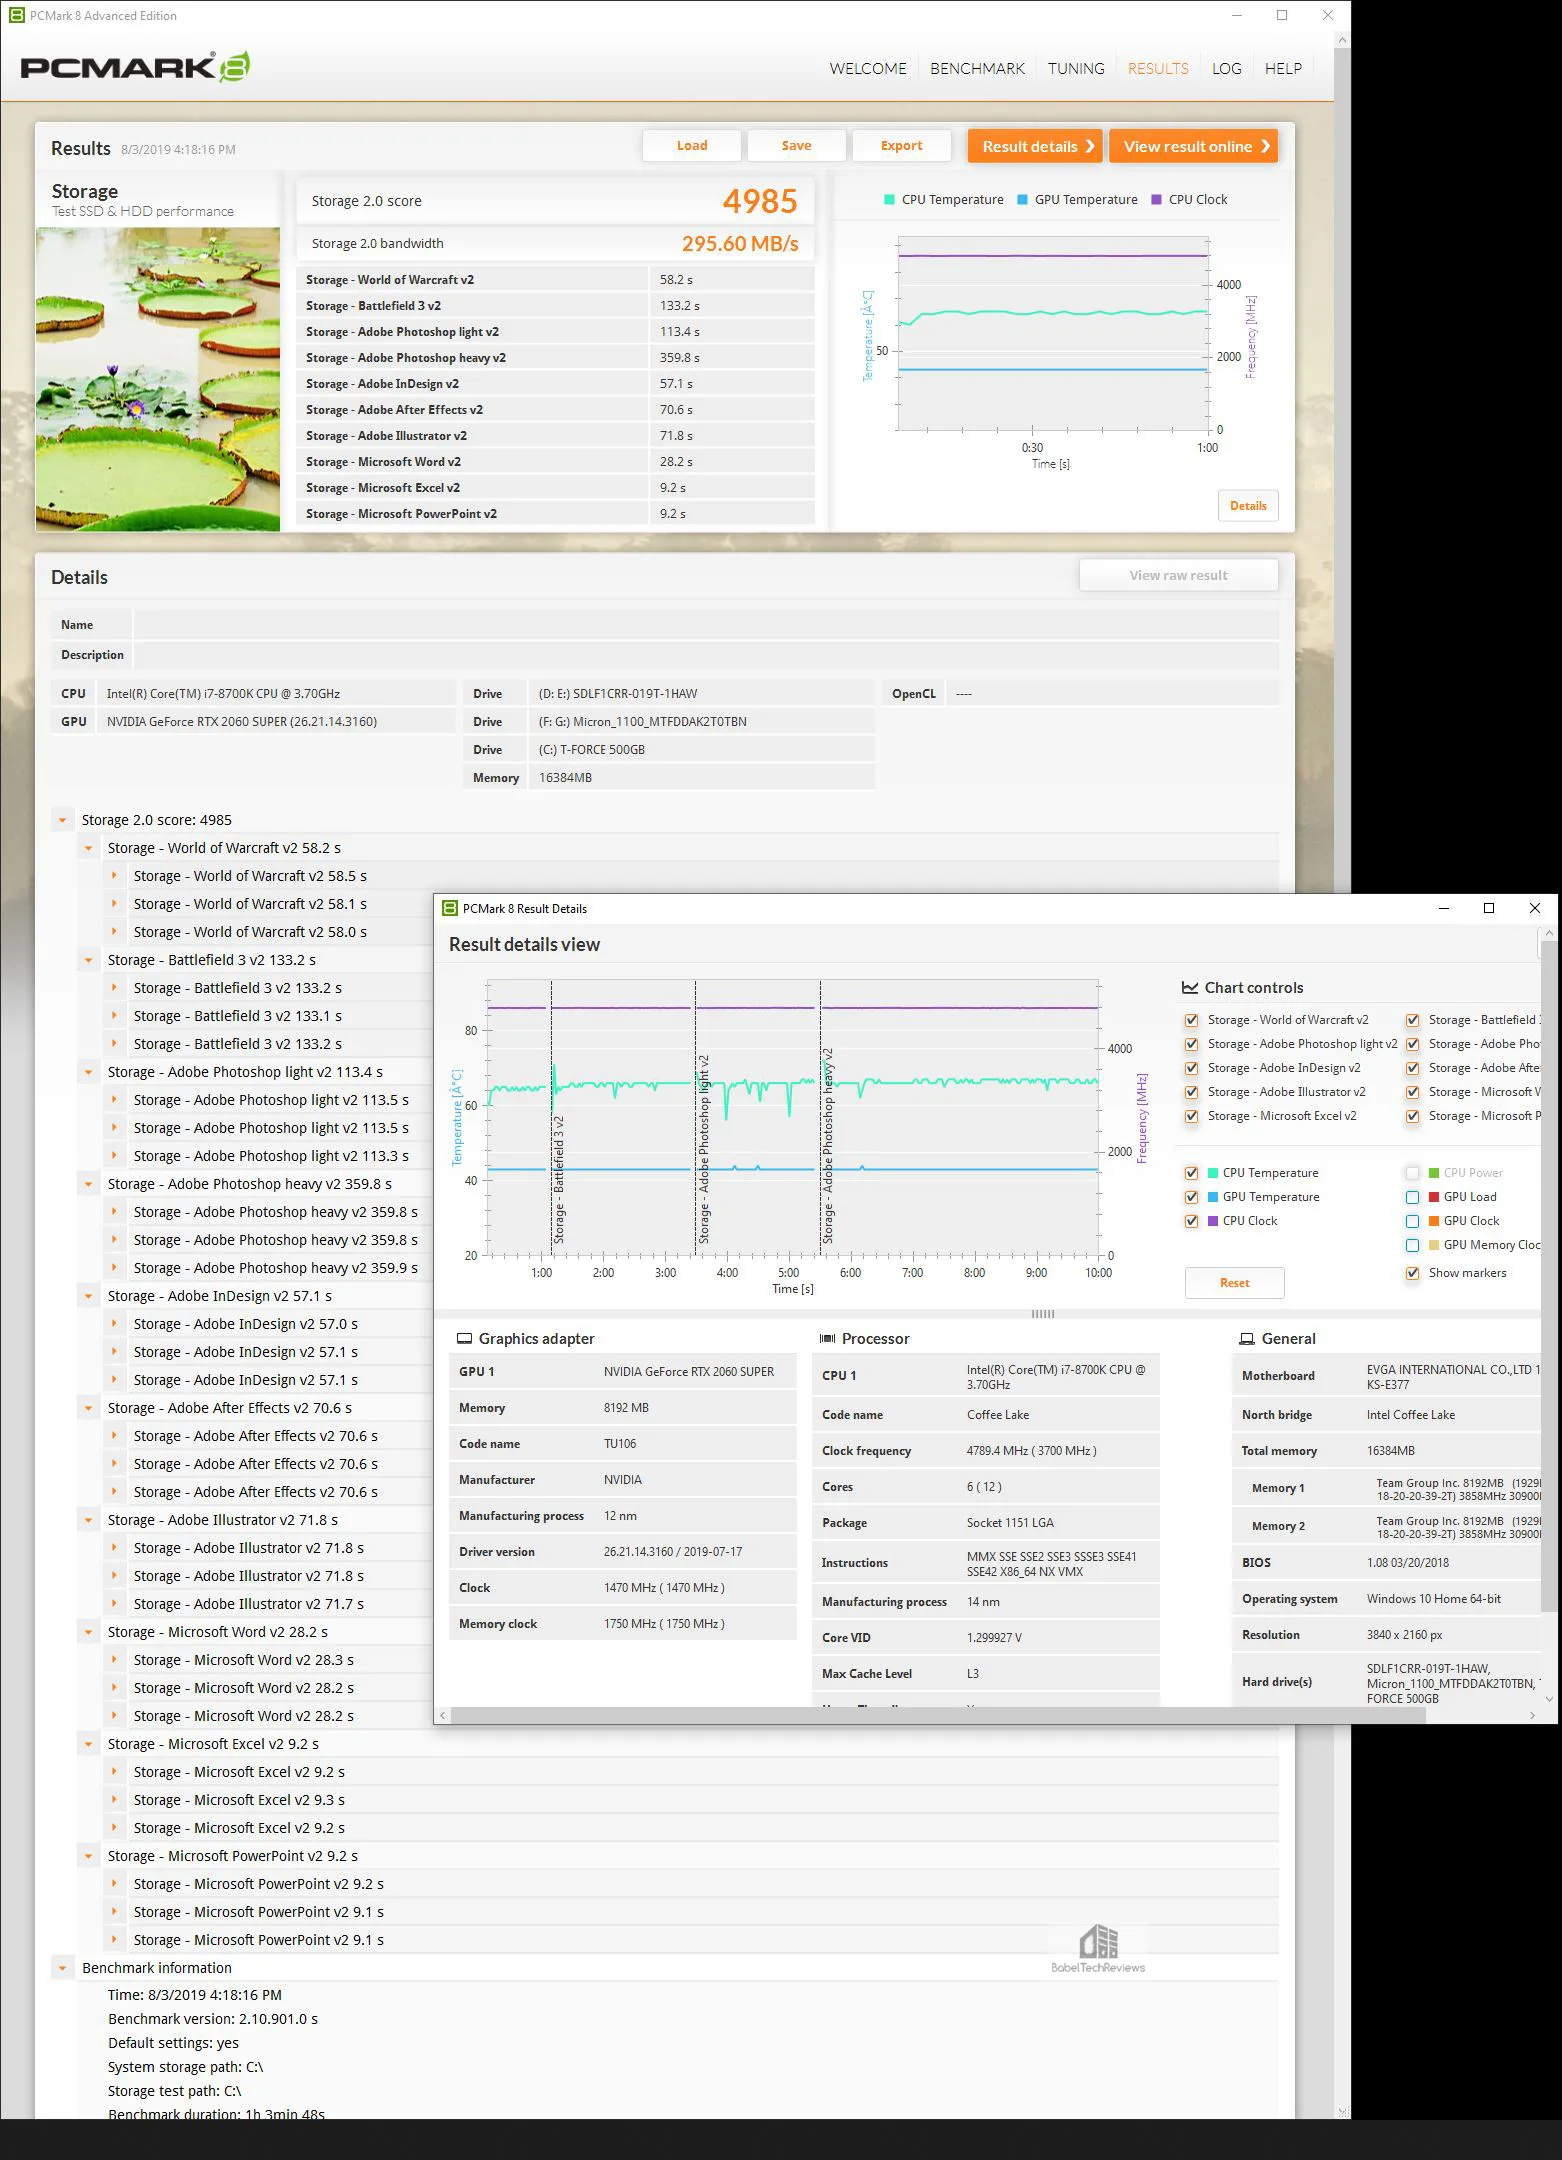
The T-FORCE Vulcan 500GB SSD scores 4985 with a total Storage 2.0 Bandwidth of 295.60 MB/s. And most importantly for a gamer, it took 58.2 seconds to load World of Warcraft and 133.2 seconds for Battlefield 3 to load.
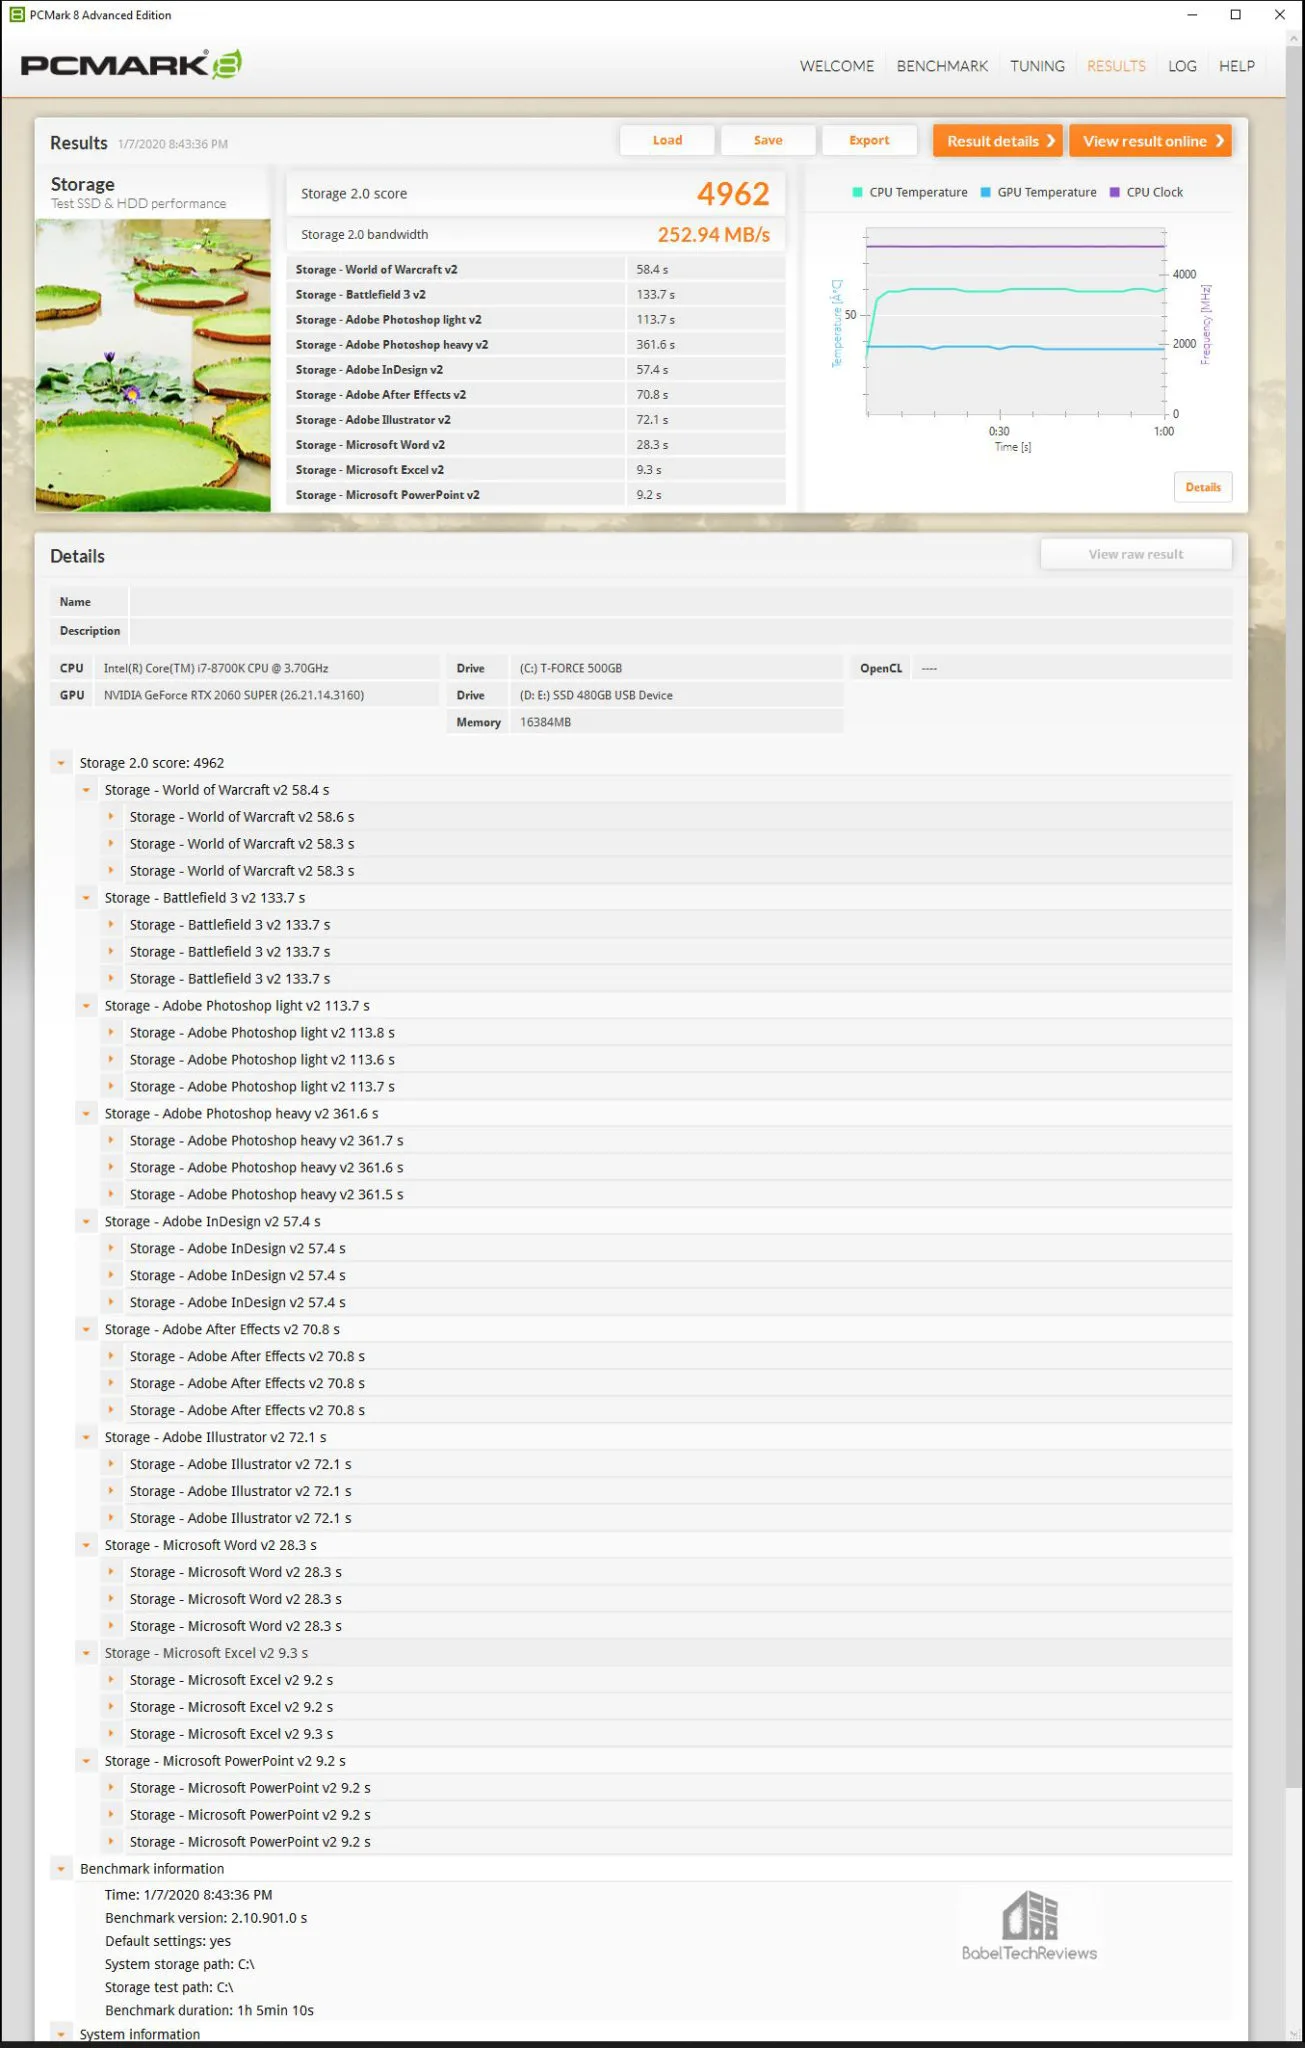
The T-FORCE Delta Max 500GB SSD scores 4962 with a total Storage 2.0 Bandwidth of 252.94 MB/s. And for gamers, it took 58.4 seconds to load World of Warcraft and 133.7 seconds for Battlefield 3 to load.
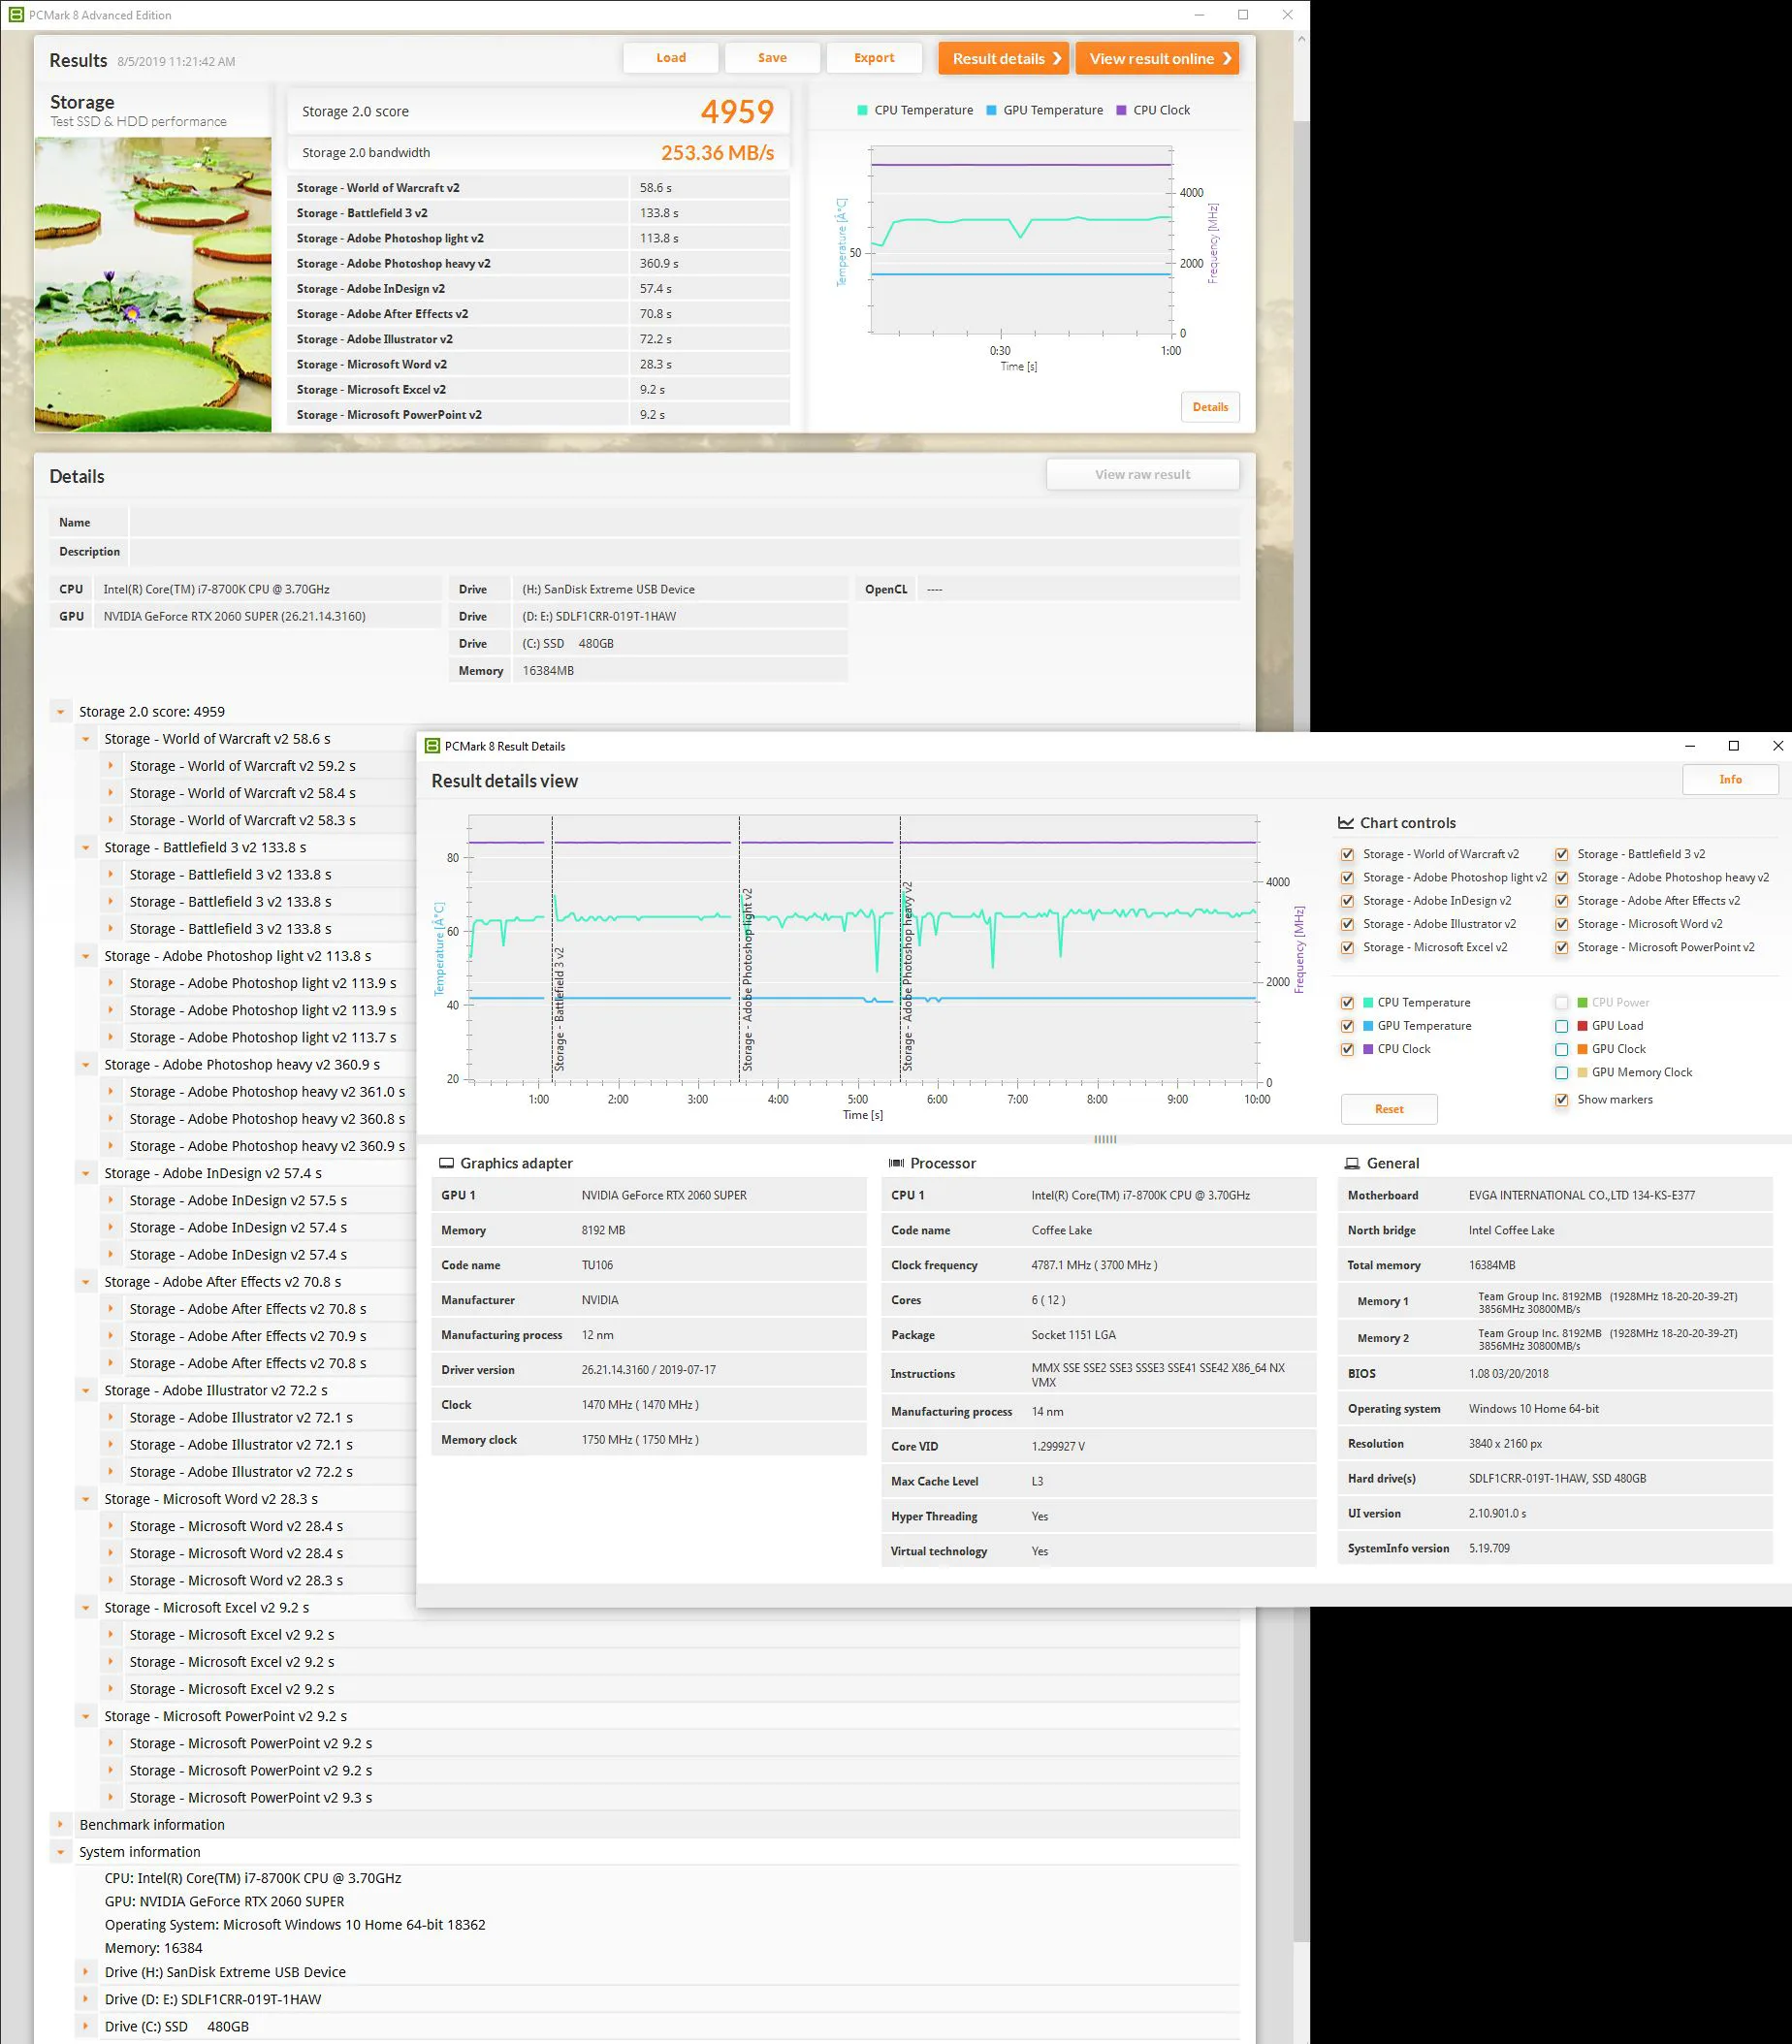
The Team Group L5 480 GB SSD scores 4959 with a total Storage 2.0 Bandwidth of 253.36 MB/s. Most importantly for a gamer, it took 58.6 seconds to load World of Warcraft and 133.8 seconds for Battlefield 3 to load.
Here are the 2TB SSHD storage test results scoring 3267 and 21.73 MB/s bandwidth and most importantly for a gamer, it took 97.1 seconds to load World of Warcraft and 250.3 seconds for Battlefield 3 to load.
Here is the PCMark 8 comparative loading times chart for World of Warcraft and for Battlefield 3. All of these charts are also repeated in the Summary.
The T-FORCE CARDEA Liquid M.2 SSD is the fastest drive overall, however, there isn’t a lot of practical difference between its loading speed results and any SATA III – or even external USB 3.1 Gen 1 SSD game loading speeds. In contrast to using any SSD, the SSHD takes nearly twice as long to load the tested two games. A SSHD only takes advantage of repeated loading of levels or games, and after 2 or 3 loads, then it will set up more quickly, approaching SSD speeds.
Here are the comparative overall PCMark 8 scores plus storage bandwidth results.

SiSoft Sandra 20/20
Before we get to gaming, we want to see exactly where drive performance results differ, and there is no better tool than SiSoft’s Sandra 2020. SiSoftware Sandra (the System ANalyser, Diagnostic and Reporting Assistant) is an complete information & diagnostic utility in one complete package. It is able to provide all the information about your hardware, software and other devices for diagnosis and for benchmarking. In addition, Sandra is derived from a Greek name that implies “defender” or “helper” – PC’s Wonder Woman of benchmarking.
There are several versions of Sandra 2020, including a free version of Sandra Lite that anyone can download and use. It is highly recommended! SiSoft’s Sandra 2020 SP2 is the very latest version (although we are still using an earlier version for consistency across all eight drives), and we are using the full engineer suite courtesy of SiSoft. It will benchmark and analyze all of the important PC subsystems and even rank your PC as well as make recommendations for improvements.
Here are the Sandra disk benchmarking tests in a single chart summarizing the performance results of our four drives.

The Cardea Liquid M.2 PCIe SSD is the fastest drive followed by the MP33 and then by the Kingston A1000 480 GB NVMe SSD. Clearly, the PCIe M.2 SSD’s overall performance is significantly faster than the other three SATA III SSDs although the DELTA MAX SSD comes in ahead of the Team Group L5 LTE SSD but just behind the Vulkan SSD. The SSHD sits way behind SSDs – including USB 3.1 – in every metric tested.
AIDA64 v6.0
AIDA64 is the successor to Everest and it is an important industry tool for benchmarkers. AIDA64’s benchmark code methods are written in Assembly language, and they are extremely optimized for every popular AMD, Intel and VIA processor core variants by utilizing the appropriate instruction set extensions. We use the Engineer’s version of AIDA64 courtesy of FinalWire. AIDA64 is free to to try and use for 30 days.
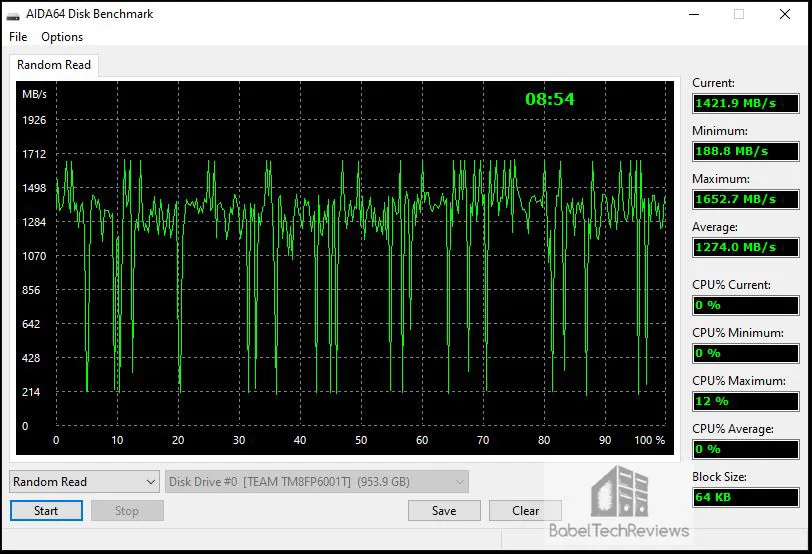
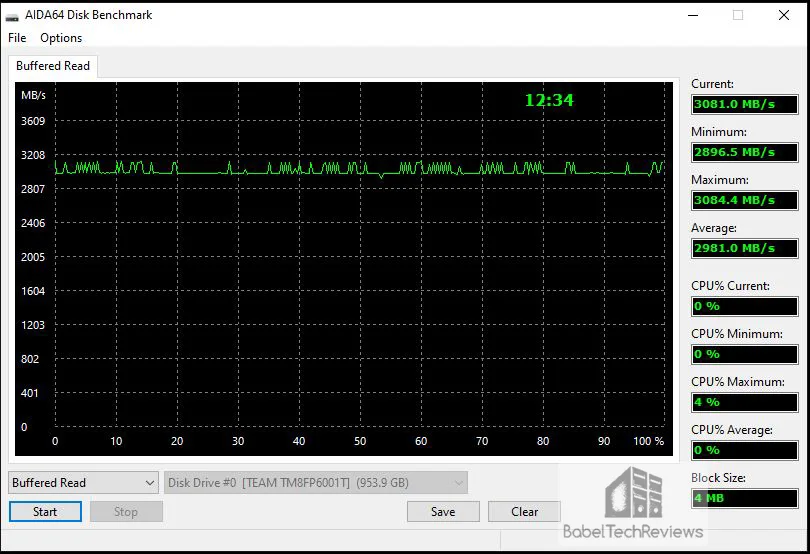
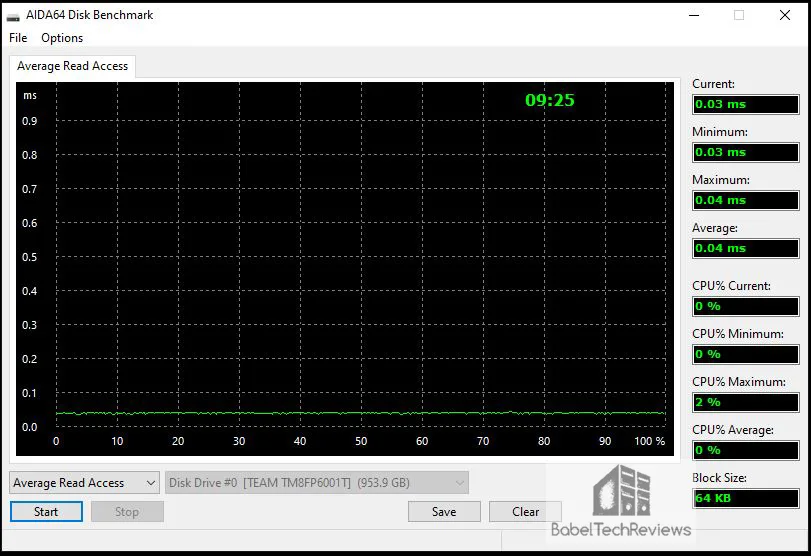
We run the AIDA64 Disk Benchmark and the 4 individual READ tests for each drive, and we include the image for each test and then summarize them in a chart. These tests are incredibly detailed and there are a lot of customization options available so we run the default tests. We did not run the Read tests as they destroy all of the data on the disks being tested.
- The Linear Read test measure the sequential performance by reading or writing all sectors without skipping any. It’s a linear view of the drives overall performance from its beginning to end.
- The Random Read test measures the random performance by reading variable-sized data blocks at random locations on the surface of the drive and they are combination of both speed and access times as its position changes before each new operation.
- The Buffered Read test will measure the drive caching.
- The Access time tests are designed to measure the data access performance by reading 0.5 KB data blocks at random drive locations.
The overall disk benchmark is relatively quick, but the individual benchmarks take much longer to chart the drive’s performance.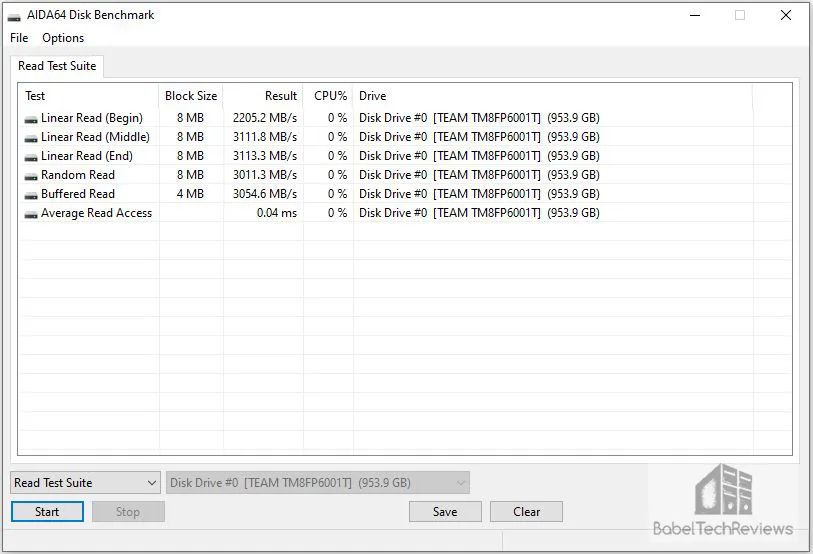
Below are the MP33 M.2 PCIe SSD’s four images of detailed individualized Read tests.

Here is the summary chart comparing our eight tested drives:
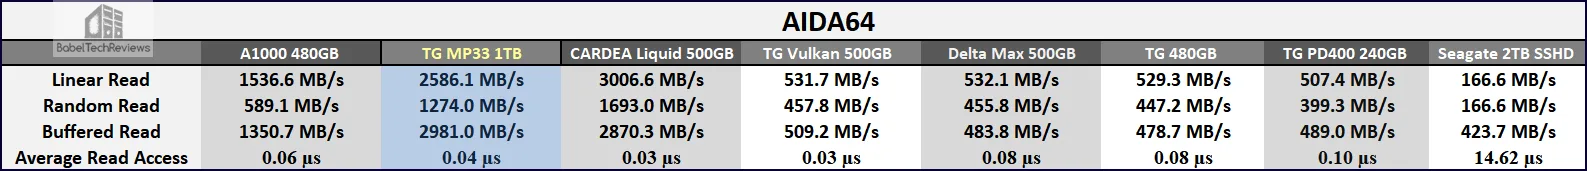
The CARDEA Liquid performs ahead of the MP33 SSD which is in turn faster than the Kingston A1000 480GB M.2 NVMe SSD. The PCIe M.2 SSDs perform significantly faster than the other SATA-based SSDs and the SATA SSDs are in turn faster than the USB 3.0 external PD400 which in turn is much faster than the SSHD.
CrystalDiskMark 6.0.0
CrystalDiskMark is a HDD benchmark utility for your hard drive that enables you to measure sequential and random read/write speeds. Here are some key features of “CrystalDiskMark”:
- Measure sequential reads/writes speed
- Measure random 512KB, 4KB, 4KB (Queue Depth=32) reads/writes speed
Here are the MP33’s results which significantly exceed Team Group’s Crystal Disk Mark claims of up to 1800MB/s Read and up to 1500MB/s Write speeds:
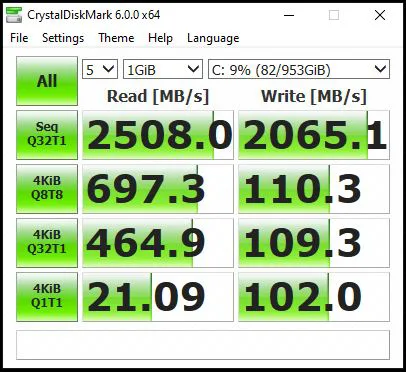
The PCIe M.2 Team Group MP33 M.2 PCIe 1TB SSD again Reads and especially Writes much faster than the Kingston A1000 SSD, but it cannot match the Read speeds of the faster CARDEA Liquid SSD although its Write speeds are similar. The PCIe M.2 SSDs are at least three times faster than the SATA SSDs all with very similar performance results, then a performance drop off with the USB 3.1 PD400 SSD, and in a very distant last place sits the FireCuda 2TB SSHD.
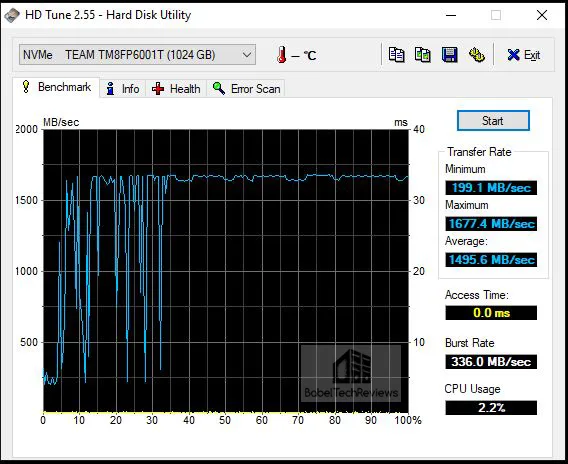
Let’s look at our next synthetic test, HD Tune. This free standalone synthetic test we use is old and it doesn’t represent real world performance but it does test some important drive metrics and it is still used today. There is also a pay-for HD Tune Pro which is up-to-date and offers more functionality.
HD Tune
HD Tune is a hard disk utility which has the following functions and it measures the performance of:
- Transfer Rate
- Access Time
- CPU Usage
- Burst Rate
- Random Access test
- Write benchmark
Hard Disk information includes partition information, supported features, firmware version, serial number, disk capacity, buffer size, transfer mode.
- Hard Disk Health
- S.M.A.R.T. Information (Self-Monitoring Analysis and Reporting Technology)
- Power On Time
- Error scan
- Temperature display
Here is the Team Group MP33 M.2 PCIe SSD HD Tune benchmark.
Here are the HD Tune benches summarized in a chart of our eight tested drives

The MP33 sits closely behind the the CARDEA Liquid SSD with the Kingston A1000 PCIe M.2 NVMe SSD trailing behind although it is still much faster than the SATA SSDs. As usual, the PD400 USB SSD suffers a further performance drop, and the SSHD trails in distant last place.
Next we benchmark using AS SSD.
AS SSD
AS SSD is especially designed for Solid State Drives (SSD). This tool contains synthetic and practice tests. The synthetic tests determine the sequential and random read and write performance of the SSD without use of the operating system caches. In Seq-test the program measures how long it takes to read and write a 1 GB file.
In the 4K test, read and write performance for random 4K blocks are determined. The 4K-64-thrd test are similar to the 4K procedure except that the read and write operations on 64 threads are distributed as in the usual start of a program. In the copying test, two large ISO file folders are created, programs with many small files, and a games folder with small and large files. These three folders are copied by the OS copy command with the cache turned on. AS SSD gives an overall “score” after it runs the benchmarks.
Here is the Team Group MP33 M.2 PCIe 1TB SSD AS SSD benchmark results.
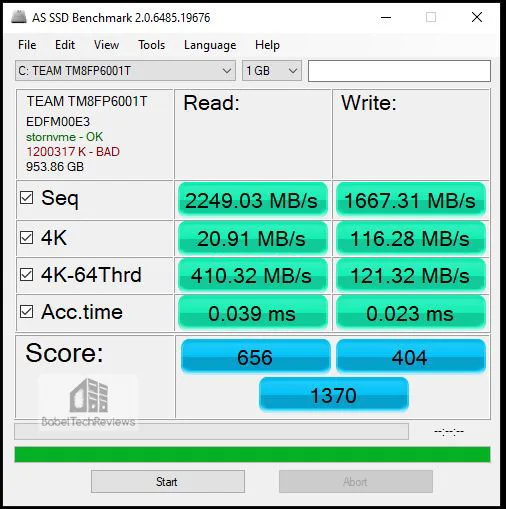
Here is the summary of our eight drives.

The SSHD or HDD tests appear to take forever with AS SSD and they score very low compared to any SATA SSD and the PCIe SSD score as much faster. The MP33 SSD got an unusually low AS SSD score with an error message even though its Read and Write speeds appear to be right.
The M.2 SSDs are by far the very fastest with the CARDEA Liquid just ahead of the MP33, but scoring nearly twice the performance of the Kingston A1000 M.2 PCIe SSD. The Vulkan SSD is faster than the DELTA MAX SSD which is in turn faster than the L5 LTE SSD. The USB 3.1 PD400 is the slowest of our eight tested SSDs but it is still much faster than any SSHD.
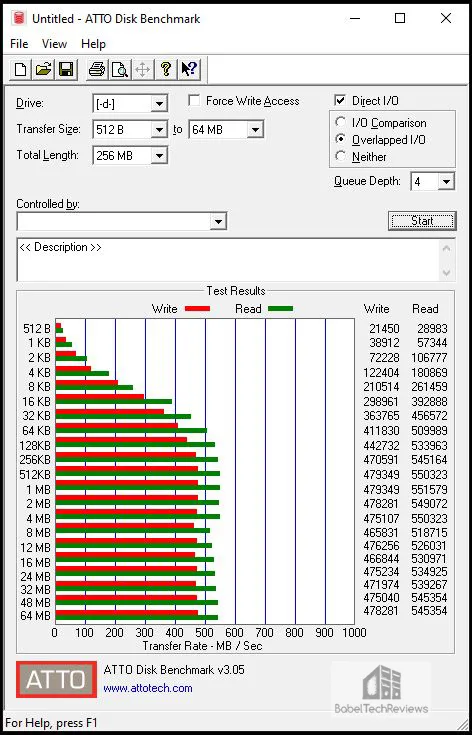
ATTO
ATTO is a low level hardware benchmark for random access read/write storage devices including for SSDs and HDDs. HD Tach uses custom device drivers and low level Windows interfaces to determine the physical performance of the device.
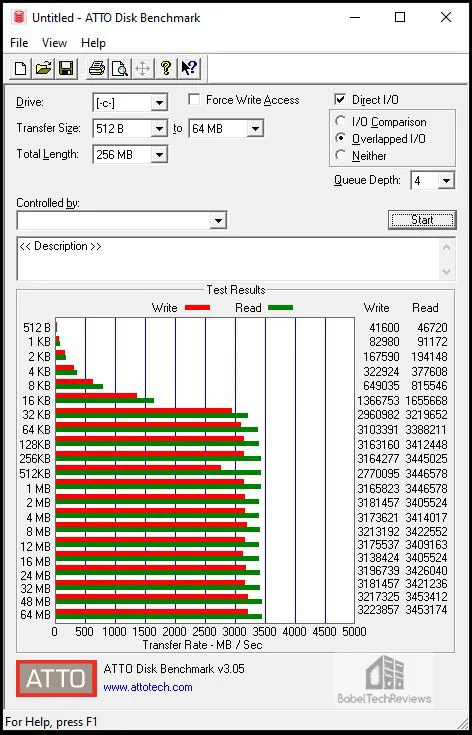
Team Group MP33 M.2 PCIe 1TB SSD ATTO results are up first and they are quite impressive compared to the other SSDs, even compared to the faster CARDEA Liquid SSD. We are looking for evenness with the Read and Write graphs as well as consistent speeds, and the MP33 does rather well.
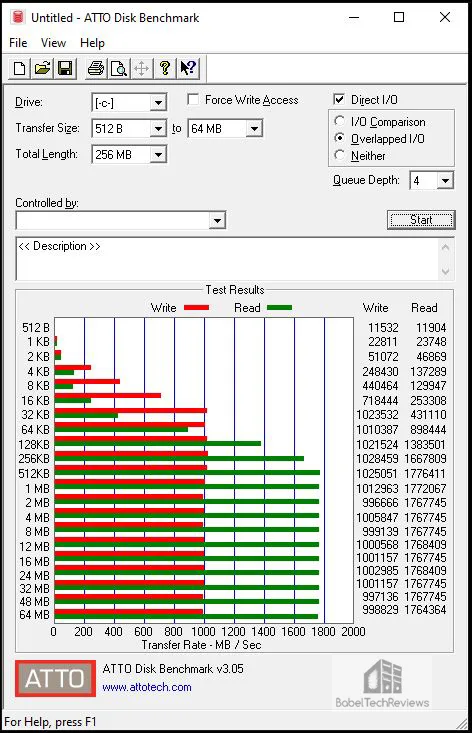
The T-FORCE CARDEA Liquid M.2 PCIe SSD
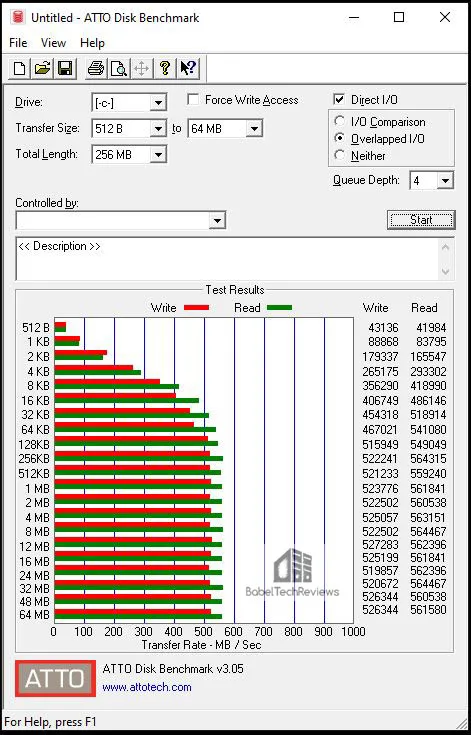
The Kingston A-1000 480 GB SSD ATTO Disk benchmark results are next.
Now the T-FORCE Vulcan 500GB SSD ATTO disk benchmark results.
Here is the T-FORCE Delta Max 500GB SSD ATTO benchmark.
Here are the Team Group 480GB L5 SSD‘s ATTO disk benchmark results.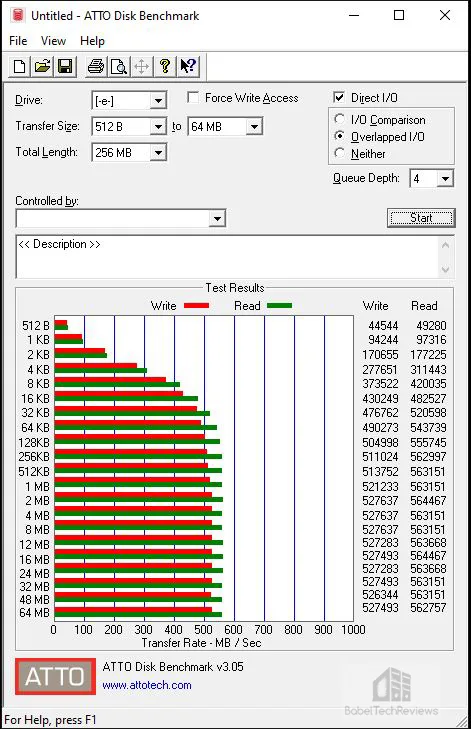
Here is the ATTO Team Group PD400 240GB SSD results:
The FireCuda 2 TB SSHD’s ATTO benchmark results are up last.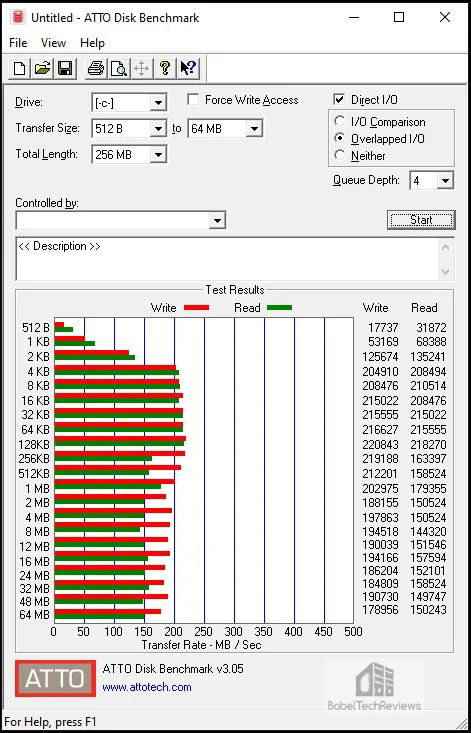
ATTO shows the NVMe SSDs with the CARDEA Liquid and MP33 SSDs ahead of the A1000 but well ahead of the three other SATA III SSDs followed more distantly by the external PD400 and then finally the SSHD which trails in every test.
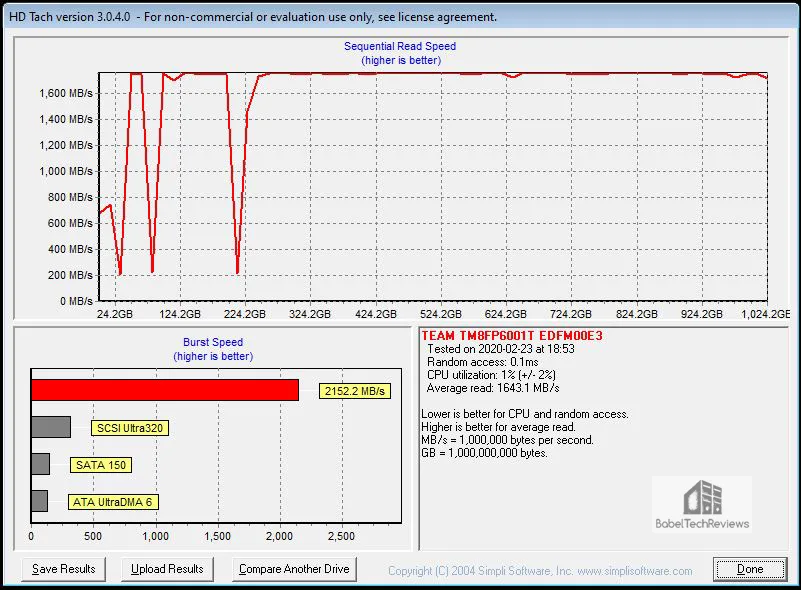
HD Tach
HD Tach is a low level hardware benchmark for random access read/write storage devices including for SSDs and HDDs. HD Tach uses custom device drivers and low level Windows interfaces to determine the physical performance of the device. It is no longer supported and needs to be run in compatibility mode for Windows 7.
Here is the Team Group MP33 M.2 PCIe 1TB SSD HDTach benchmark results with an average read of 1643.1MB/sec and a burst speed of 2152.2MHz.
Here are the HD Tach Disk benches summarized in a chart comparing our six tested drives.

As usual, the PCIe M2 SSDs lead with the CARDEA Liquid a bit ahead of the MP33, and both of these SSDs are well ahead of the Kingston A1000 which in turn is solidly ahead of the other SATA III SSDs and the USB portable SSD. The SSHD sits in last place.
File Copying
The Team Group MP33 M.2 PCIe 1TB SSD is quite capable at copying files but it is inconsistent in its speeds for really large files. It took about 2 minutes and 45 seconds to copy a 22.6GB Steam folder from program files to the desktop (about 45 seconds slower than the fastest CARDEA Liquid SSD), but almost 10GB of the total was copied in less than 20 seconds after a really slow start.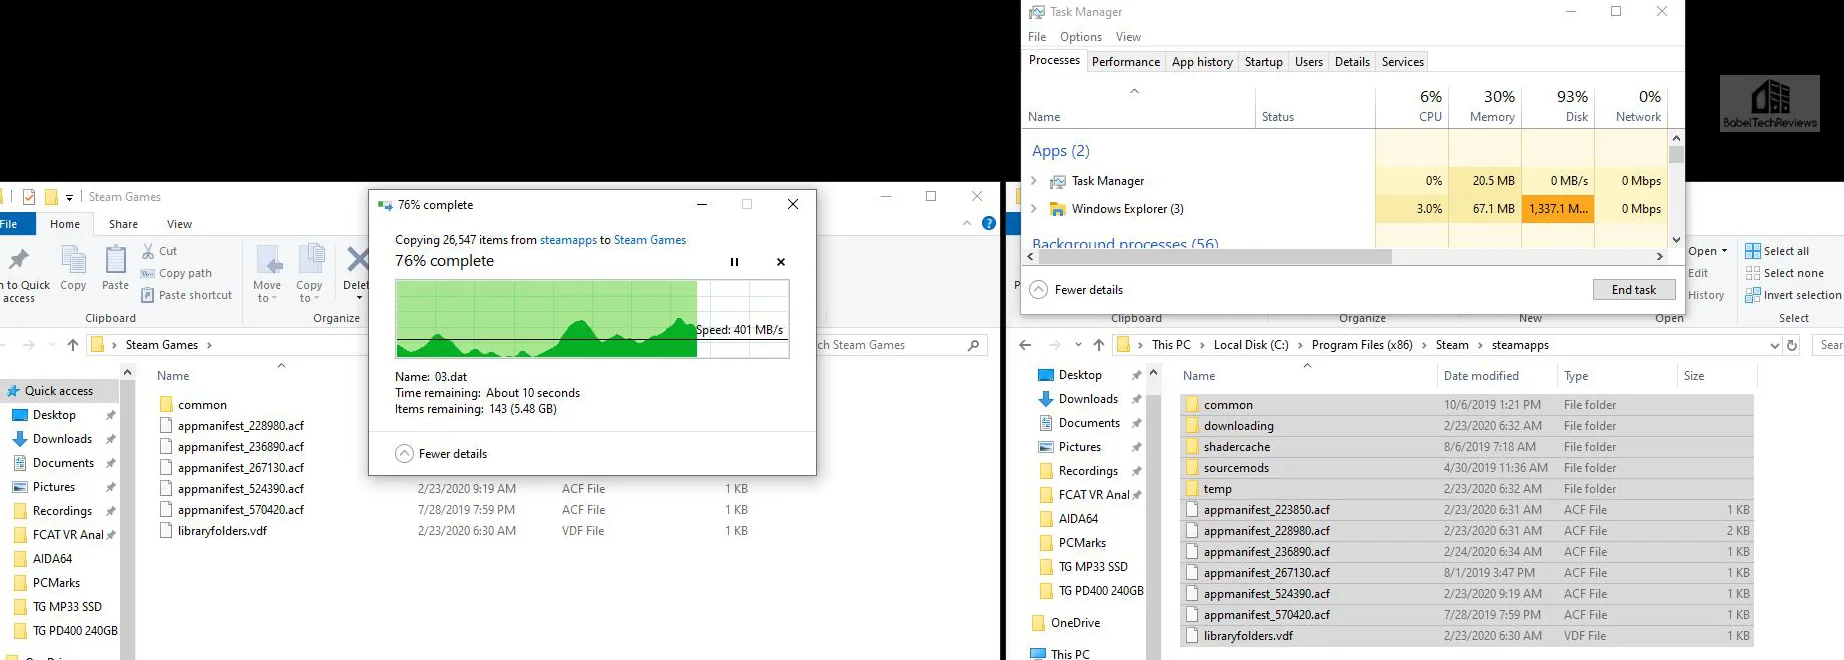
If you do a lot of daily file copying, then you might consider a super-fast PCIe NVMe SSD with blazing fast Read/Write speeds.
Let’s look at game and game level loading times next.
The Game/Level Loading Time Results
Game and game level loading time results are very difficult to measure accurately which is why we use the ultra-precise loading tests of World of Warcraft and Battlefield 3 in PCMark 8. It is easy to see that generally SSDs perform similarly with regard to game loading times and they are miles ahead of any HDD.
Even though the synthetic tests show the M.2 PCIe SSDs are much faster than SATA III or USB 3.1 SSDs, the actual loading time for two test games save only 1 to 5 seconds each between the fastest CARDEA Liquid and the slowest USB 3.1 SSD. In contrast, hard disk drives can take nearly twice as long to load a game compared with even the slowest SSD. And Solid State Hard Disks only take advantage of their hybrid status after multiple subsequent loadings of the same game or game level.
Until developers start to target SSDs for game storage, or perhaps after consoles move completely away from hard disk drives, we will probably no longer see SSDs held back from achieving the game loading performance that they are capable of. NVMe PCIe M.2 SSDs are significantly faster than SATA-based SSDs just as external USB 3.1 SSDs are generally a bit slower. The only reasons to recommend a HDD or SSHD over a SSD are based on high capacity and a lower cost per gigabyte for storage.
Here are all of our Summary Charts in one place for easy reference.
Non-Gaming Summary Charts
At $169.99 for the 1TB version, the T-FORCE CARDEA Liquid M.2 PCIe SSD is the most expensive as well as the fastest SSD that we tested and it costs almost $40 more than the MP33 1TB SSD. The Kingston A1000 SSD which is also considered midrange for a M.2 PCIe based SSD has been replaced by the upgraded A2000 which sells for $175. Those who desire having the fastest PCs, will want a PCIe NVMe SSD while those who want to show it off will probably pick a RGB SATA SSD (or even the flashy CARDEA Liquid NVMe drive).
We recommend that gamers move from a HDD or a SSHD to any SSD including to an inexpensive USB 3.1-based SSD. The PD400 external USB 3.1 drive is faster than the SSHD although it is the slowest of our SSDs. All three of the SATA drives perform close to each other with the Vulkan being the fastest followed by the DELTA MAX and then the Team Group LTE SSD. The Kingston A1000 is an entry-level M.2 PCIe SSD while the T-FORCE CARDEA Liquid is quite fast with its price premium partly coming from being a completely unique liquid-filled showpiece. And in-between, although much closer to the CARDEA Liquid in performance than the A1000, sits the $129.99 MP33.
The Team Group MP33 M.2 PCIe SSD is incredibly fast for all day to day tasks, and it doesn’t need heatsinks since its temperatures never approach 60C. Windows 10 sets up and shuts down quickly, and MS documents and apps open and save almost instantaneously while photo editing is very quick. Copying large files are also quick, and Steam downloads no longer cripple productivity as with using a HD based PC.
Windows 10 is becoming more painful to use when installed on a mechanical or even on a hybrid solid state/hard disk drive. Indexing, Search, or Anti-malware automatic programs may often saturate the bandwidth of a mechanical drive, and even downloading or updating Steam games may slow your PC to an irritating crawl.
Let’s head for our conclusion.
The Conclusion & Verdict
SSD technology is still improving and again it seems that overall SSD pricing is reasonable as manufacturers seek to differentiate their SSDs from each other. The CARDEA Liquid M.2 PCIe SSD commands a premium price by virtue of how it looks. In contrast, the Team Group MP33 is not flashy and will likely spend its life hidden behind a video card. The MP33 will appeal mostly to gamers who want a good performing all-around M.2 PCIe SSD at a reasonable price.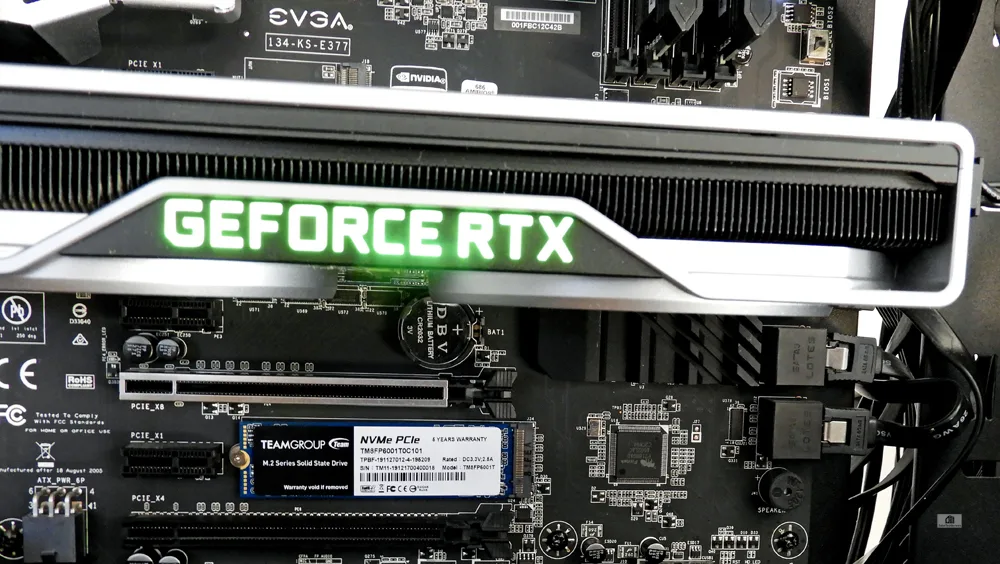
At its $129.99 suggested price, the Team Group MP33 M.2 PCIe 1TB SSD is priced a little high compared with other similar 1TB SSDs that usually sell in the $120 range.
Pros
- The Team Group MP33 M.2 PCIe 1TB SSD delivers what it promises – plus.
- The MP33 SSD is reasonably fast as a M.2 PCI2 SSD and it sits well ahead of the Kingston A1000 M.2 PCIe SSD and considerably faster than any SATA III SSD
- 2280 M.2 form factor with no heatsink insures compatibility with most notebooks and desktops
- 5-year warranty backed by Team Group support
Cons
- Price is a little high
This has been quite an enjoyable exploration comparing our other seven drives with the Team Group MP33 M.2 PCIe 1TB SSD. We like its performance and will recommend it for a gamer that wants a solid no-frills M.2 PCIe SSD.
The Verdict: Recommended
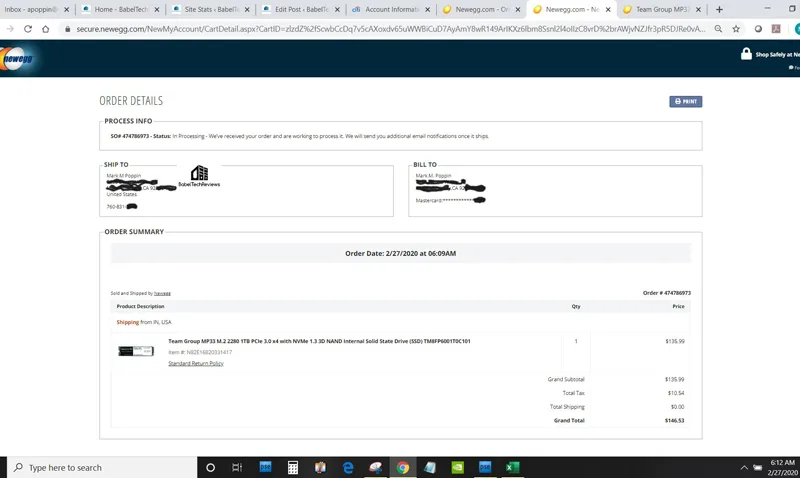
![]() We are giving the Team Group MP33 M.2 PCIe 1TB SSD BTR’s “Recommended” Award even though it is priced a little higher than some similar performing drives. It is faster than its specifications and it has a five year warranty. In fact, we like it so well that we purchased a second Team Group 1TB MP33 from Newegg this morning to replace our pair of 480GB SATA SSDs.
We are giving the Team Group MP33 M.2 PCIe 1TB SSD BTR’s “Recommended” Award even though it is priced a little higher than some similar performing drives. It is faster than its specifications and it has a five year warranty. In fact, we like it so well that we purchased a second Team Group 1TB MP33 from Newegg this morning to replace our pair of 480GB SATA SSDs.
As a gamer, we can never return to daily using hard disk drives ever again and would recommend using a HDD or SSHD only for backup and storage. However, we do not need the blazing speeds of the fastest M.2 SSDs as they make almost zero difference for gaming – or for just about anything we do on our PC. We don’t mind waiting an extra second or two for a game to launch and we rarely copy hundreds of GB of data from one location on our drive to another. In fact, we are still satisfied with our Team Group LTE SATA III SSDs regarding speed, but we need a capacity upgrade for our two C drives, and two 1TB MP33 SSDs will fill our need perfectly.
Stay tuned. We plan to continue our Indie ray tracing series shortly, and will also return to VR for a rematch between the RX 5700/XT and the RTX 2060/2070 Super video cards.
Happy Gaming!