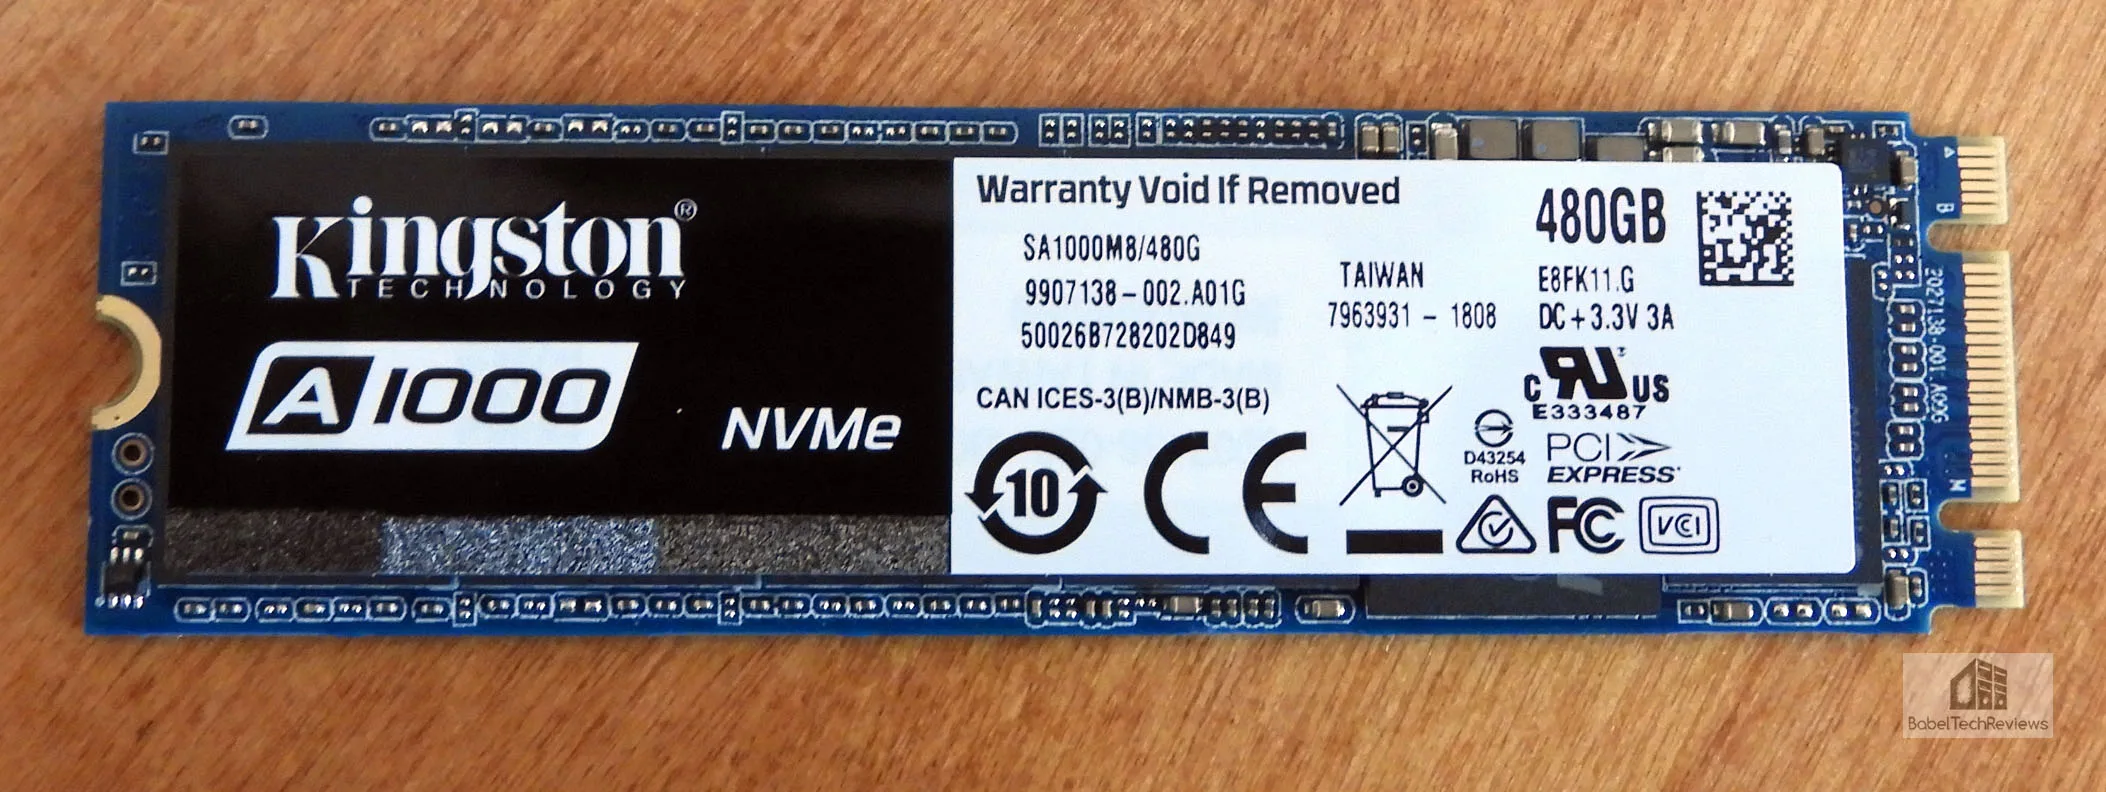
The Kingston A1000 NVMe 480 GB SSD review
Solid State Drives (SSD) have advantages for gamers over using Hard Disk Drives (HDD) by saving game level and loading times, and by giving many apps a noticeable performance boost. SSD pricing has recently softened, and we now use a 480 GB SATA III 3D NAND SSD as our C drive. Last week, Kingston sent us their entry-level 480 GB A1000 NVMe SSD (SA1000M8/480G) which they claim is ‘affordable’ as well as “twice as fast as a SATA-based SSD”, and we are here to test it.
BTR uses two identical boot drives – one for AMD and one for NVIDIA – together with a 1.92 TB SanDisk SSD for our primary game storage and a 2 TB Seagate FireCuda SSHD (Solid State Hard Drive) for additional storage. In addition, we just purchased a 2 TB Micron 1100 SSD from Rakuten/Platinum Micro on sale for $269 which will replace our 2 TB SSHD, and we now have an all-SSD PC.
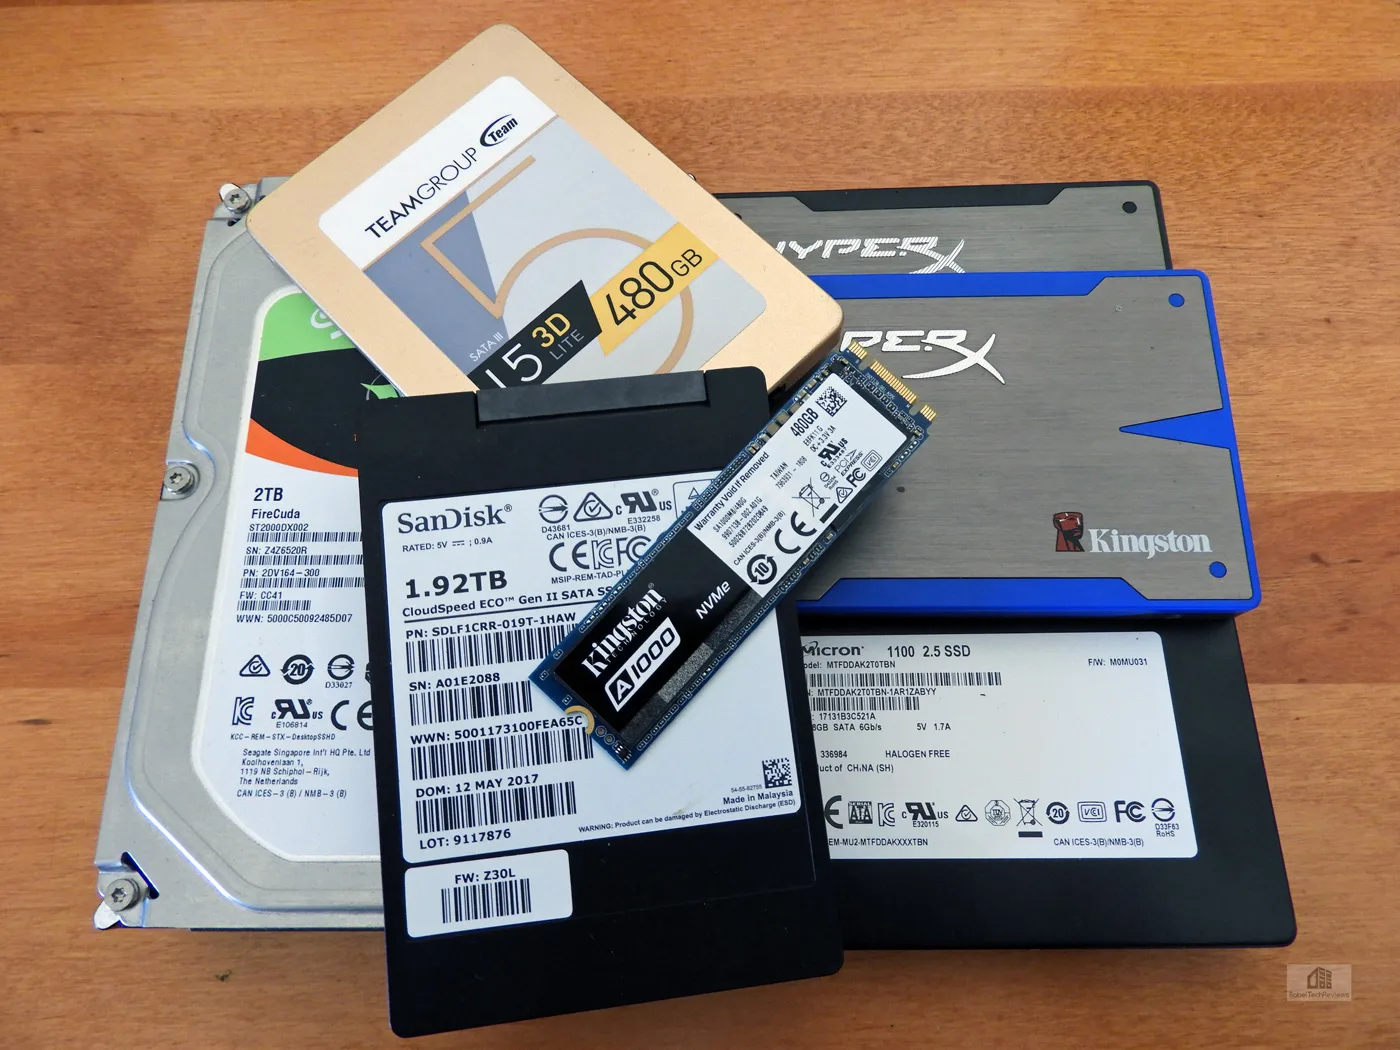
For this review, we are going to compare six SSDs from several generations – the original Kingston 240 GB HyperX (brown) and its faster memory-equipped sibling, the 240 GB HyperX Blue; a 1.92 TB SanDisk enterprise-class SSD, our new 2 TB Micron 1100 SSD, and the 480 GB Team Group SSD – to a 2 TB FireCuda SSHD which is a 7200 rpm Seagate HDD coupled with 8 GB of flash drive.
Both HyperX SSDs use 25nm MLC and the second generation of SandForce SSD controller (SF-2281). The 1.92 TB SanDisk CloudSpeed ECO Gen II SSD (SXPLFA) is a Generation II 15nm MLC SSD with an emphasis on enterprise reliability. In contrast, the Team Group SSD, the Micron 1100 2 TB enterprise SSD, and the Kingston A1000 all use 3D NAND.
This testing setup uses Windows 10 64-bit, featuring an Intel Core i7-8700K overclocked to 4.7 GHz for all cores as set in the EVGA Z370 FTW motherboard’s BIOS, and 16 GB of HyperX DDR4 at 3333MHz. The settings and hardware are identical except for the seven drives being tested, and the graphics are powered by a GTX 1070 Ti Founders Edition (FE). We benchmark with all of our drives at less than 75% capacity, and in addition, all of the drives except for the Kingston A1000 and the Micron 1100, which we have “dirtied” using IOmeter, have been in use for months, so our testing results are real world.
Here are the features and specifications of the Kingston A1000 from Kingston’s website, and it is currently selling there for $218.40.
A1000 Features and Specifications :
- 20X faster than a hard drive1: With incredible read/write speeds the A1000 will not only increase performance but can also be used to breathe new life into older systems.
- M.2 2280 Form Factor: Multi-purpose SFF connector replaces small mSATA and mini-PCIe slots.
- Single-sided design: Integrates easily into designs with M.2 connectors; ideal for thin and light notebooks and in systems with limited space.
- Multiple capacities: Available in a range of capacities up to 960GB2 to meet your data storage requirements.
- Form Factor: M.2 2280
- Interface: PCIe NVMe Gen 3.0 x2 Lanes
- Capacities2: 240GB, 480GB, 960GB
- Controller: Phison 5008
- NAND: 3D TLC
- Sequential Read/Write1:
- 240GB: up to 1,500/800MB/s
- 480GB: up to 1,500/900MB/s
- 960GB: up to 1,500/1,000MB/s
- Random 4K Read/Write:
- 240GB: up to 100,000/80,000 IOPS
- 480GB: up to 100,000/90,000 IOPS
- 960GB: up to 120,000/100,000 IOPS
- Power Consumption: 0.011748W Idle / 0.075623W Avg / 0.458W (MAX) Read / 0.908W (MAX) Write
- Dimensions: 80mm x 22mm x 3.5mm
- Operating Temperature: 0°C to 70°C
- Storage Temperature: -40°C to 85°C
- Weight:
- 240GB: 6.4g
- 480GB: 7g
- 960GB: 7.6g
- Vibration operating: 2.17G Peak (7-800Hz)
- Vibration non-operating: 20G Peak (20-2000Hz)
- Life Expectancy: 1 million hours MTBF
- Warranty/support3: Limited 5-year warranty with free technical support
- Total Bytes Written (TBW)4:
- 240GB: 150TB
- 480GB: 300TB
- 960GB: 600TB
Of course, there is the fine print, and the details and disclaimers can be found on the Kingston website. Important key highlights are that the A1000 drive is fast, durable, tiny – it uses very little power, and it is backed by Kingston’s 5-year warranty with superb customer service. Here are the specifications for those who prefer to read them on a compact chart.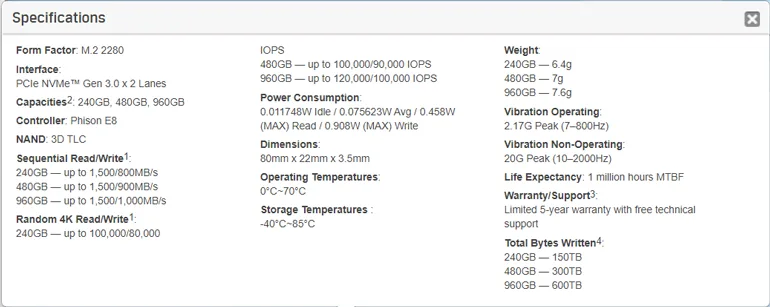
The datasheet can be downloaded as a .pdf here and it mentions, “Hard Drive Cloning Software – Download Coupon” as included. Indeed there is a coupon for a free download of the industry standard’s Acronis True Image HD cloning software included with the A1000. This Acronis cloning software is a very nice money-saving feature for most users.
The specifications look good for an entry-level NVMe SSD. Let’s take a closer look by unboxing the Kingston A1000 NVMe SSD next.
Unboxing
The Kingston A1000 480 GB NVMe SSD comes in a very basic blister pack which doesn’t include a mounting screw (it comes with the motherboard) nor does it advertise its features.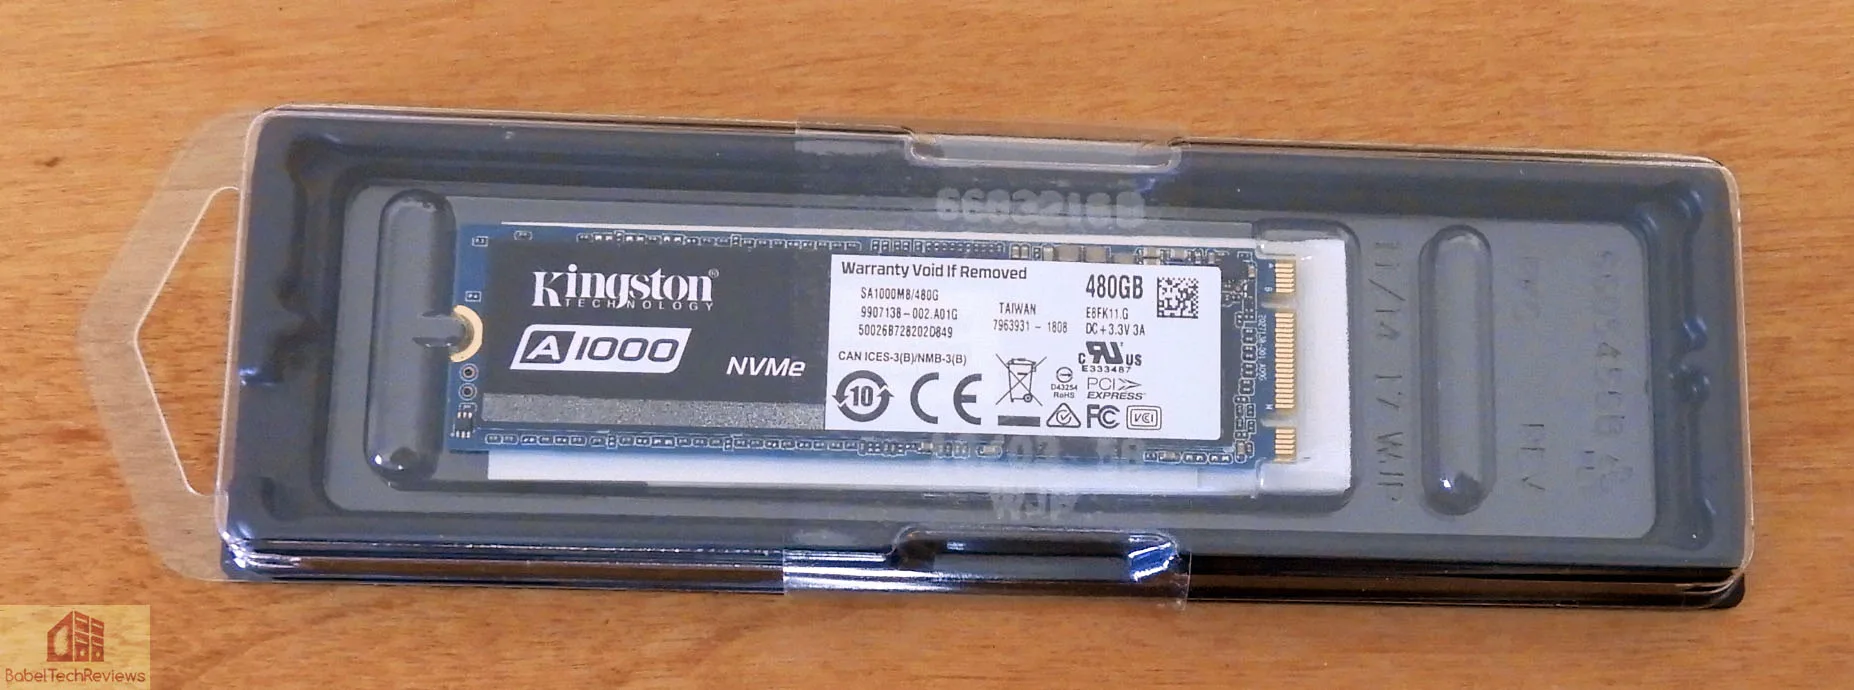

Here is everything included with the pack: the NVMe SSD, a warranty /installation instructions flyer, and a coupon to digitally download Acronis cloning software. Perhaps they ought to include a NVMe-powered-by-Kingston badge also.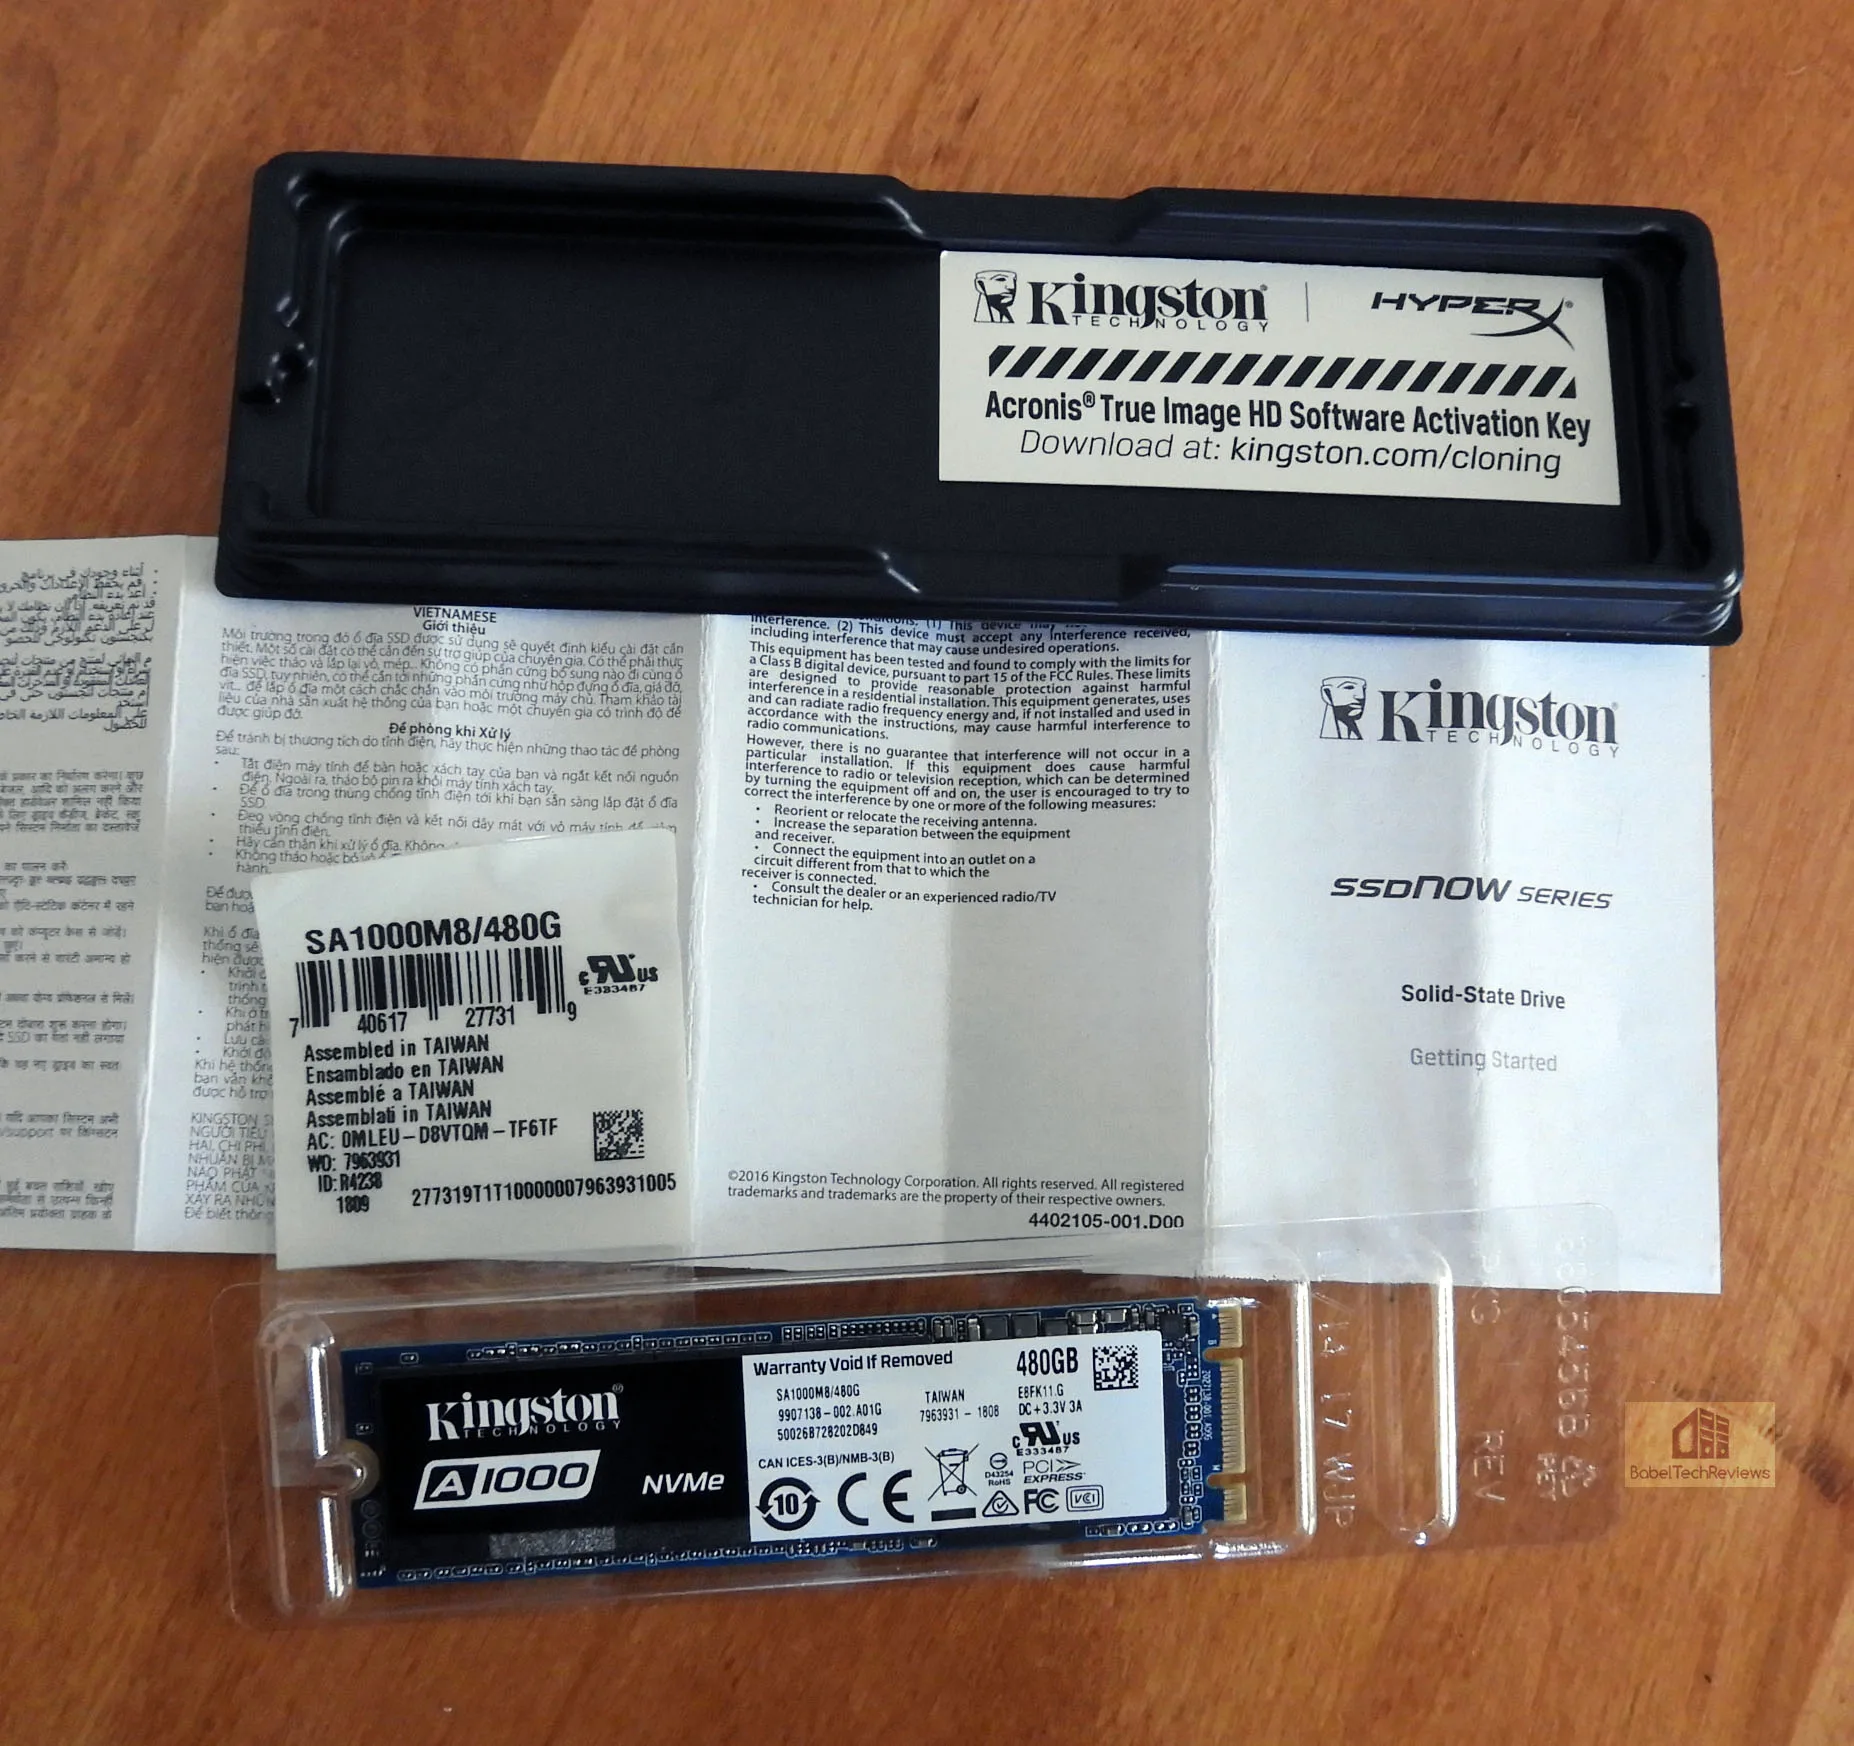
The A1000 is tiny as are all M2 NVMe drives.
Here is the other side.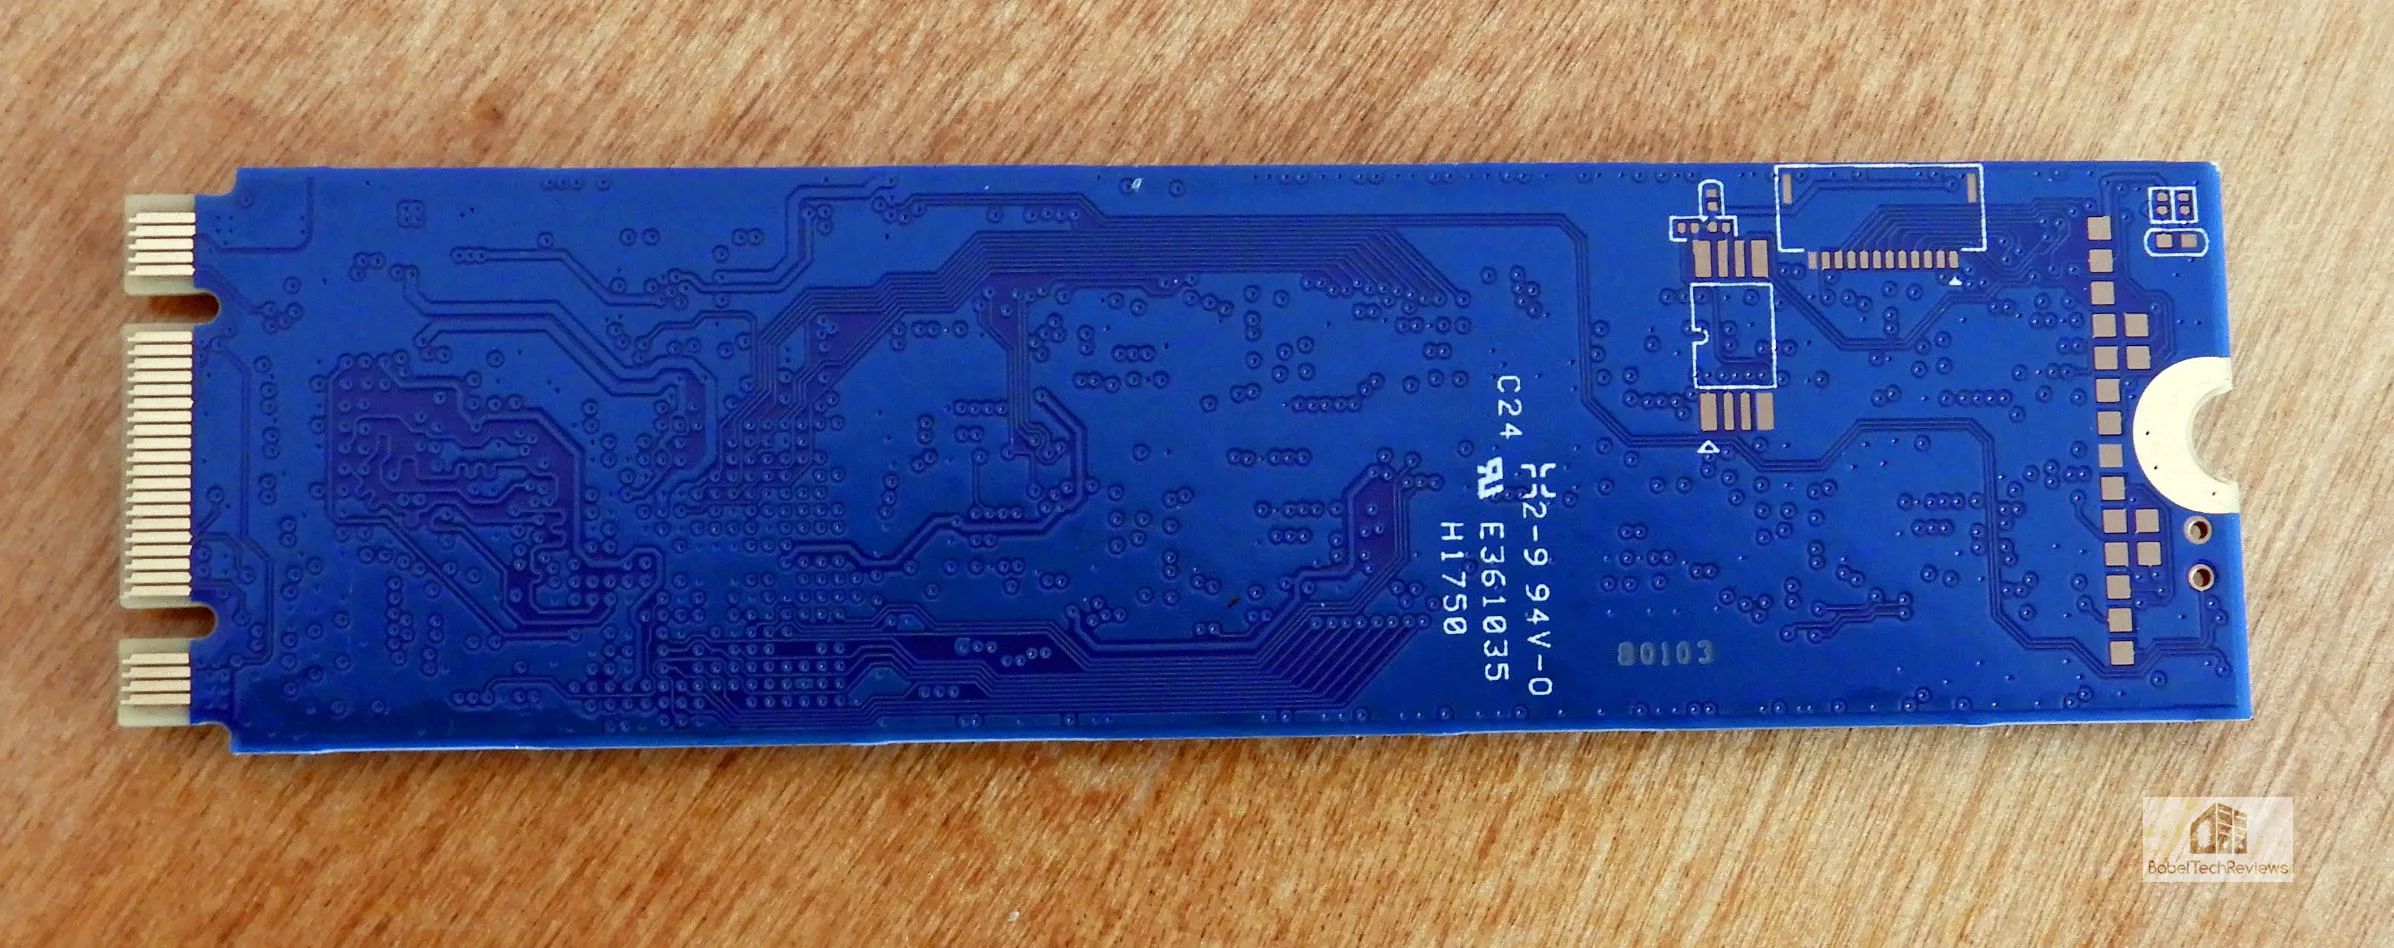
Here is a regular SATA III SSD to compare with the diminutive size of the A1000.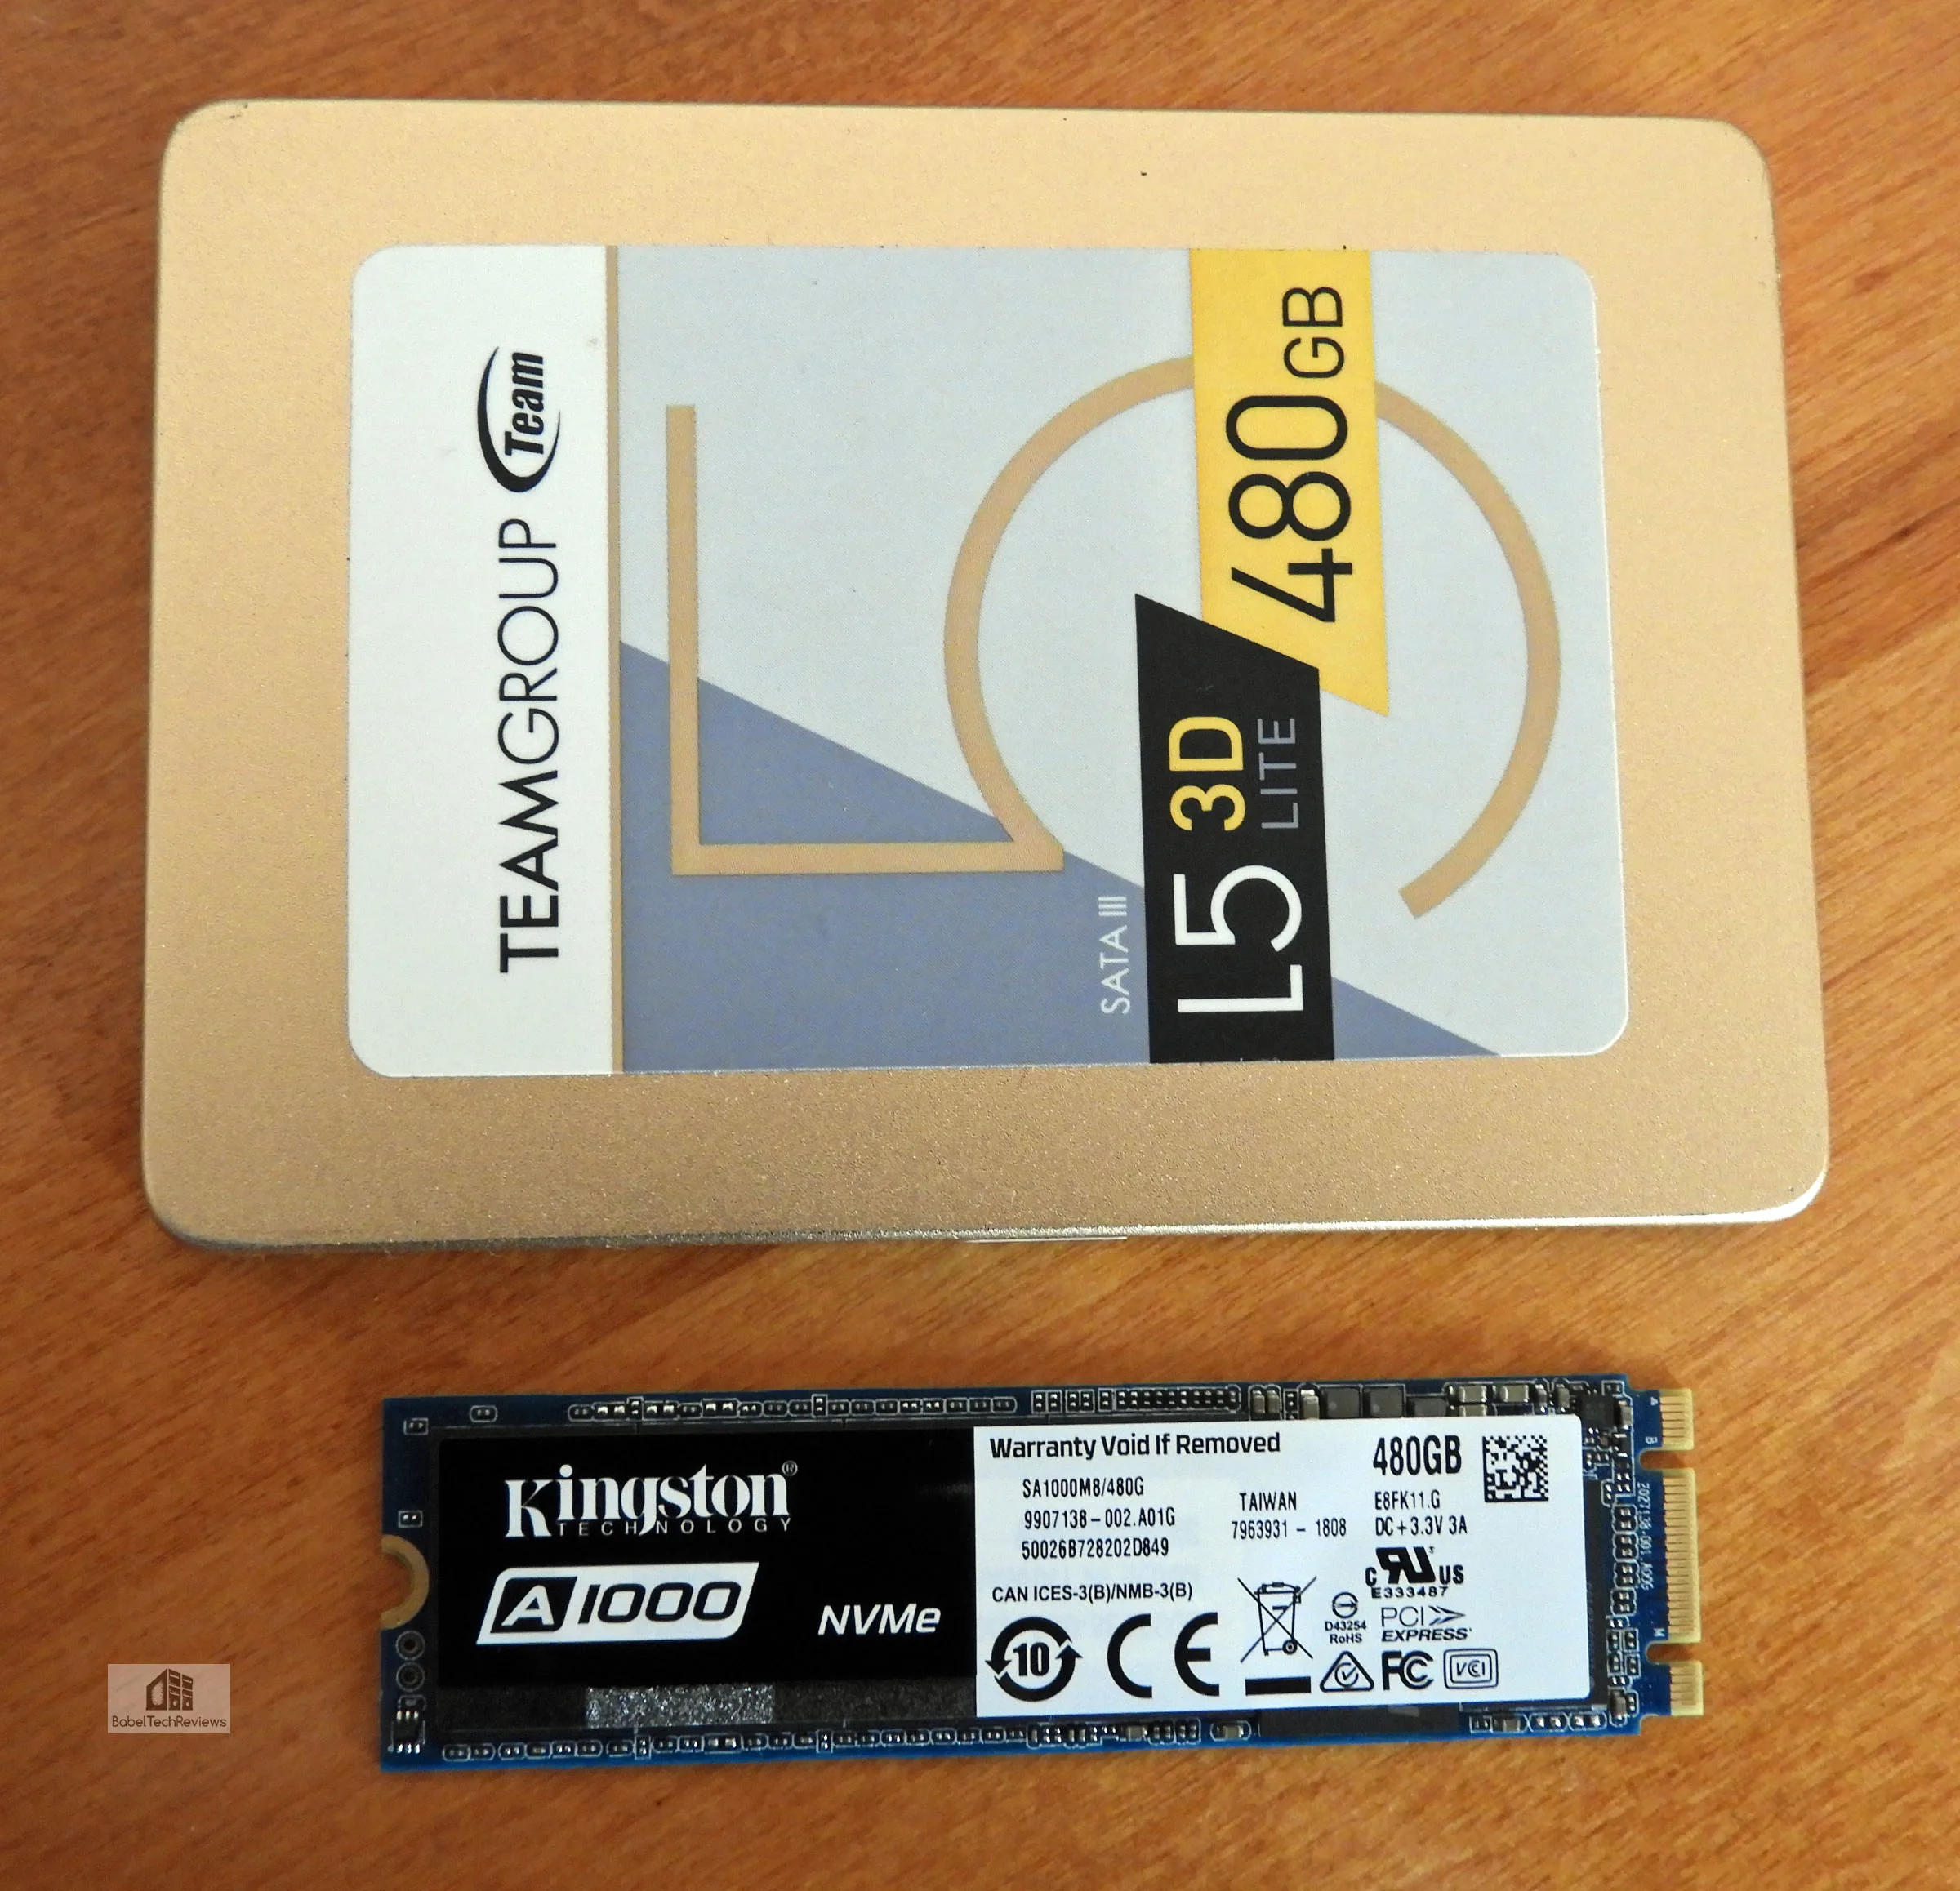 It installs easily – just slip it in and lock it down with one screw. But use a magnetic screwdriver! The screw is also tiny.
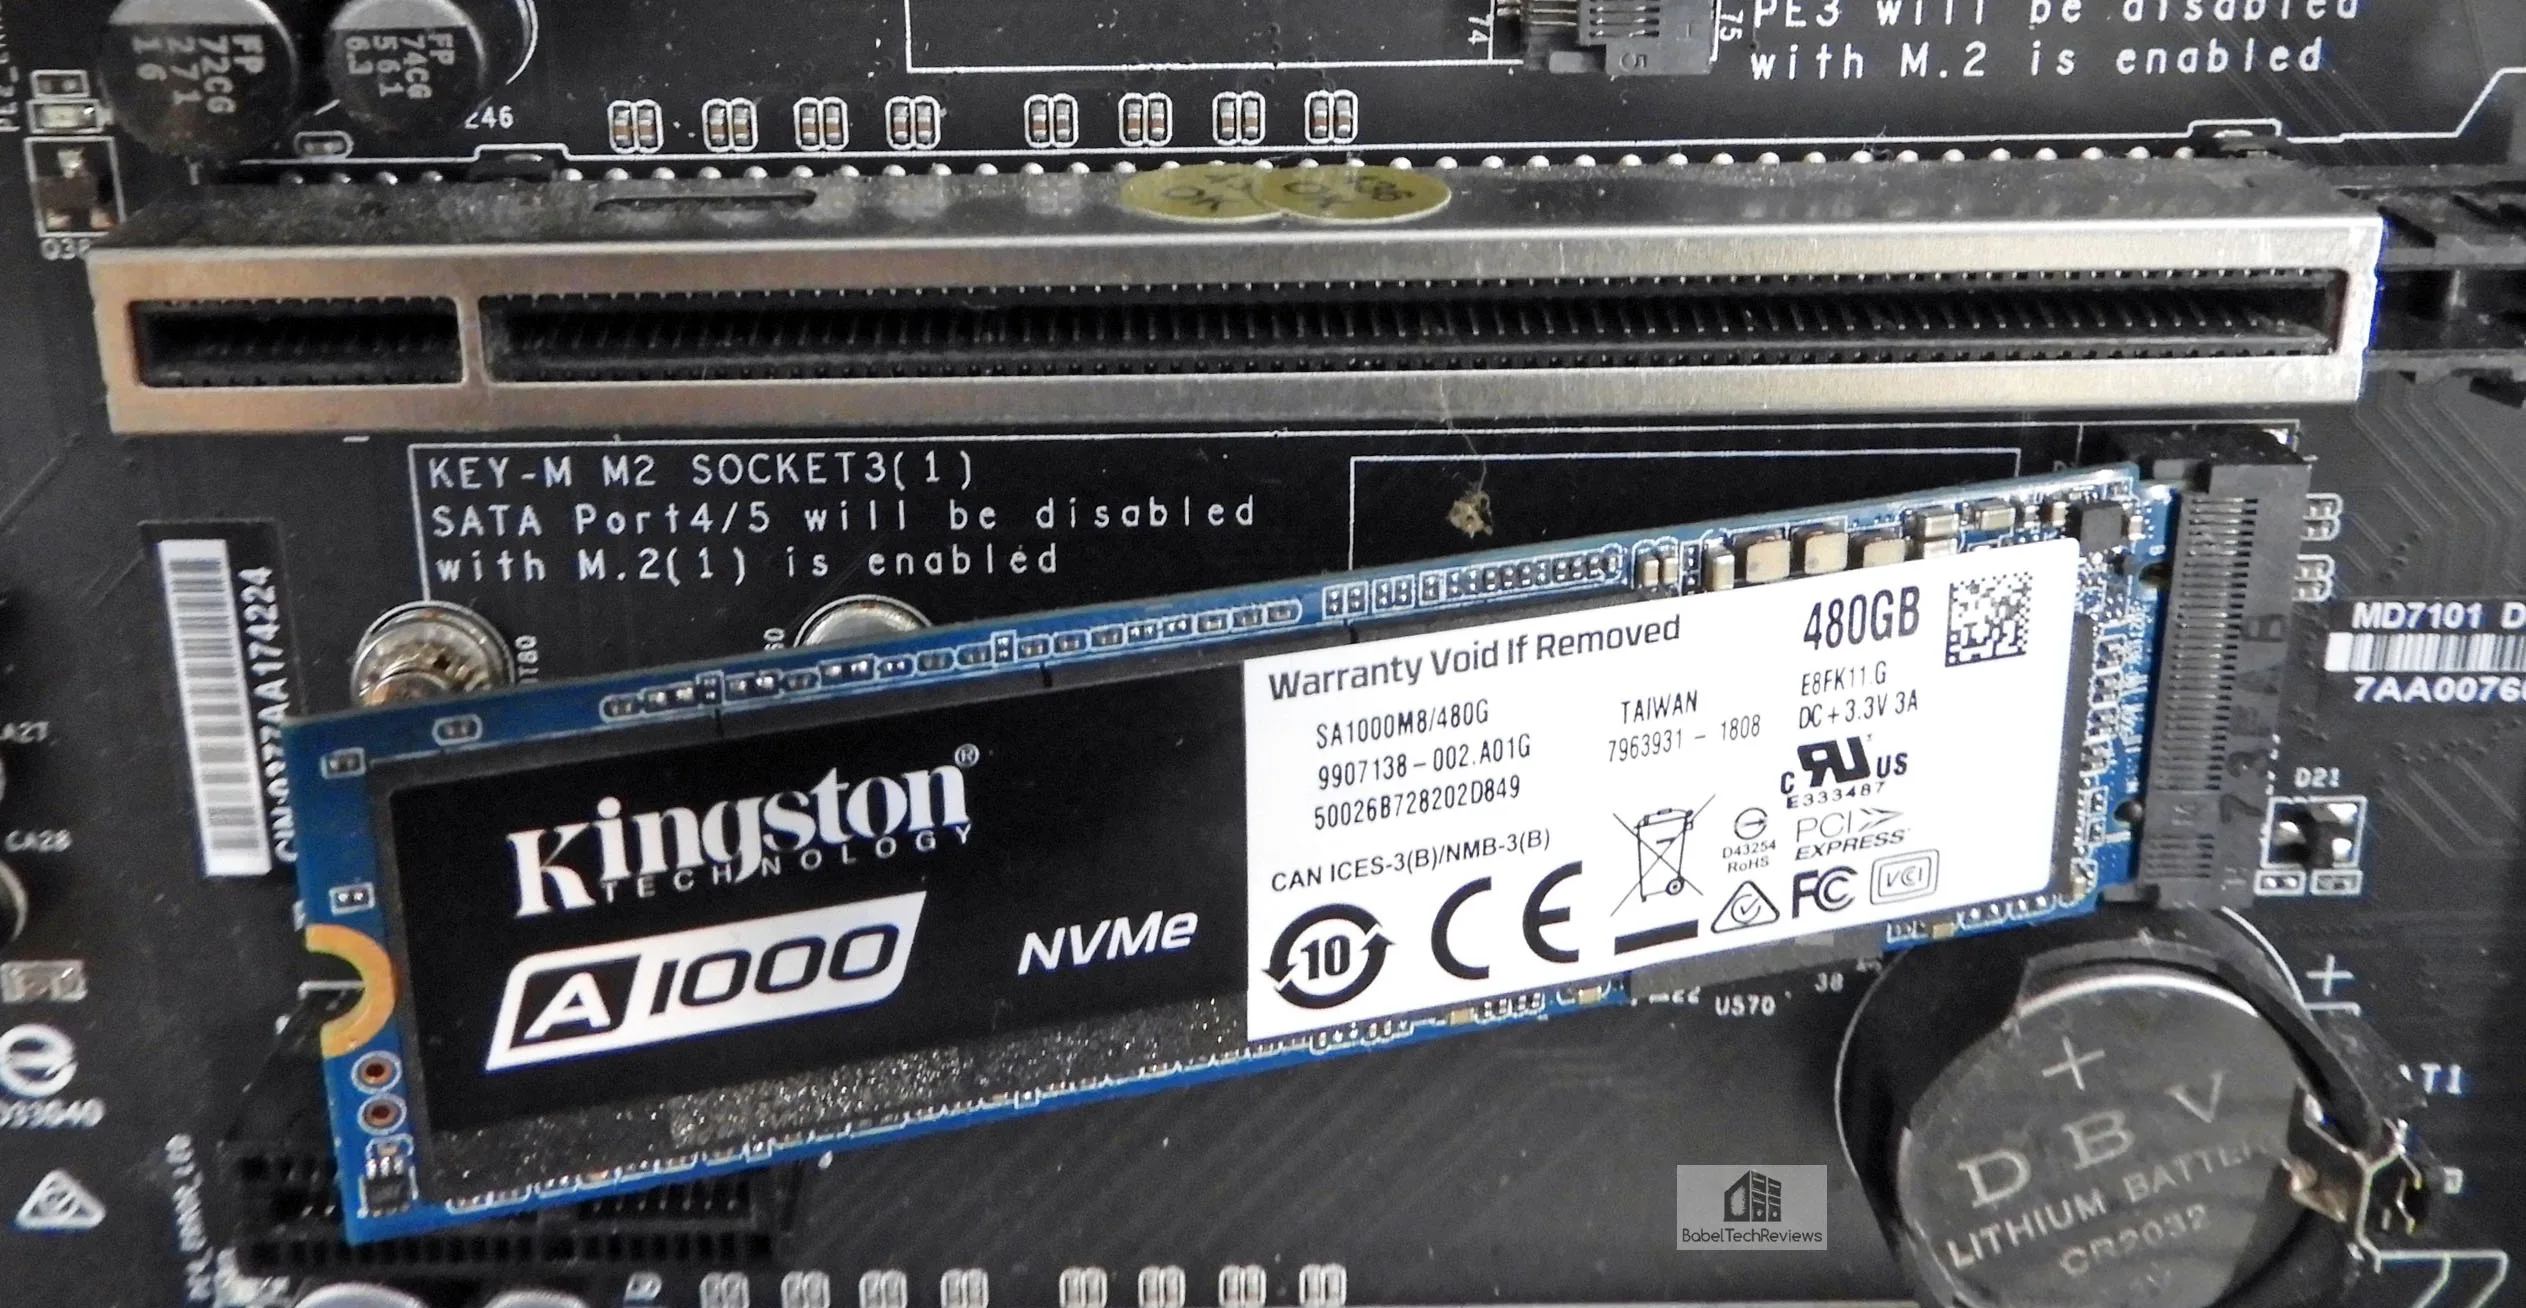
After installing, the user may have to go into his motherboard’s BIOS “Onboard Device Configuration” to enable it as we did with the EVGA Z370 FTW motherboard. With the FTW’s layout, enabling a NVMe SSD disables it’s corresponding SATA channel, so you may have to physically move SATA cables to get your other SSDs to be recognized, depending on your motherboard.
Lets look at our test configuration next.
Test Configuration – Hardware
- Intel Core i7-8700K (HyperThreading and Turbo boost is locked on to 4.7 GHz for all six cores. Coffee Lake DX11 CPU graphics.
- EVGA Z370 FTW motherboard (Intel Z370 chipset, latest BIOS, PCIe 3.0/3.1 specification, CrossFire/SLI 8x+8x), supplied by EVGA
- HyperX 16GB DDR4 (2x8GB, dual channel at 3333MHz), supplied by HyperX
- GTX 1070 Ti Founders Edition 8GB, stock clocks, supplied by NVIDIA
- Kingston A1000 480 GB NVMe PCIe SSD, supplied by Kingston
- Team Group L5 LITE 3D 2.5″ 480 GB SSD
- 240 GB HyperX SSD (Brown), supplied by Kingston
- 240 GB HyperX SSD (Blue), supplied by Kingston
- 1.92 TB SanDisk CloudSpeed ECO Gen II SSD (SXPLFA)
- 2 TB Micron 1100 SSD
- 2 TB Seagate 7200 rpm SSHD (Solid State Hard Drive)
- EVGA 1000G 1000W power supply unit
- EVGA CLC 280mm CPU water cooler, supplied by EVGA
- Onboard Realtek Audio
- Genius SP-D150 speakers, supplied by Genius
- EVGA DD-77, mid-tower case supplied by EVGA
- Monoprice Crystal Pro 4K
Test Configuration – Software
- Nvidia’s GeForce 390.77 WHQL drivers were used. High Quality, prefer maximum performance, single display.
- VSync is off in the control panel.
- AA enabled as noted in games; all in-game settings are specified with 16xAF always applied. All games are DX11 except as noted.
- All results show loading time in seconds.
- Highest quality sound (stereo) used in all games.
- Windows 10 64-bit Home edition.
- Latest DirectX
- All games are patched to their latest versions at time of publication.
- MSI’s Afterburner, latest version.
- IOmeter
- HD Tach
- HD Tune
- AS SSD
- ATTO
- Crystal Disk Mark
PC Game level/loading suite
- Fallout 4
- Grand Theft Auto V
- Call of Duty WW II
- Project CARS 2
- Ashes of the Singularity: Escalation (DX12)
- Deus Ex Mankind Divided (DX12)
- DOOM (Vulkan)
- Kingdom Come: Deliverance
- Final Fantasy XV
- World of Warcraft (PC Mark 8)
- Battlefield 3 (PC Mark 8)
Synthetic Benching Suites
- SiSoft Sandra 2017
- AIDA64
- PC Mark 10
- PC Mark 8
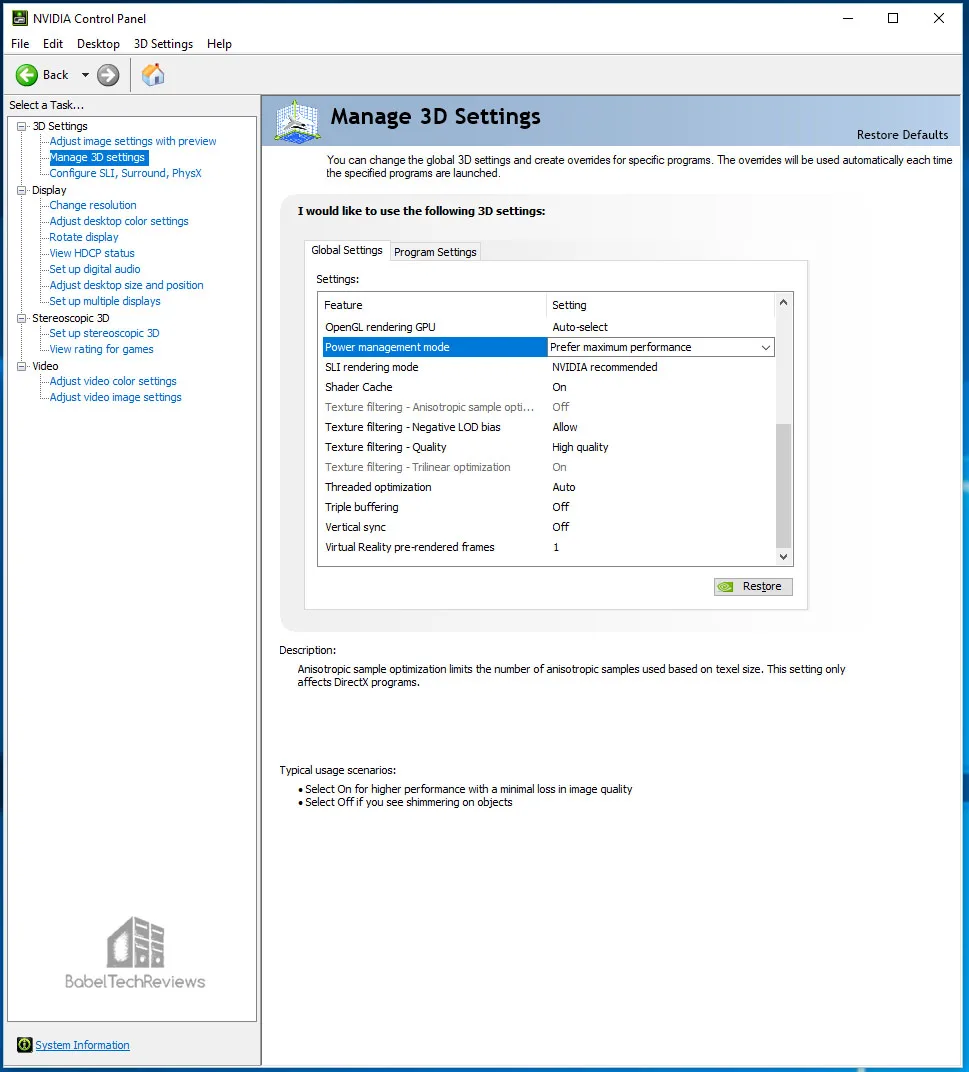
Nvidia Control Panel settings:
We used MSI’s Afterburner to set the power and temp limits to their maximums.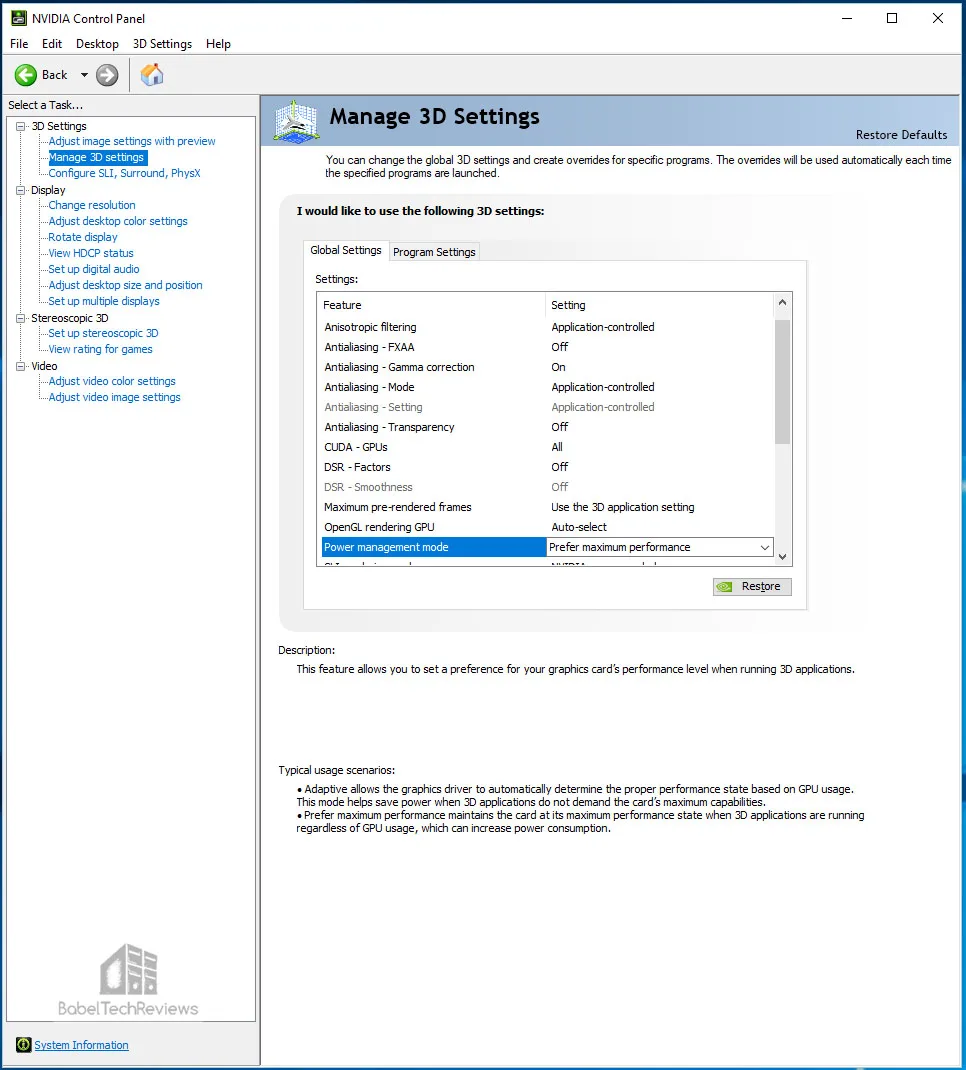
Let’s head to our benching results.
Benchmarking the Kingston A100 480 GB NVMe SSD
Since we used our benching PC with Windows installed on the 480 GB SSD and both 240 GB SSDs, but not installed on the 2TB SSHD or the 1.92 TB SSD, it is not possible to give exact comparisons. In additions, benchmarking SSDs is not an exact science as there is some variability between runs and different benchmarks may show different results depend on how they run their tests and how up-to-date the benchmark is. However, using enough real world and synthetic tests, it may be possible to get a good idea of relative performance across all 7 drives.
First, we will will look at synthetic benchmarks to highlight the differences between our drives.
PCMark 8 & 10 (Futuremark)
Futuremark is well-respected as a developer and publisher of PC benchmark applications for nearly two decades. Although PCMark are synthetic tests, they provide a good measure of system performance. PCMark 10 is Futuremark’s seventh major update to the PCMark series. PCMark 10 is developed for Windows 10 and it builds upon the PCMark 8 platform for a complete package of vendor-neutral and easy-to-use benchmarks for home or office environments.
In comparison to PC Mark 8, PC Mark 10 is missing key elements including detailed storage testing, and it is not possible to test attached drives as with the earlier suite. We hope that Futuremark updates 10 as they promised. We benchmark using the Extended settings.
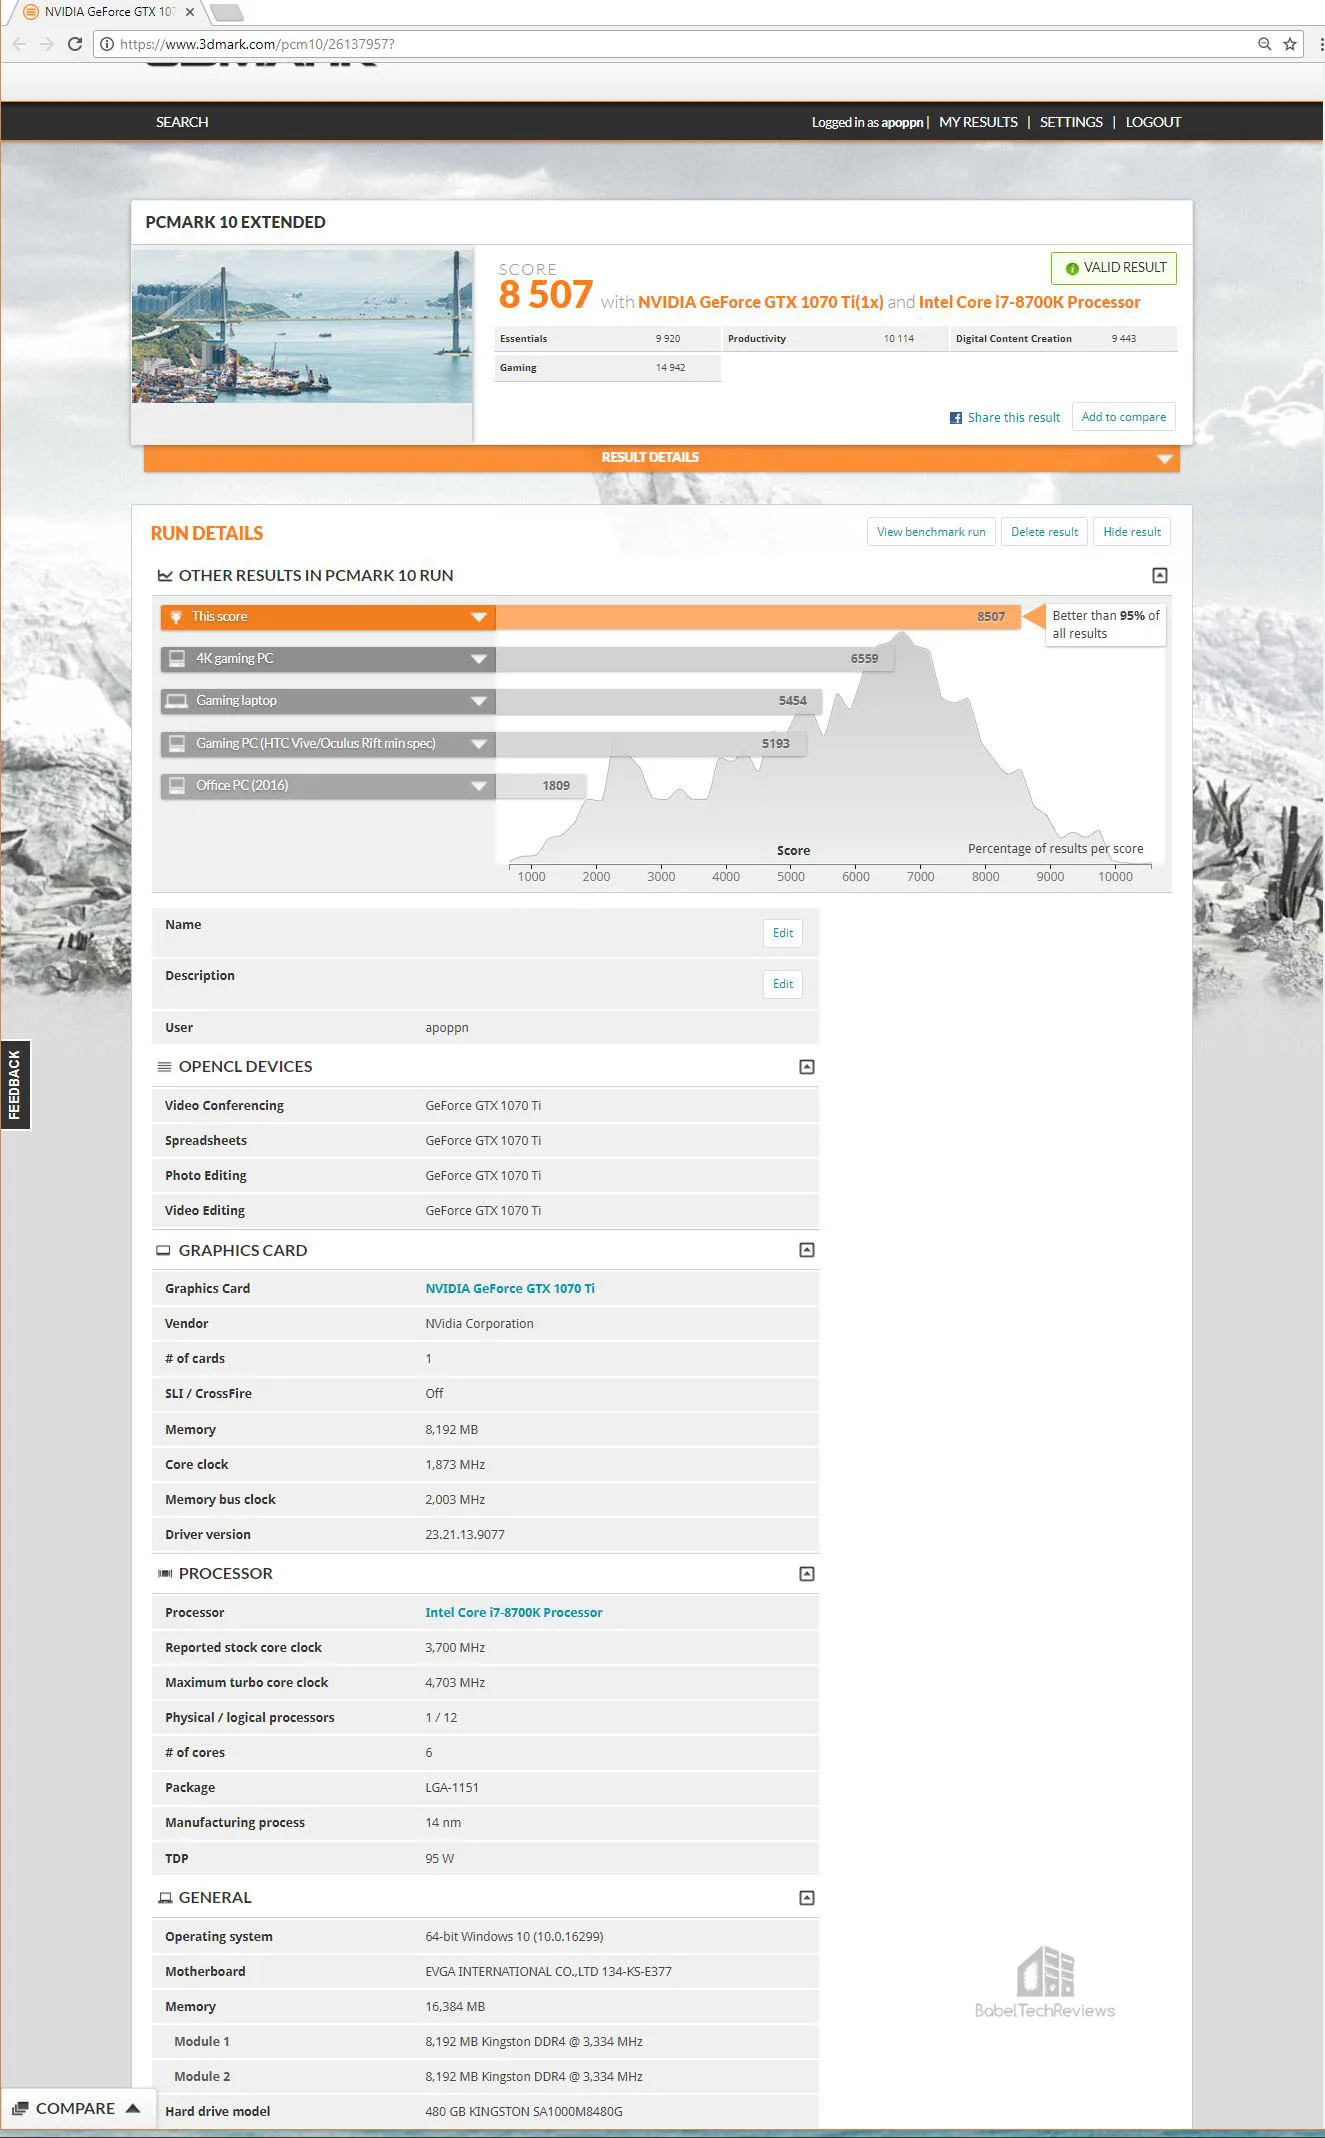
The Kingston A1000 480 GB SSD scores 8507.
Here are the online results:
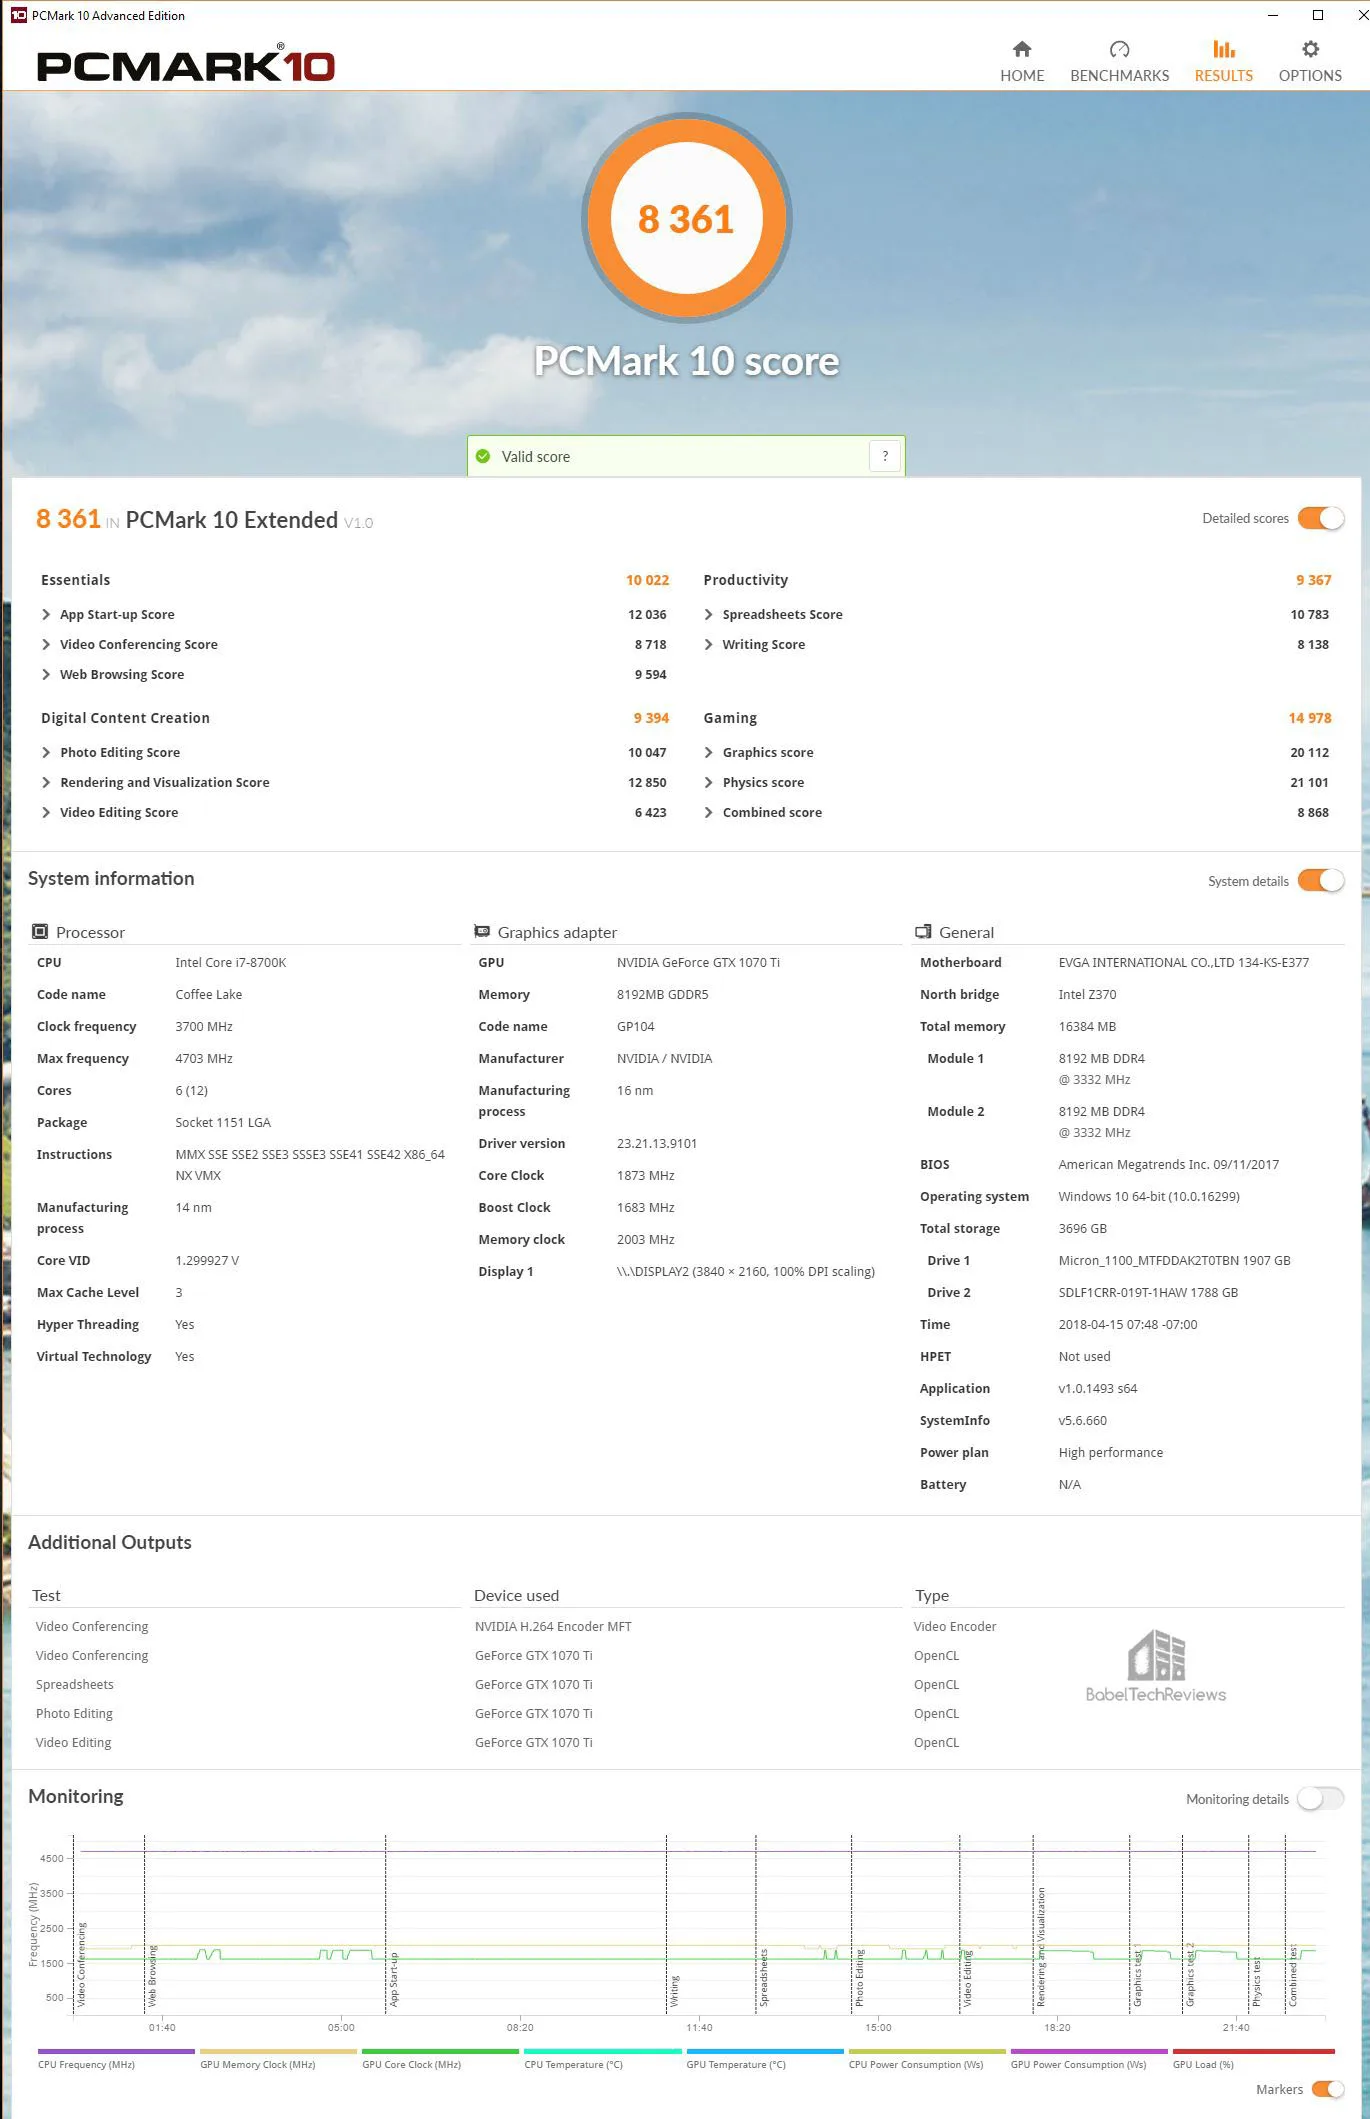
The Micron 1150 2 TB GB SSD scores 8361.
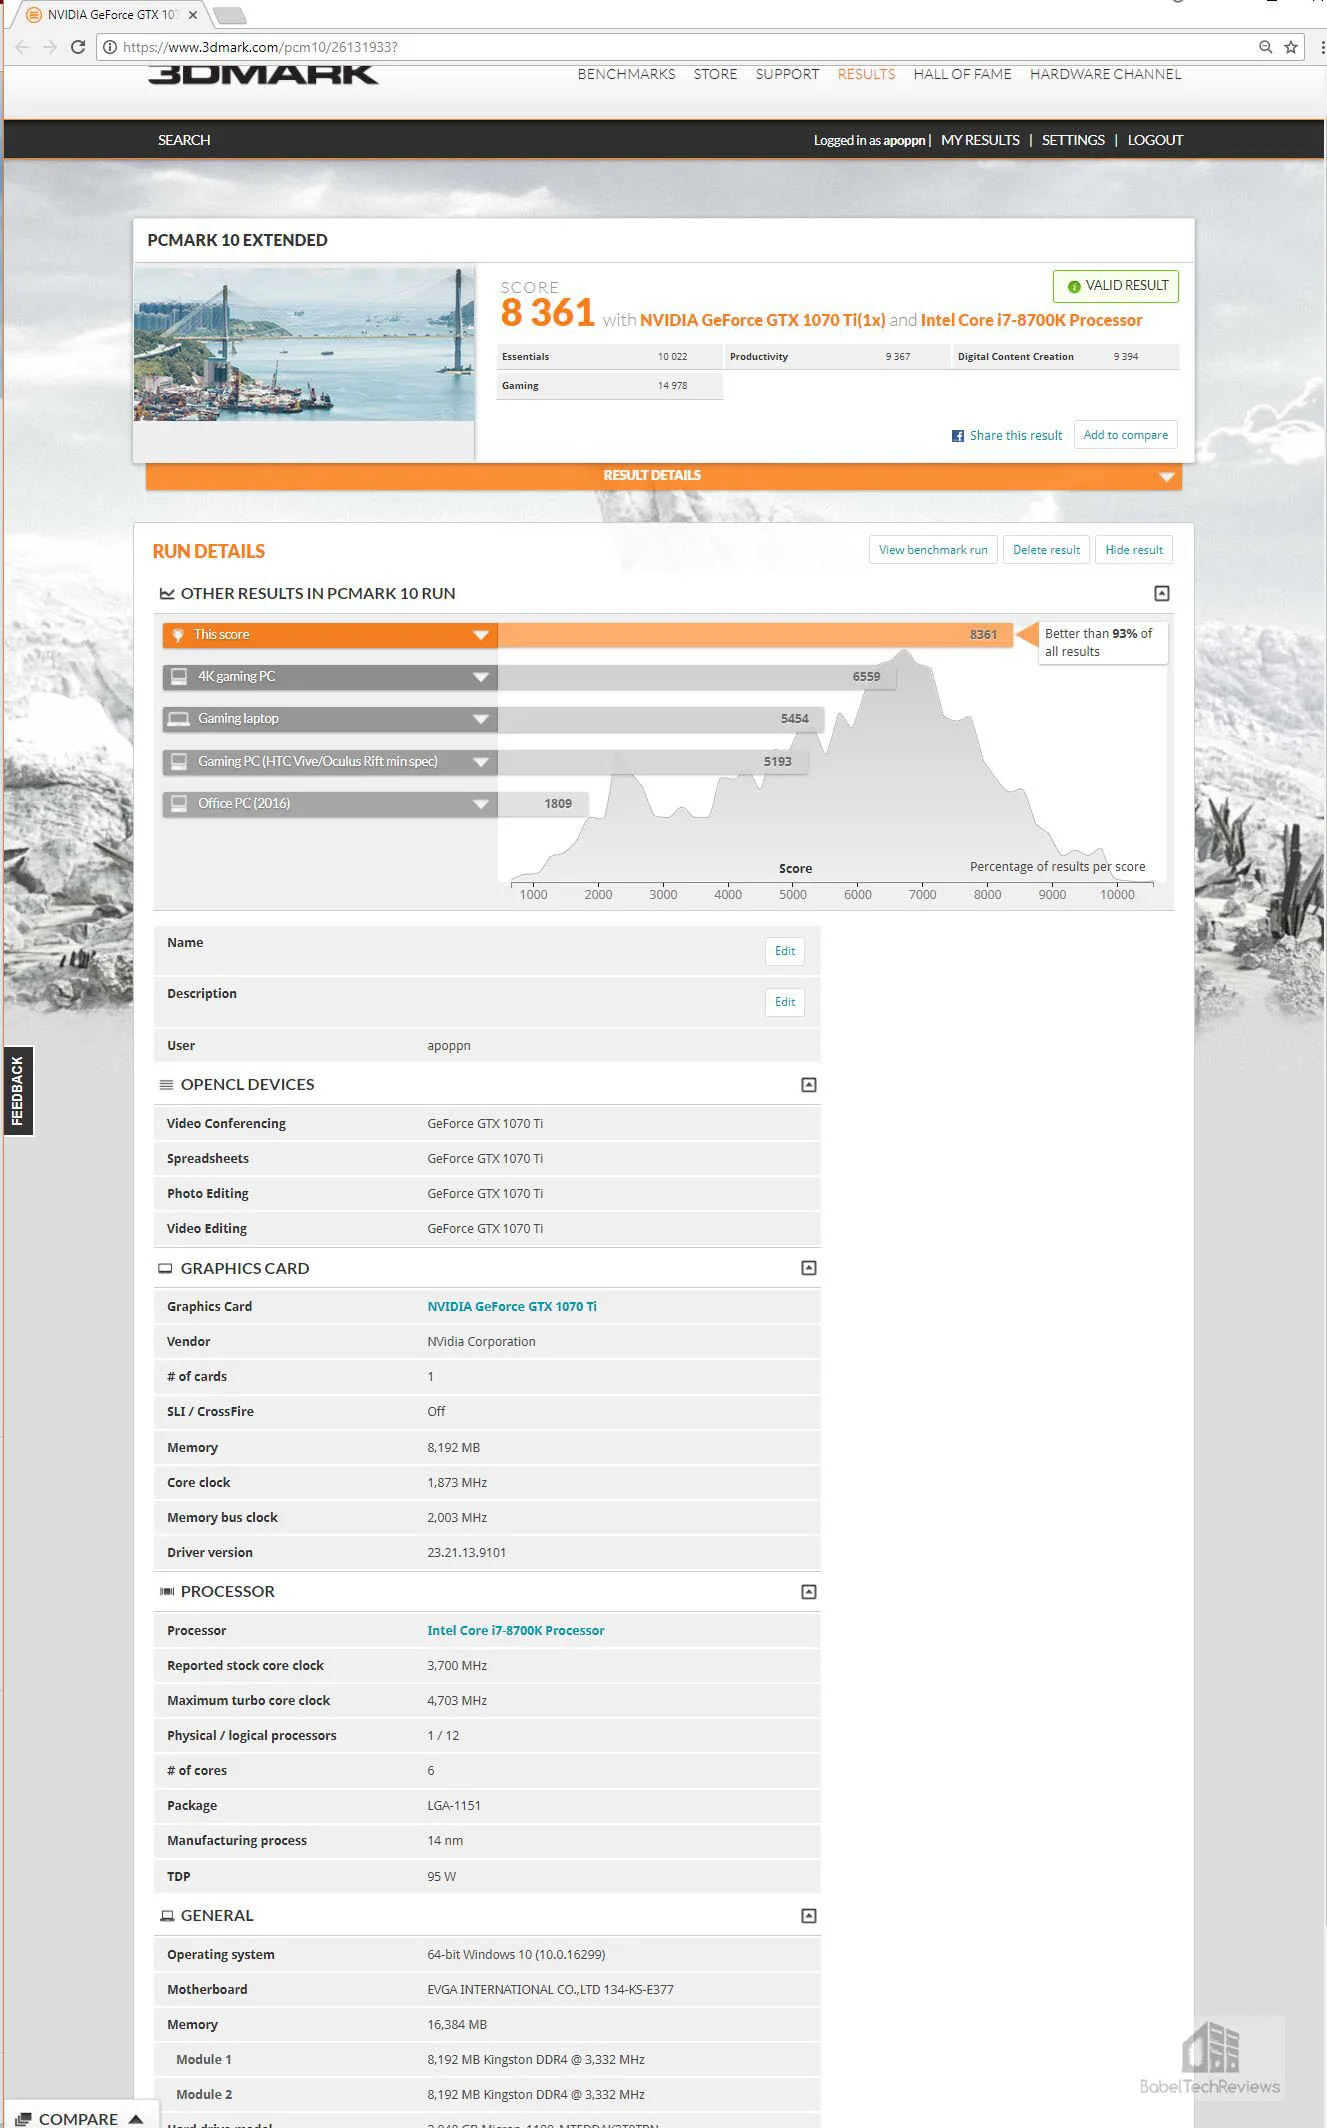
Here are the online results:
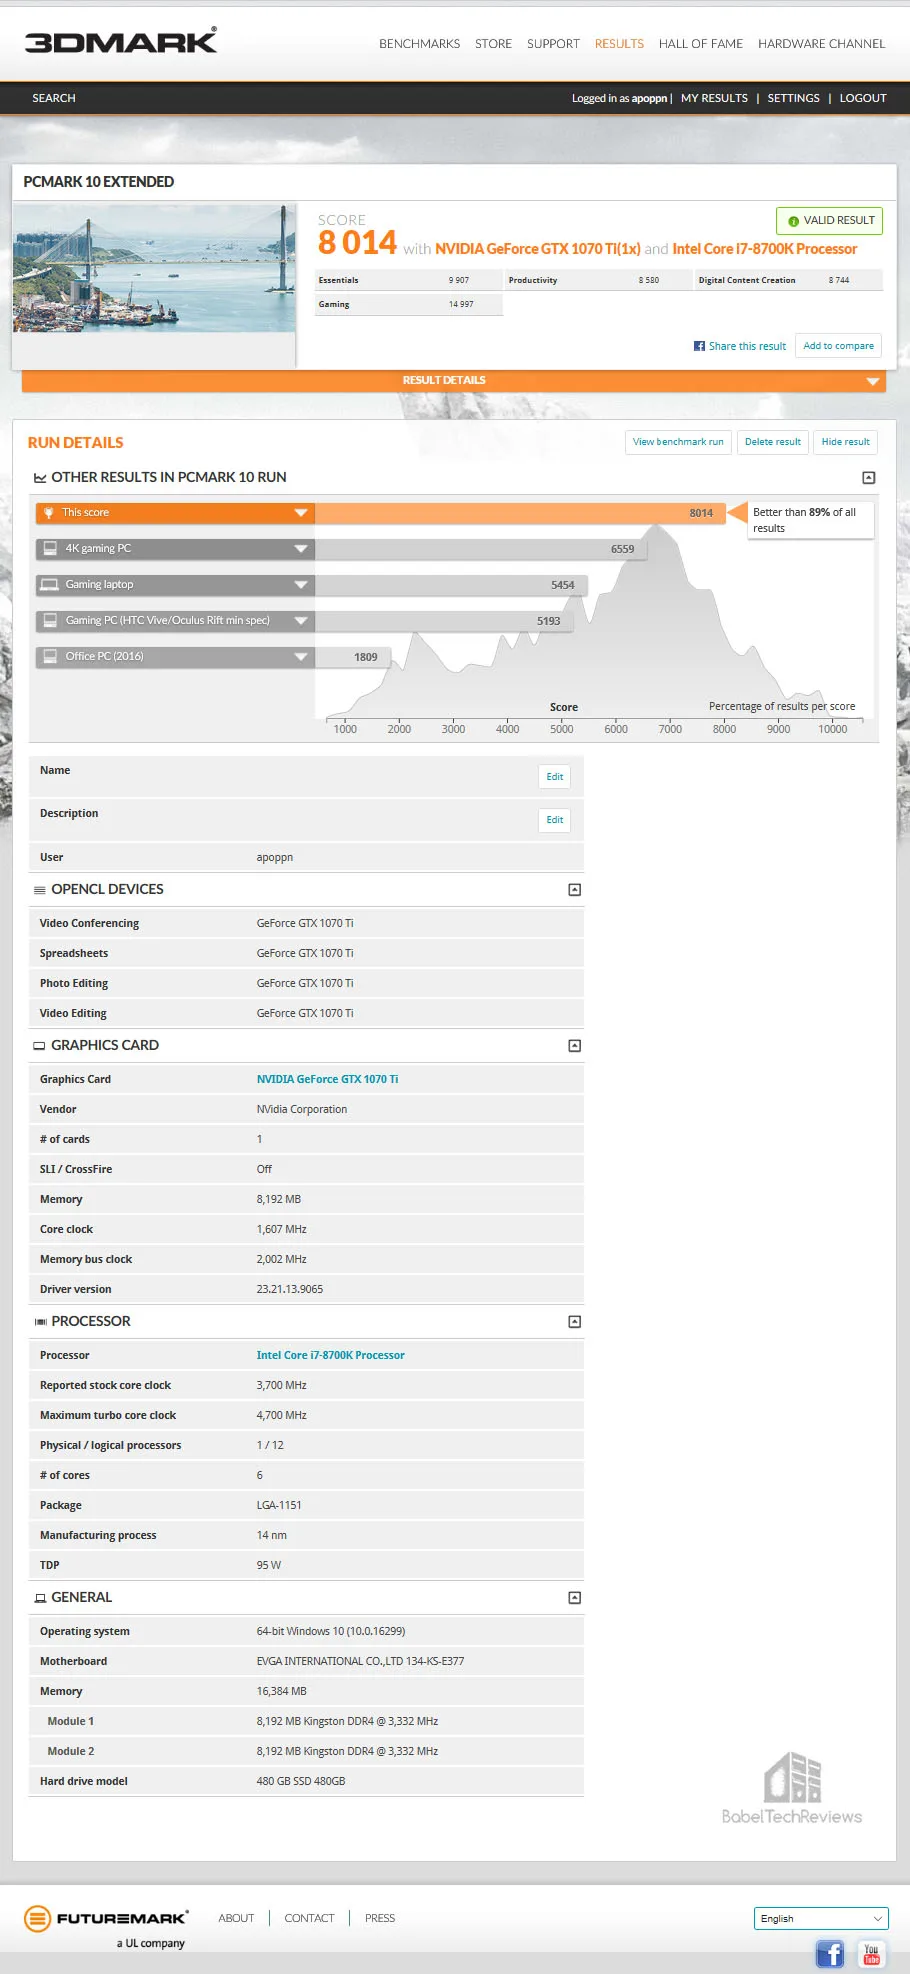
The Team Group 480 GB SSD scores 8014.
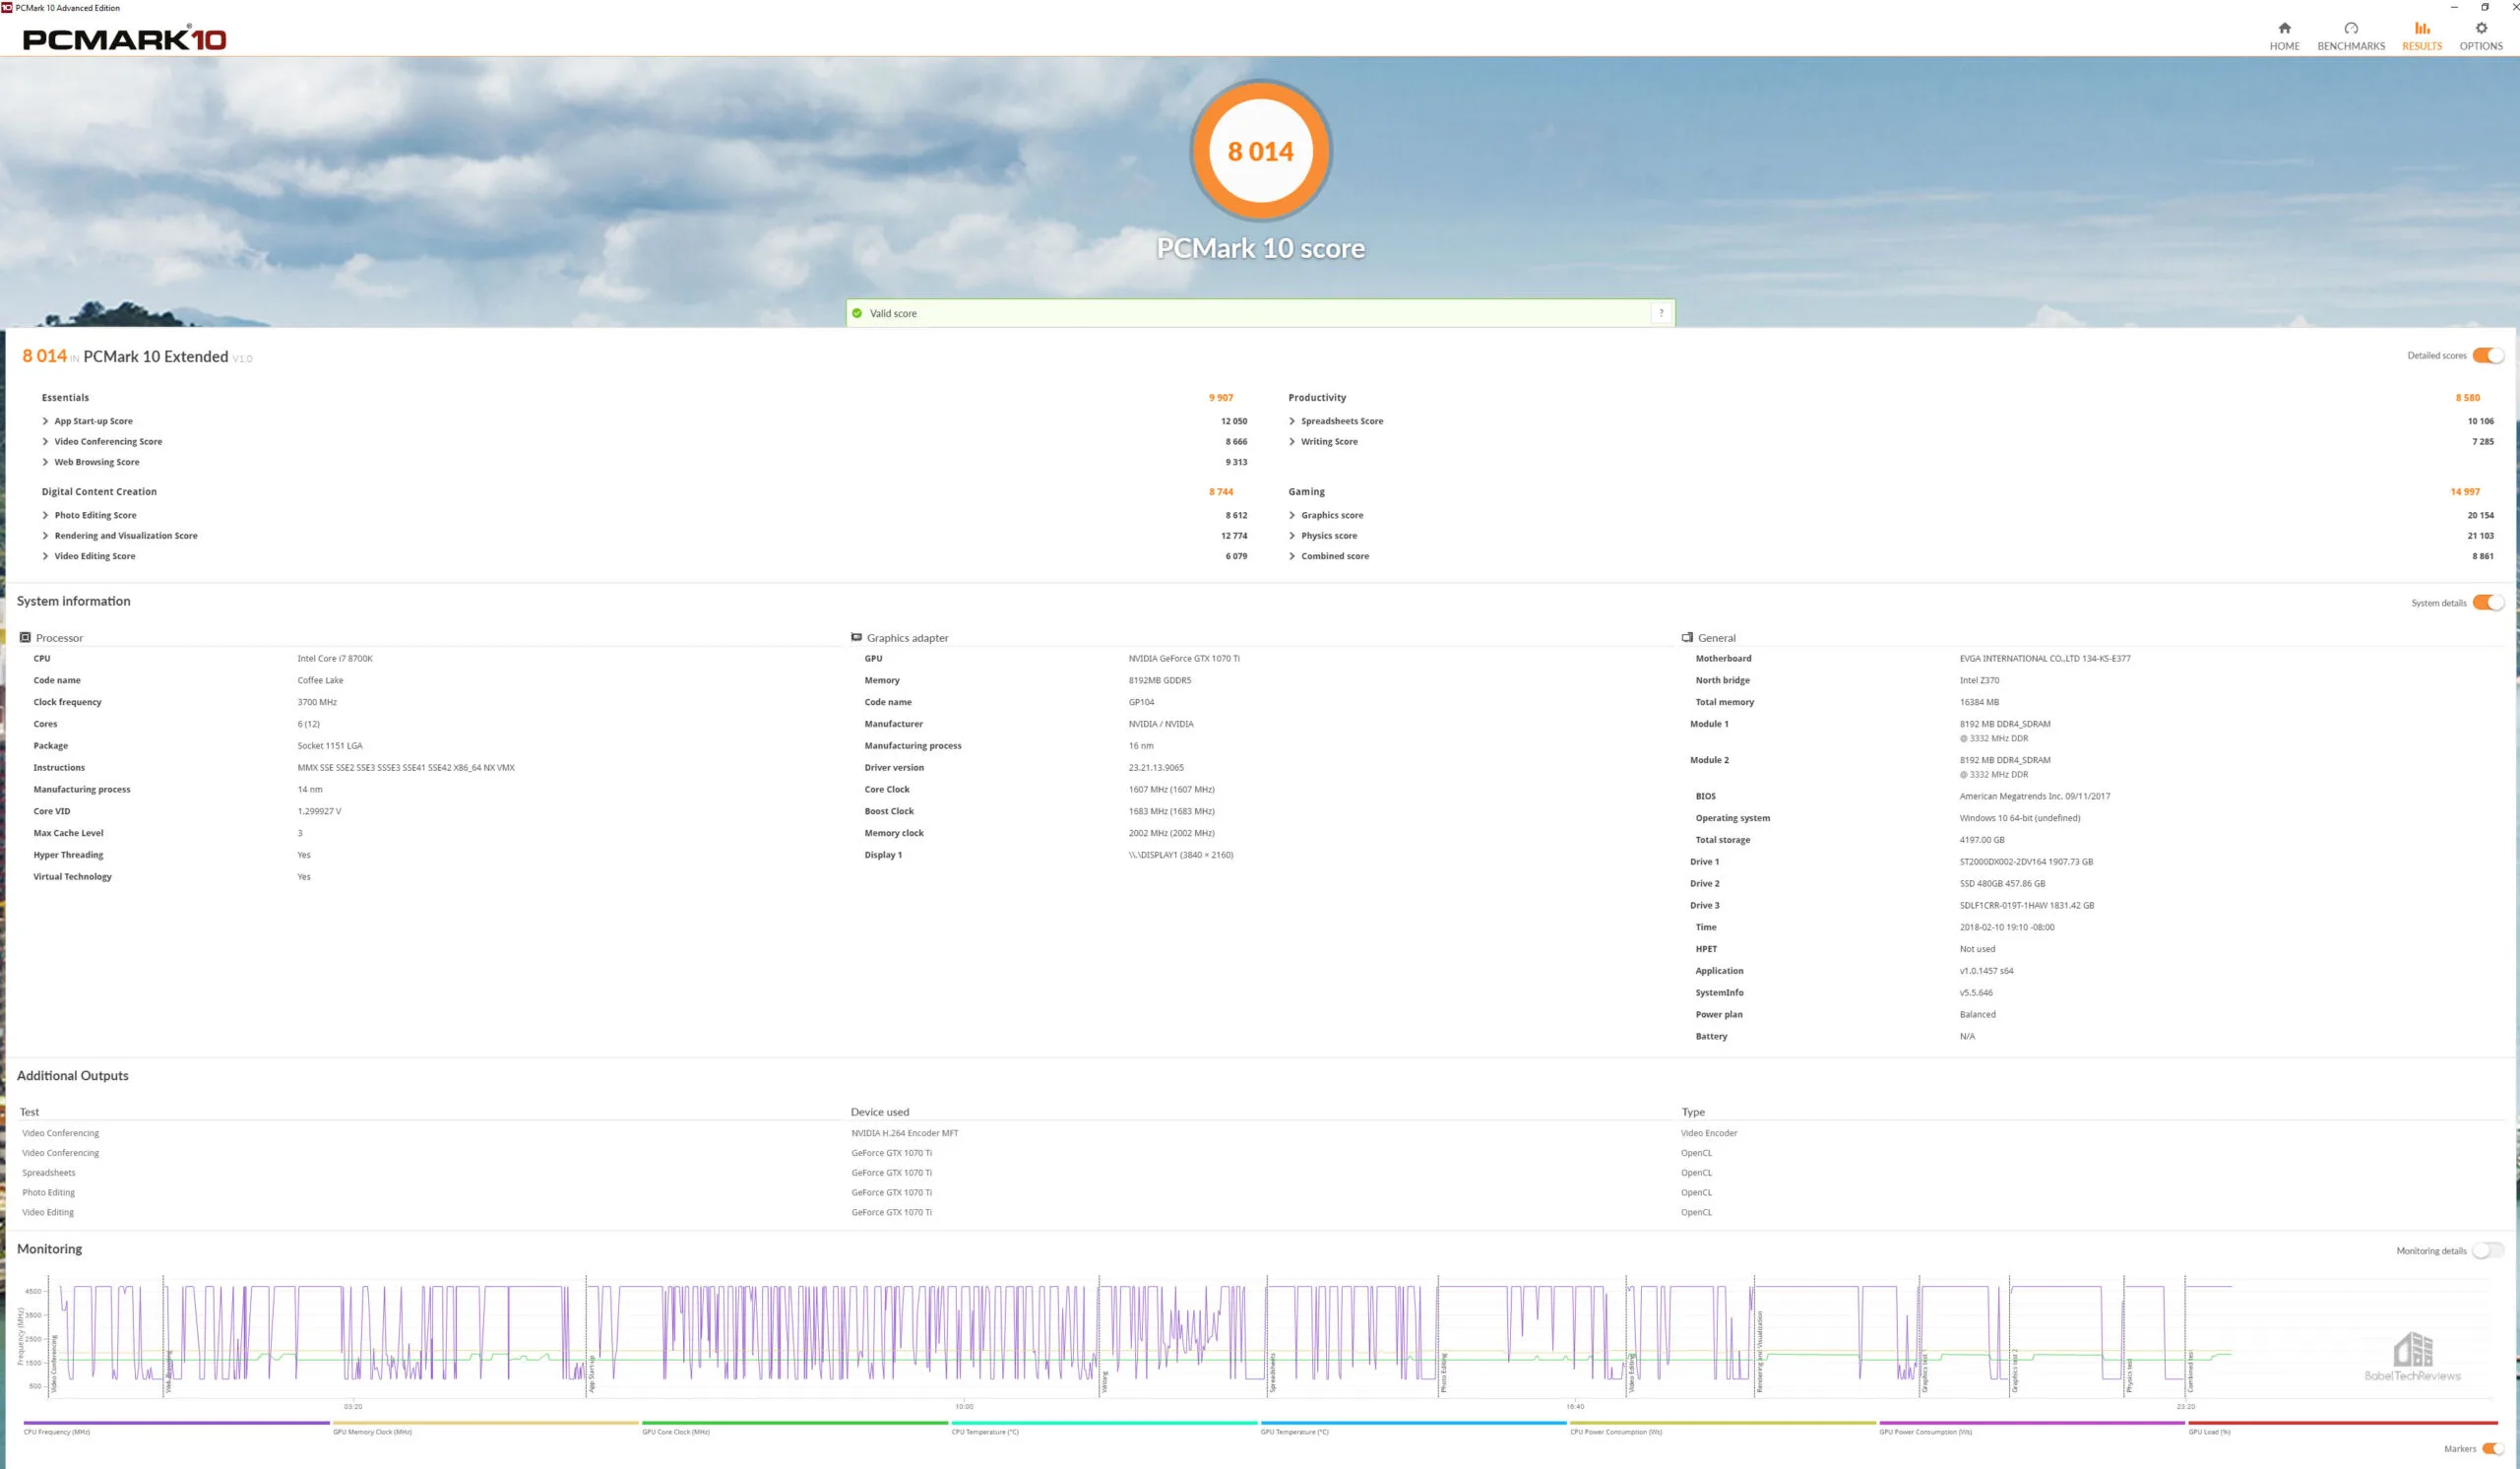 Here is the same test validated online.
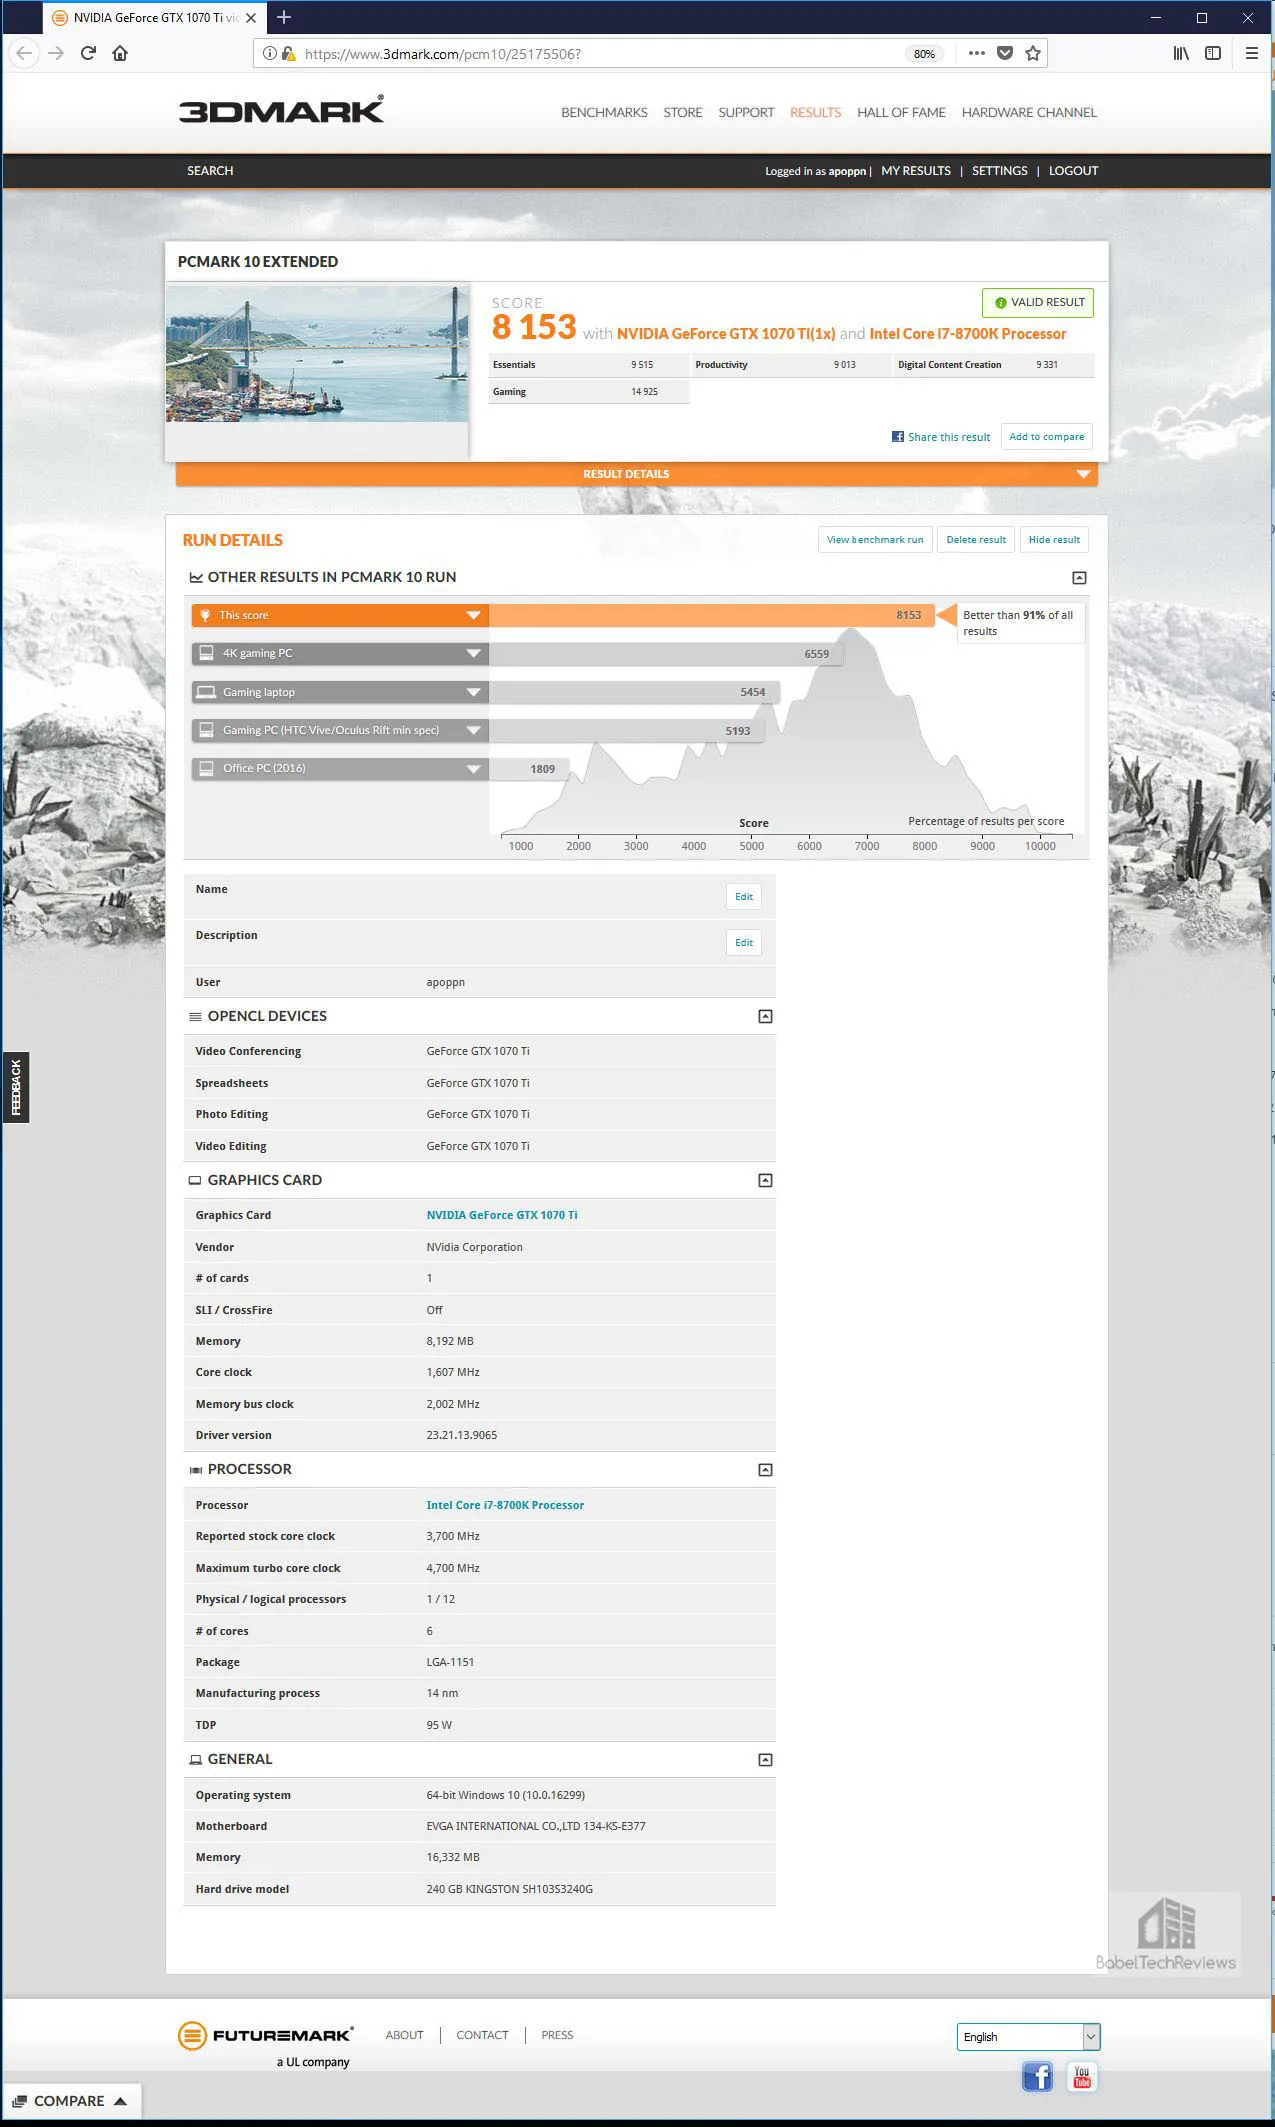
The 240 GB HyperX SSD (Brown) scores 8153 and here is the online validation.
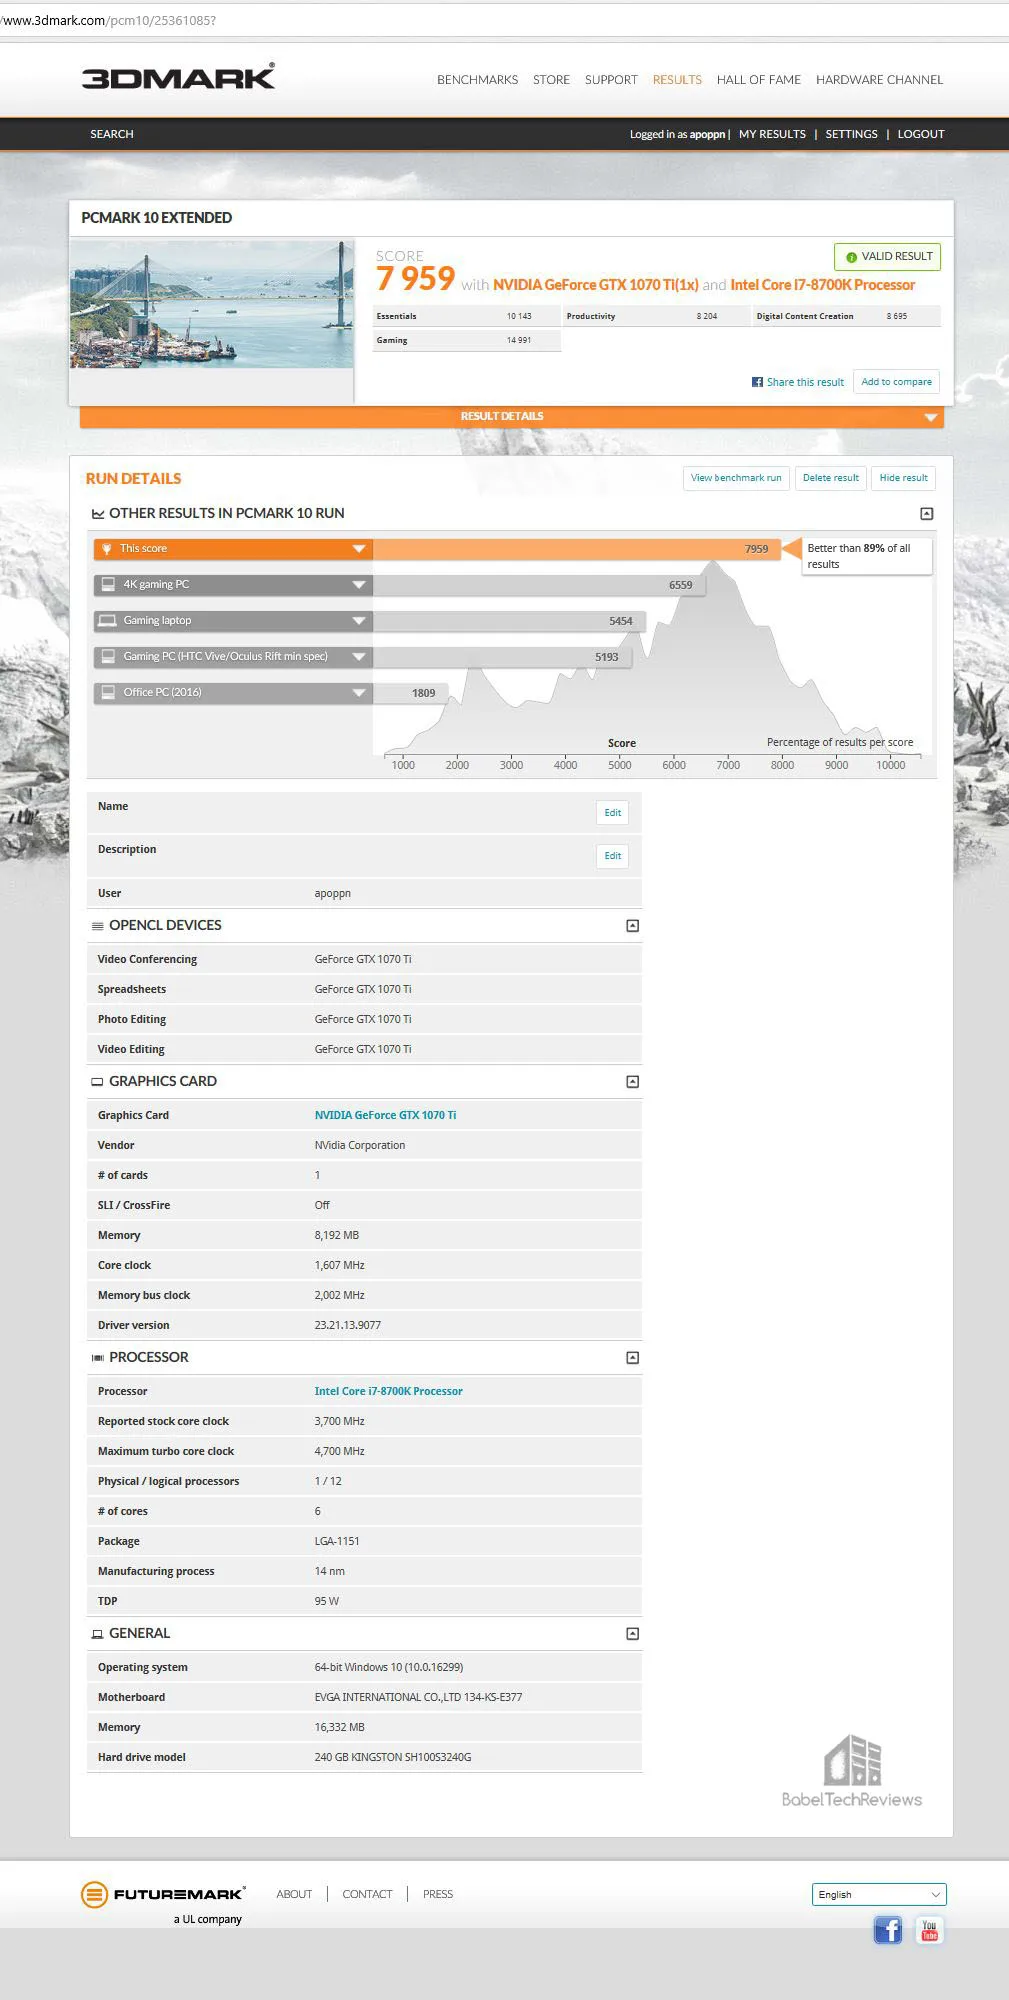
The 240 GB HyperX SSD Blue was Kingston’s flagship HyperX SSD a few years ago by virtue of its faster memory, but it actually scores less than its inexpensive cousin at 7959.
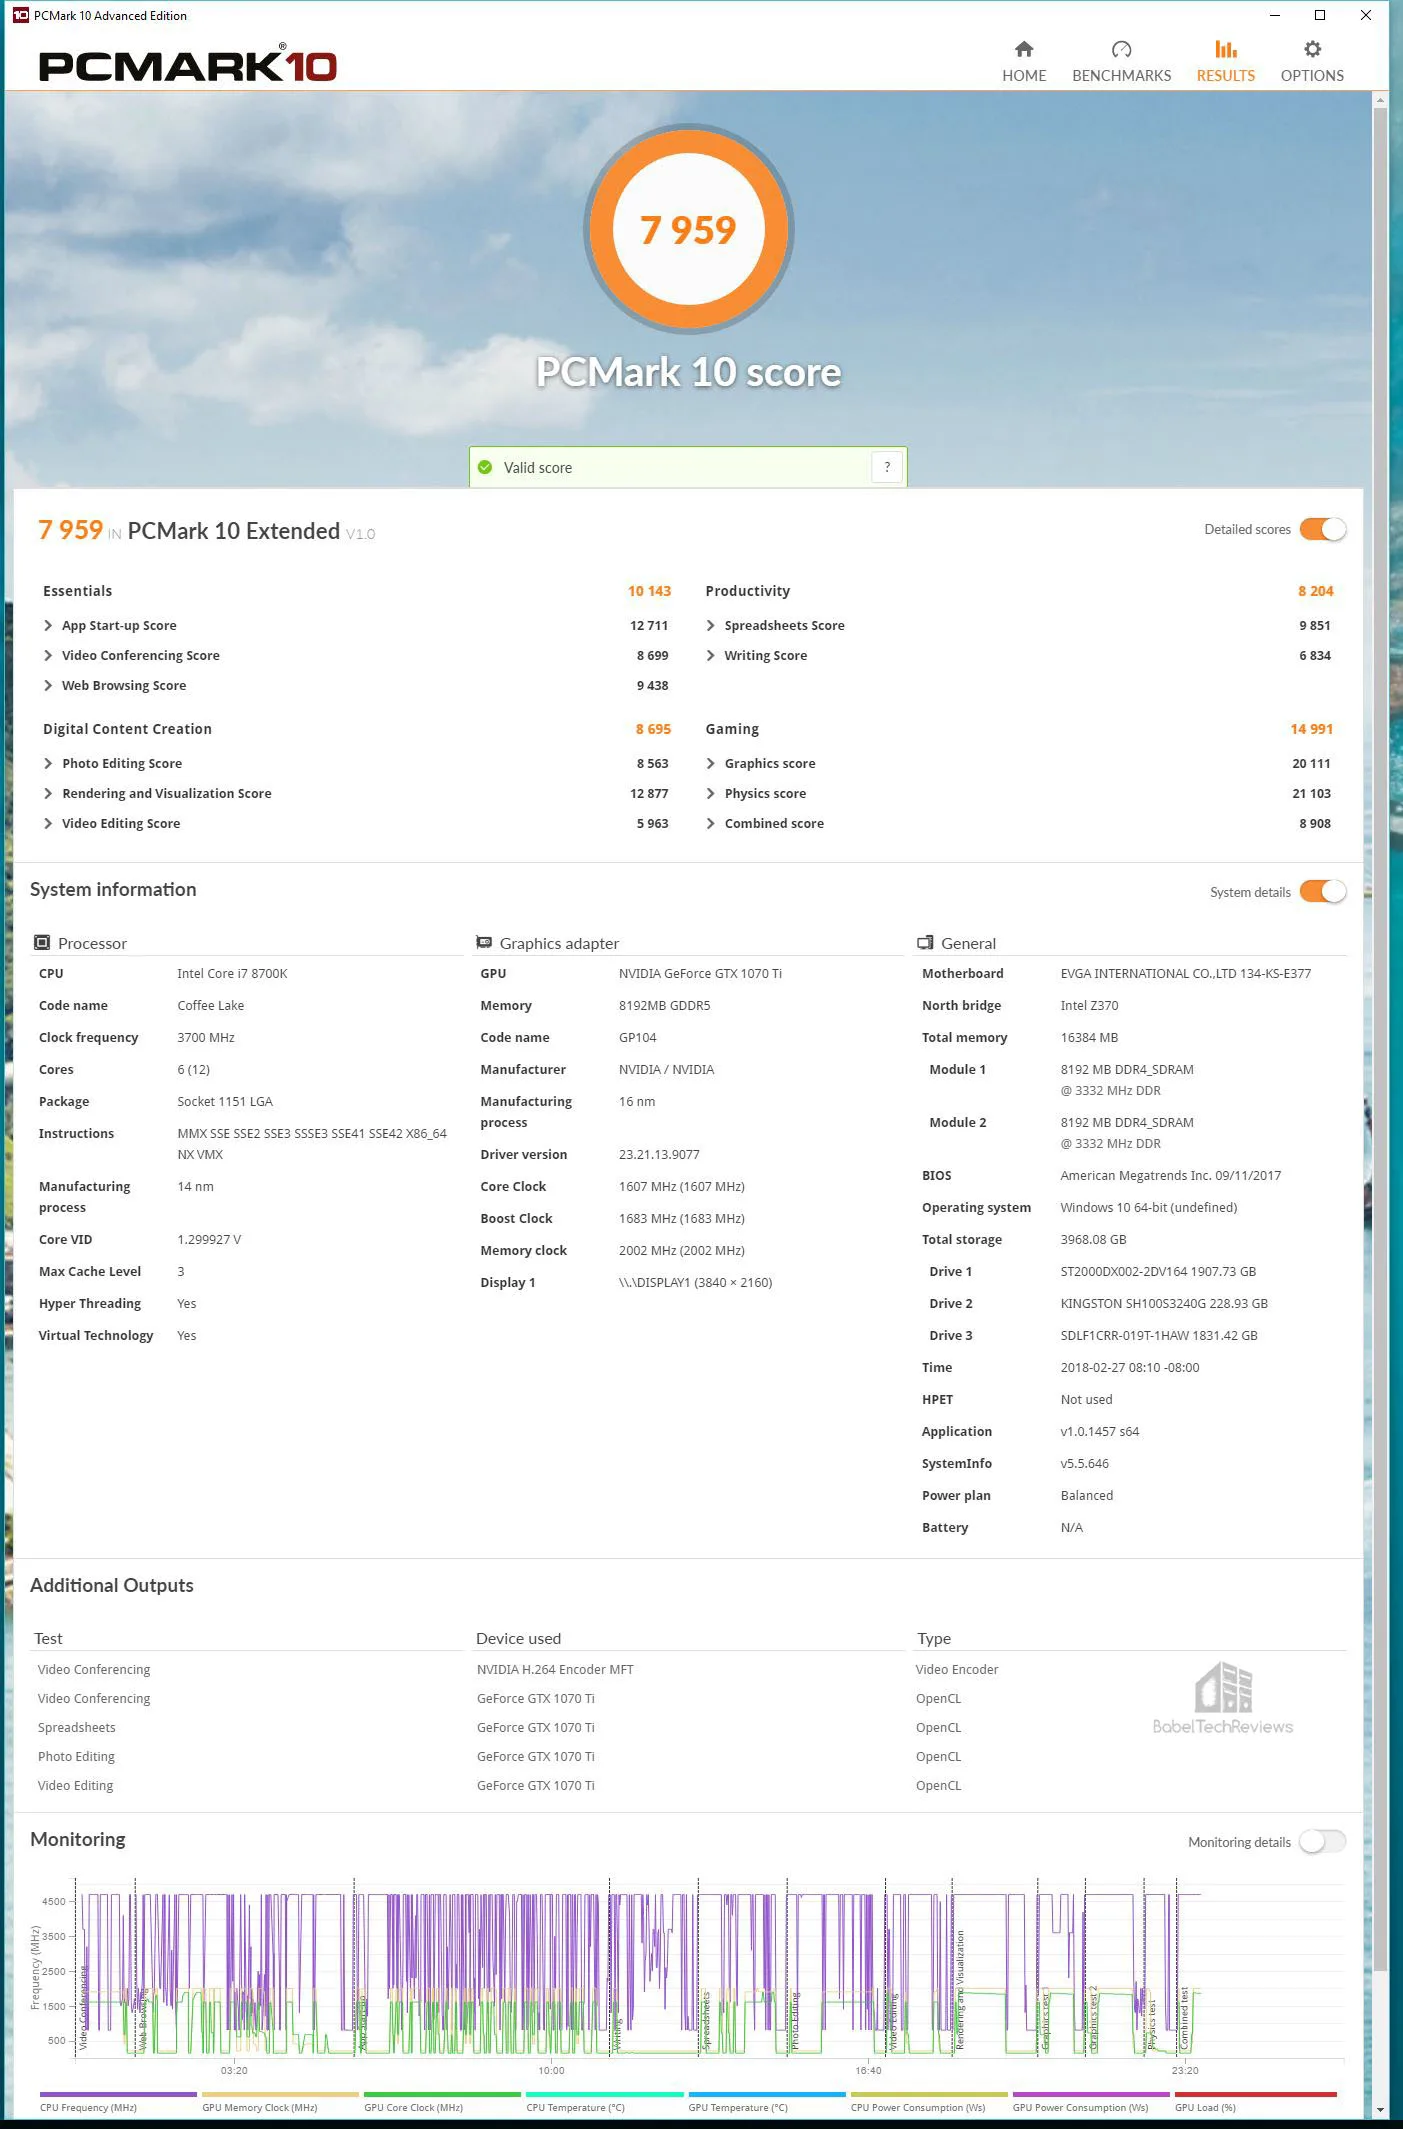
Here are the online results:
Here is the summary.
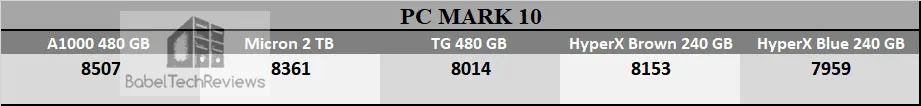 The Kingston A1000 480 GB NVMe SSD gets the highest score, but it is very difficult to see exactly where it scored higher by looking at the individual tests. Neither the 2 TB SSHD nor the 1.92 SSD are set up with Windows installed so we default to a much better storage test with PC Mark 8.
PCMARK 8
PCMark 8 has an excellent storage test which actually uses real world timed benchmarks which include loading World of Warcraft and Battlefield 3 as well as timing how long it takes to load Adobe apps.
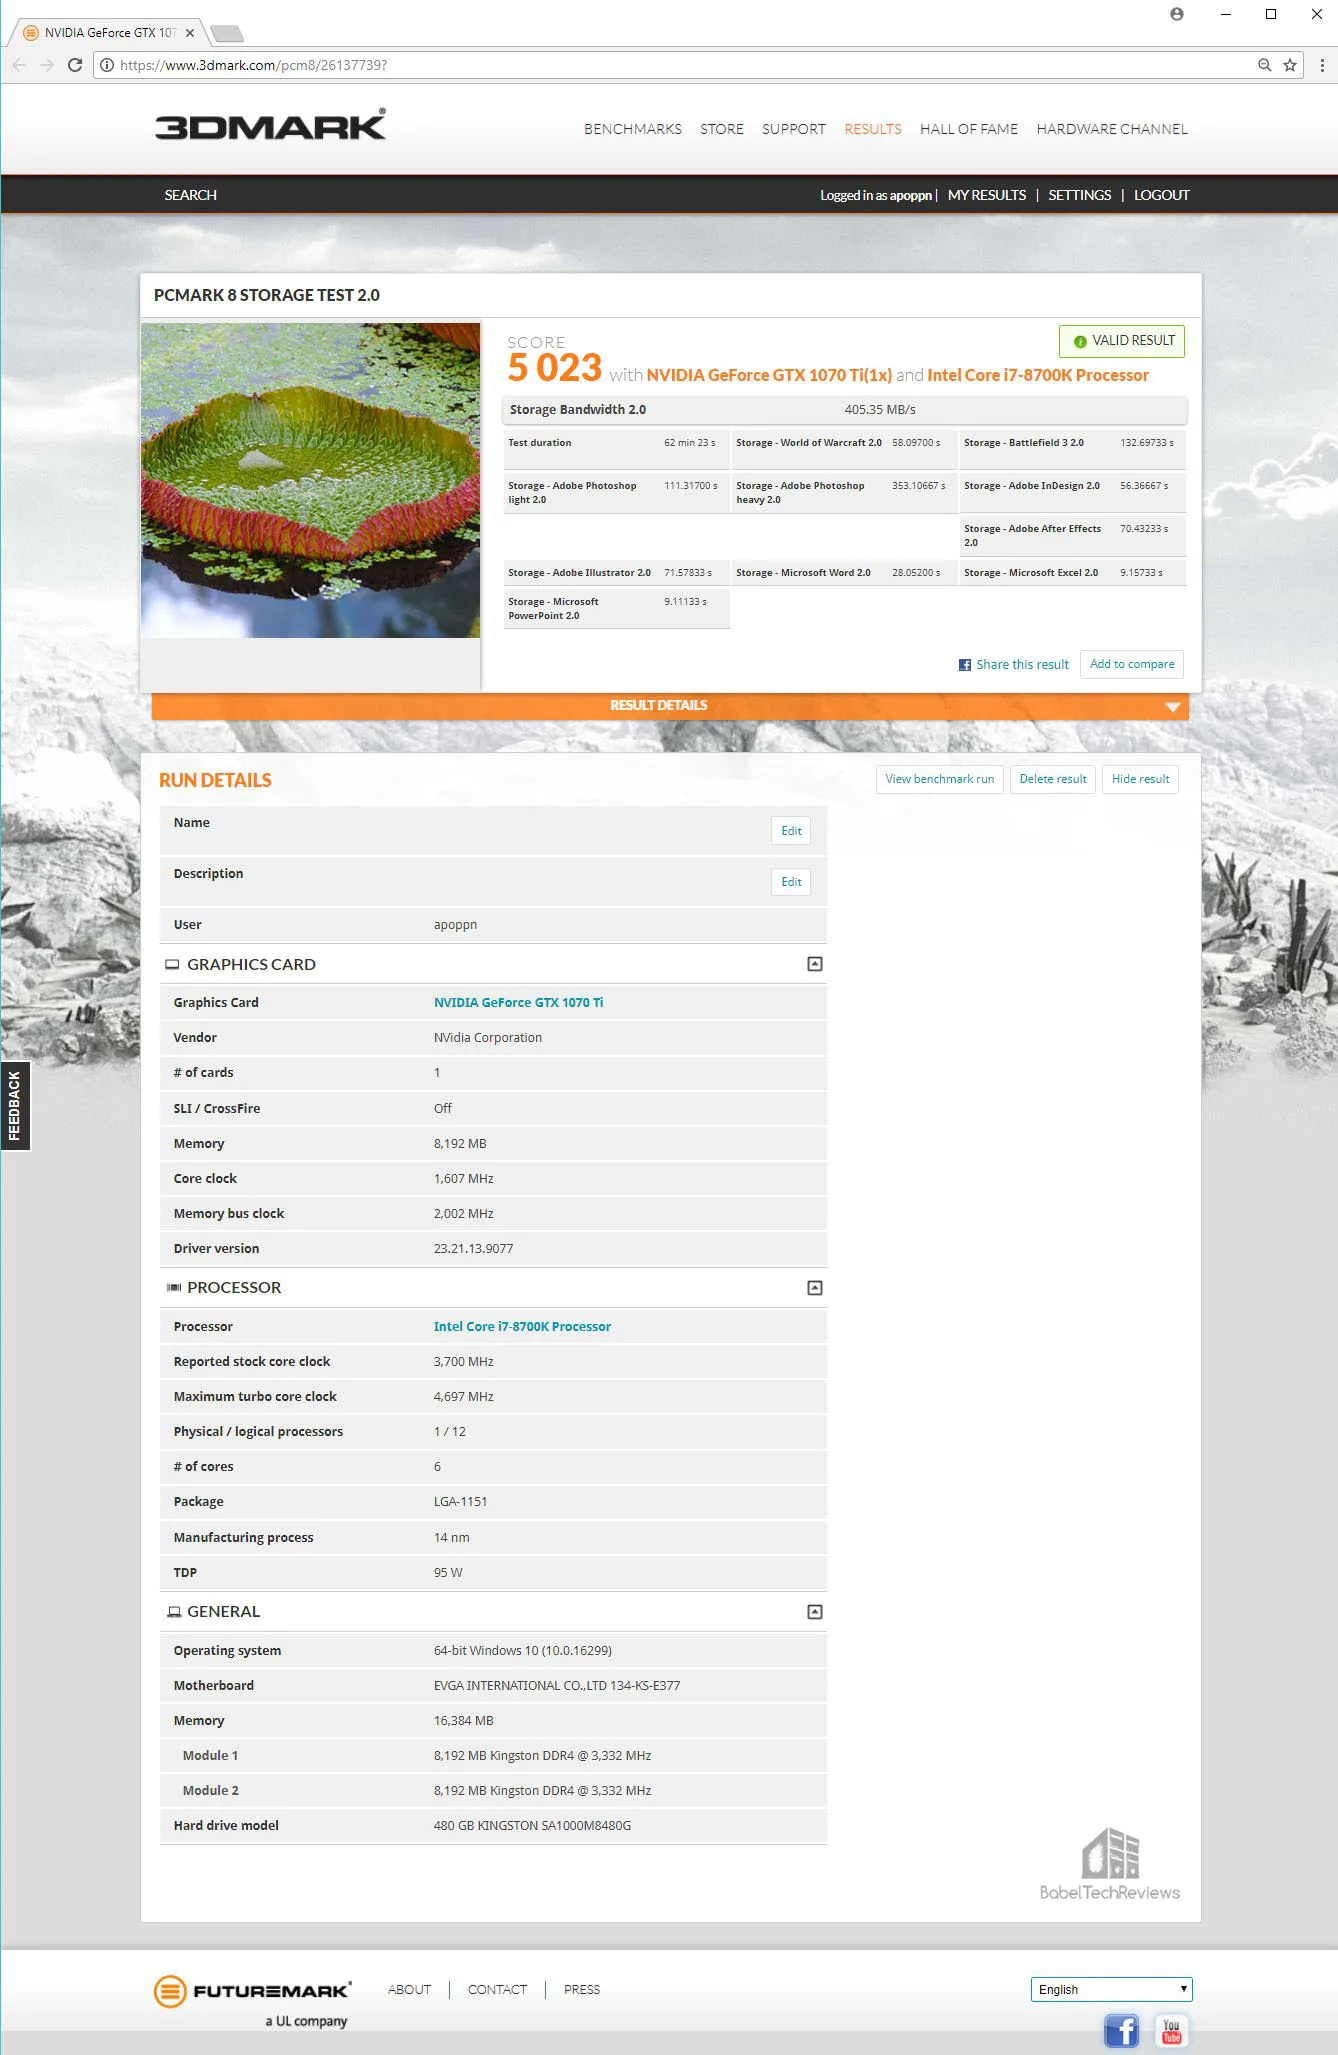
The Kingston A1000 480 GB SSD scores 5023. with a total Storage 2.0 Bandwidth of 405.35 MB/s. And most importantly for a gamer, it took 58.1 seconds to load World of Warcraft and 132.7 seconds for Battlefield 3 to load.
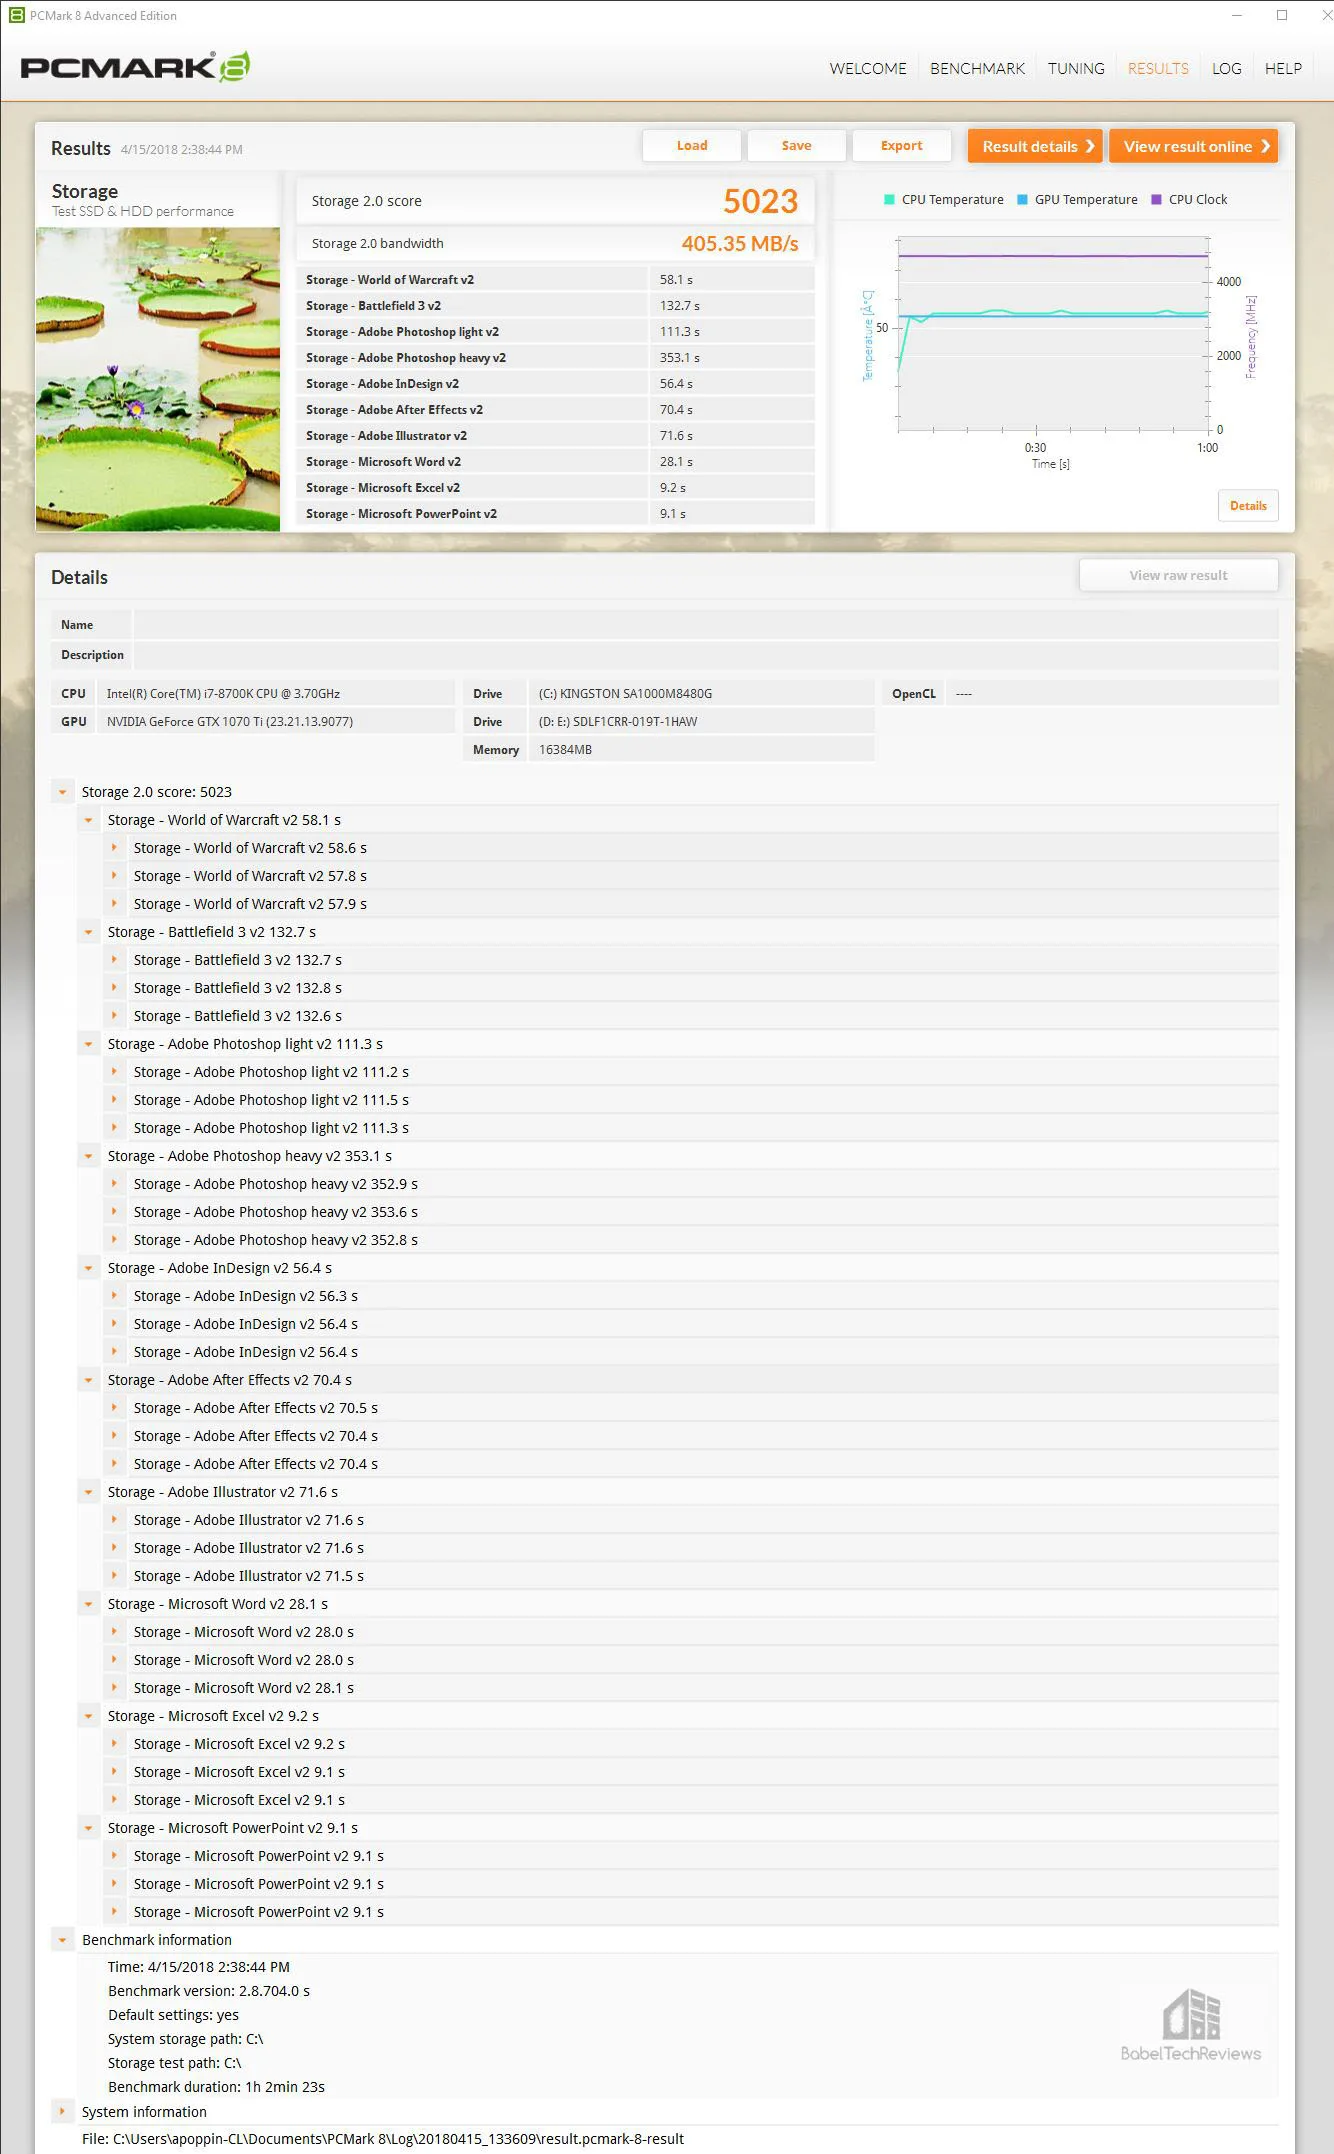
Here are the online results:
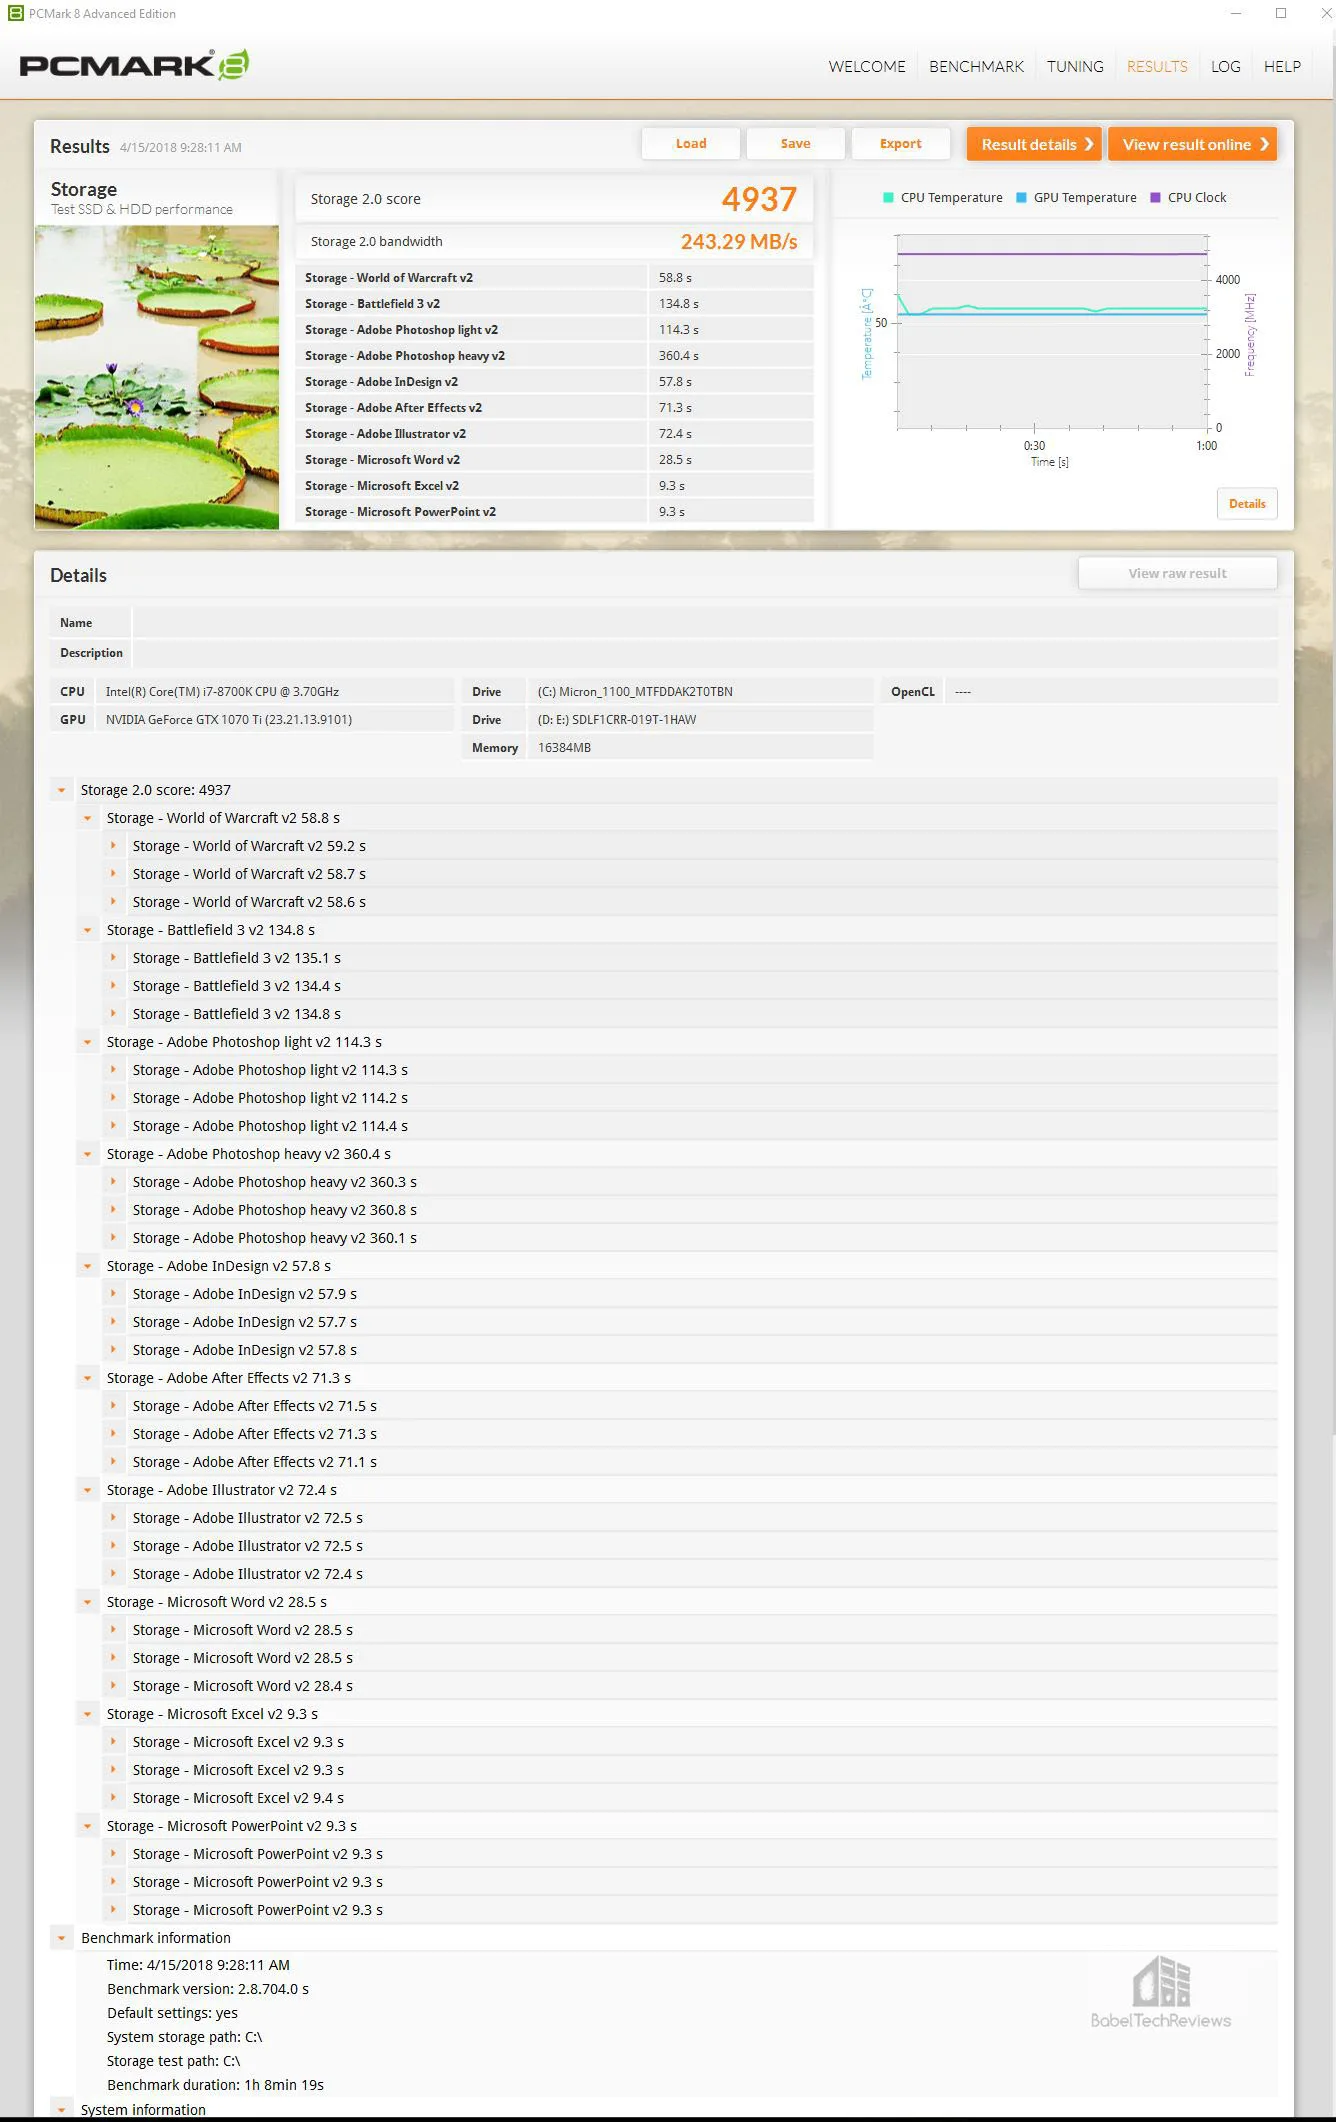
The Micron 1100 2 TB GB SSD scores 4937 with 243.29 MB/s bandwidth, but most importantly for a gamer, it took 58.8 seconds to load World of Warcraft and 134.8 seconds for Battlefield 3 to load.
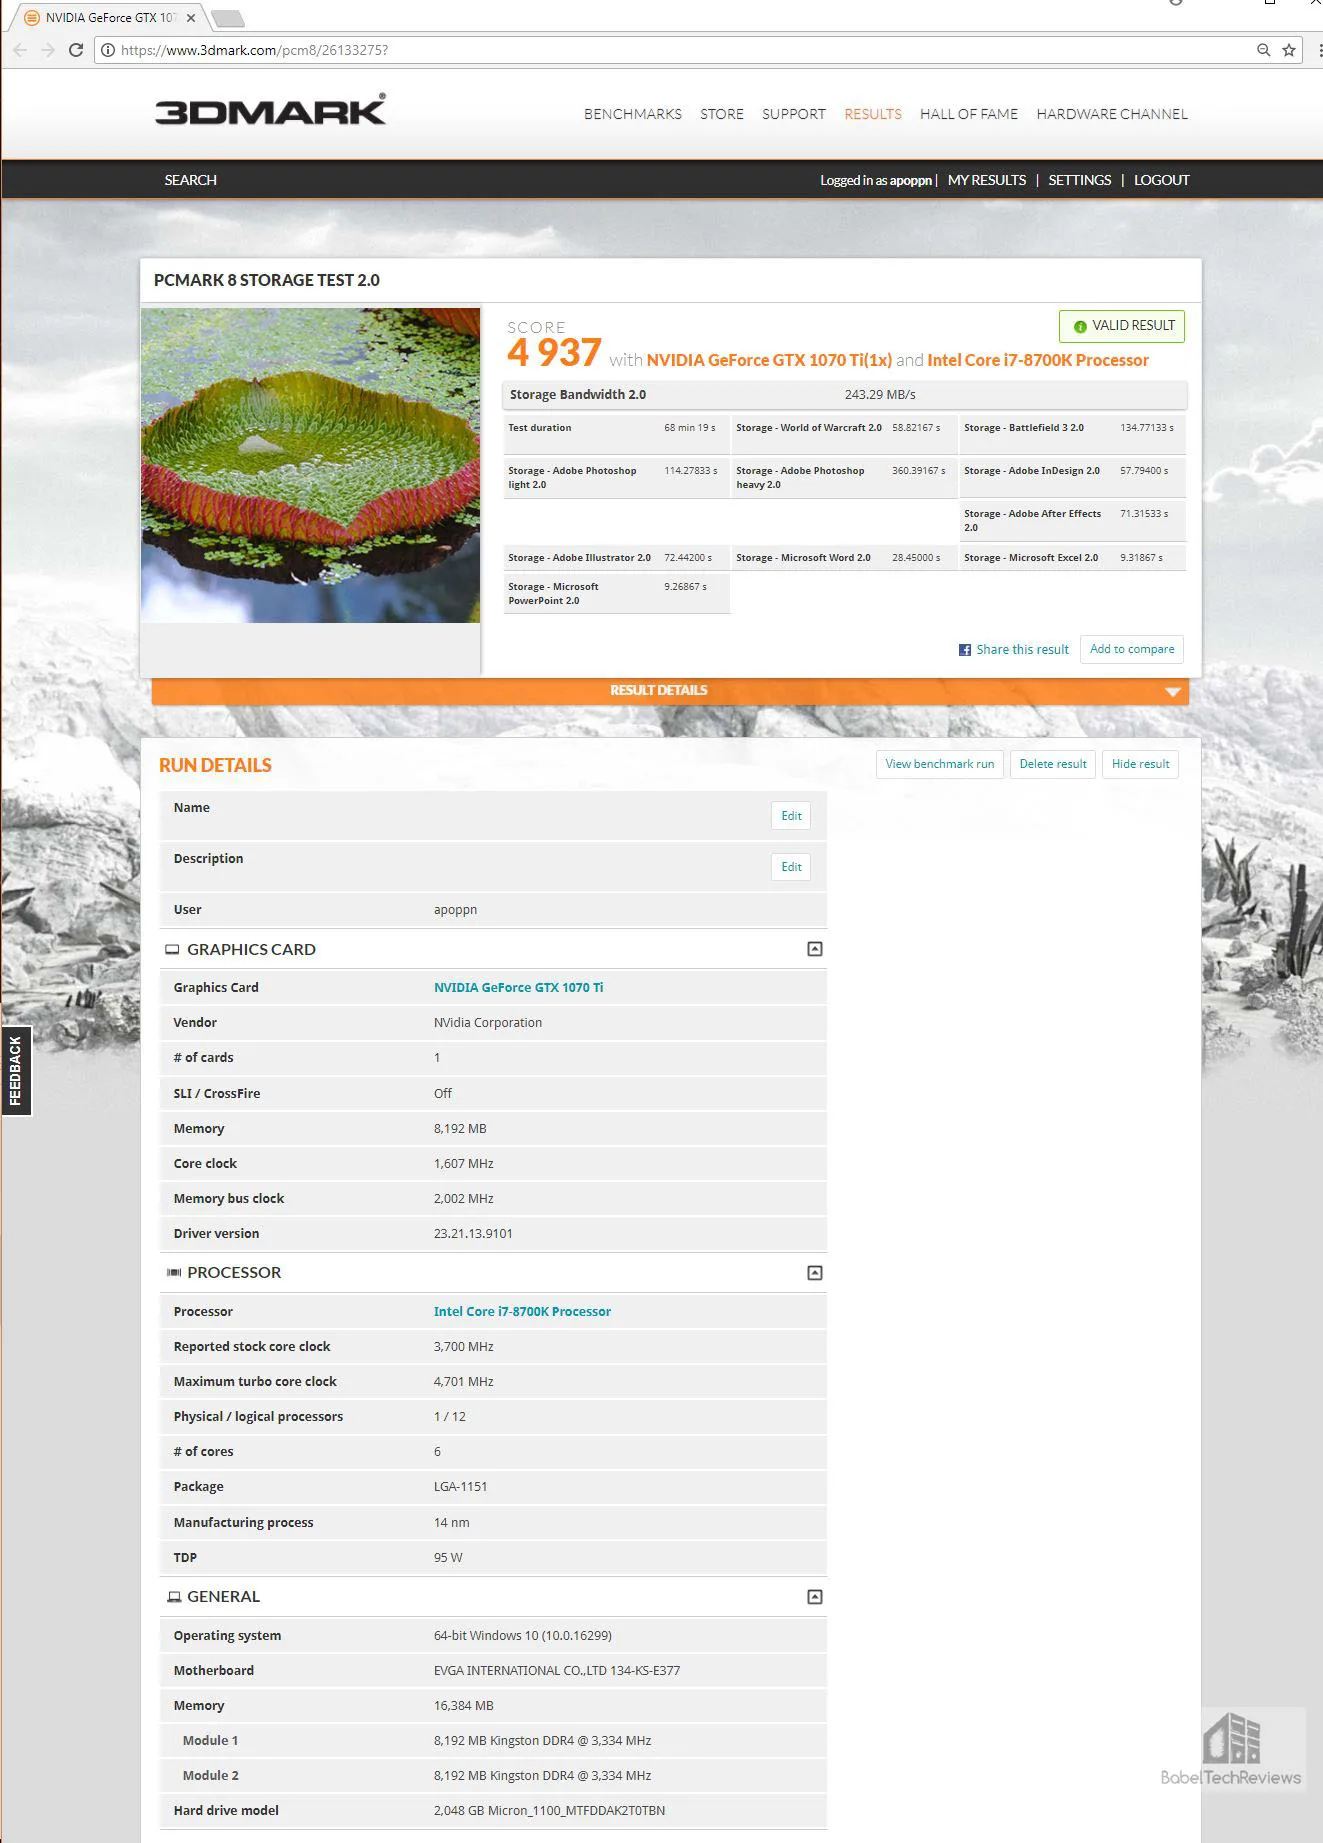
Here are the online results:
Here is the Team Group 480 GB SSD storage test with 4960 or 255.07 MB/s bandwidth.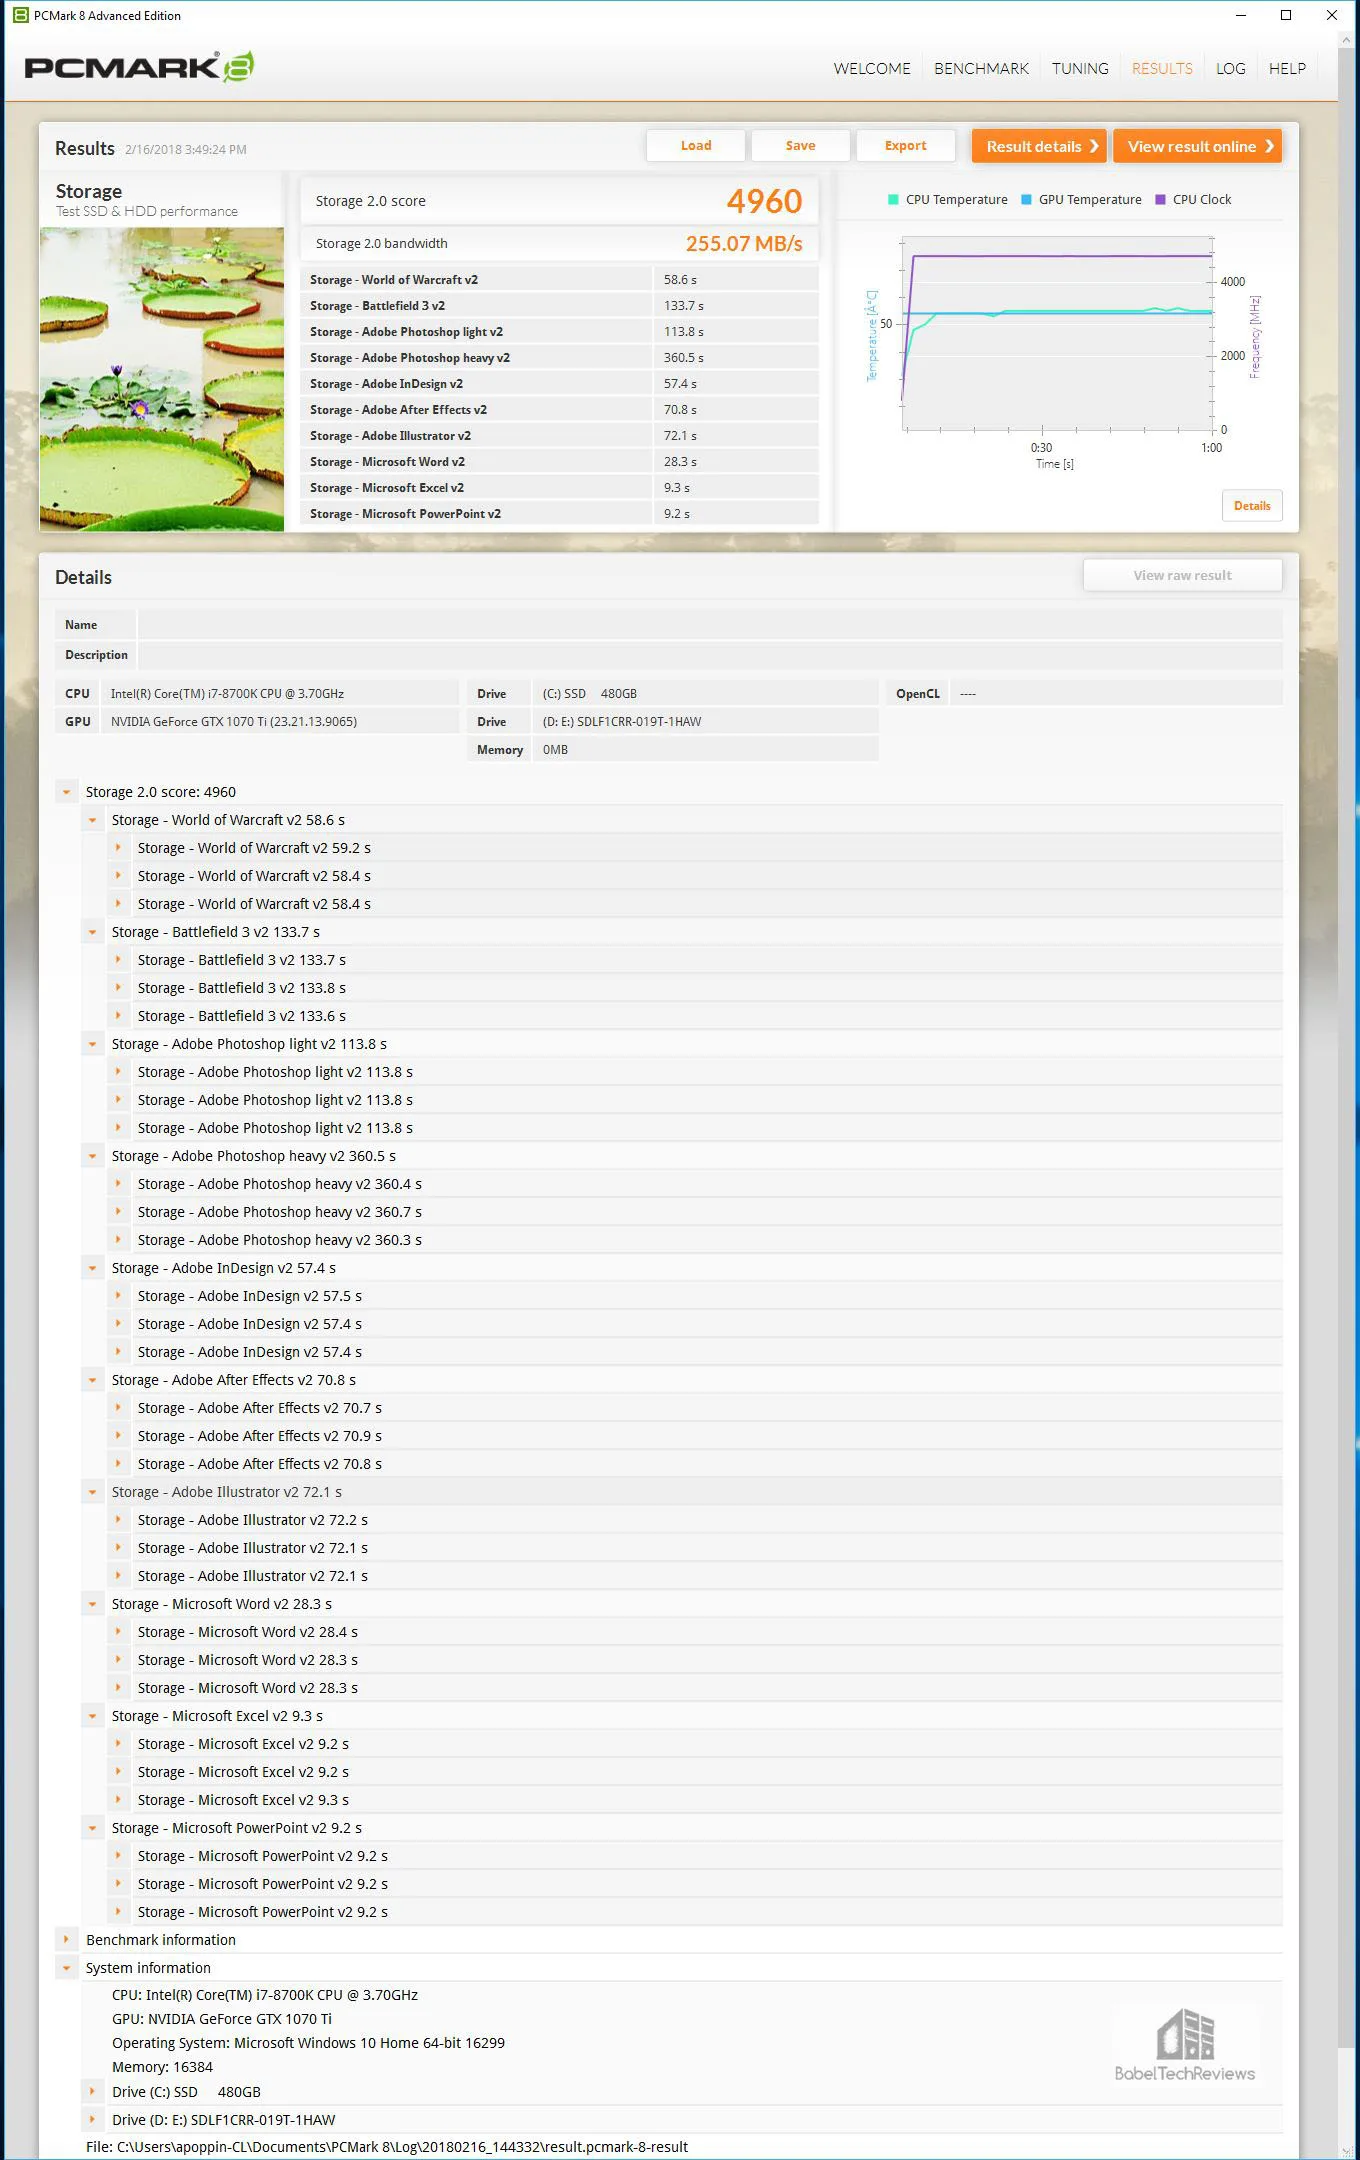
Here is the TG 480 GB online storage test summarized, and most importantly for a gamer, it took 58.4 seconds to load World of Warcraft and 133.4 seconds for Battlefield 3 to load.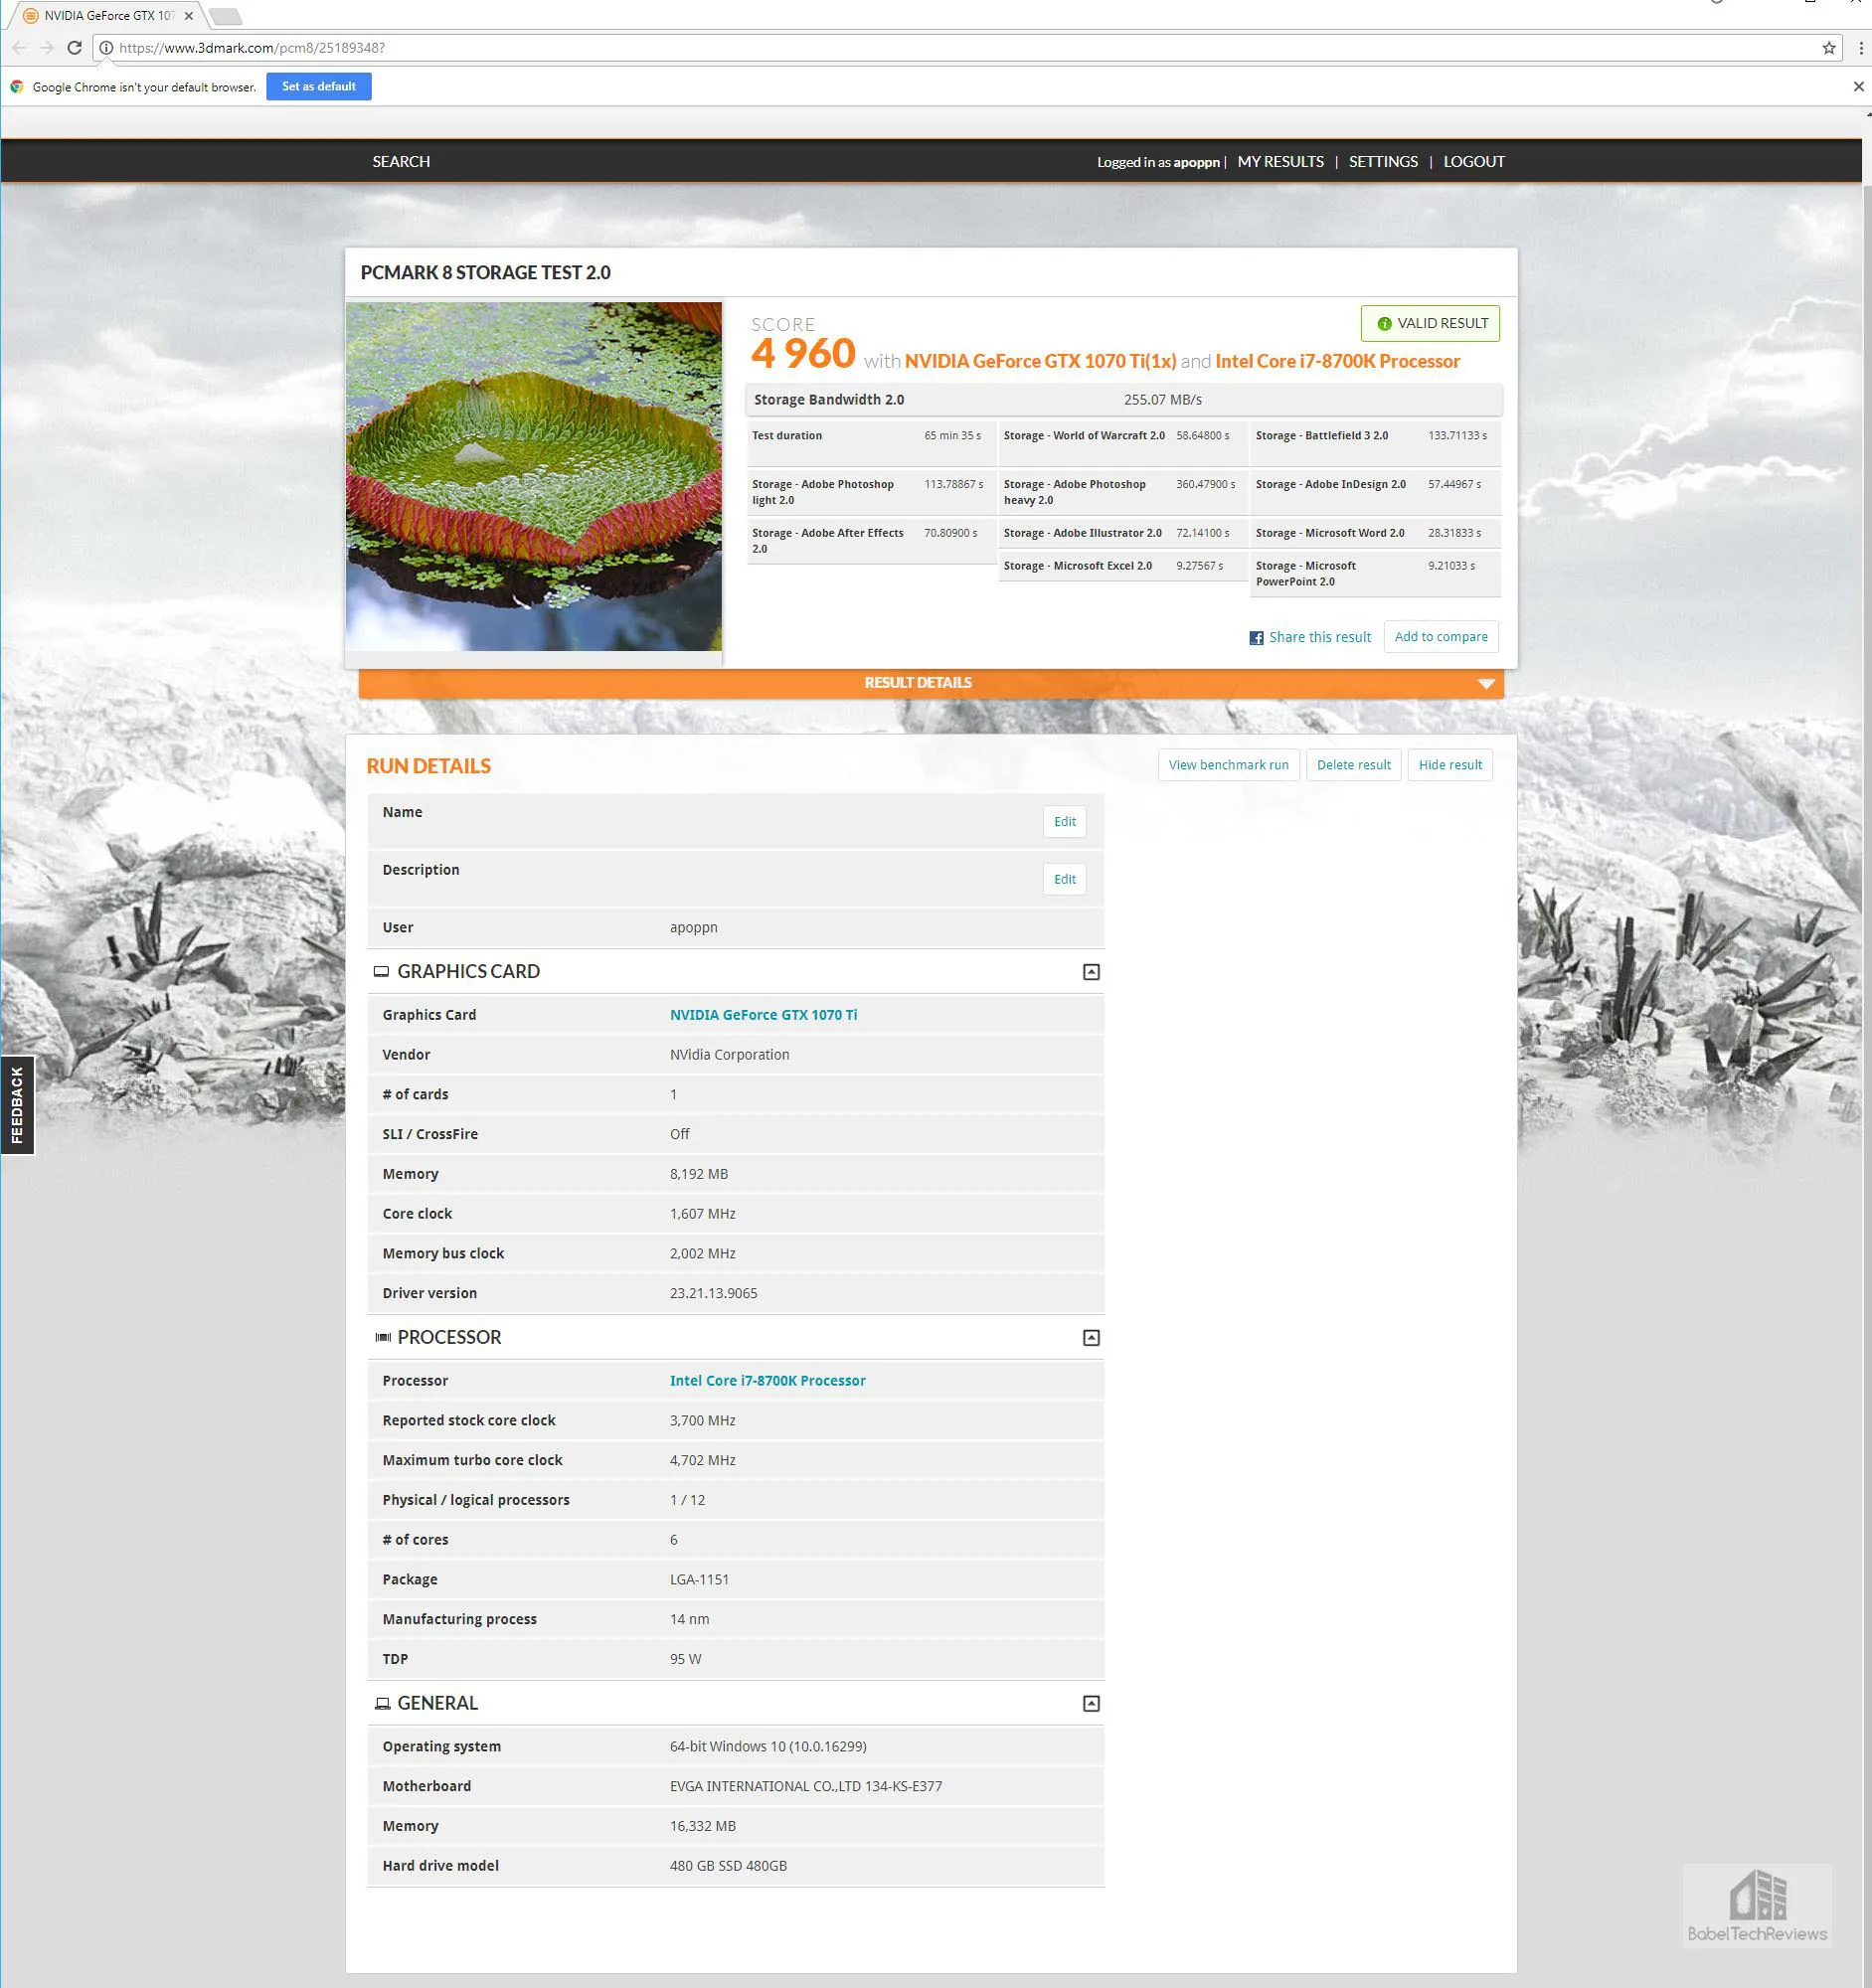
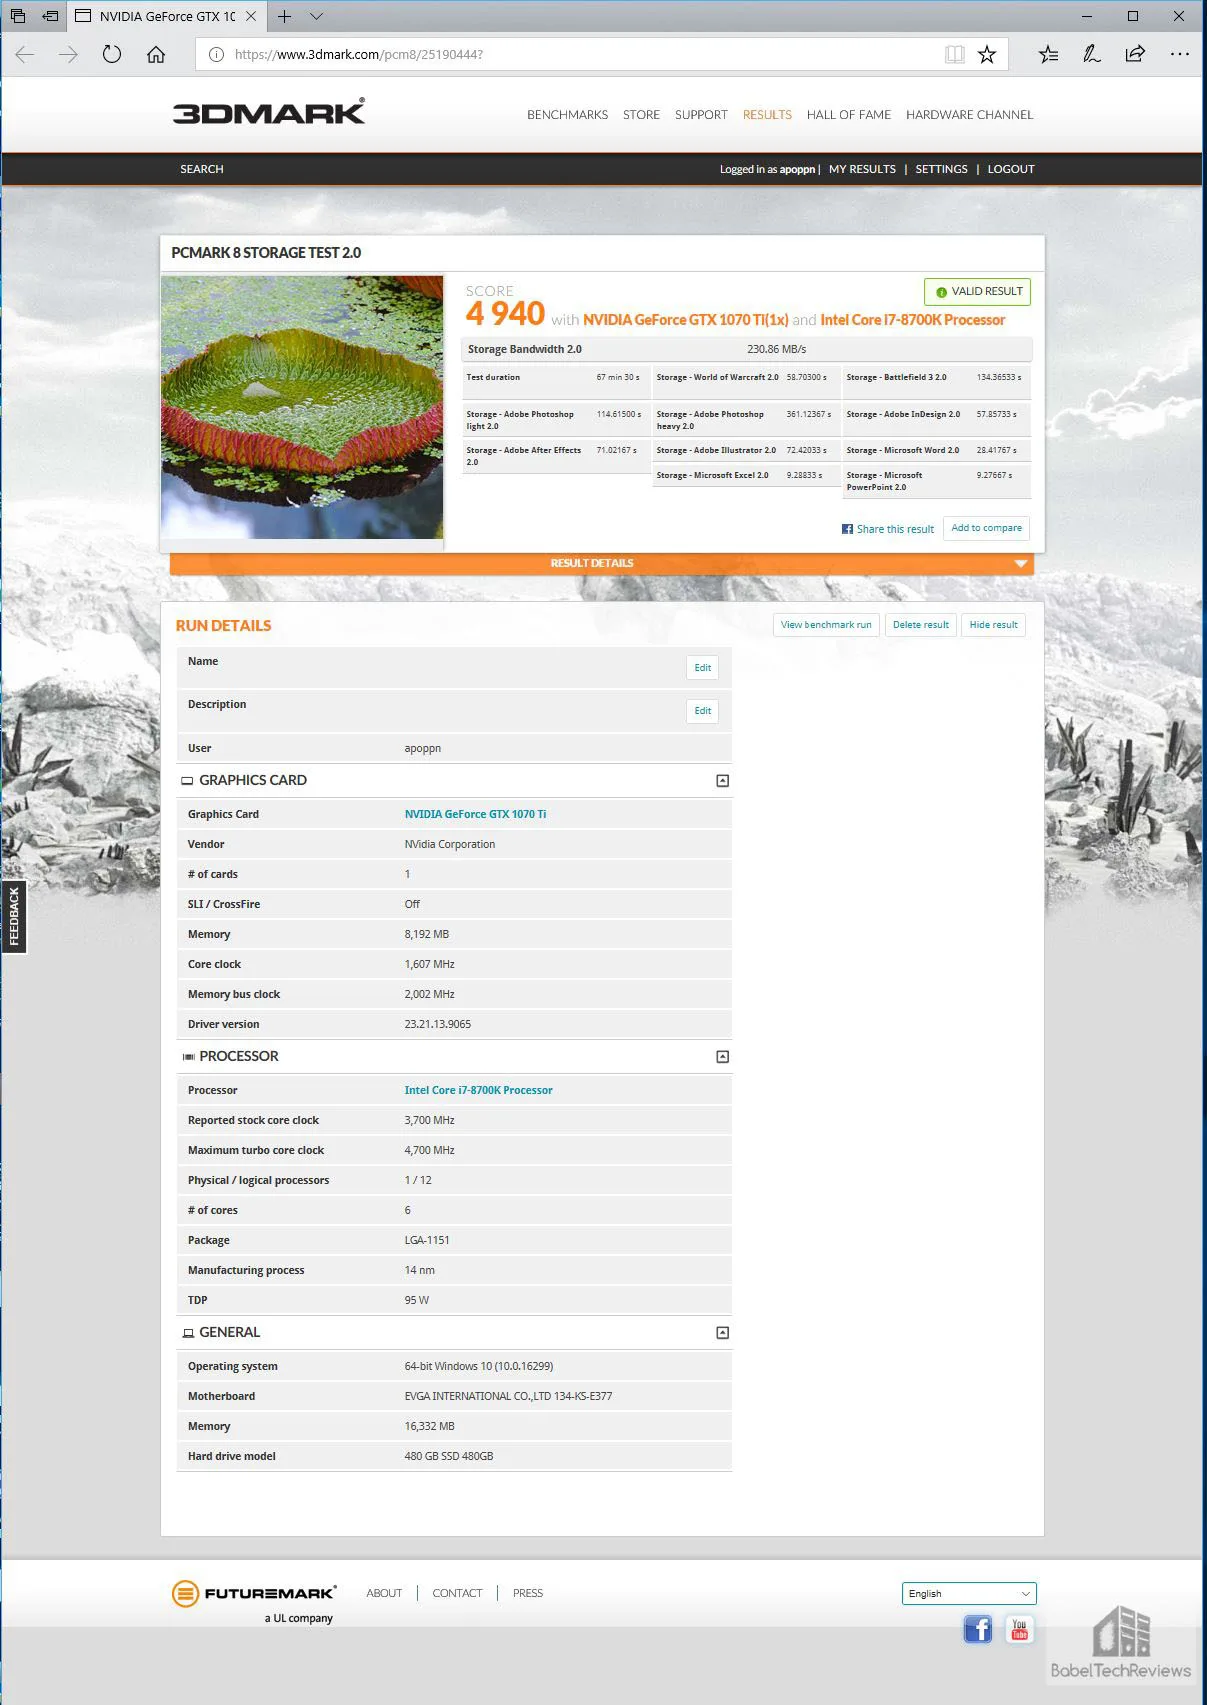
Here is the SanDisk 1.92 GB SSD storage test scoring 4940 and 230.86 MB/s bandwidth.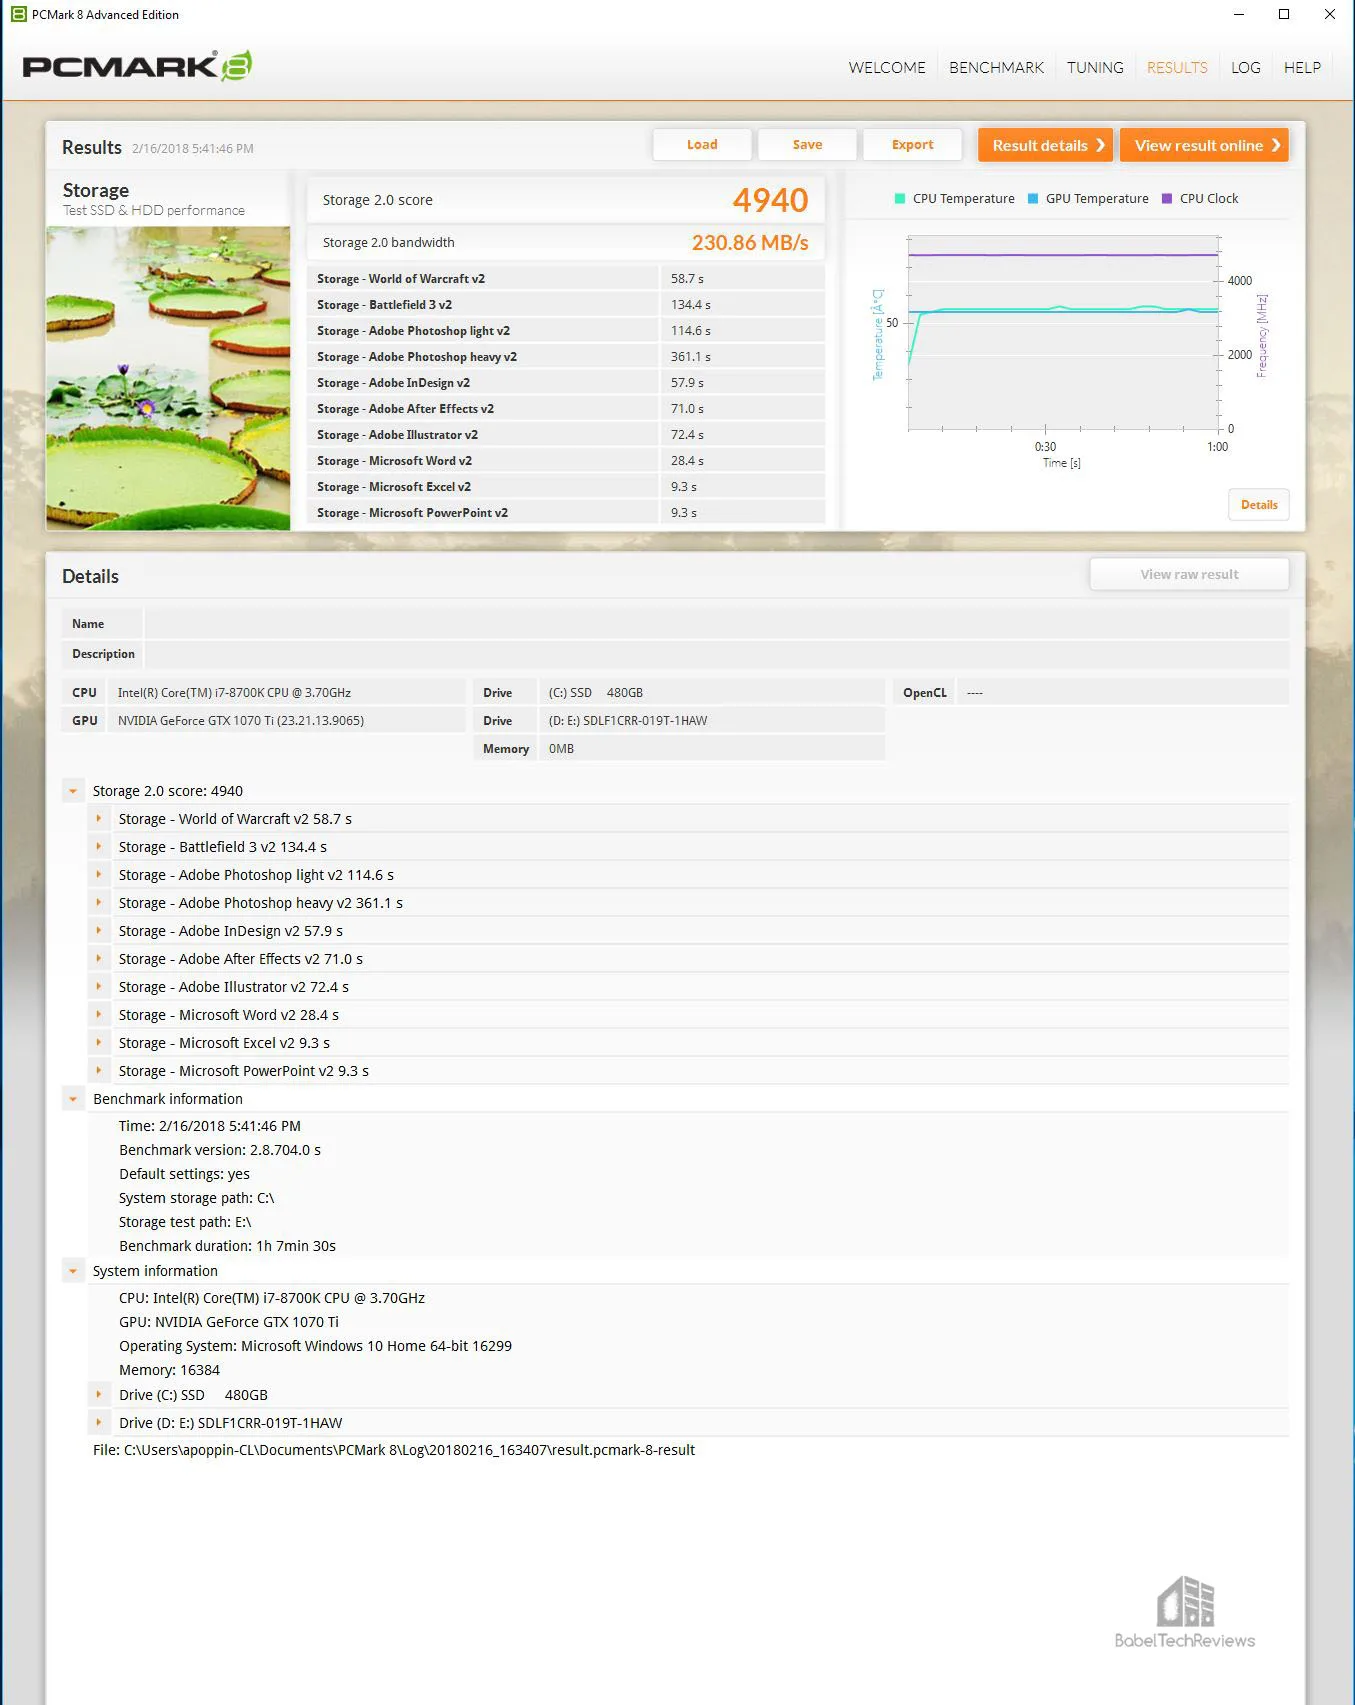
Here is the 1.92 GB SanDisk SSD online storage test summarized, and most importantly for a gamer, it took 58.7 seconds to load World of Warcraft and 134.4 seconds for Battlefield 3 to load.
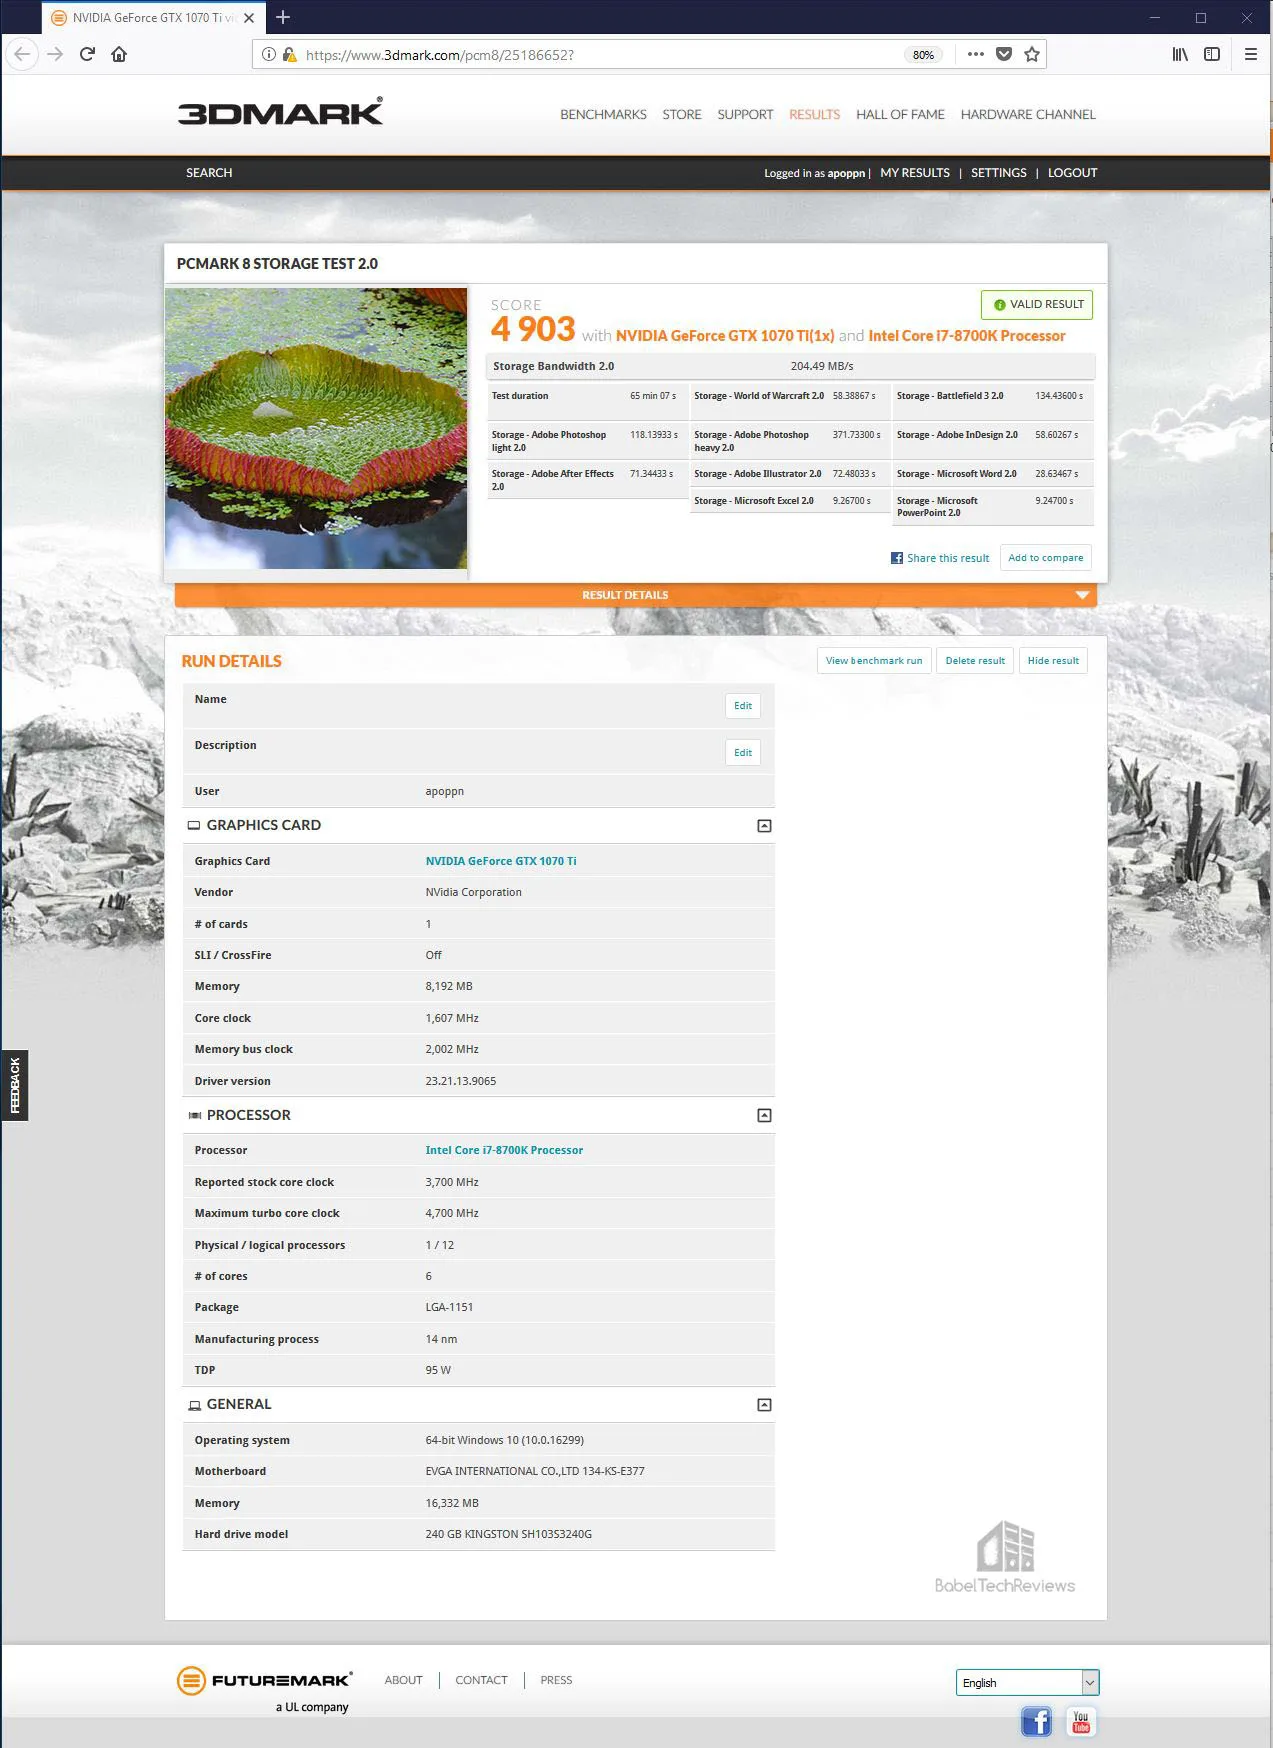
Here are the 240 GB HyperX (brown) SSD storage test scoring 4903 and 204.49 MB/s bandwidth.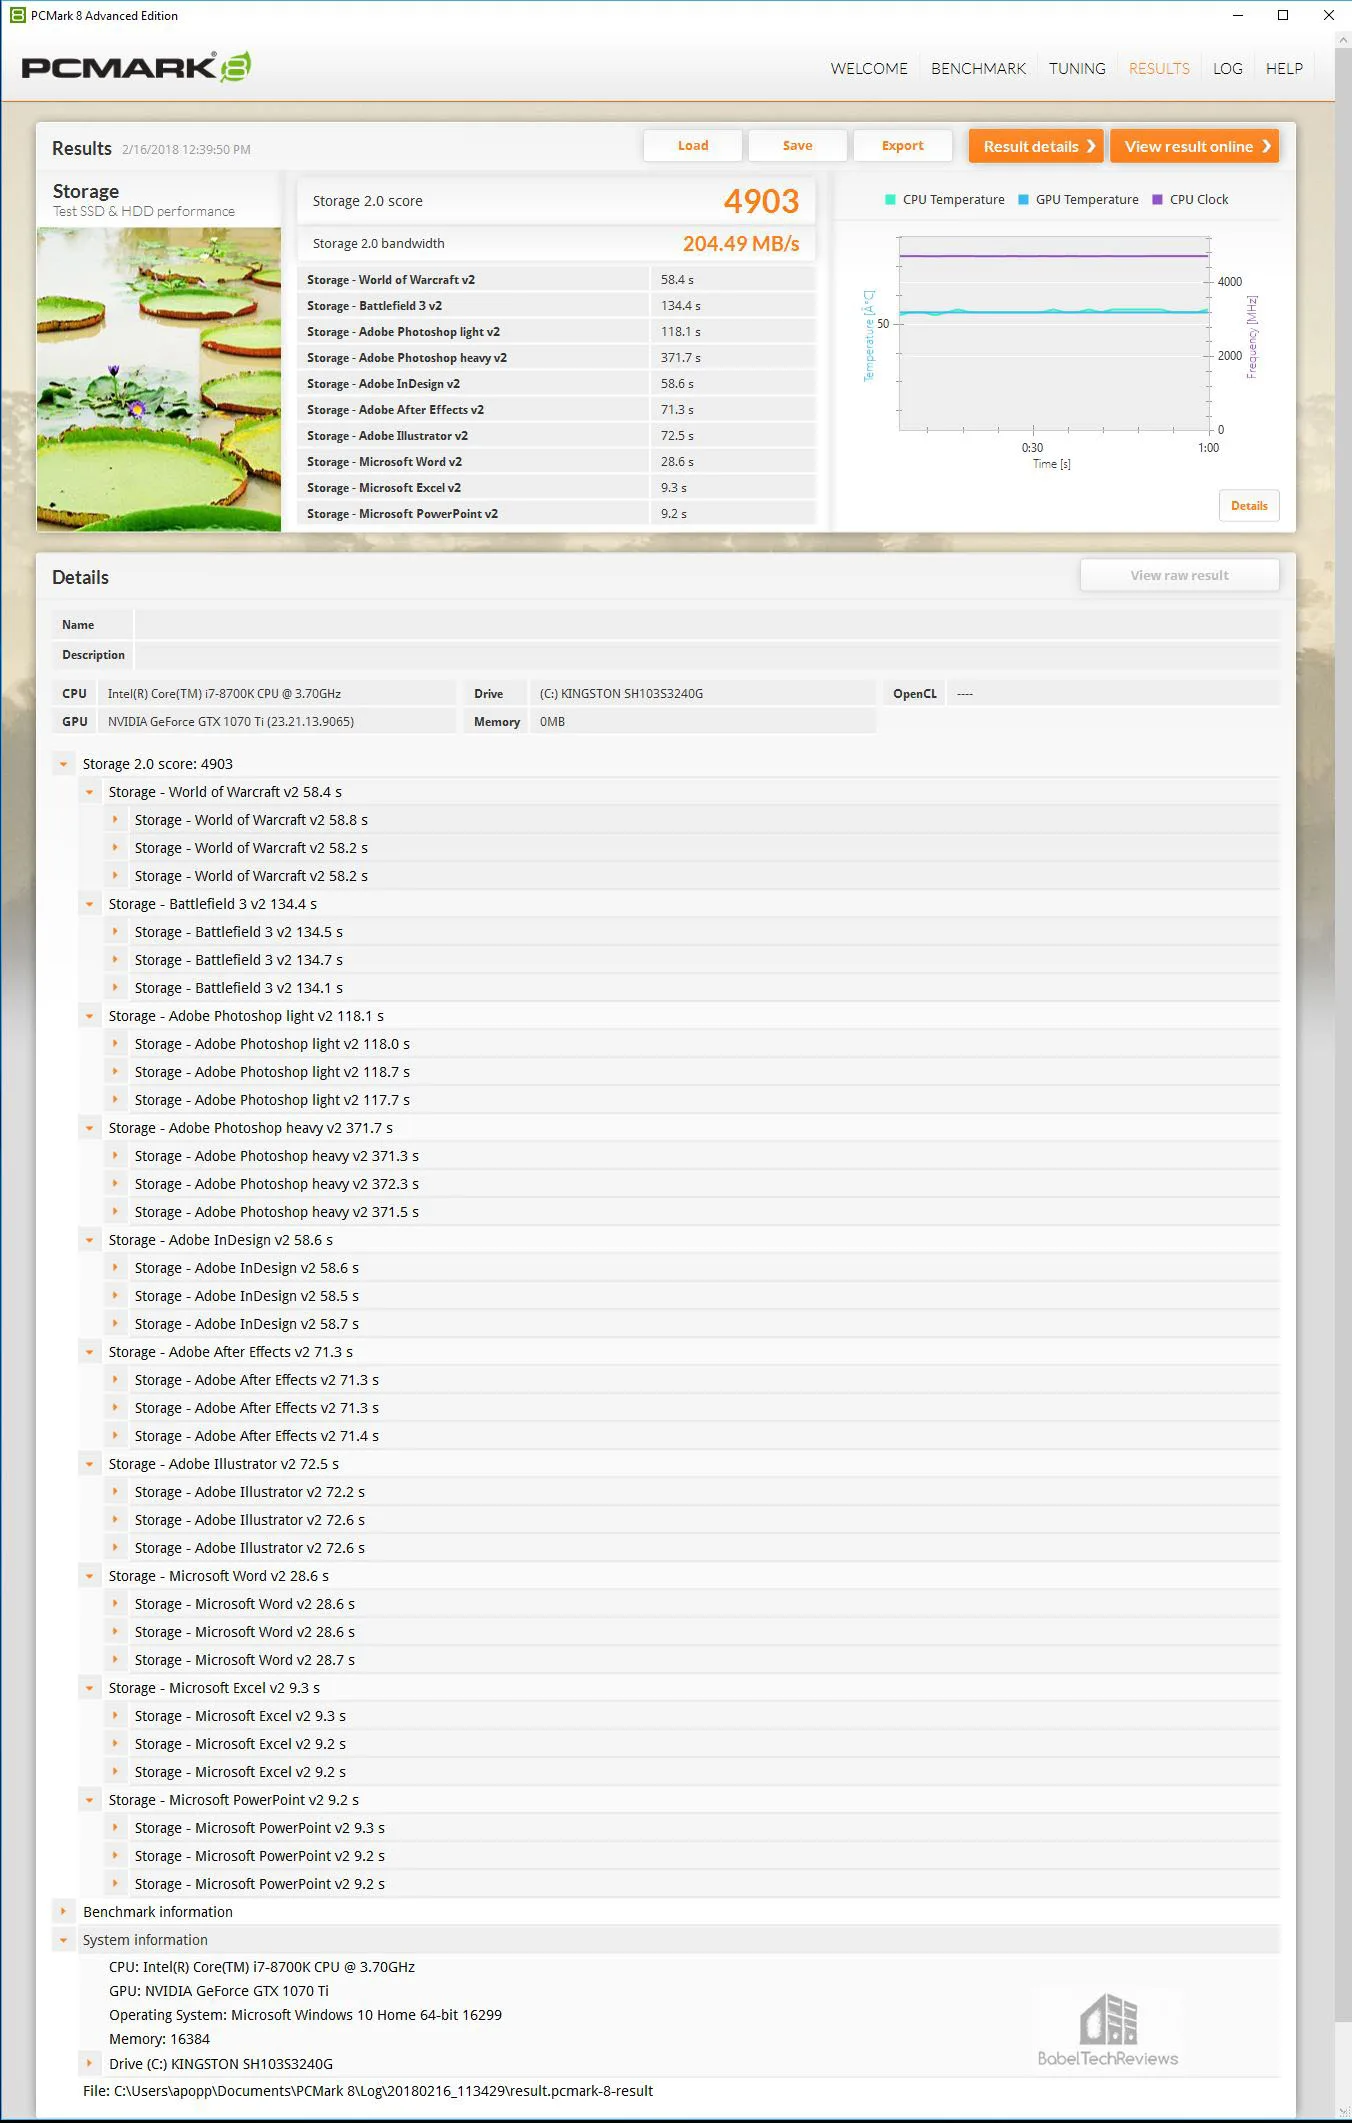
Here are the HyperX online storage test results summarized, and most importantly for a gamer, it took 58.4 seconds to load World of Warcraft and 134.4 seconds for Battlefield 3 to load.
Here are the 240 GB HyperX SSD Blue storage test scoring 4902 and 204.51 MB/s bandwidth.
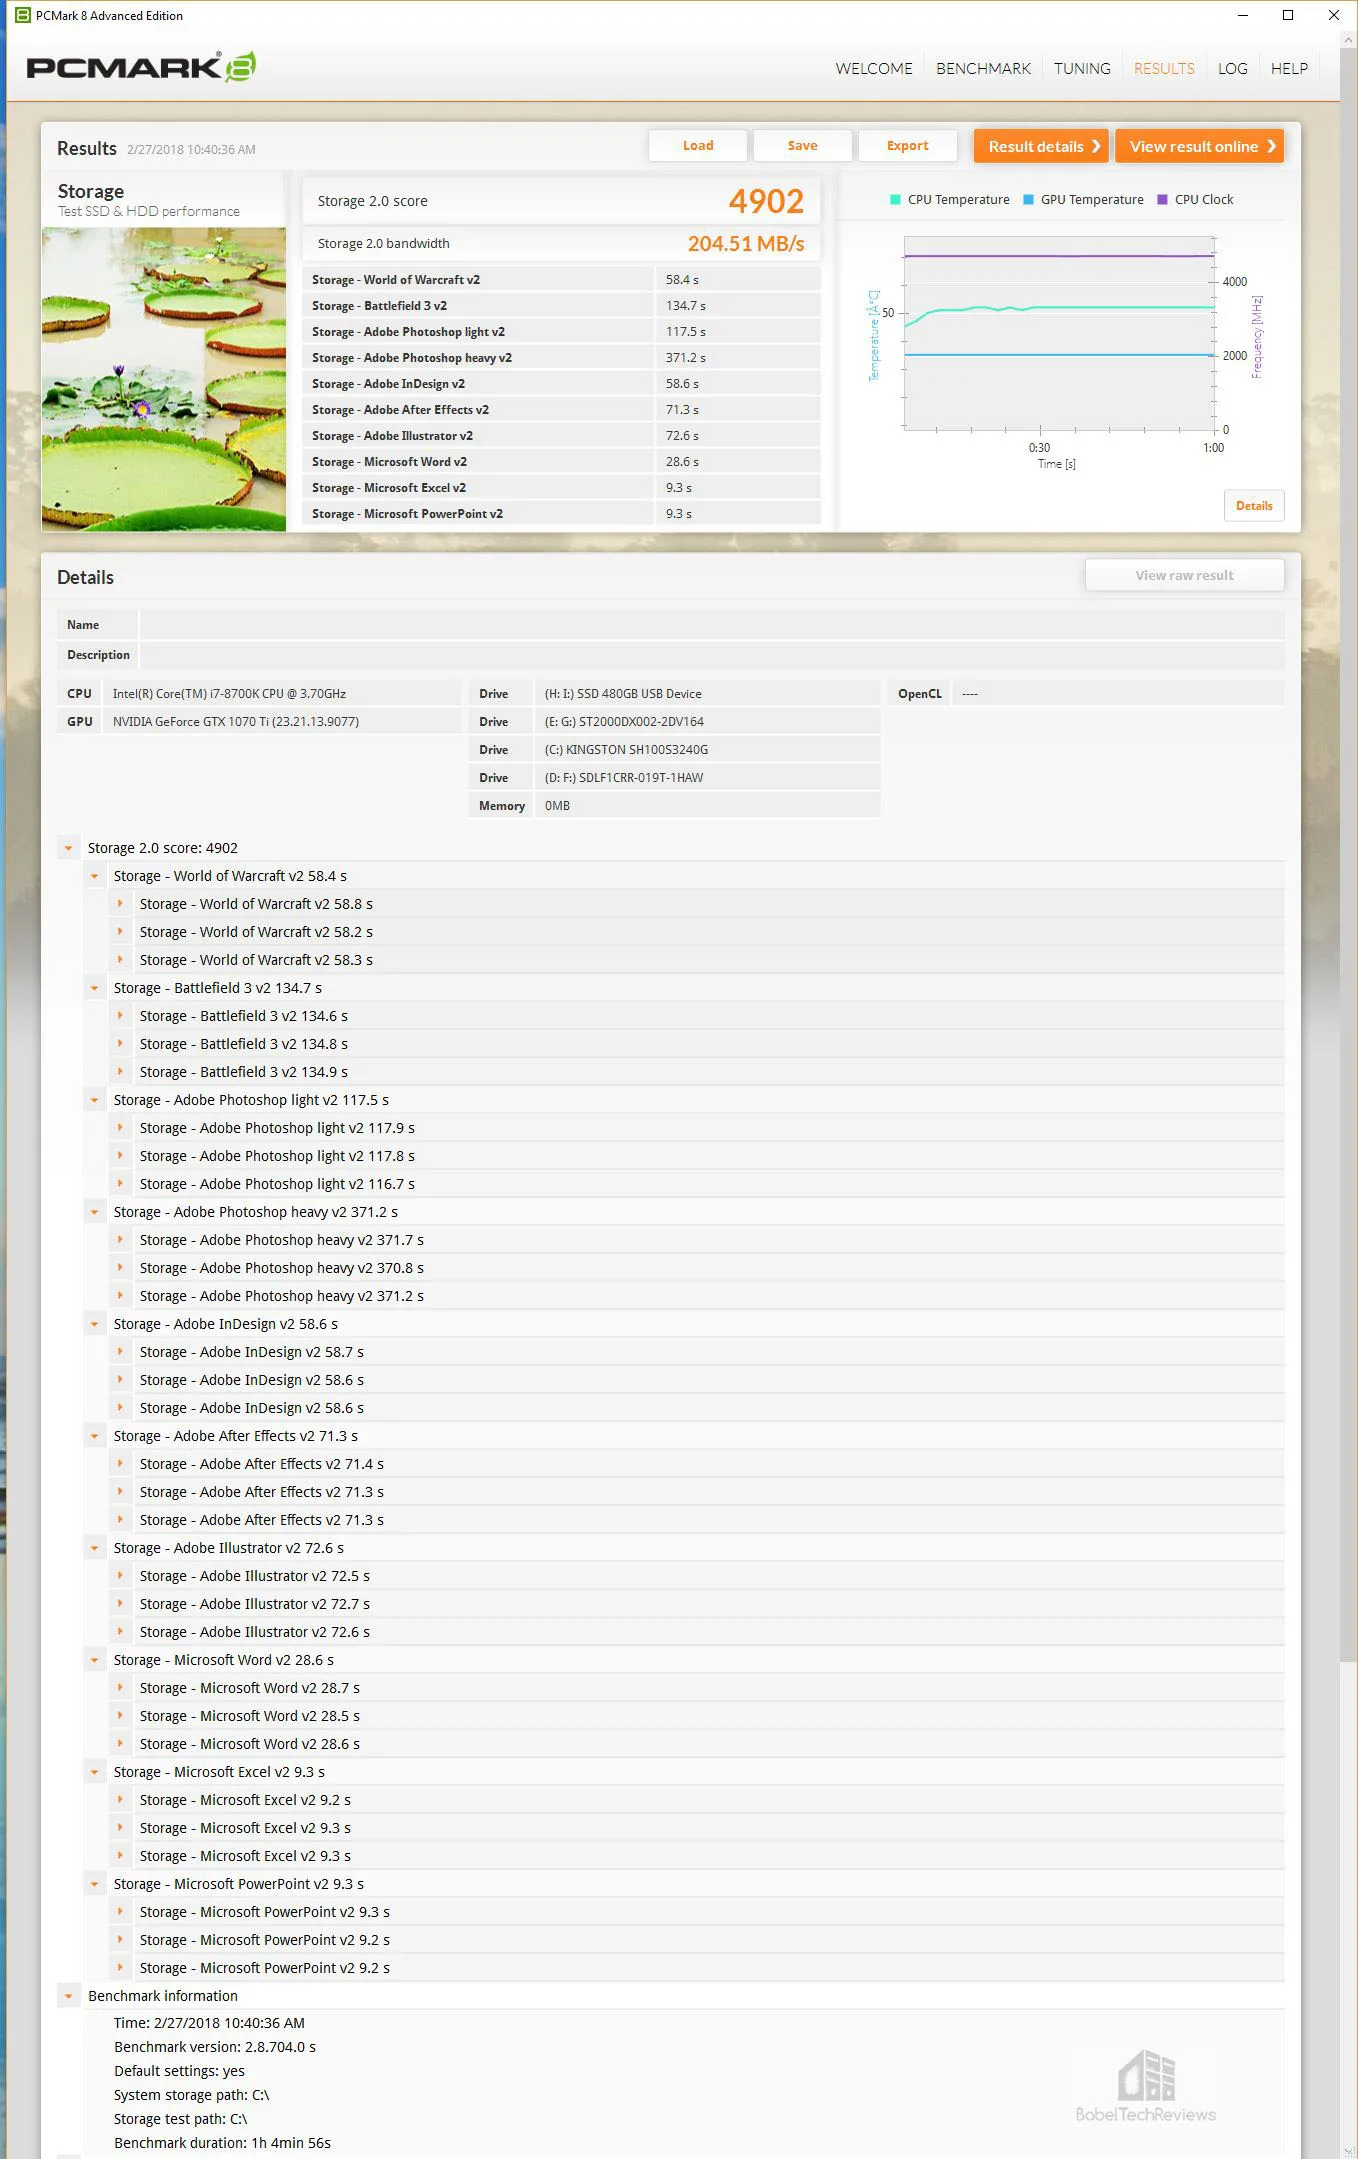
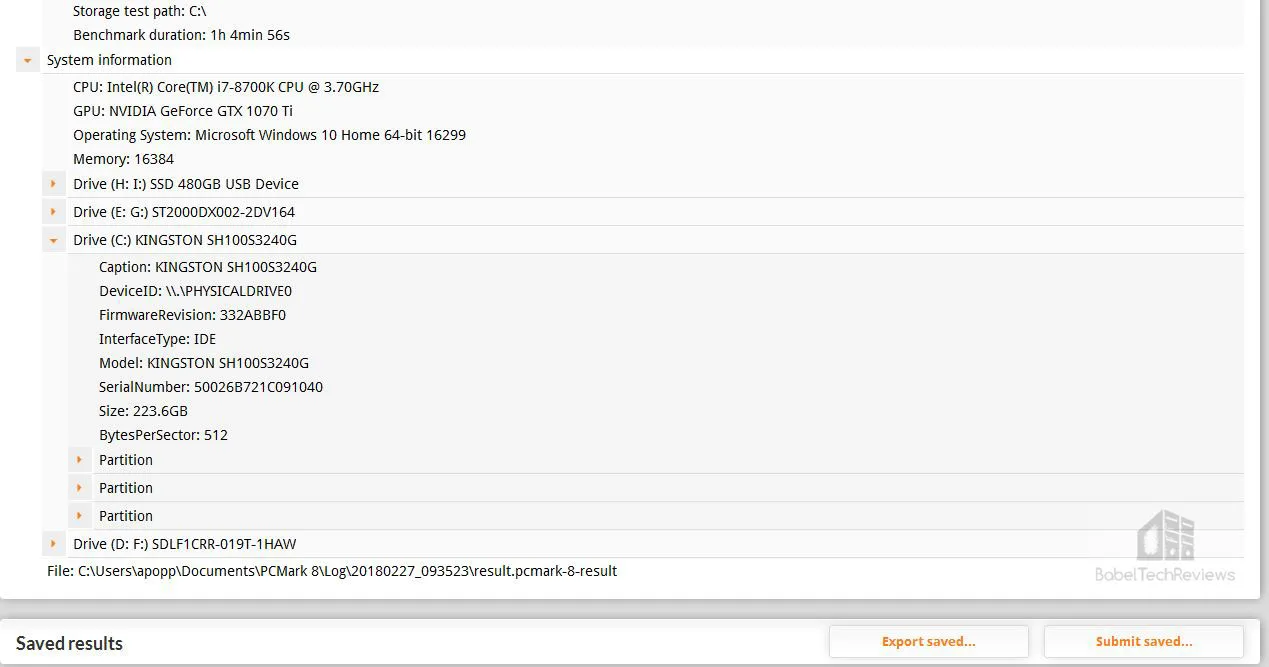 Here are the HyperX Blue online storage test results summarized, and most importantly for a gamer, it took 58.4 seconds to load World of Warcraft and 134.7 seconds for Battlefield 3 to load.
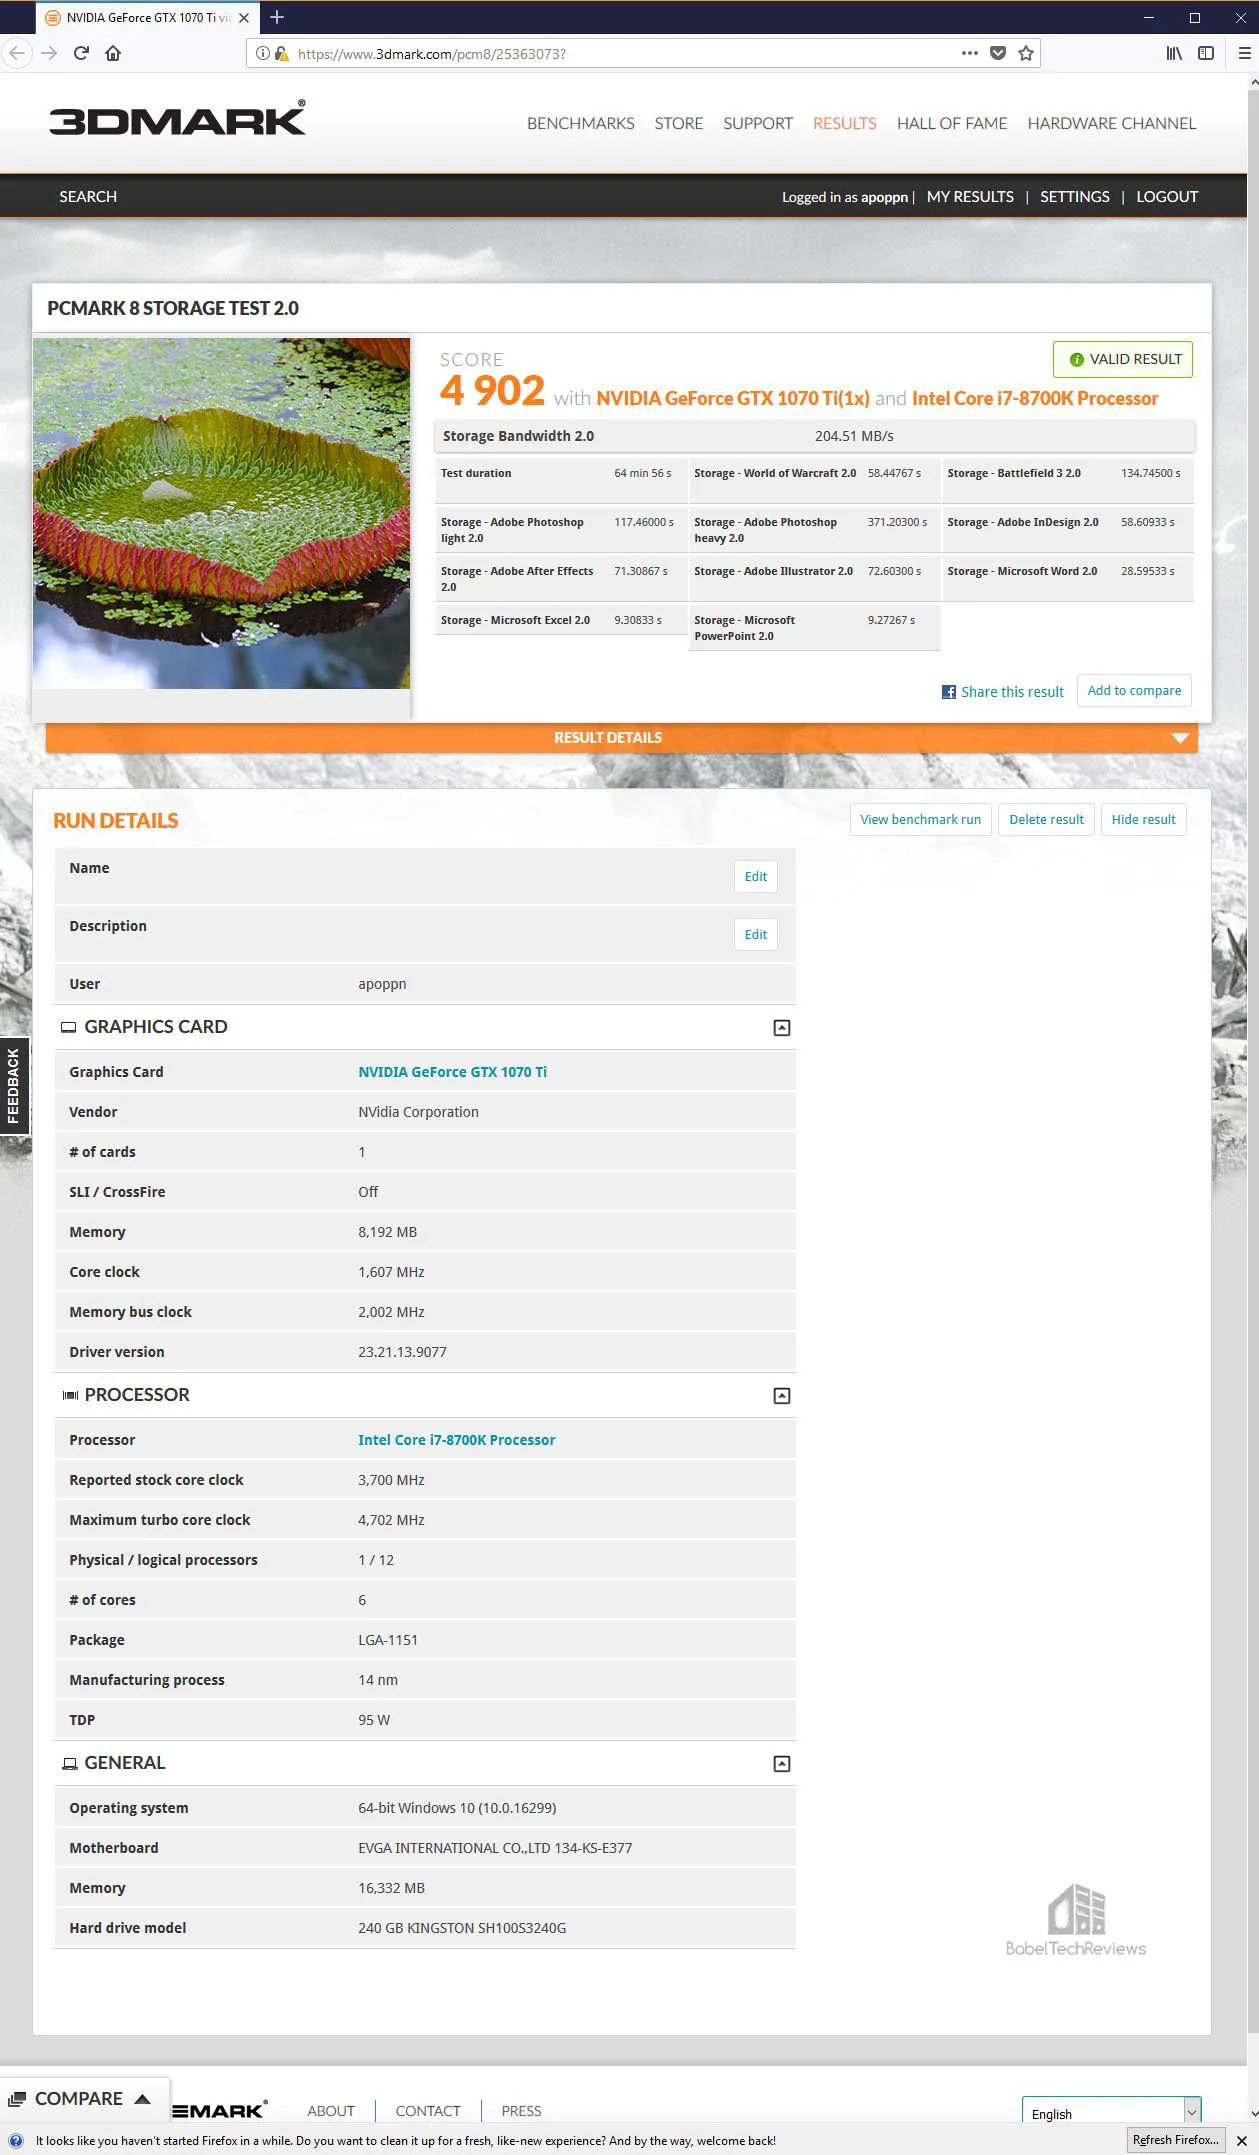
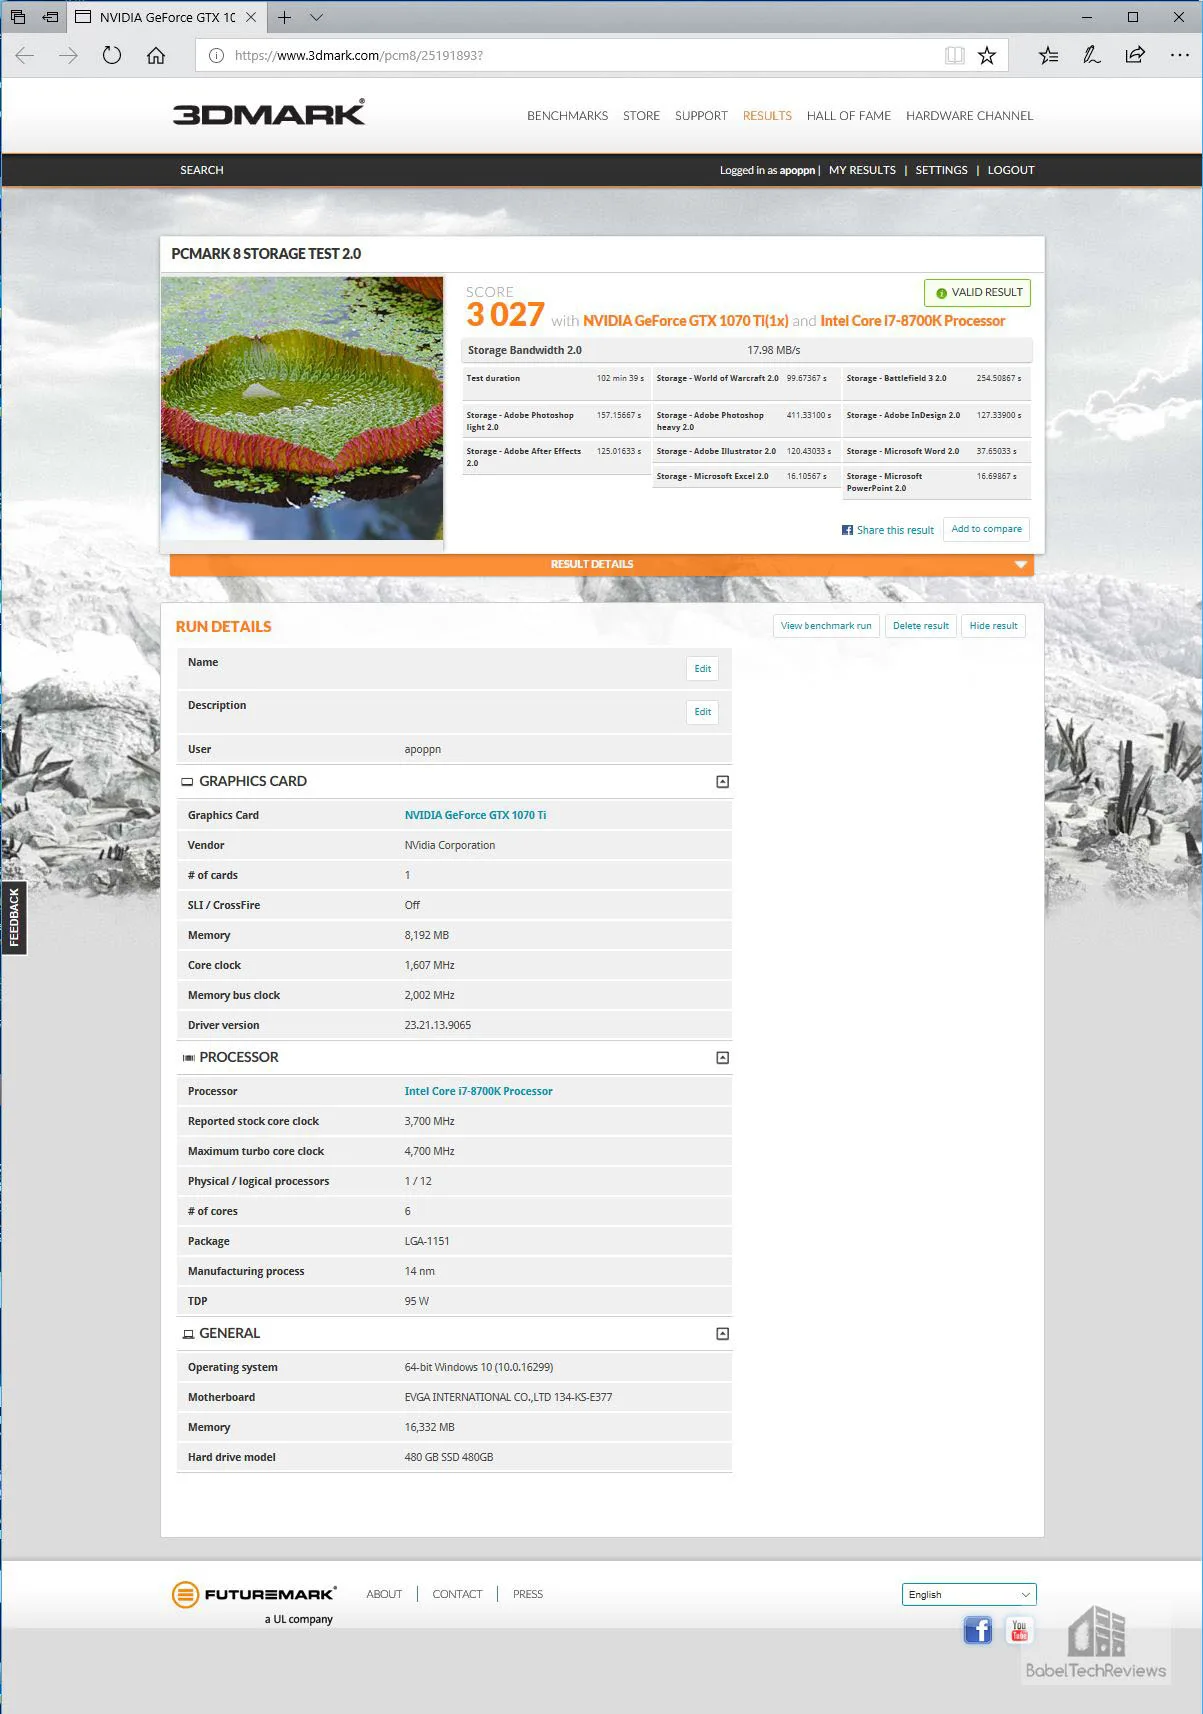
Here are the 2 TB SSHD storage test results scoring 3027 and 17.98 MB/s bandwidth.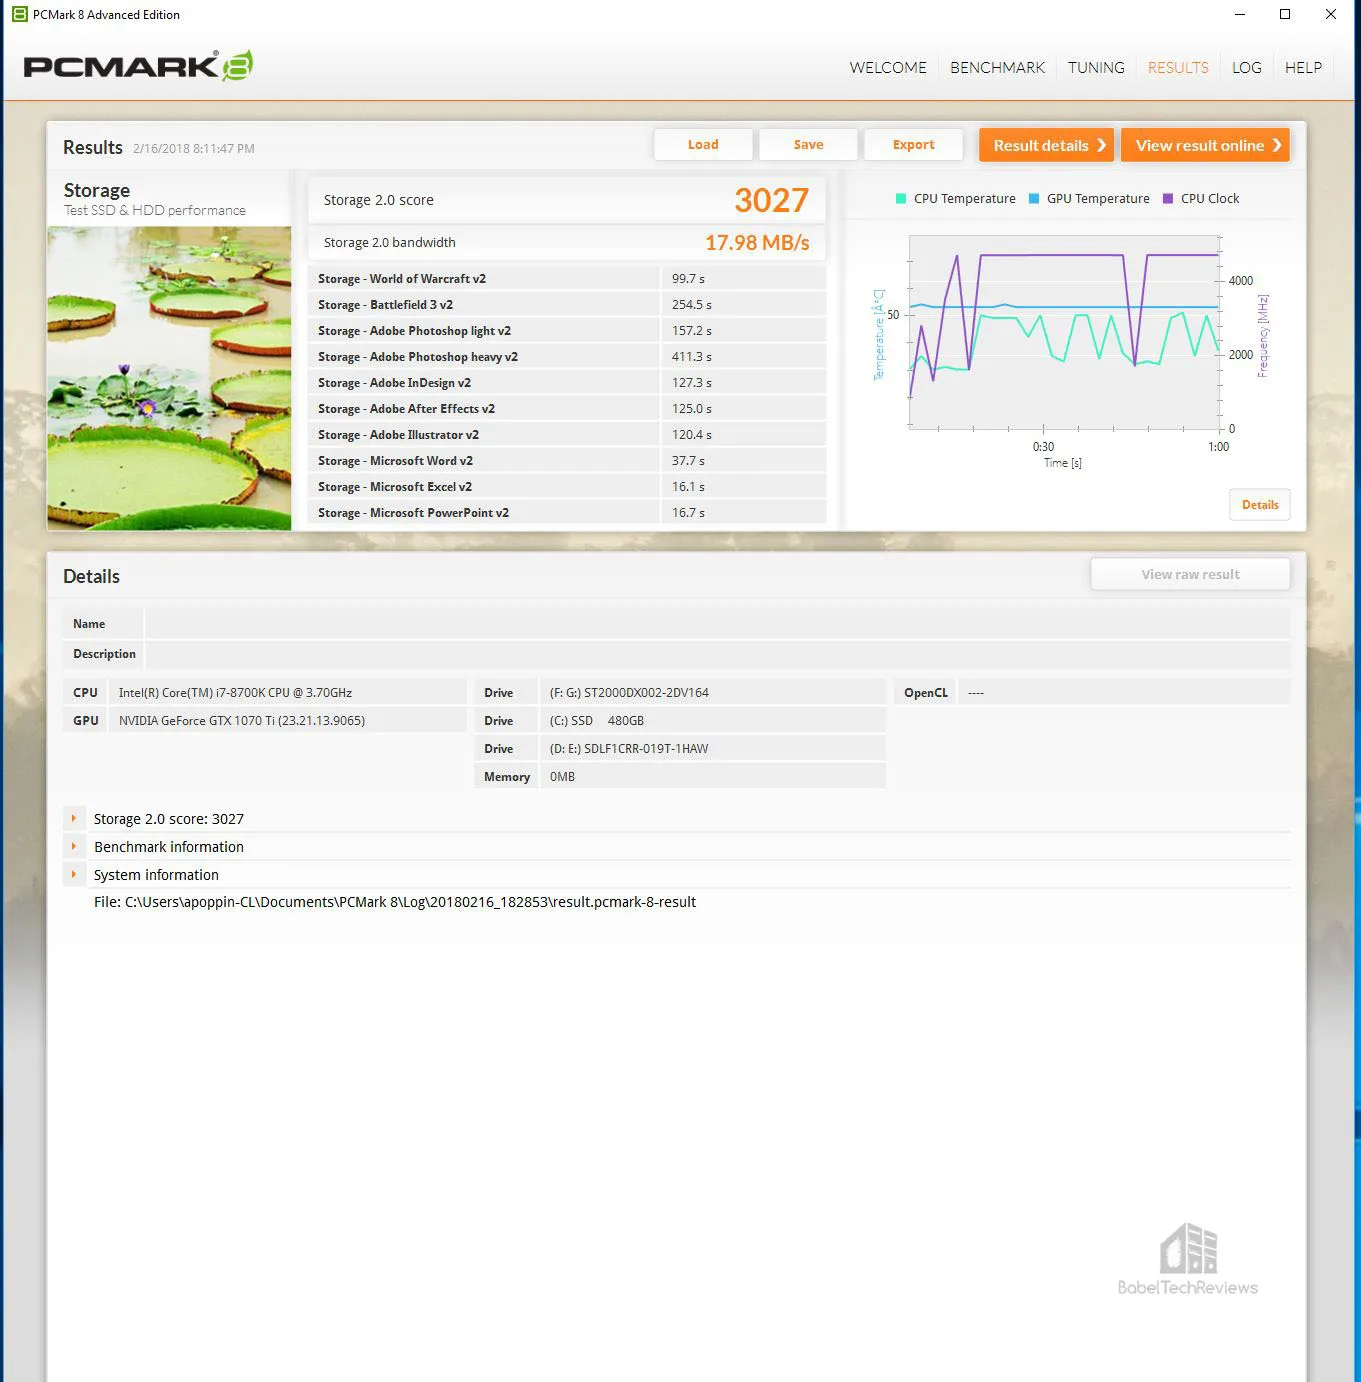
Here are the 2TB FireCuda SSHD online storage test results summarized, and most importantly for a gamer, it took 99.7 seconds to load World of Warcraft and 254.5 seconds for Battlefield 3 to load.
Here is the PCMark 8 chart showing the relative scores and bandwidth for the storage test summarized and compared across 7 drives.  The Kingston A1000 480 GB NVMe drive leads in overall score and with much higher bandwidth then any other drive.
Here is the PCMark 8 comparative loading times chart for World of Warcraft and for Battlefield 3 which is also included in the main Game/Level Loading chart. Again the Kingston A1000 is the fastest drive for loading these two games.

It’s clear that for loading games and apps, the SSD is significantly faster than any HDD or SSHD. A SSHD only takes advantage of repeated loading of levels or games and after 2 or 3 loads, it will set up more quickly, approaching SSD speeds.
SiSoft Sandra 2017 (SP4)
Before we get to gaming, we want to see exactly where drive performance results differ, and there is no better tool than SiSoft’s Sandra 2017. SiSoftware Sandra (the System ANalyser, Diagnostic and Reporting Assistant) is an complete information & diagnostic utility in one complete package. It is able to provide all the information about your hardware, software and other devices for diagnosis and for benchmarking. In addition, Sandra is derived from a Greek name that implies “defender” or “helper” – a PC Wonder Woman.
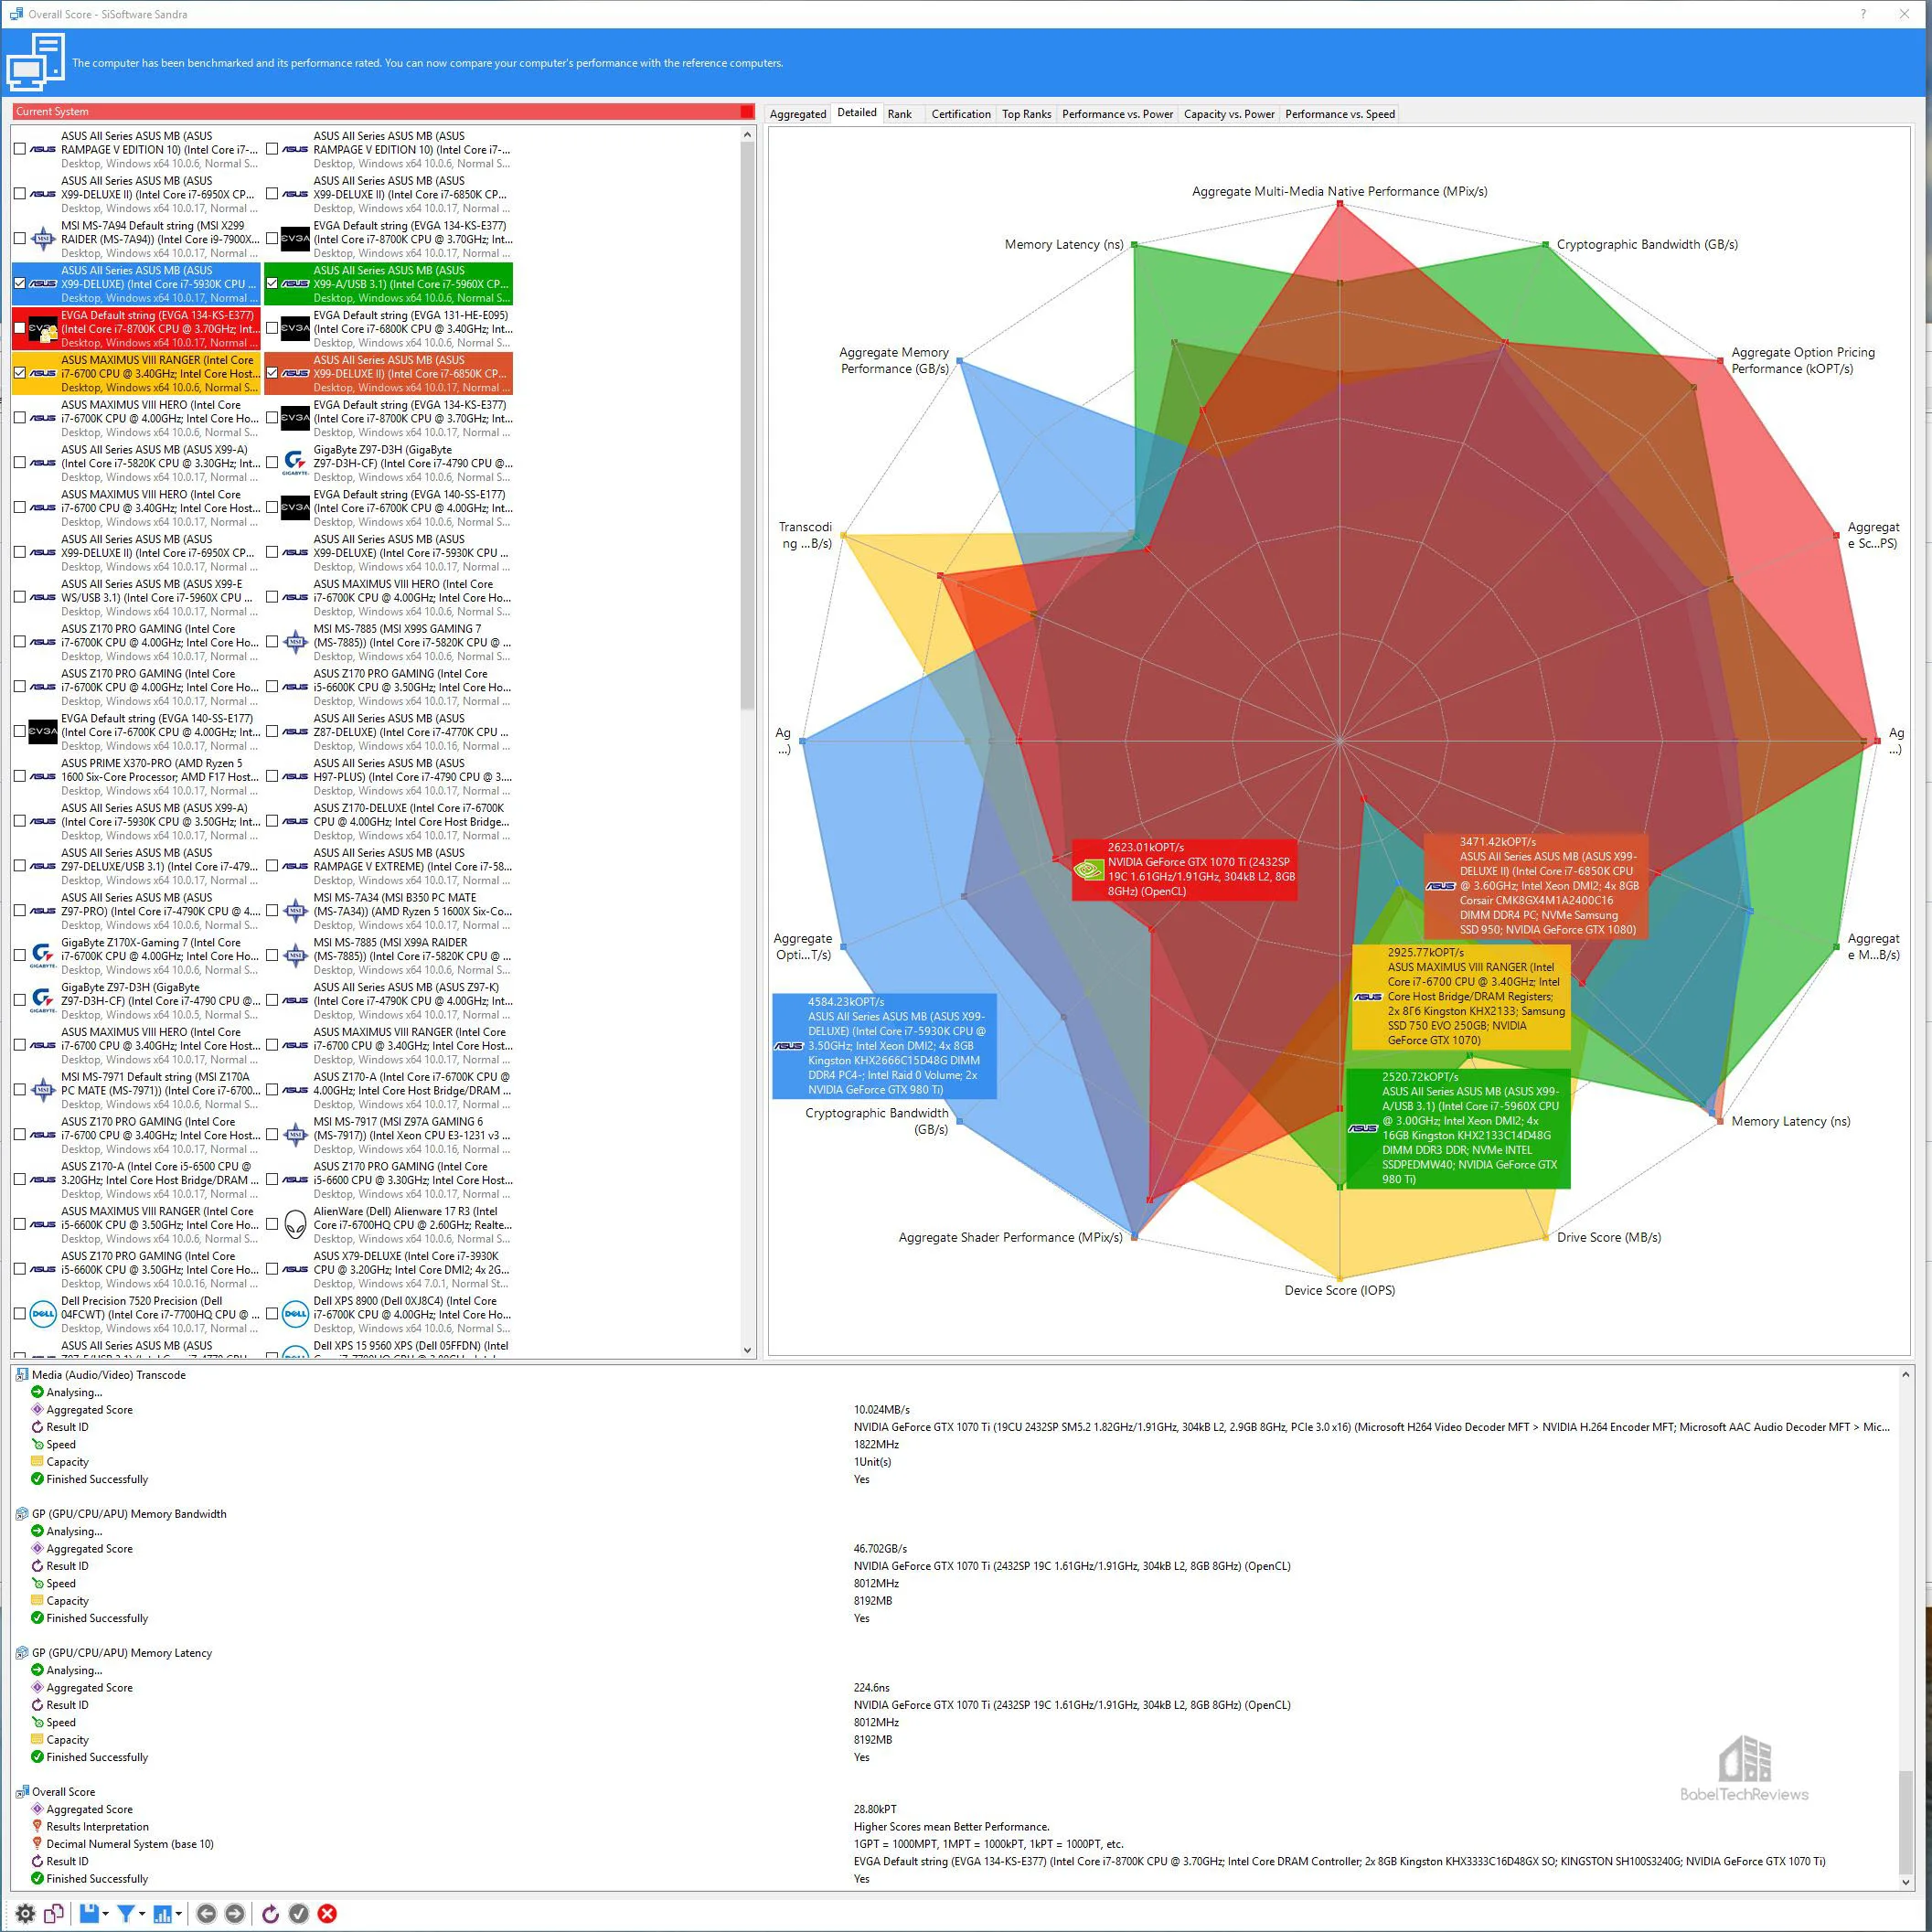
There are several versions of Sandra 2017, including a free version of Sandra Lite that anyone can download and use. It is highly recommended! SiSoft’s Sandra 2017 SP4 is the very latest version, and we are using the full engineer suite courtesy of SiSoft, with quite a few improvements over earlier versions of Sandra. It will benchmark and analyze all of the important PC subsystems and even rank your PC and make recommendations for improvements.Here are the 3 Sandra disk benchmarking tests. Here is the chart summarizing the results of our seven drives
The Kingston A1000 480 GB NVMe SSD overall performance is solidly faster than any other SSD or SSHD.
AIDA64 v5.97
AIDA64 is the successor to Everest and it is an important industry tool for benchmarkers. AIDA64’s benchmark code methods are written in Assembly language, and they are extremely optimized for every popular AMD, Intel and VIA processor core variants by utilizing the appropriate instruction set extensions. We use the Engineer’s version of AIDA64 courtesy of FinalWire. AIDA64 is free to to try and use for 30 days.
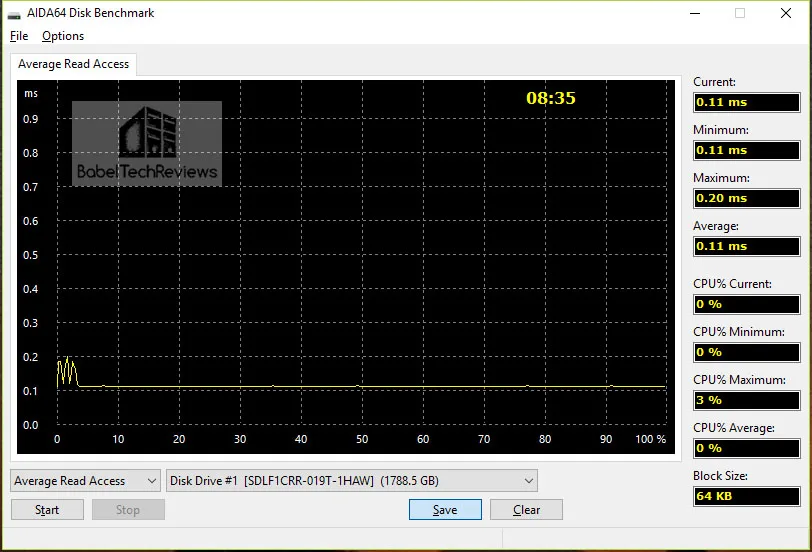
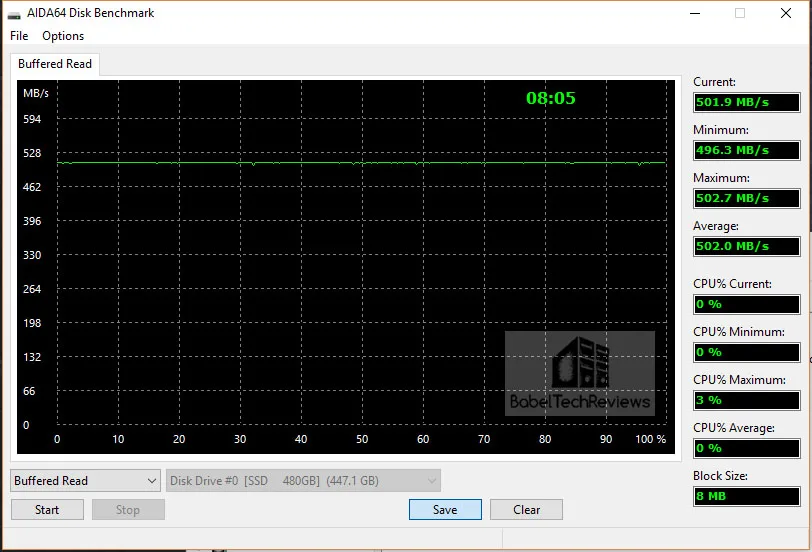
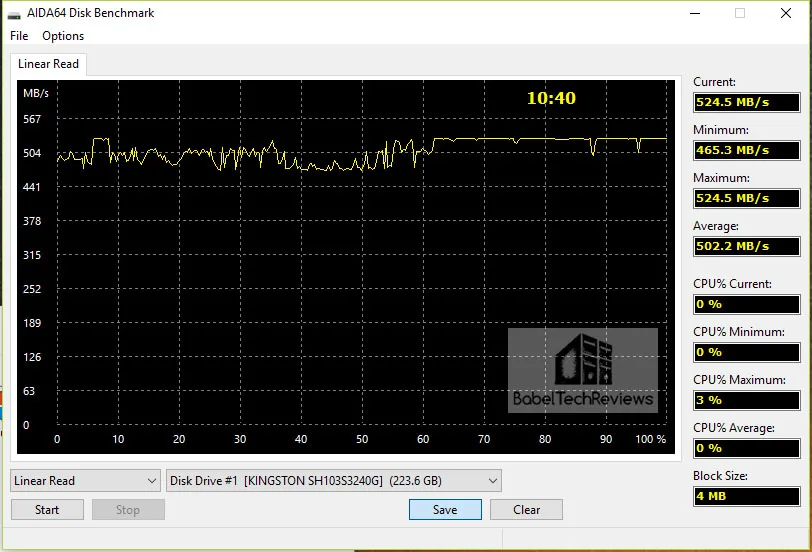
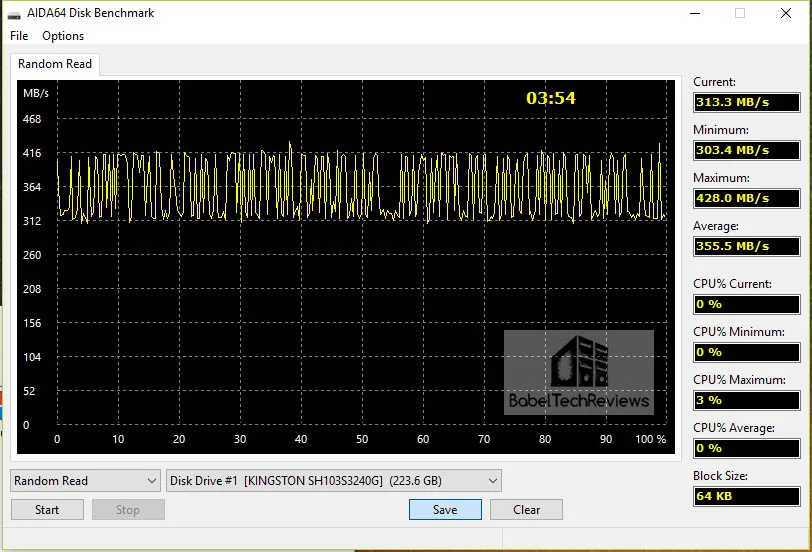
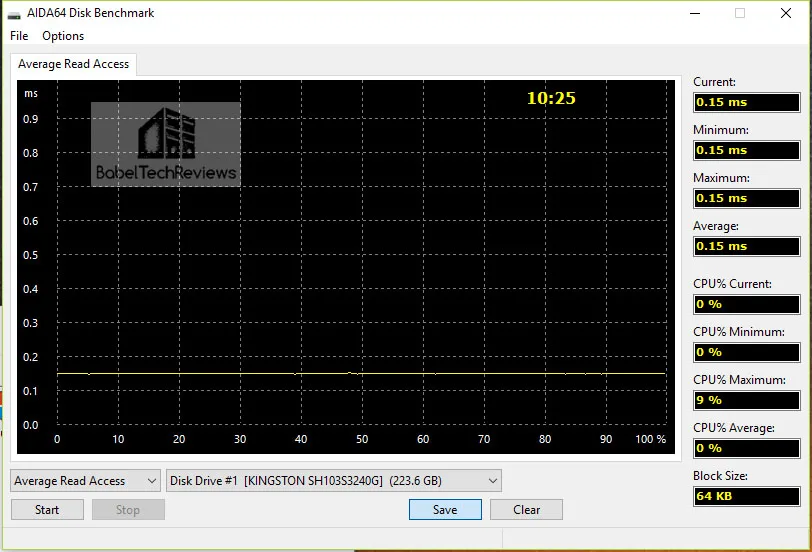
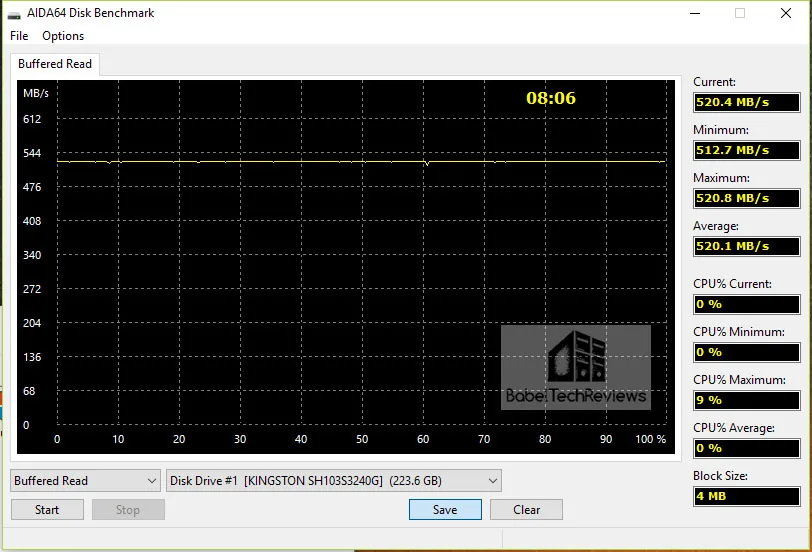
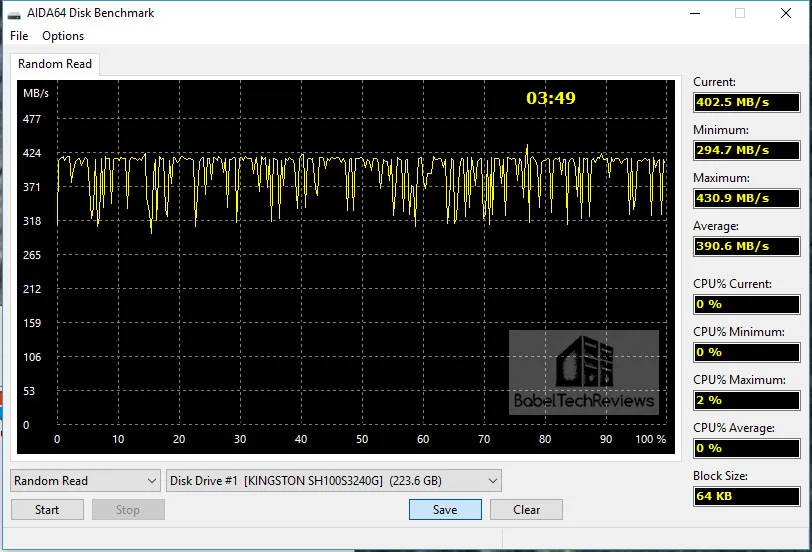
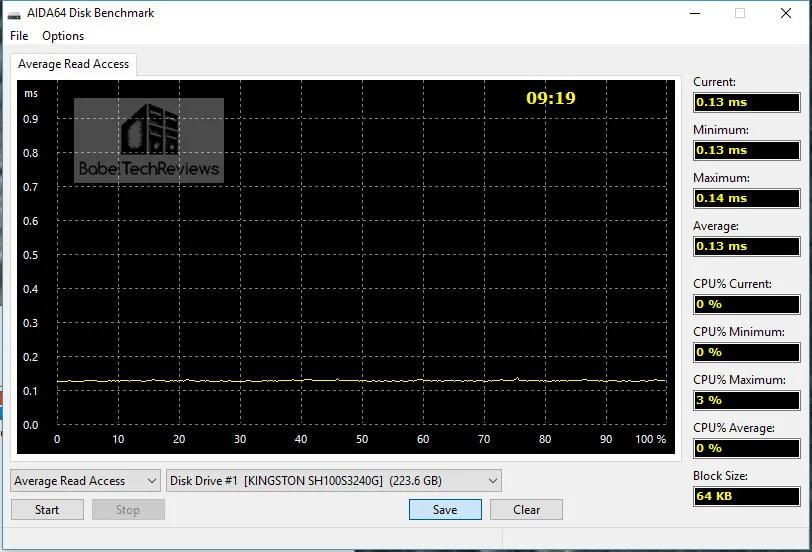
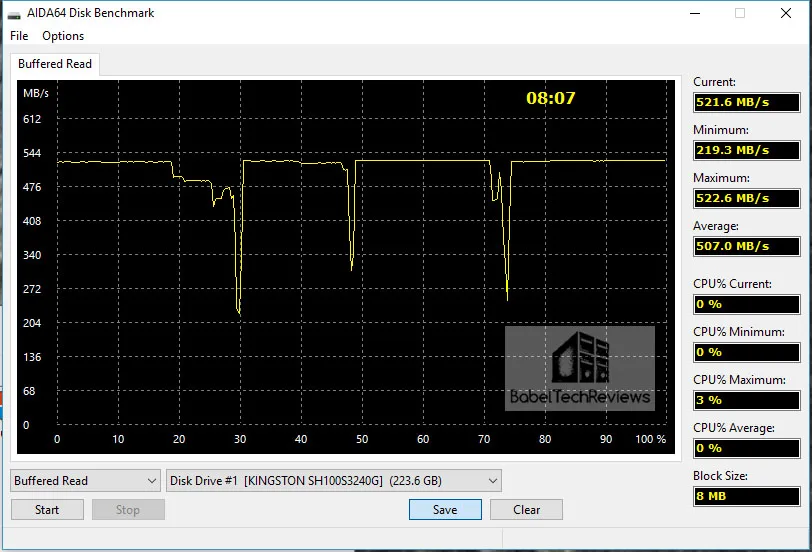
We run the AIDA64 Disk Benchmark and the 4 individual READ tests for each drive, and we include the image for each test and summarize them in a chart. These tests are incredibly detailed and there are a lot of customization options available so we run the default tests. However, we did not run the Read tests as they destroy all of the data on the disks being tested and some of them can really wear the SSD.
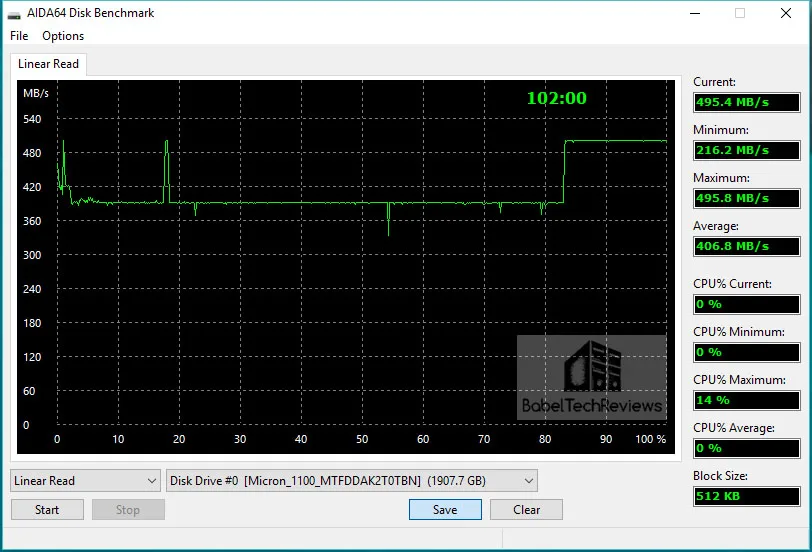
- The Linear Read test measure the sequential performance by reading or writing all sectors without skipping any. It’s a linear view of the drives overall performance from its beginning to end.
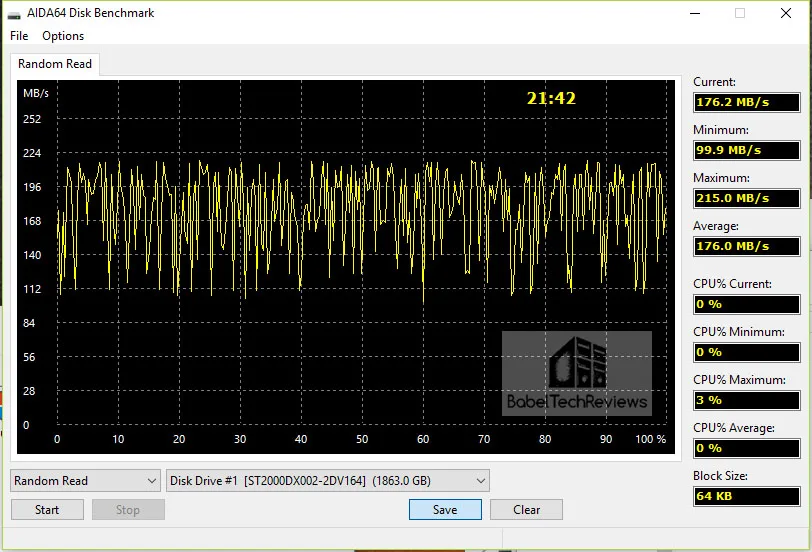
- The Random Read test measures the random performance by reading variable-sized data blocks at random locations on the surface of the drive and they are combination of both speed and access times as its position changes before each new operation.
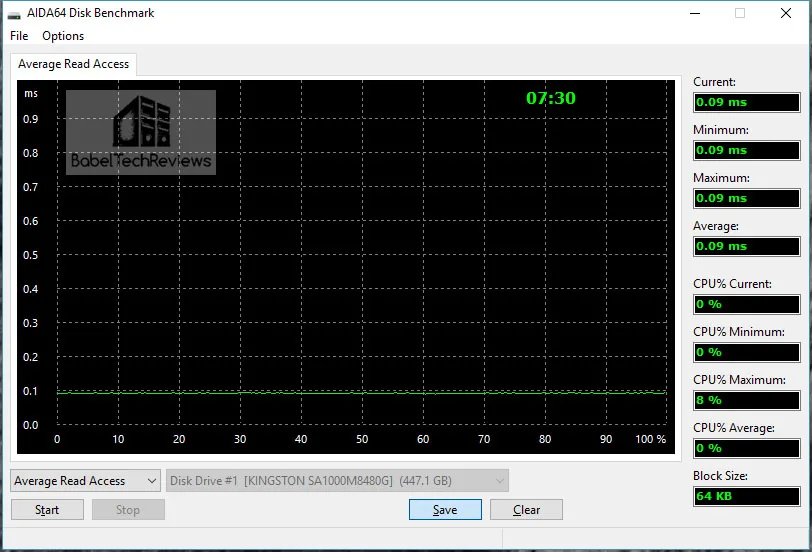
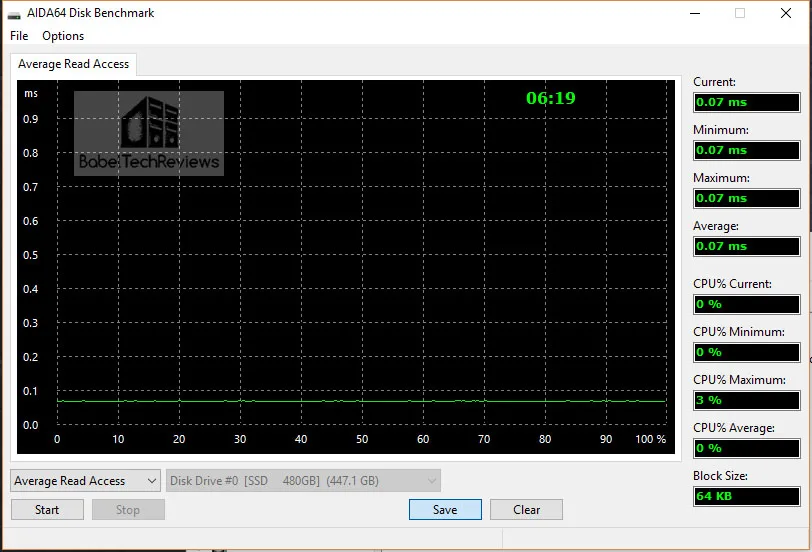
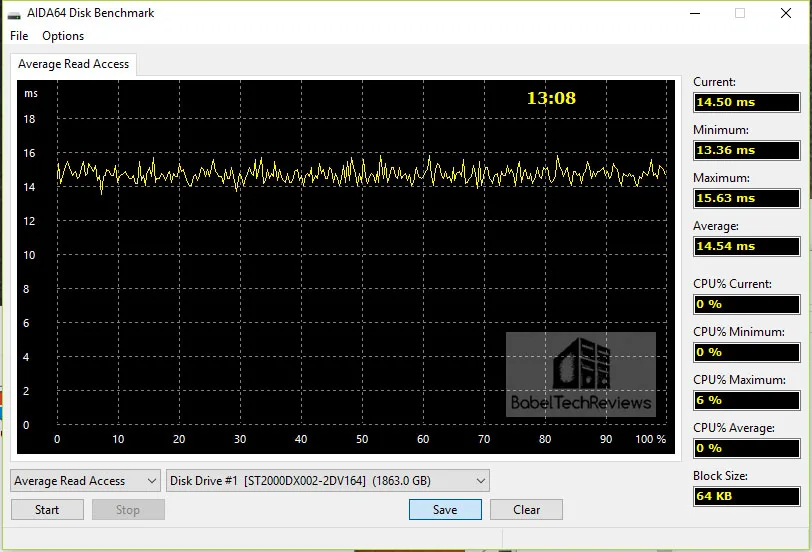
- The Access time tests are designed to measure the data access performance by reading 0.5 KB data blocks at random drive locations.
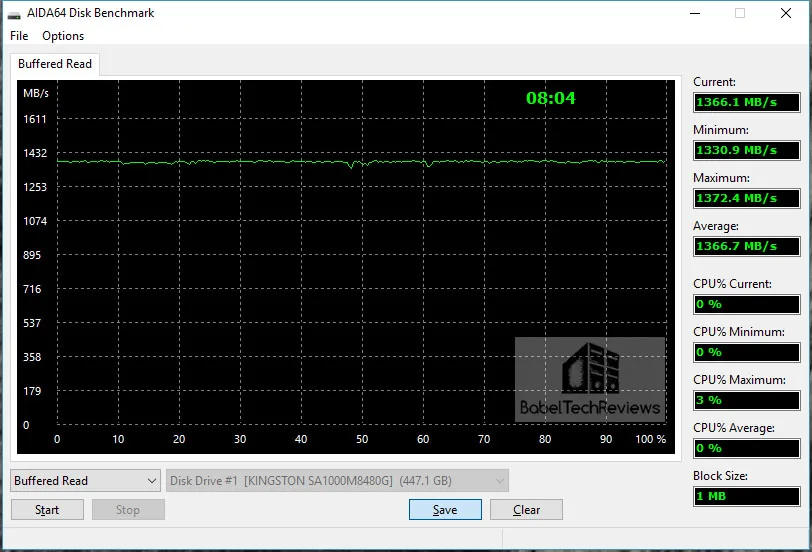
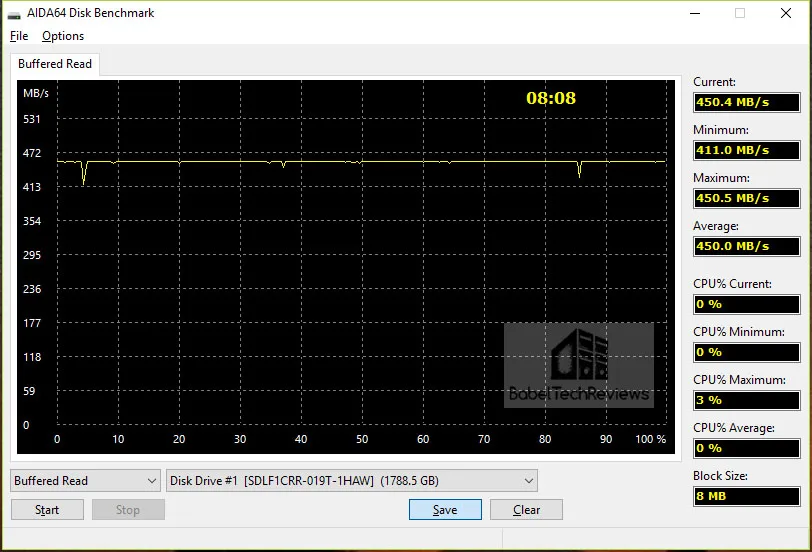
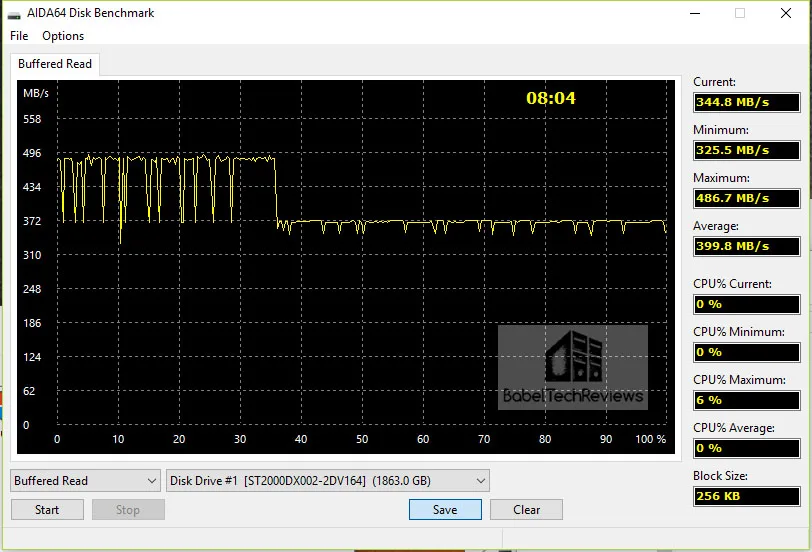
- The Buffered Read test will measure the caching of the drive.
Here is the Kingston A1000 480 GB SSD disk benchmark followed by the 4 images of AIDA64’s individualized Read tests.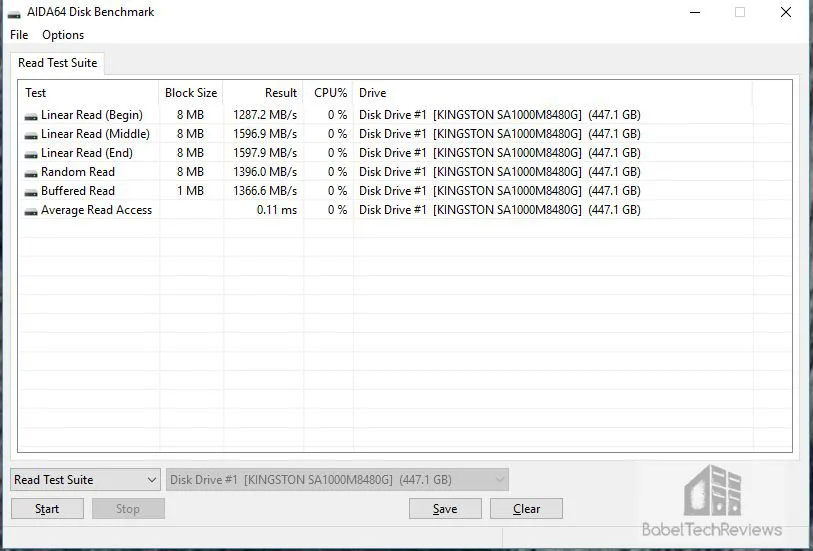
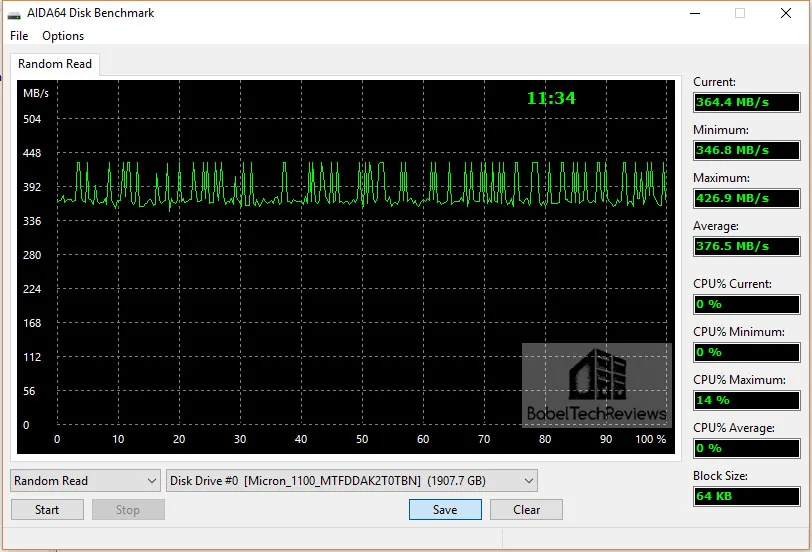
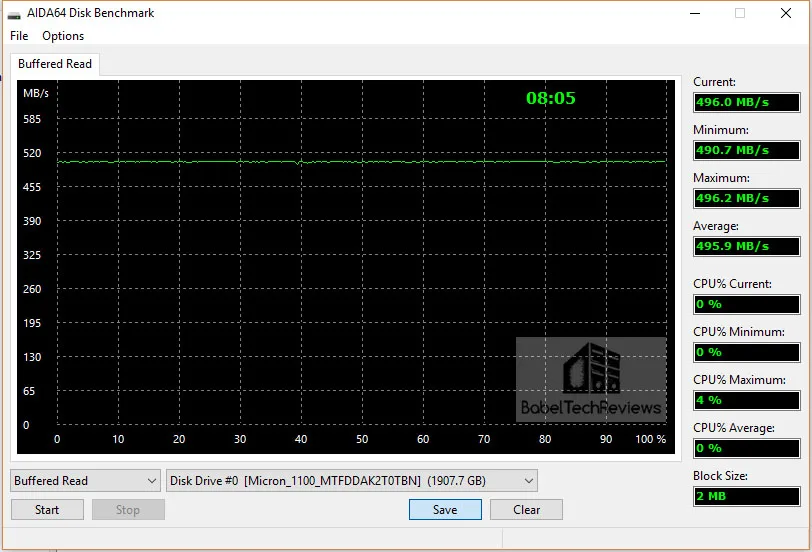
Here are the Micron 1100 2 TB GB SSD‘s 4 images of AIDA64’s individualized Read tests.

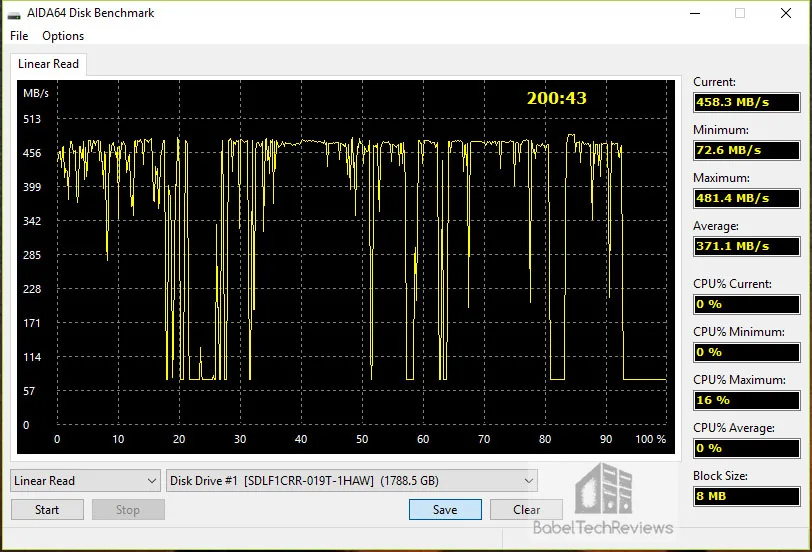
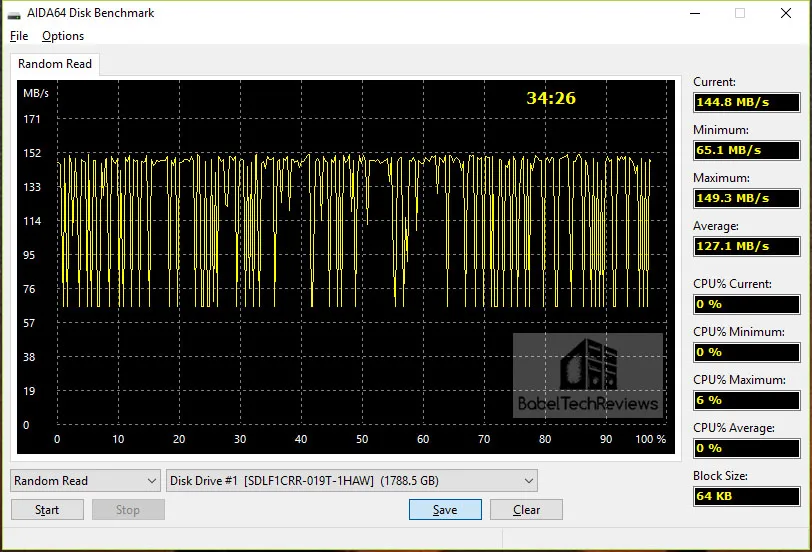
The SanDisk 1.92 GB SSD four images of AIDA64’s individualized Read tests follow.
 The Team Group 480 GB SSD four images of AIDA64’s individualized Read tests follow.
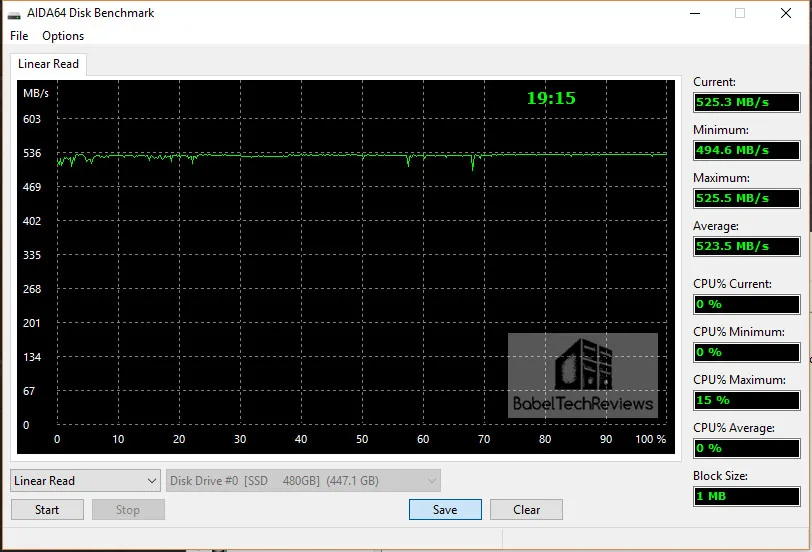

 The HyperX Brown SSD four images of AIDA64’s individualized Read tests follow.
 The HyperX Blue SSD’s four images of AIDA64’s individualized Read tests follow.
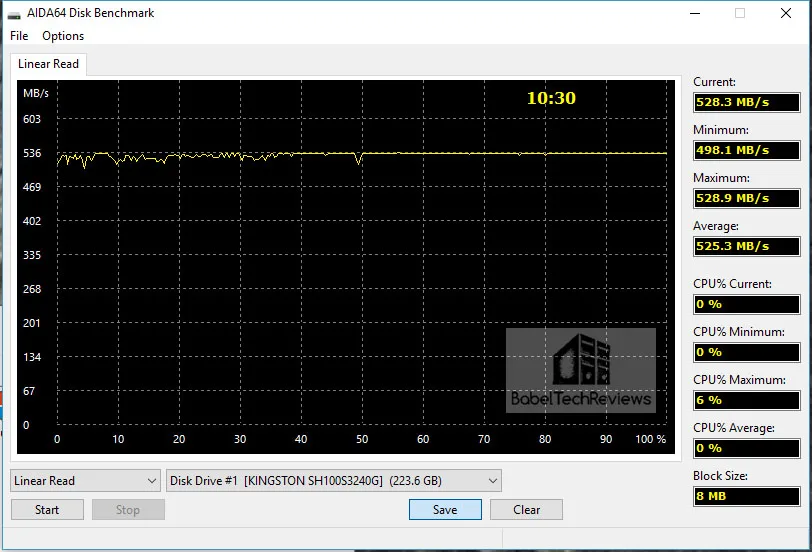
 The FireCuda 2 TB SSHD’s four images of AIDA64’s individualized Read tests follow.

 Here are the AIDA64 Disk benches summarized in a chart.
In just about every important metric, the Kingston A1000 480 GB NVMe SSD is ahead of every other drive tested.
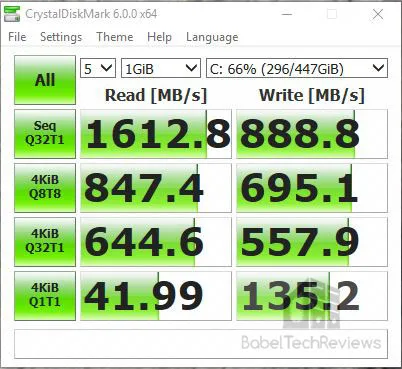
Crystal Disk Mark
CrystalDiskMark is a HDD benchmark utility for your hard drive that enables you to measure sequential and random read/write speeds. Here are some key features of “CrystalDiskMark”:
- Measure sequential reads/writes speed
- Measure random 512KB, 4KB, 4KB (Queue Depth=32) reads/writes speed
The Kingston A1000 480 GB SSD easily exceeds it’s rated specifications.
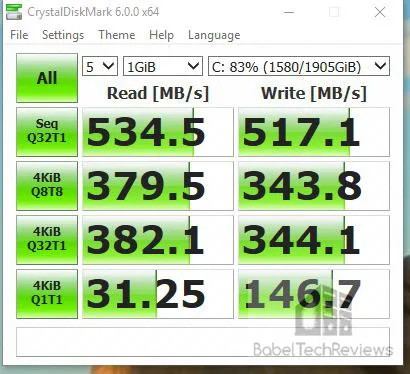
The Micron 1100 2 TB GB SSD read speeds are significantly slower.
The Team Group 480 GB SSD also exceeds its rated speeds of 470 MB/s Read and 420 MB/s Write.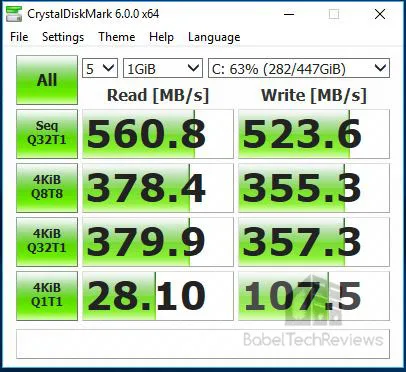
The SanDisk 1.92 GB SSD is a bit slower than the Team Group SSD.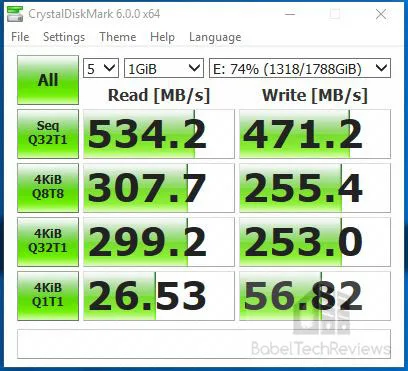
240 GB HyperX SSD Brown score high in Read speeds, but much lower in Write.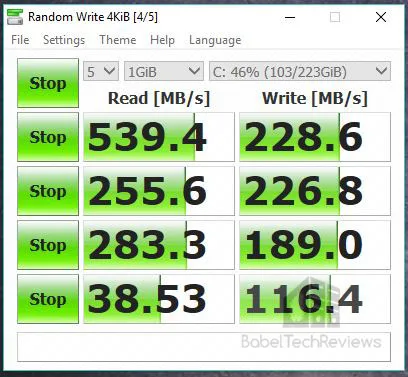
The 240 GB HyperX SSD Blue is faster than the brown, but its Write speeds are well below the newer 3D NAND SSDs.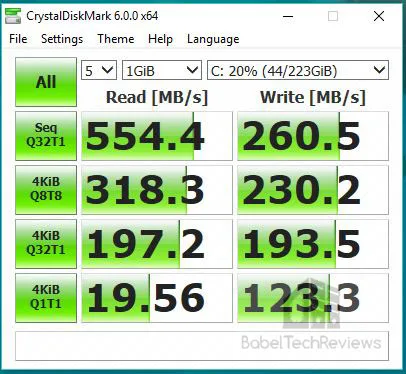
The 2 TB SSHD Reads significantly slower than any SSD although its Write speed is close to that of the older SSDs for the first test only.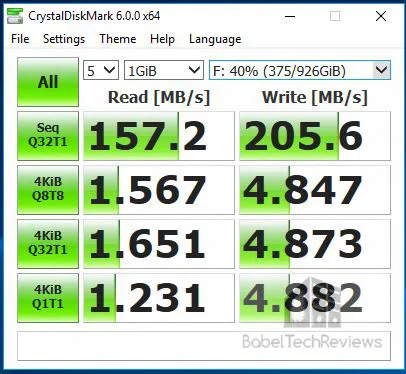
Let’s look at our next synthetic test, HD Tune. Most of these standalone synthetic tests are old and they don’t represent real world performance but they do test some important drive metrics and are still used today.
HD Tune
HD Tune is a hard disk utility which has the following functions:
- Benchmark measures the performance of:
- Transfer Rate
- Access Time
- CPU Usage
- Burst Rate
- Random Access test
- Write benchmark
- Hard Disk information which includes partition information, supported features, firmware version, serial number, disk capacity, buffer size, transfer mode
- Hard Disk Health
- S.M.A.R.T. Information (Self-Monitoring Analysis and Reporting Technology)
- Power On Time
- Error scan
- Temperature display
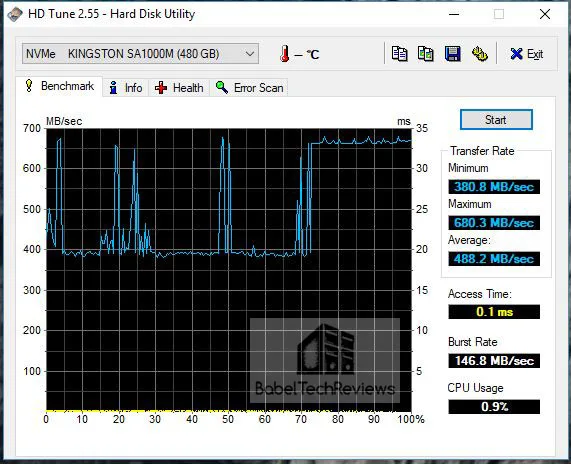
The Kingston A1000 480 GB SSD averages 488.2 MB/sec.
The Micron 1100 2 TB GB SSD averages 367.8 MB/sec.

The Team Group 480 GB averages 372.5 MB/s Transfer Rate: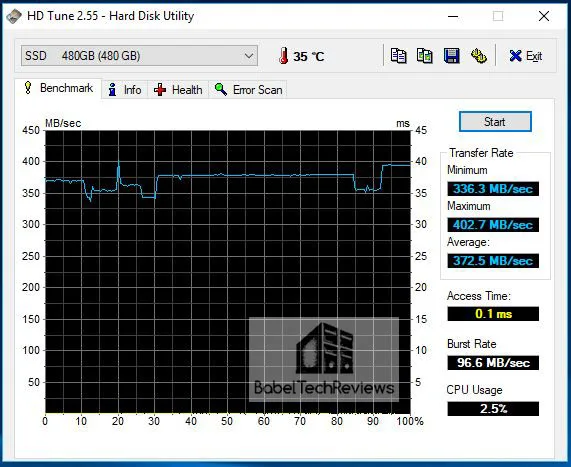
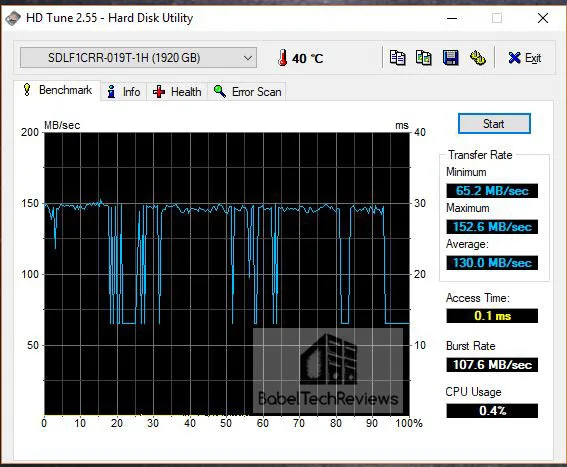
The 1.92 GB SanDisk SSD shows a much lower Transfer Rate of 130 MB/sec average on this old test that clearly does not represent its performance.
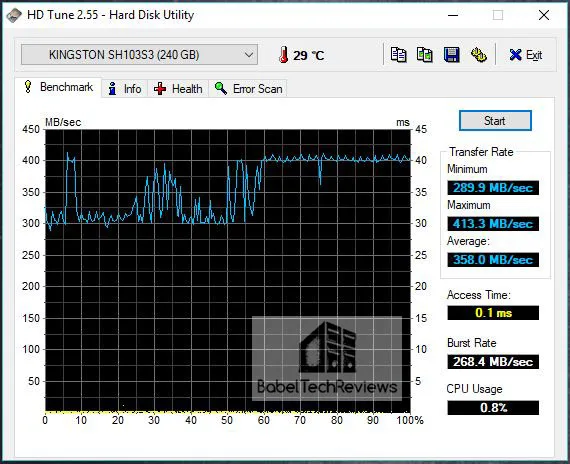
 The 240 GB HyperX SSD (brown) averages 358.0 MB/sec Transfer Rate.
The 240 GB HyperX SSD Blue comes out slower than the brown with a 313.0 MB/sec average Transfer Rate even though it is a faster SSD
The 2 TB SSHD does pretty well with a 173.7 MB/sec Transfer Rate, and from this test, one would think it is faster than the 1.92 TB SSD. It is not.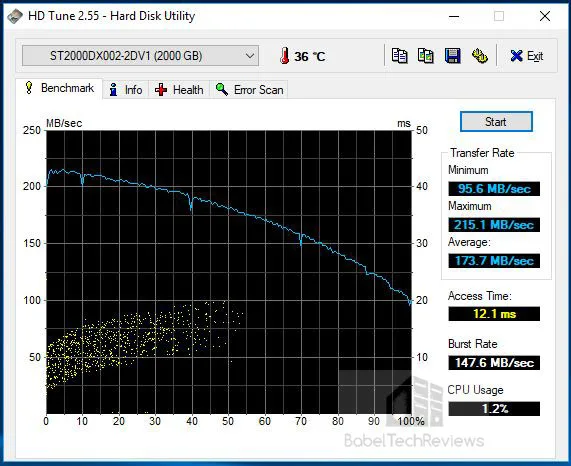
This test is ancient, and we would recommend using the latest version of HD Tune (which is not for any commercial use) which shows rather different results for the SanDisk SSD. Here is the summary chart.
The Kingston A1000 NVMe SSD again leads all of our tested drives. Next we benchmark using AS SSD.
AS SSD
AS SSD is especially designed for Solid State Drives (SSD). This tool contains synthetic and practice tests. The synthetic tests determine the sequential and random read and write performance of the SSD without use of the operating system caches. In Seq-test the program measures how long it takes to read and write a 1 GB file.
In the 4K test, read and write performance for random 4K blocks are determined. The 4K-64-thrd test are similar to the 4K procedure except that the read and write operations on 64 threads are distributed as in the usual start of a program. In the copying test, two large ISO file folders are created, programs with many small files, and a games folder with small and large files. These three folders are copied by the OS copy command with the cache turned on. AS SSD gives an overall “score” after it runs the benchmarks.
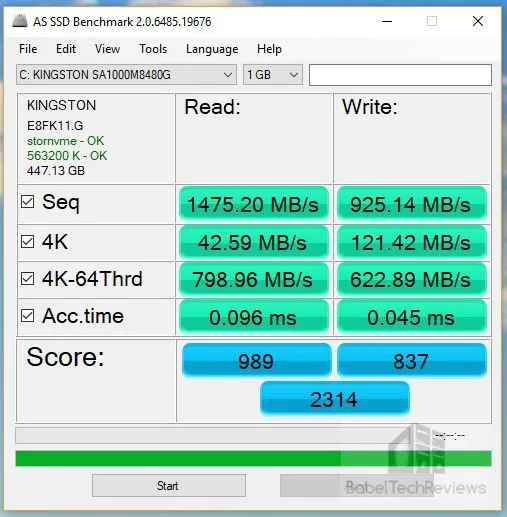
The Kingston A1000 480 GB SSD scores 2314.
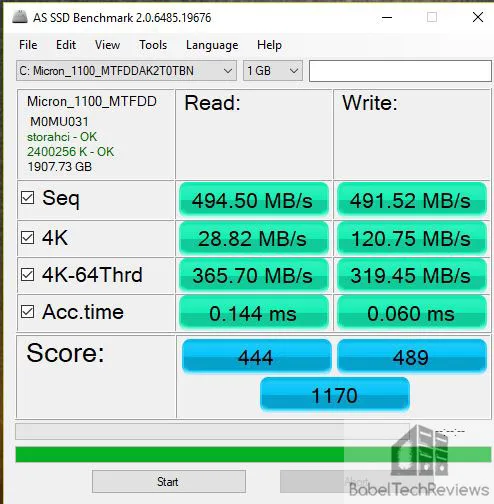
The Micron 1100 2 TB GB SSD scores 1170.
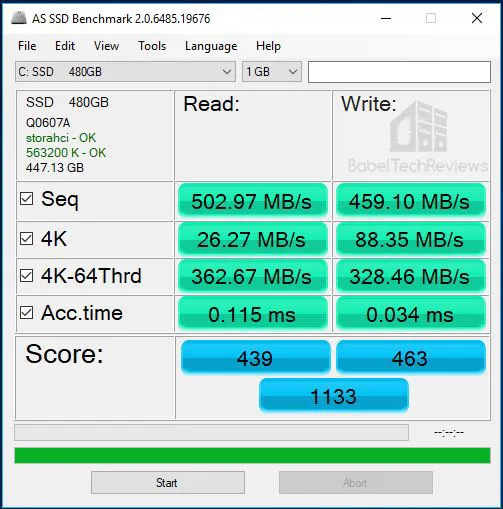
First we display the Team Group 480 GB scores 1133.
The 1.92 TB SanDisk SSD manages a score of 875.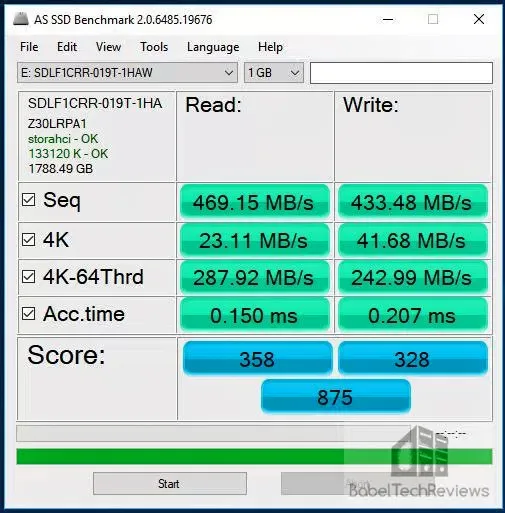
The older generation 240 GB HyperX SSD Brown manages 736.
The 240 GB HyperX SSD Blue only manages 706.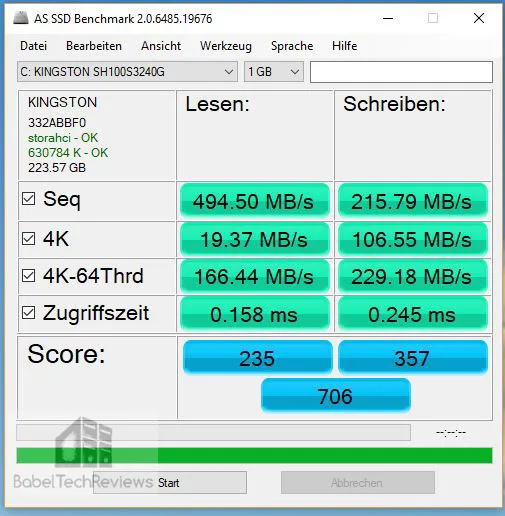
The 2TB SSHD can only score 49.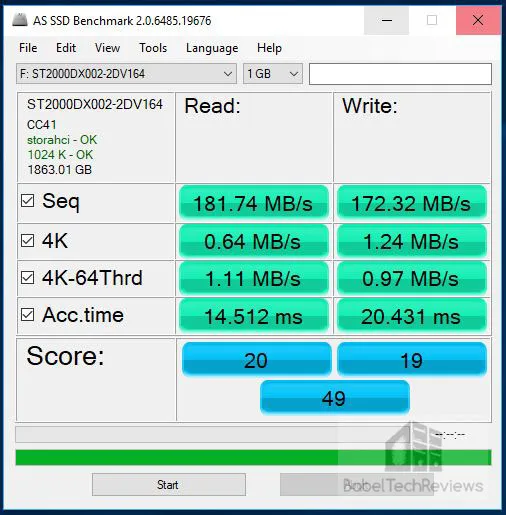
The SSHD or HDD tests appear to take forever with AS SSD and they score very low compared to any SSD. The older HyperX SSDs score lower in the Write tests than do the newer SSDs. Here is the summary of the overall scores compared, and the Kingston scores more than twice higher than either the Micron 2 TB or Team Group 480 GB SSD. On to HD Tach.
HD Tach
HD Tach is a low level hardware benchmark for random access read/write storage devices including for SSDs and HDDs. HD Tach uses custom device drivers and low level Windows interfaces to determine the physical performance of the device. It is no longer supported and needs to be run in compatibility mode for Windows 7.
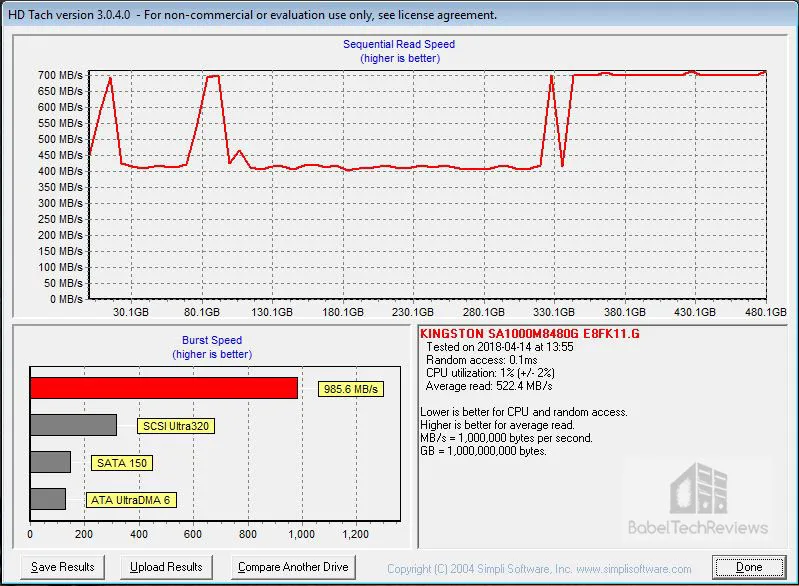
The Kingston A1000 480 GB SSD averages 522.4 MB/sec.
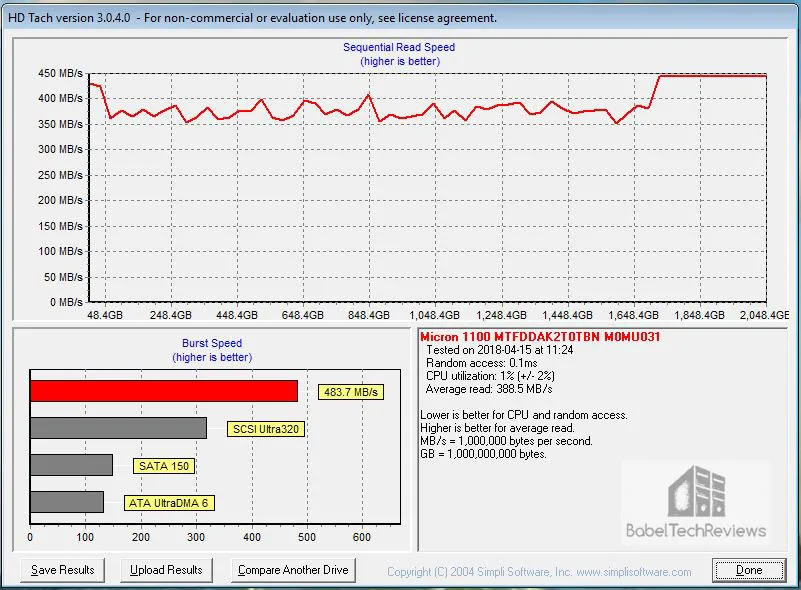
The Micron 1100 2 TB GB SSD scores 388.5 MB/sec.
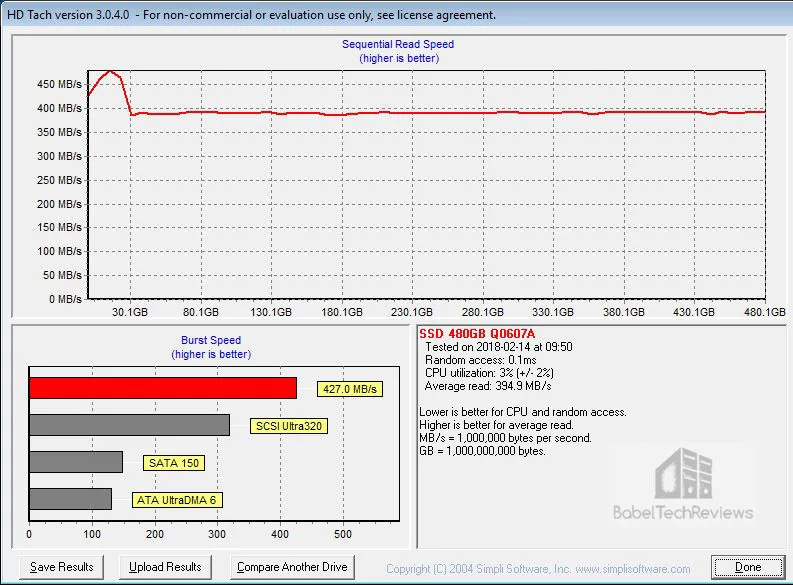
The Team Group 480 TB SSD averages 394.9 MB/s Read.
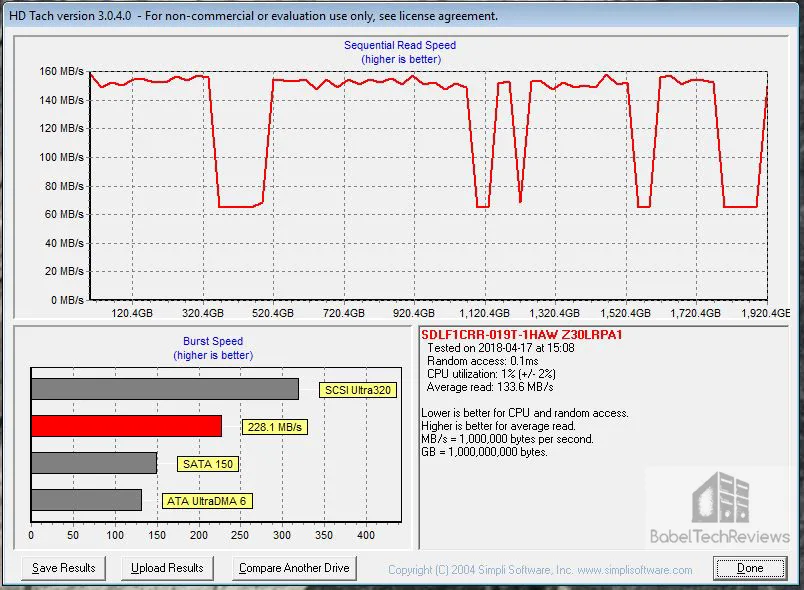
The 1.92 GB SanDisk SSD averages 133.6 MB/s Read which is extraordinarily low and must be accounted for by the extreme age of the test.
The 240 GB HyperX SSD Brown gets 372.3 MB/Sec Read.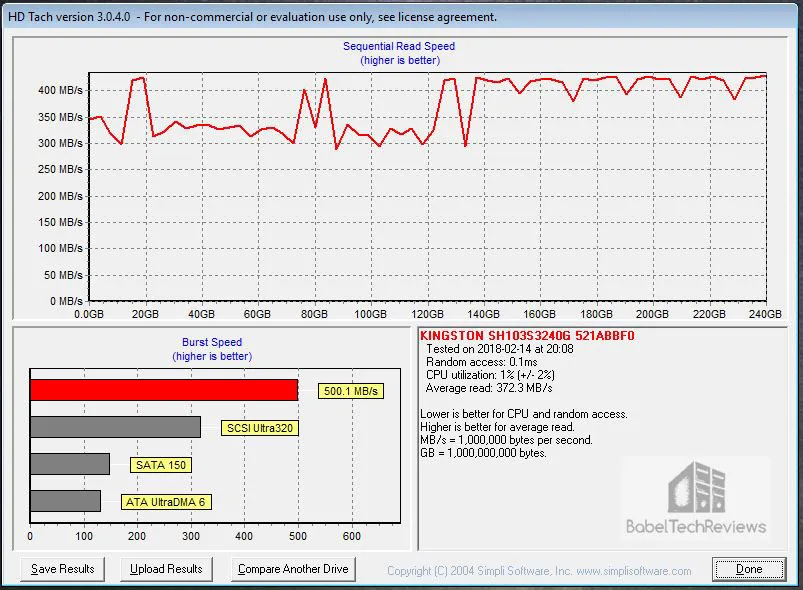
The 240 GB HyperX SSD Blue scores 344.9 MB/sec.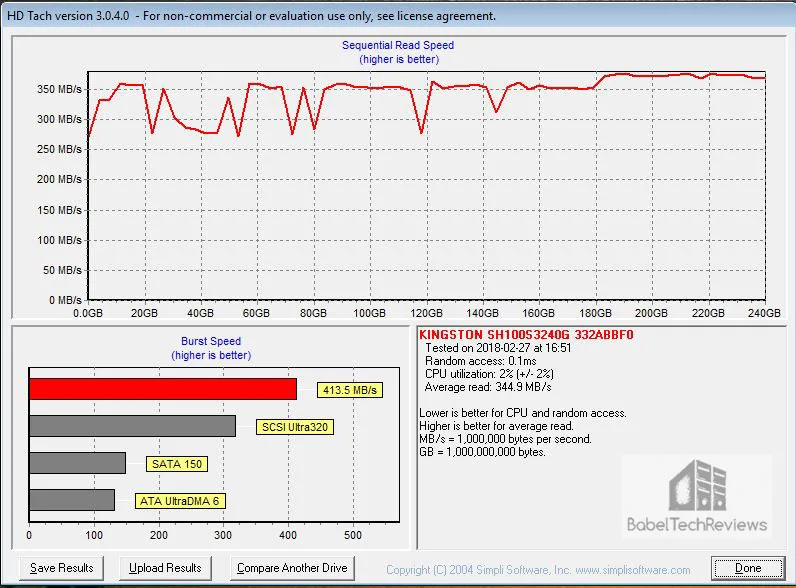
The 2 TB SSHD manages 181.7 MB/second Read.
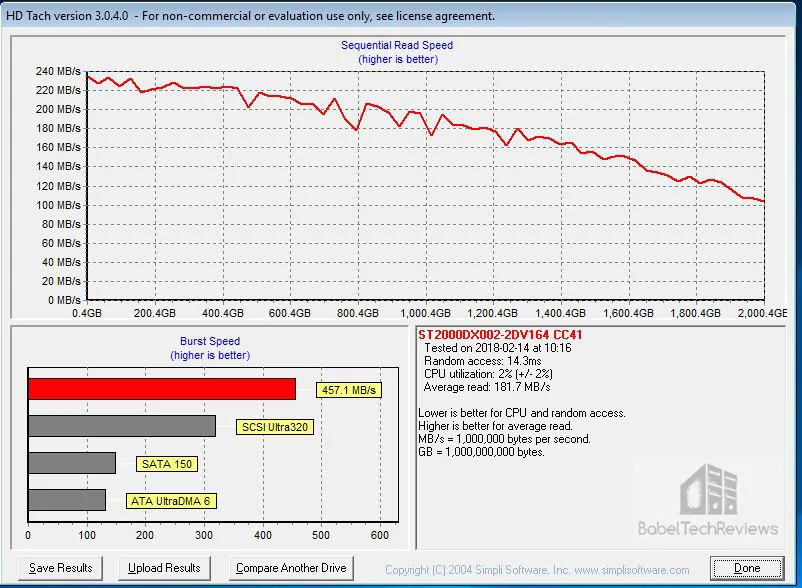
Here is the summary of HD Tach with again shows the Kingston A1000 NVMe SSD way ahead of the other SATA III SSDs to say nothing of the SSHD which trails in every test. Enough of the synthetics! Let’s look at game and game level loading times.
The Game/Level Loading Time Results
Unfortunately, our results are very difficult to measure precisely but it is easy to see that generally SSDs perform similarly with regard to loading times and they are miles ahead of any HDD or even SSHD which requires loading the same level or program over and over to get quicker. The 240 GB HyperX SSD that we tested game loading times on is the standard (brown) drive which sets up games and levels no slower than the Blue HyperX drive. We did not benchmark Final Fantasy XV on the 240 GB SSDs as it takes up 150 GB!
Here are game loading times – first in bold – followed by the level load time in italics. We load and time each game and then load and time each level for a total of three times, and record our times in seconds. Lower (faster) is better.
 For some games like Ashes of the Singularity, the NVMe Kingston drive sets it up three times faster than the other drives, and it is nearly ten times faster than launching the game from a solid state hard drive (SSHD) for the first time! DOOM also sets up much faster on the Kingston drive, and other games like Project CARS 2, Deus Ex: Mankind Divided, Call of Duty WW II, and Final Fantasy XV also set up seconds faster when loading game and game levels from a NVMe drive.

Playing Kingdom Come: Deliverance made us switch to a SSD which loaded levels much faster than from a SSHD. This game can serve as a poster child for using a SSD over a HDD where the player is often saving 20 seconds every time they load a level or reload a saved game. However, both the 2 TB Micron 1100 SATA III SSD and the Kingston A1000 NVMe SSD delivered almost identically quick loading times well ahead of the other SSDs.
There are a few games like Grand Theft Auto V which load slowly and almost painfully, and occasionally the SSHD beats a SSD, and a faster SSD may load more slowly than from a quicker one. Other games like Fallout 4 and Call of Duty WW II load pretty quickly from any kind of storage drive. However, generally games load significantly faster from a SSD than from a HDD and a SSHD only starts to show it’s strengths when the same game or level is reloaded several times.
Until devs start to target SSDs for game storage, or perhaps after consoles move away from hard disk drives, we will no longer see SSDs held back from achieving the game loading performance they are capable of. The question becomes, are NVMe PCIe SSD worth their price premium over SATA III drives that they command for gamers today?
It looks like our Kingston A1000 480 GB SSD is definitely our fastest overall SSD. It exceeds Kingston’s published minimum Read and Write speeds and it loads games faster than any SATA based SSD. But at $218 for the 480 GB A1000, is it worth twice the price of a SATA III 480 GB SSD? Each gamer will have to make a personal decision. Those who desire having the fastest PCs, will want a NVMe SSD for gaming. These seconds saved loading games are cumulative, and they add up over time. At the very least, we would recommend moving from a HDD to a SSHD which may make reloading games more tolerable.
Let’s head for our conclusion.
The Conclusion & Verdict
SSD technology is still improving and again it seems that pricing for 500 GB drives are dropping very close to the $100 range for a SATA III SSD. SSD technology has become much more accessible to the regular consumer again and it appears that gamers need more capacity than 120 GB to 250 GB drives as games are getting very large.
If a gamer wants to keep his currently played games on a SSD, it appears that 480 GB is becoming the new minimum size. The Kingston A1000 480 GB SSD is sufficient for most gamers, perhaps coupled with a storage drive – either SATA SSD or SSHD. It easily exceeds its specifications and it is much faster than any SATA III-based SSD. NVMe SSDs are generally faster than SATA SSDs for loading games and game levels, and all SSDs are much faster than either HDDs or SSHDs.
It is not mandatory to have a SSD if you use your PC only for gaming. Games do not perform better on a SSD as developers still target the HDD for optimizing game performance. But there is the matter of waiting. Some games take significantly longer to load from a HDD or SSHD than they do from a SSD. If a gamer wants to get right back into the game, then a SSD will definitely improve immersion and decrease frustration as it did for us with Kingdom Come: Deliverance and even with Final Fantasy XV when we moved to playing it on the NVMe Kingston A1000.

It is a matter of valuing ones time compared to the $218 one spends on Kingston’s 480 GB NVMe A1000 SSD. And the 480 GB Kingston A1000 SSD is a very good performing NVMe SSD beating our other SATA III SSDs rather soundly. The singular issue we see with Kingston’s A1000 entry-level NVMe drive is that at $218.40, it is priced within 10 percent ($244.40) of their highest performing NVMe SSD, the KC1000.
Pros
- The SSD is of a magnitude faster than the mechanical hard drive in almost every way.
- Kingston’s 480 GB A1000 SSD is much faster than any SATA-based SSD.
- NVMe does make a difference in saving time for gamers!
- 5-year warranty stand it out from the generic “SSD crowd” and Kingston’s customer support is exceptionally good.
- The NVMe SSD is tiny compared to our other SSDs, and it would be fantastic as a HDD or even SATA SSD replacement in a notebook to save power.
- A free digital copy of Acronis True Image HD is included. It’s a fifty dollar value and it is top-rated cloning software.
Cons
- Too expensive. The 480 GB A1000 is only $25 cheaper – or about 10% less expensive – than Kingston’s top NVMe drive which is significantly faster.
This has been quite an enjoyable exploration comparing our other six drives with the Kingston A1000 480 GB SSD. The performance of this drive is very good as a stand-alone NVMe SSD. It’s price may be high compared with the highest performing Kingston NVMe drive, but we expect that market pricing will even it out over time.
![]()
The Verdict: Editor’s Choice
We are giving the Kingston A1000 480 GB NVMe SSD our BTR “Editor’s Choice” Award as it is significantly faster than SATA based SSDs in every single metric that we tested, and it even saves time in loading games. It is also tiny, easily installed, and it will save power and battery life for notebook users even over SATA SSDs.
We hope that Kingston also provides an A1000 for sale without cloning SW for those who already have it or for those who prefer free cloning software alternatives like AOMEI’s Backupper and Macrium’s Reflect. At $208 the A1000 is rather pricey and only about $25 – or 10% – cheaper than Kingston’s top NVMe drive that is significantly faster.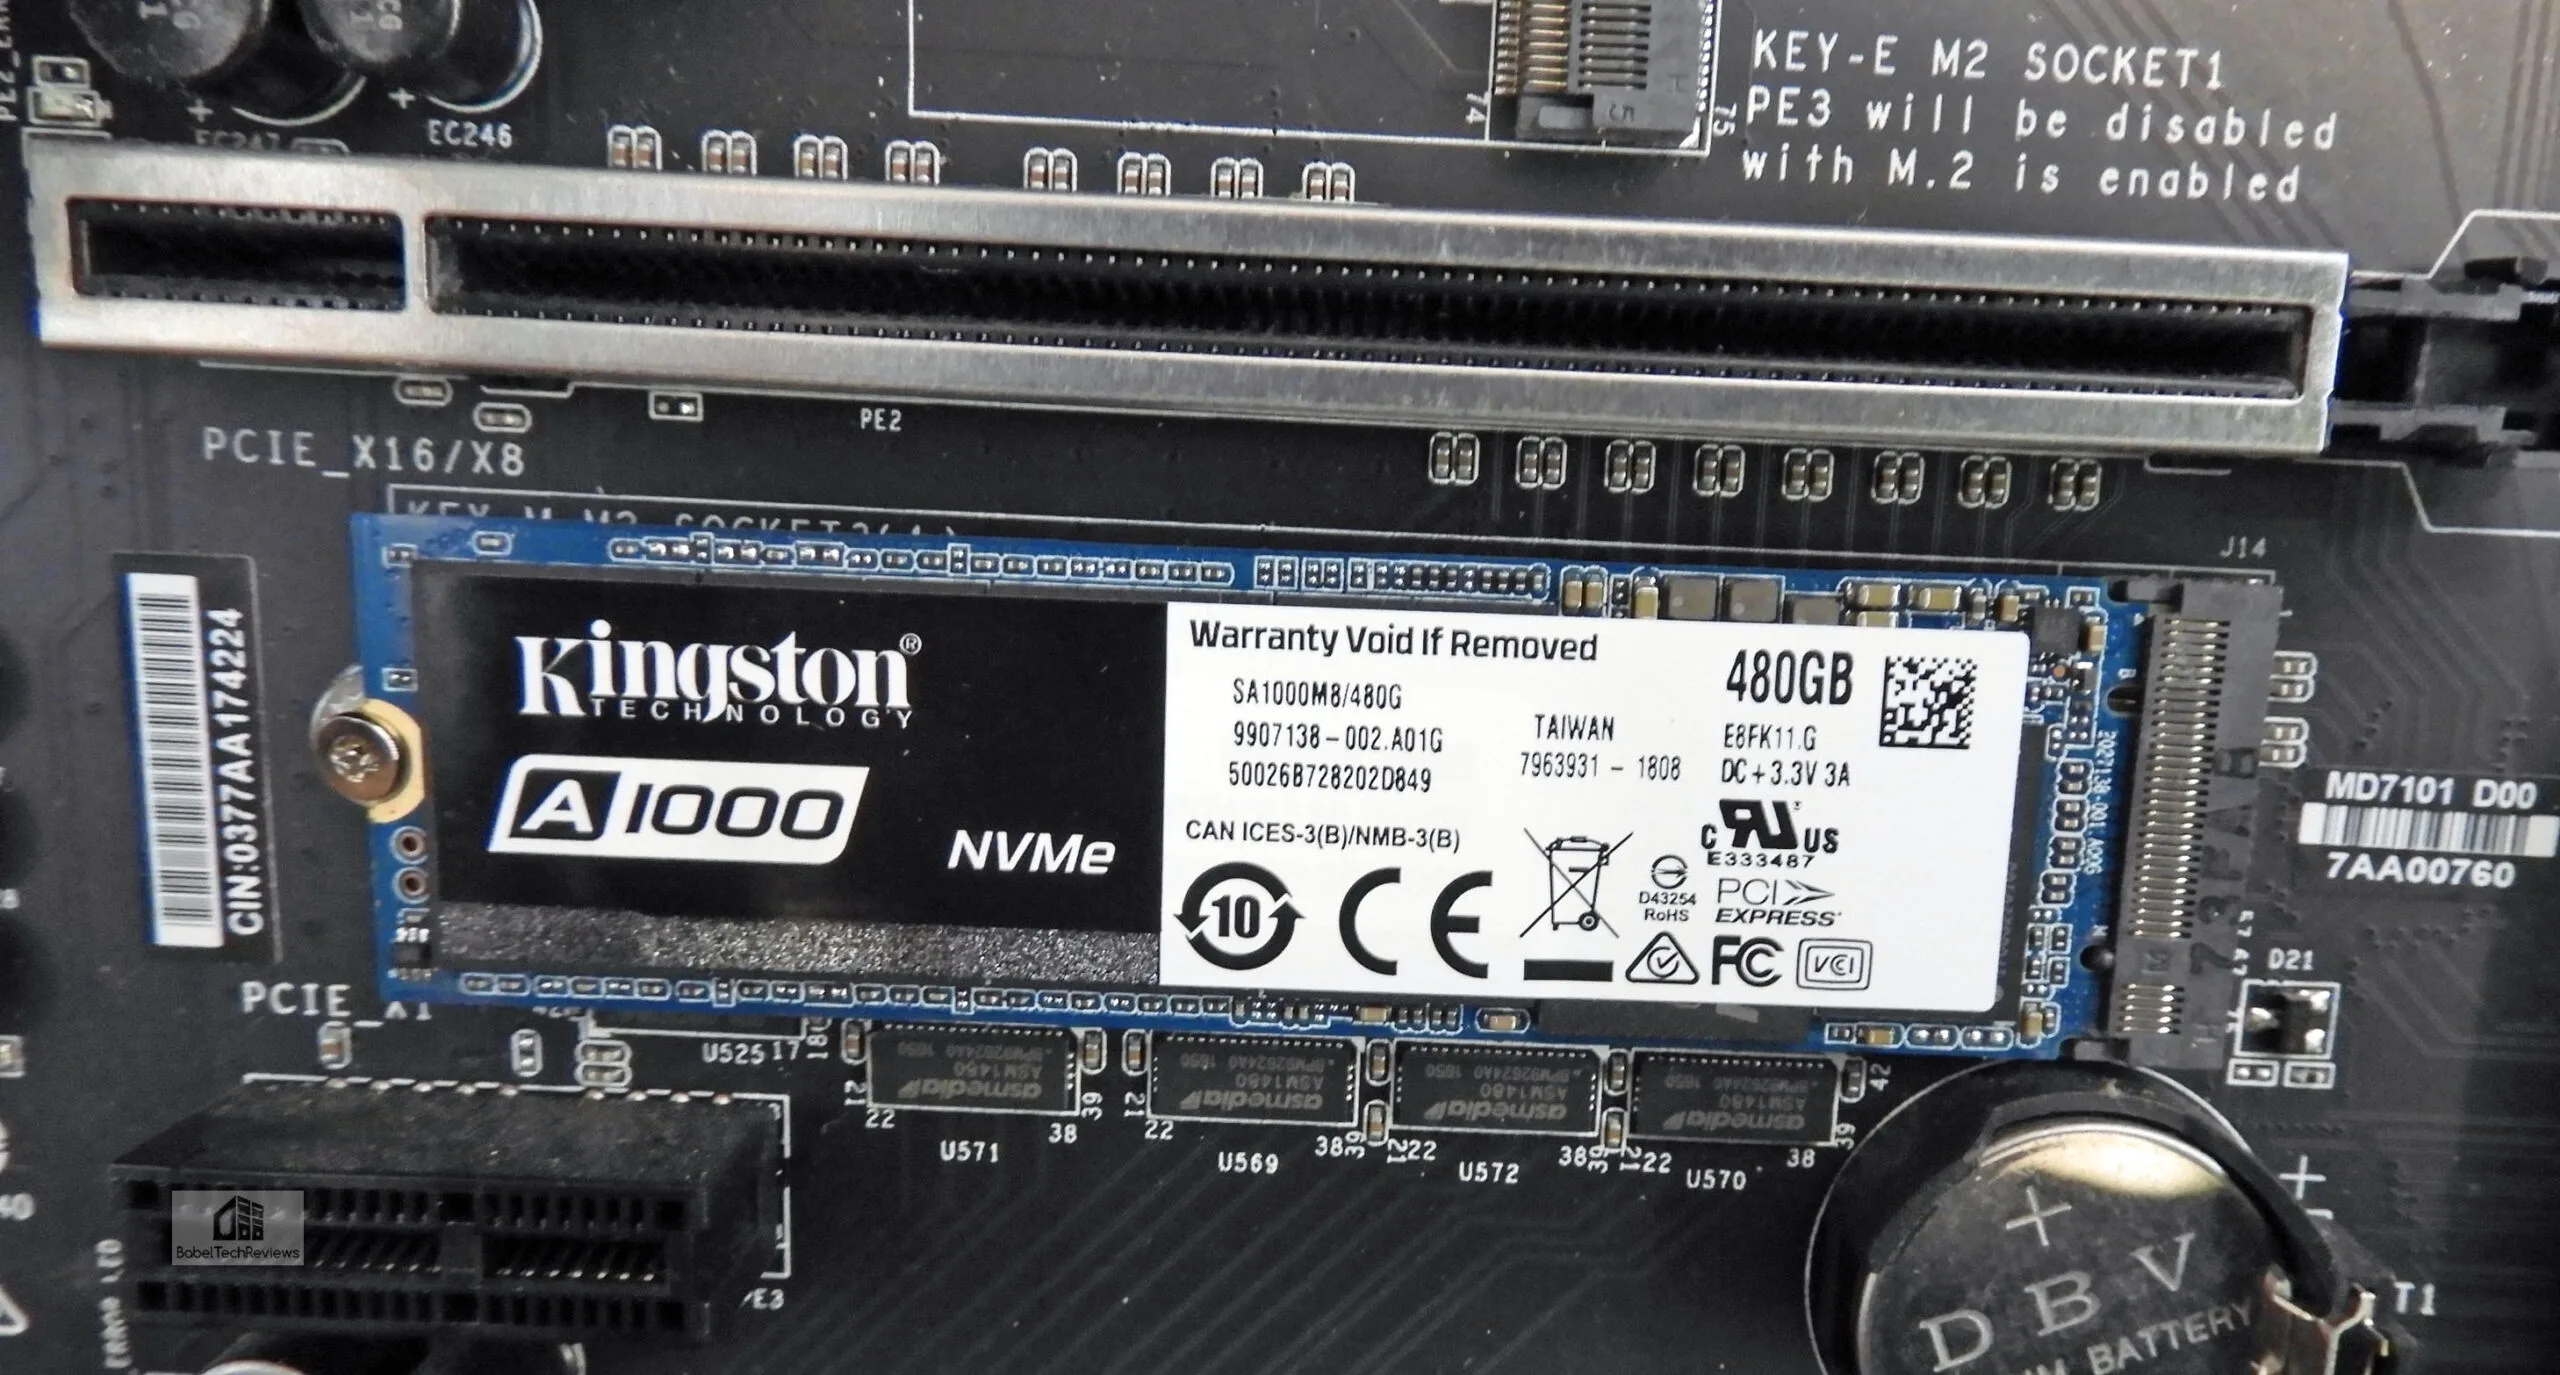
Next up, Skyrim VR is due for a performance review as well as a Round-Up VR performance and IQ evaluation using 20 games on eight of AMD and NVIDIA’s top cards.
Happy Gaming!