The RTX 3070 Ti Arrives at $599 – 25 Pancakes Games, Vive Pro 2 VR Performance, and GPGPU Benchmarks
BTR received the RTX 3070 Ti 8GB Founders Edition (FE) from NVIDIA and we have been testing its performance by benchmarking 25 games and five VR games using the new Vive Pro 2, and also by overclocking it with an emphasis on ray tracing and DLSS. Although the RTX 3070 Ti is a gaming card, we have added workstation, SPEC, and GPGPU benches. Although we feature the Vive Pro 2 to see if a RTX 2080 Ti / RTX 3070/Ti class of card can power its extreme resolution, this is not a review of the new headset yet.
We are going to compare performance using eight top cards to see where the RTX 3070 Ti FE fits in – the RTX 3070 Ti, 3080 Ti FE, the RTX 3090 FE, the RTX 3080 FE, as well as versus the reference RX 6800, RX 6800 XT, and the Red Devil RTX 6900 XT. However, because of supply/demand issues, all suggested pricing is meaningless as only a very lucky few gamers will get them at or close to MSRP/SEP.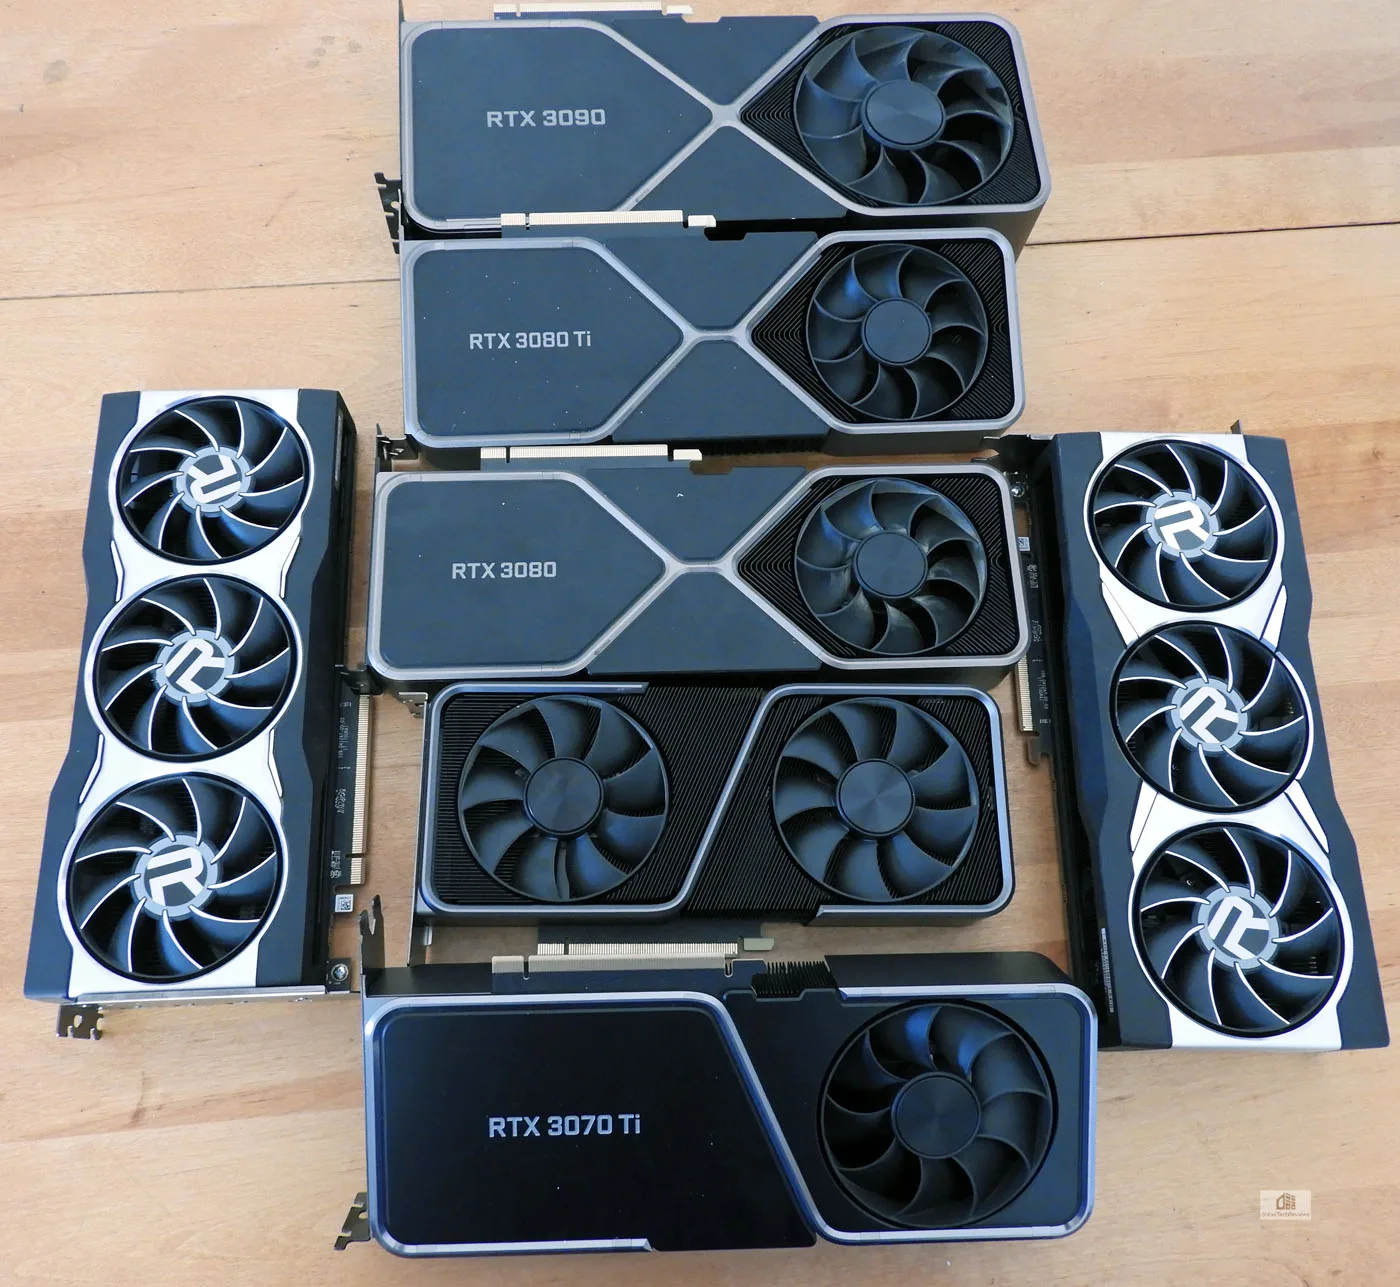
NVIDIA indicates that the RTX 3070 Ti has been in full production and stockpiled for over a month, so they are already in the hands of retailers and have been there for weeks so they can build supply. Even so it will still sell out probably within a few minutes or less because the demand is incredibly high. Fortunately, the end of the COVID-19 and Crypto pandemics are in view and a new ‘Roaring 20s’ for gamers may soon appear on the horizon with lower prices and better availability by the Autumn.
Specifications
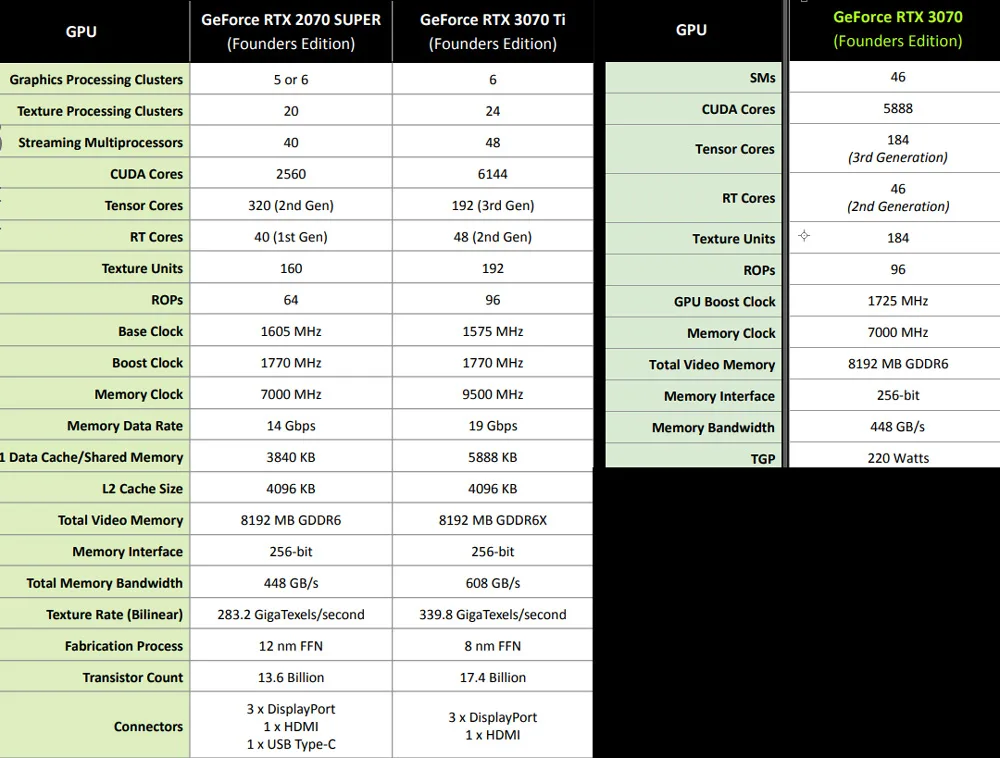
We have already covered Ampere’s features in depth and we have reviewed the RTX 3070, the 3080 Ti’s $499 slower brother that comes equipped with 8GB of GDDR6 vRAM. The RTX 3070 Ti is a GDDR6X upgrade over the RTX 3070. Besides its faster memory, the 3070 Ti also has more CUDA Cores and slightly higher clock speeds, as well as a flow-through cooler design similar to the RTX 3080/3080 Ti/3090.
This review will consider whether the new RTX 3070 Ti FE at $599 – $100 more than the RTX 3070 – delivers a good value. Below are the specifications comparing the RTX 3070 Ti with the RTX 2070 as well as with the RTX 3070.
Since the RTX 2080 Ti launched in 2018, there are now more than 130 games and applications supporting NVIDIA’s RTX tech including ray tracing and Deep Learning Super Sampling (DLSS). Since all of the vendors and console platforms now support ray tracing technology, we will focus on these newer games. NVIDIA’s Reflex latency-reducing technology is also now supported in 12 of the top 15 competitive shooters and we will follow up this review with an upcoming latency review.
We benchmark using Windows 10 64-bit Pro Edition at 1920×1080, 2560×1440, and at 3840×2160 using Intel’s Core i9-10900K at 5.1/5.0 GHz and 32GB of T-FORCE DARK Z 3600MHz DDR4 on a EVGA Z490 FTW motherboard. All games and benchmarks use the latest versions, and we use the most recent drivers.
Let’s first unbox the RTX 3070 Ti Founders Edition before we look at our test configuration
The RTX 3080 Ti Founders Edition Unboxing
The Ampere generation RTX 3070 Ti Founders Edition is also a completely redesigned Founders Edition and here is the card, unboxed.
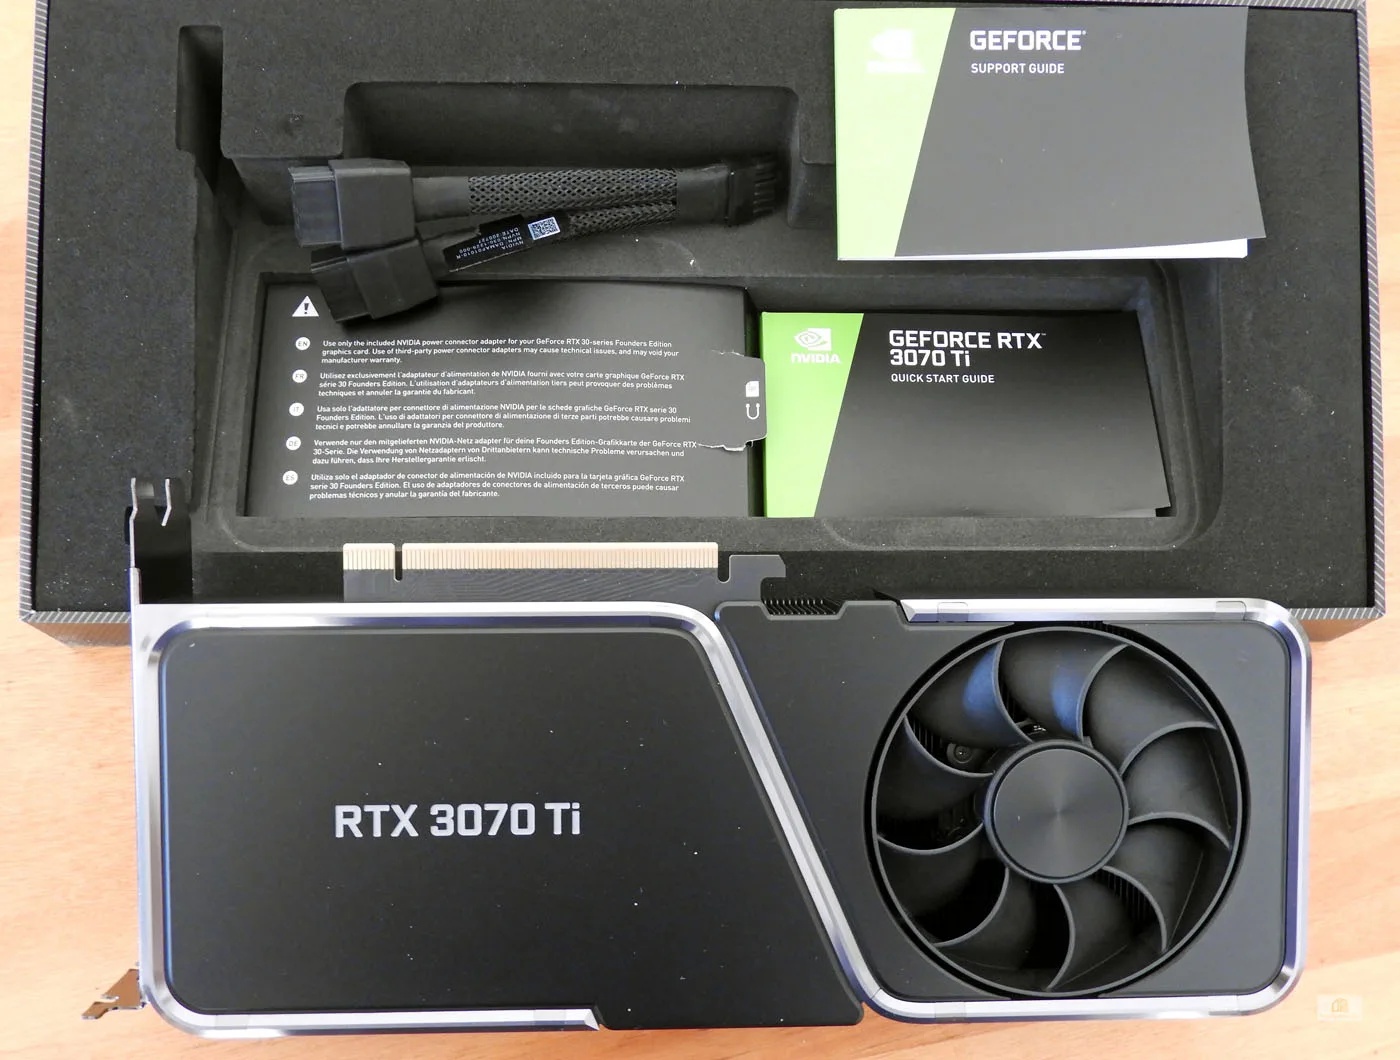
Inside the box and beneath the card are warnings, a quick start guide and warranty information, plus the 12-pin to PCIe dual 8-pin dongle that will be required to connect the RTX 3070 Ti to most PSUs.
Just like the other Ampere Founders Editions, the RTX 3070 Ti comes in a “shoebox” style box where the card inside lays flat at a slight incline for display.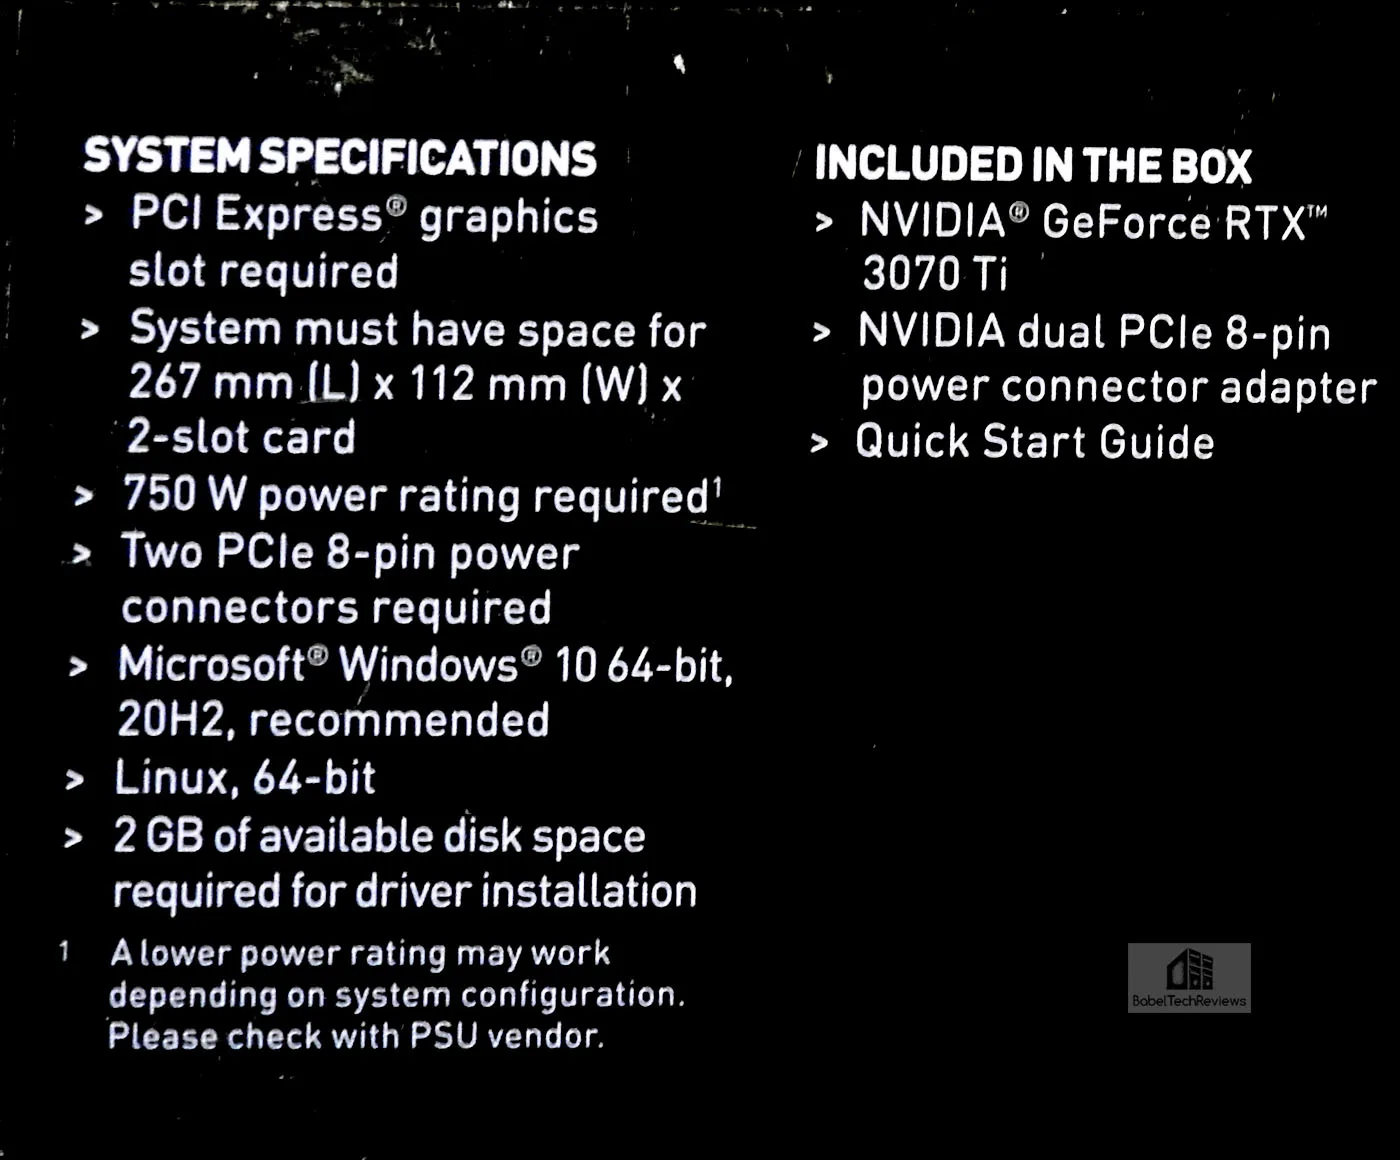
The system requirements, contents, and warranty information are printed on the bottom of each box. The RTX 3070 Ti requires a minimum 750W power supply unit, and the case must have space for a 267mm (L) x 112mm (W) two-slot card.
It easily fits in our Phanteks Eclipse P400 ATX mid-tower as it is much smaller than the RTX 3090 and slightly smaller than the RTX 3080 Ti.
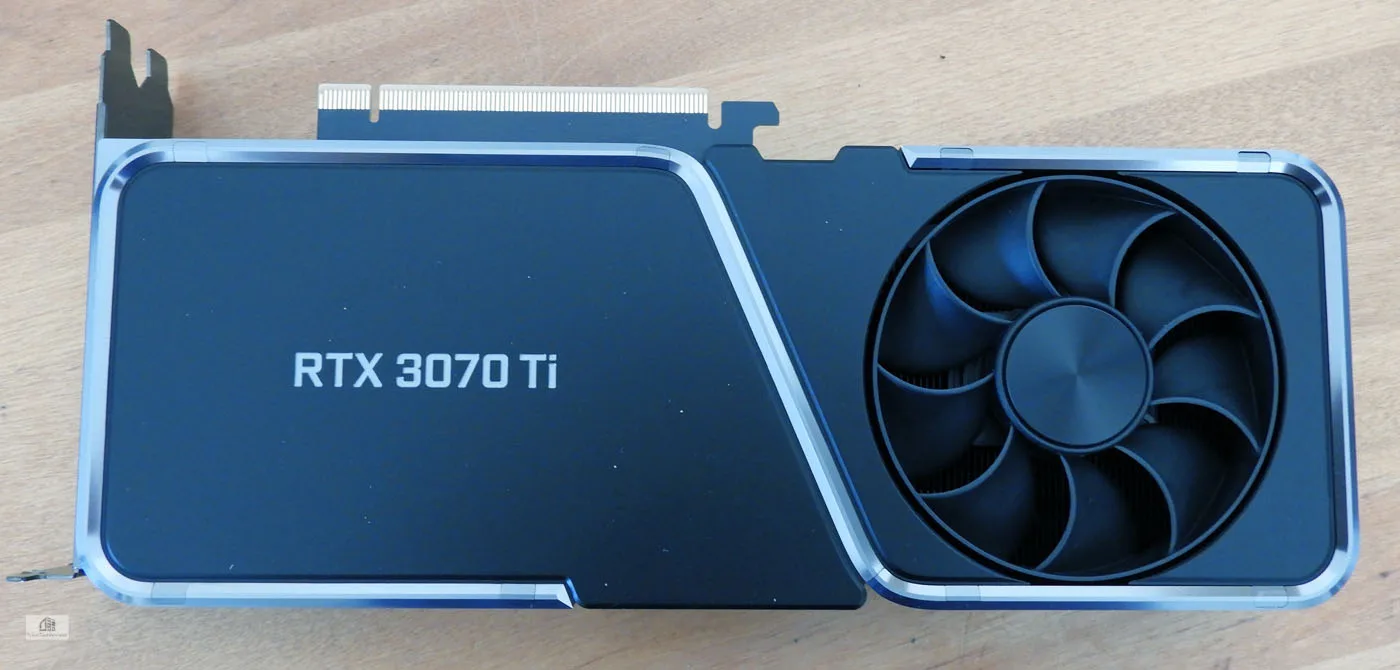
The RTX 3070 Ti Founders Edition is a moderately heavy 2-slot card with dual fans. As a GDDR6X upgrade over the RTX 3070, the 3070 Ti also has more CUDA Cores and slightly higher clock speeds, as well as the flow-through cooler design similar to the RTX 3080/3080 Ti/3090.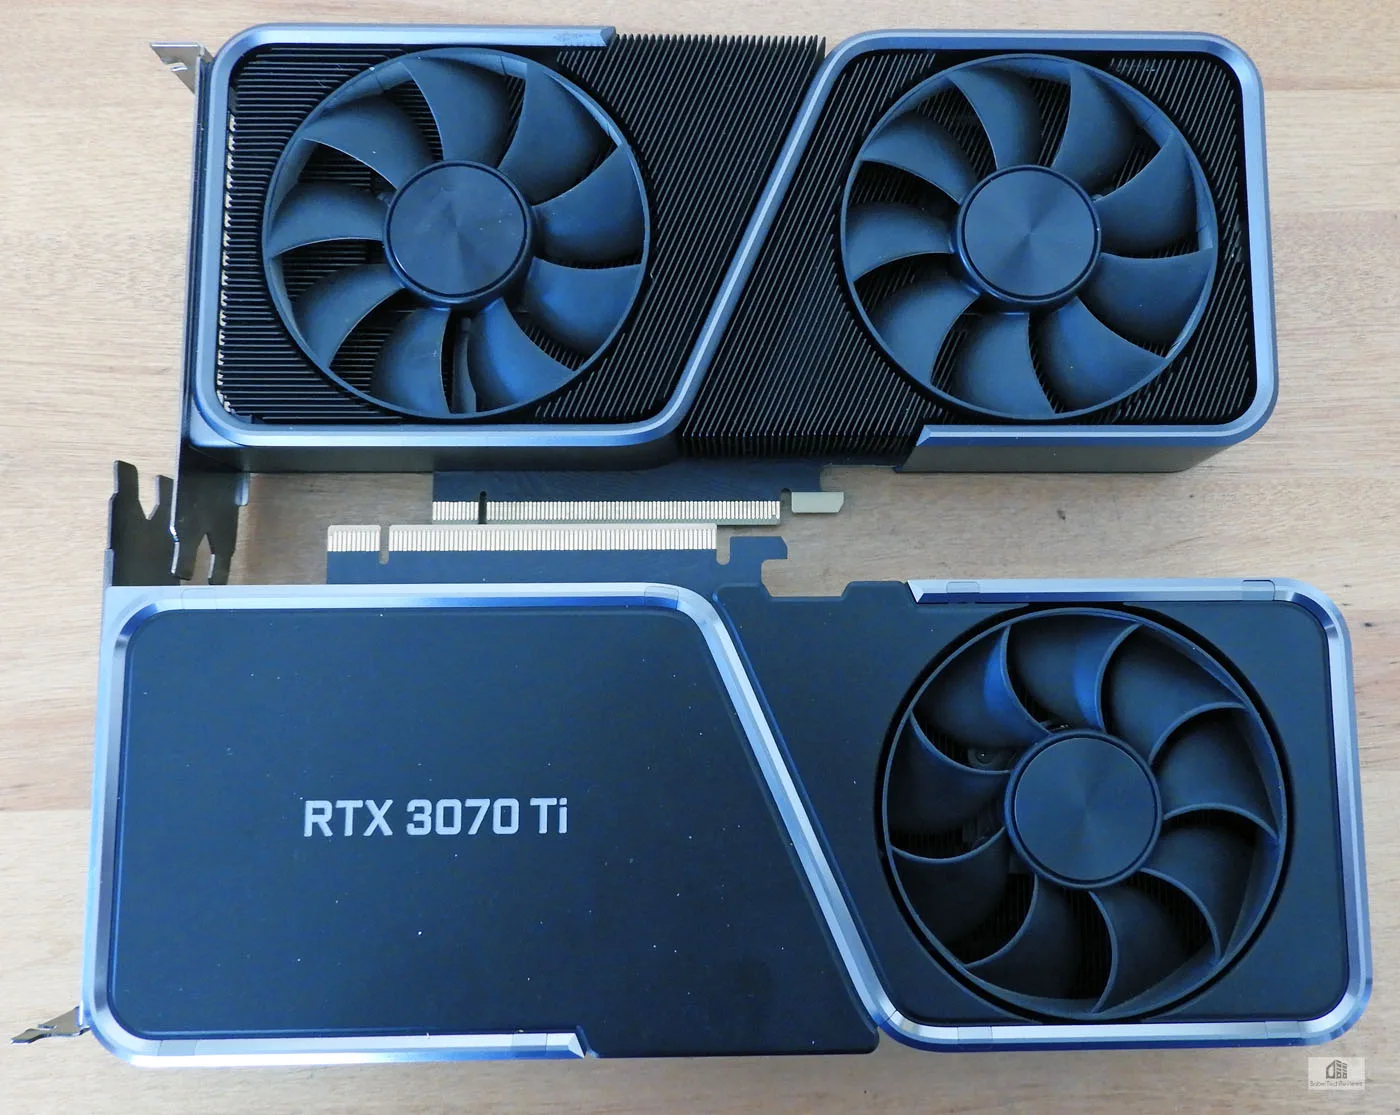
Turning the card over, we see the similar unique design of the top Ampere FEs with the flow-through cooler. This card is designed to keep the GPU cool partly by using a short PCB, and inside the card it is mostly all heatsink fins.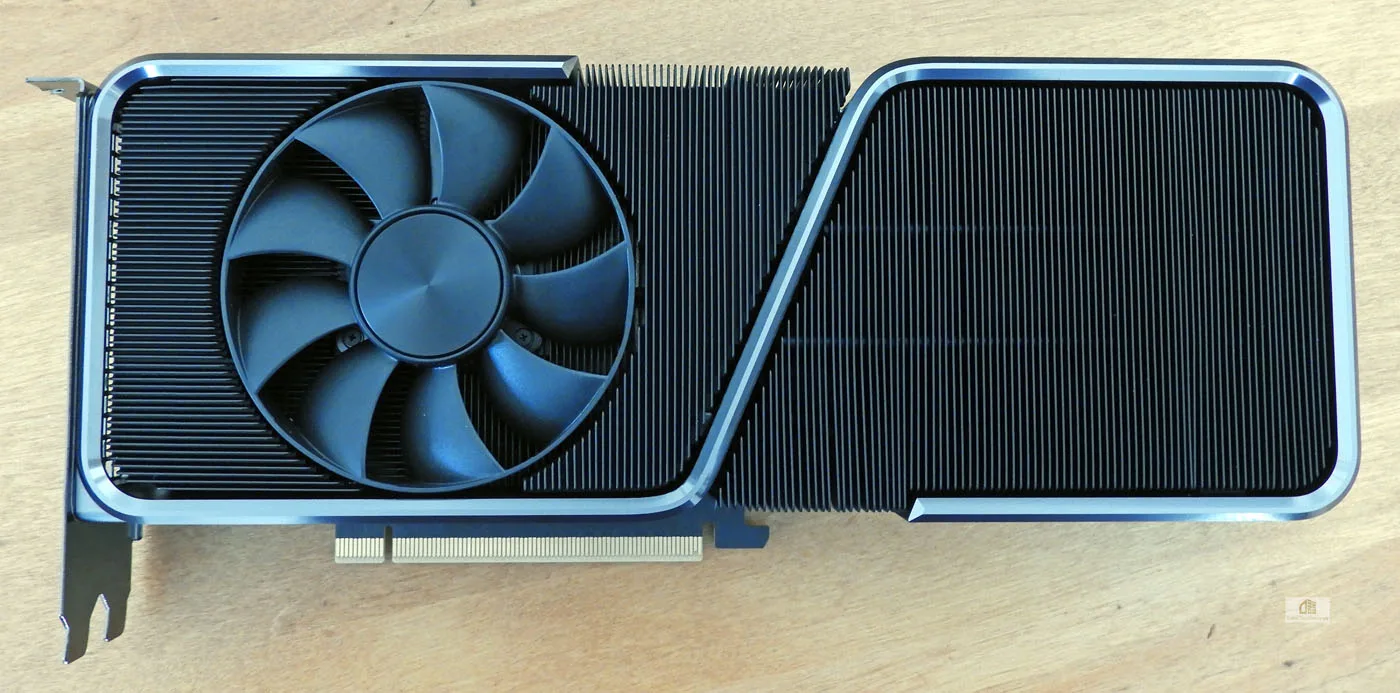
There is very large surface area for cooling so the heat is readily transferred to the fin stack and the dual fans exhaust the heat out of the back of the case and also from the top of the card into the case’s airflow.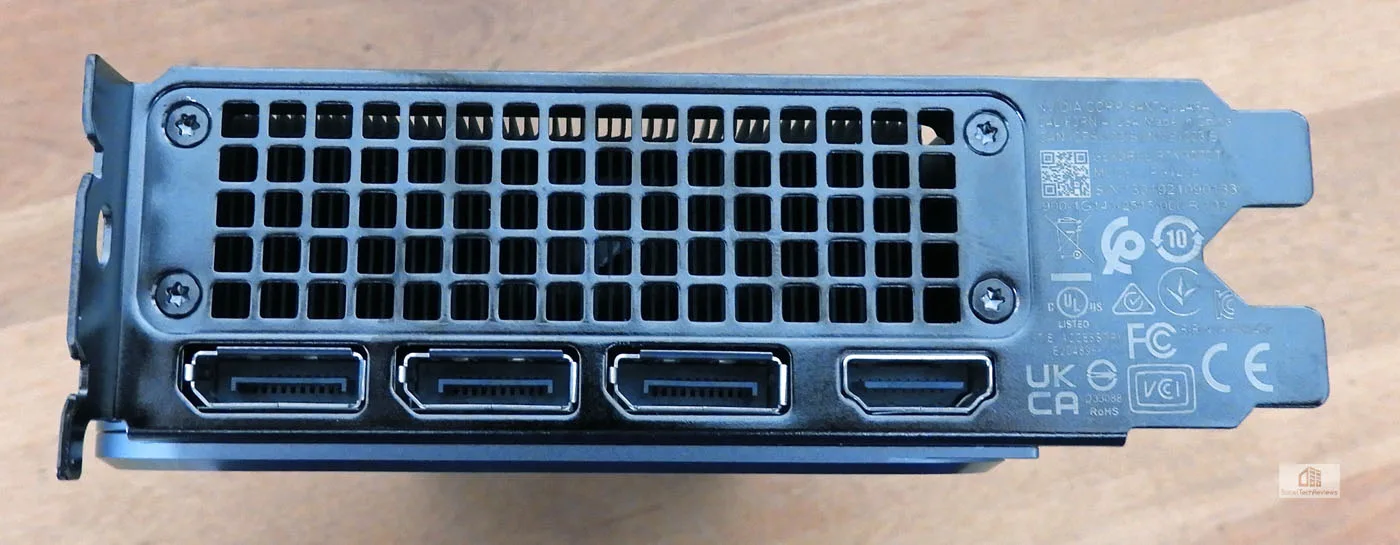
The IO panel has a very large air vent and four connectors. The connectors are similar to the Founders Edition of the RTX 2080 Ti and the RTX 3080, but the VirtualLink connector for VR is no longer used. Three DisplayPort 1.4 connectors are included, and the HDMI port has been upgraded from 2.0 to 2.1 allowing for 4K/120Hz over a single HDMI cable.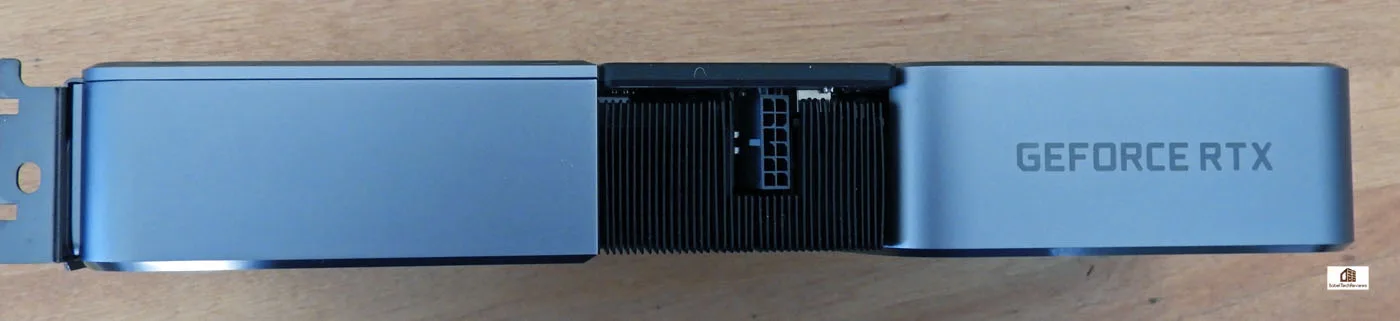

Before we look at overclocking, power and noise, let’s check out our test configuration.
Test Configuration
Test Configuration – Hardware
- Intel Core i9-10900K (HyperThreading/Turbo boost On; All cores overclocked to 5.1GHz/5.0Ghz. Comet Lake DX11 CPU graphics)
- EVGA Z490 FTW motherboard (Intel Z490 chipset, v1.3 BIOS, PCIe 3.0/3.1/3.2 specification, CrossFire/SLI 8x+8x), supplied by EVGA
- T-FORCE DARK Z 32GB DDR4 (2x16GB, dual channel at 3600MHz), supplied by Team Group
- RTX 3070 Ti Founders Edition 8GB, stock and overclocked, on loan from NVIDIA
- RTX 3080 Ti Founders Edition 12GB, stock and overclocked, on loan from NVIDIA
- RTX 3090 Founders Edition 24GB, stock clocks, on loan from NVIDIA
- RTX 3070 Founders Edition 8GB, stock clocks, on loan from NVIDIA
- RTX 3070 Ti Founders Edition 8GB, stock and overclocked, on loan from NVIDIA
- Radeon RX 6800 16GB reference version, stock clocks on loan from AMD
- Radeon RX 6800 XT 16GB reference version, stock clocks on loan from AMD
- Red Devil RX 6900 XT 16GB, at Red Devil clocks, loaned by PowerColor and returned in April.
- VIVE PRO 2, on a short-term loan from HTC/VIVE
- 1TB Team Group MP33 NVMe2 PCIe SSD for C: drive
- 1.92TB San Disk enterprise class SATA III SSD (storage)
- 2TB Micron 1100 SATA III SSD (storage)
- 1TB Team Group GX2 SATA III SSD (storage)
- 500GB T-FORCE Vulcan SSD (storage), supplied by Team Group
- ANTEC HCG1000 Extreme, 1000W gold power supply unit
- BenQ EW3270U 32″ 4K HDR 60Hz FreeSync monitor
- Samsung G7 Odyssey (LC27G75TQSNXZA) 27? 2560×1440/240Hz/1ms/G-SYNC/HDR600 monitor
- DEEPCOOL Castle 360EX AIO 360mm liquid CPU cooler
- Phanteks Eclipse P400 ATX mid-tower (plus 1 Noctua 140mm fan) – All benchmarking and overclocking performed with the case closed
Test Configuration – Software
- GeForce 466.47 for (RTX 3080 Ti Press launch drivers) are used for all GeForce cards except for the RTX 3070 Ti and RTX 3070 which use the new card’s press launch drivers – 466.61.
- Adrenalin 21.5.2 drivers used for the RX 6800 and the RX 6800 XT and 21.3.2 is used for the RX 6900 XT.
- High Quality, prefer maximum performance, single display, set in the NVIDIA control panel.
- VSync is off in the control panel and disabled for each game
- AA enabled as noted in games; all in-game settings are specified with 16xAF always applied
- Highest quality sound (stereo) used in all games
- All games have been patched to their latest versions
- Gaming results show average frame rates in bold including minimum frame rates shown on the chart next to the averages in a smaller italics font where higher is better. Games benched with OCAT show average framerates but the minimums are expressed by frametimes (99th-percentile) in ms where lower numbers are better.
- Windows 10 64-bit Pro edition; latest updates 21H1 (Build1 9043.1023). DX11 titles are run under the DX11 render path. DX12 titles are generally run under DX12, and multiple games use the Vulkan API.
- Latest DirectX
- MSI’s Afterburner, 4.6.4 beta to overclock the RTX 3070 Ti
- FCAT VR
- fpsVR
- OpenVR Benchmark
Games
Vulkan
- DOOM Eternal
- Red Dead Redemption 2
- Ghost Recon: Breakpoint
- World War Z
- Rainbow 6 Siege
DX12
- Resident Evil VIllage
- Metro Exodus – Enhanced Edition & regular edition
- Hitman 3
- Cyberpunk 2077
- DiRT 5
- Godfall
- Call of Duty Black Ops Cold War
- Assassins Creed Valhala
- Watch Dogs Legions
- Horizon Zero Dawn
- Death Stranding
- F1 2020
- Borderlands 3
- Civilization VI – Gathering Storm Expansion
- Battlefield V
- Shadow of the Tomb Raider
DX11
- Days Gone
- Crysis Remastered
- Destiny 2 Shadowkeep
- Total War: Three Kingdoms
VR Games
- Assetto Corsa Competizione
- Elite Dangerous
- No Man’s Sky
- Project CARS 2
- Skyrim
Synthetic
- TimeSpy (DX12)
- 3DMark FireStrike – Ultra & Extreme
- Superposition
- Heaven 4.0 benchmark
- AIDA64 GPGPU benchmarks
- Blender 2.92 benchmark
- Sandra 2020/21 GPGPU Benchmarks
- SPECworkstation3
- SPECviewperf 2020
- Octane benchmark
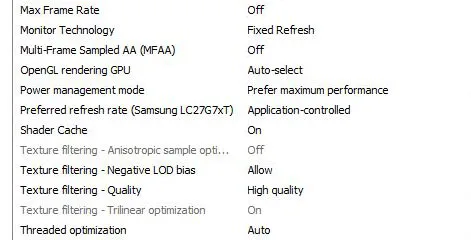
NVIDIA Control Panel settings
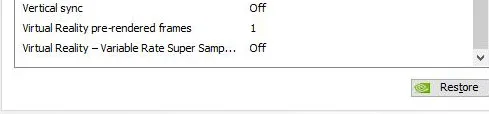
Here are the NVIDIA Control Panel settings.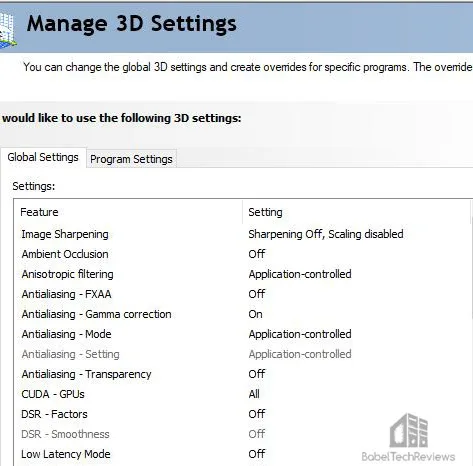
 AMD Adrenalin Control Center Settings
All AMD settings are set so that all optimizations are off, Vsync is forced off, Texture filtering is set to High, and Tessellation uses application settings. Navi cards are quite capable of high Tessellation unlike earlier generations of Radeons.
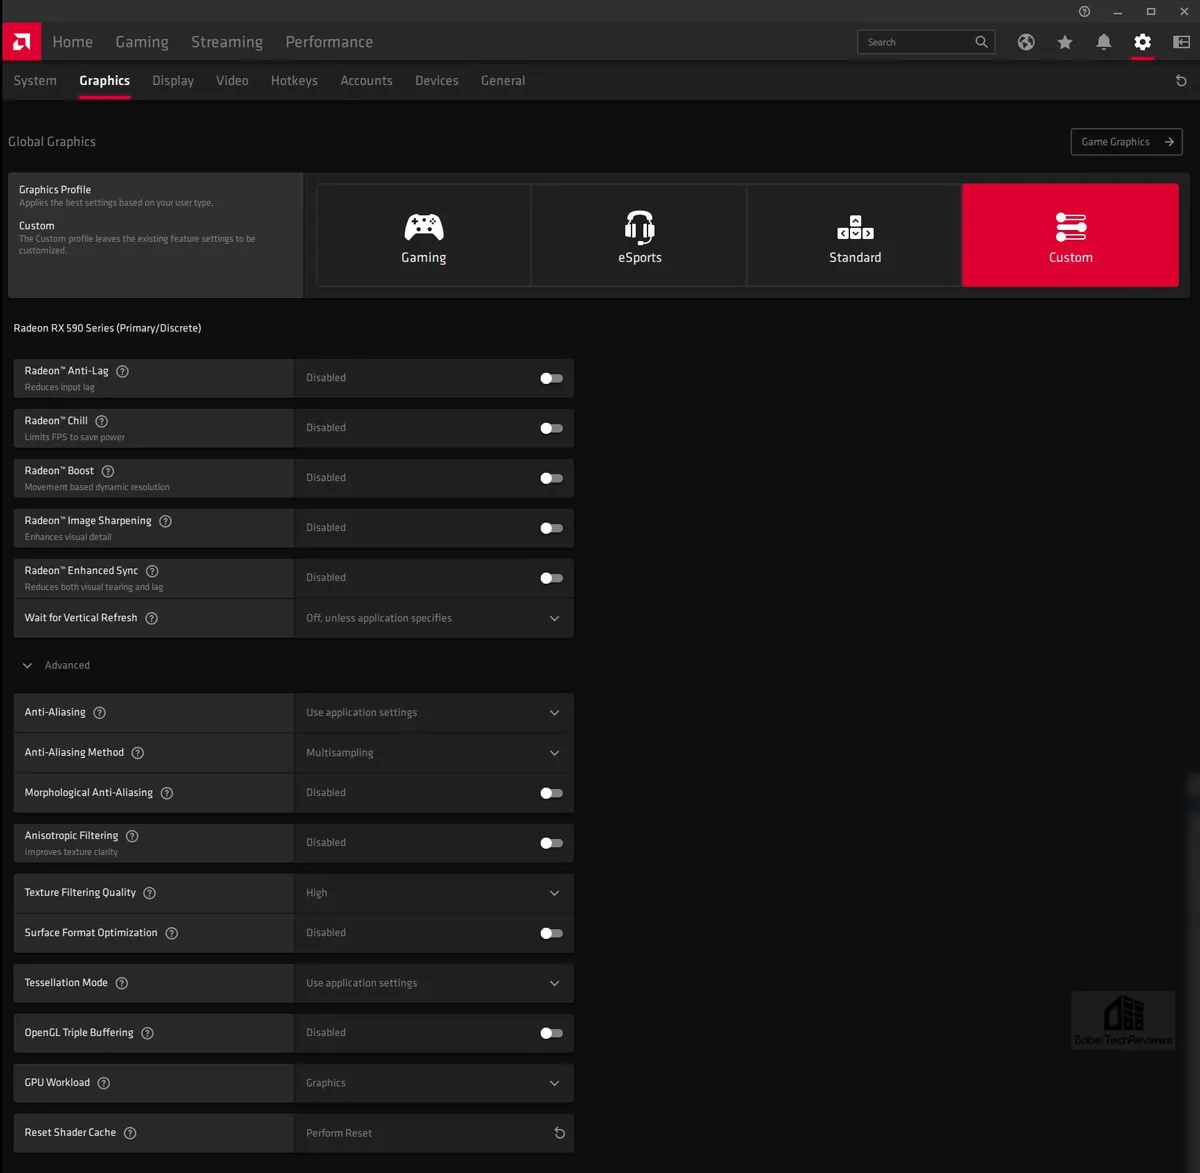
Anisotropic Filtering is disabled by default but we always use 16X for all game benchmarks.
Let’s check out overclocking, temperatures and noise next.
Overclocking, Temperatures & Noise
All of our performance and overclocked testing are performed in a closed Phanteks Eclipse P400 ATX mid-tower case. Inside, the RTX 3070 Ti is a quiet card even when overclocked and we never needed to increase its fan speeds manually or change the stock fan profile. We overclocked using Afterburner without adding any extra voltage.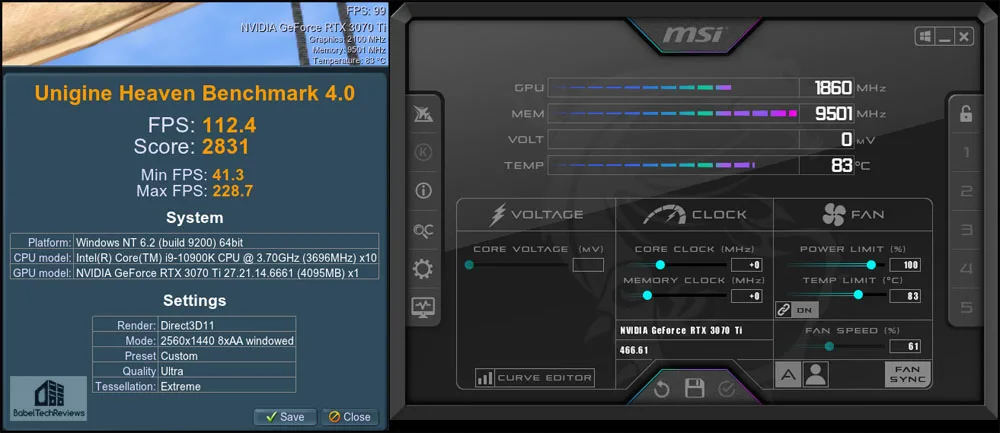
We used Heaven 4.0 running in a window at completely maxed-out settings at a windowed 2560×1440 to load the GPU to 98% so we could observe the running characteristics of the RTX 3070 Ti and also to be able to instantly compare our changed clock settings with their results. At completely stock settings with the GPU under full load, the card ran cool and stayed below 85C with clocks that averaged around 1850MHz.
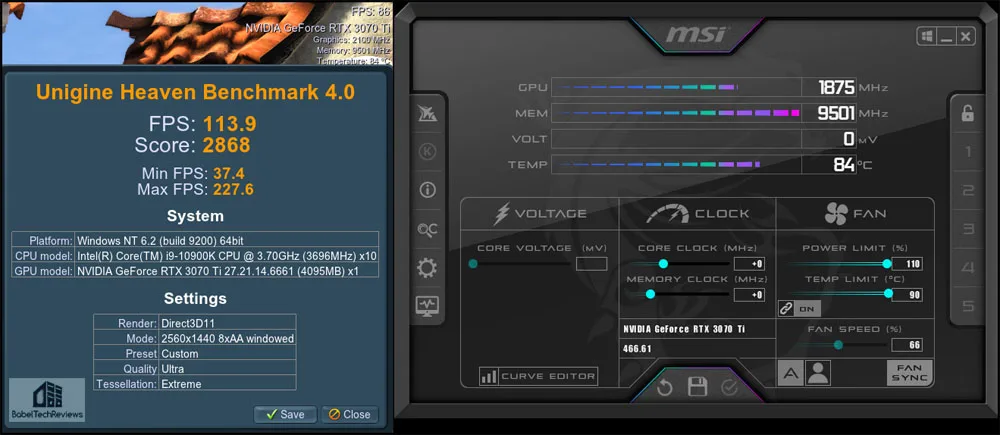
Simply raising the Power and Temperatures to their maximums resulted in the clocks running above 1875MHz with a small rise in temperatures using the stock fan profile.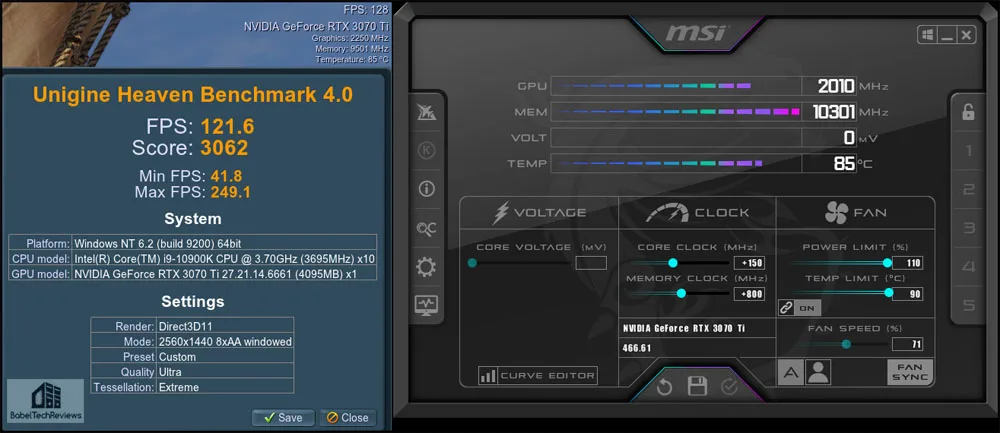
After testing multiple combinations, our RTX 3070 Ti’s final stable overclock to achieve the highest overall performance added +150MHz offset to the core and +800 MHz to the memory. to achieve a core clock above 2000MHz with a memory clock of 10300MHz. The RTX 3070 Ti FE is power-limited, and to achieve a higher overclock will require more voltage.
Although we were unable to spend a lot of time overclocking it, our review sample appears to be only a fair overclocker. If you want a higher overclock, pick a partner overclocked AIB RTX 3070 Ti. To see the performance increase from overclocking, we tested 5 games. The results are given after the main performance charts in the next section.
First, let’s check out performance on the next page.
Performance Summary Charts & Graphs
Gaming Performance Summary Charts
Here are the summary charts of 25 games and 3 synthetic tests. The highest settings were always chosen and the settings are listed on the chart. The benches were run at 1920×1080, 2560×1440 and at 3840×2160. Five cards were compared and they are listed in order starting from left to right with the RTX 3070 FE, the reference RX 6800, the RTX 3070 Ti, the RX 6800 XT, the RTX 3080 FE, the RTX 3080 Ti FE, the RTX 3090 FE, and the Red Devil RX 6900 XT (which was benchmarked in April).
Most results, except for synthetic scores, show average framerates, and higher is better. Minimum framerates are next to the averages in italics and in a slightly smaller font. Games benched with OCAT show average framerates, but the minimums are expressed by frametimes (99th-percentile) in ms where lower are better. Performance wins between the RTX 3070 Ti and the RX 6800 are given in yellow text.
Please click on each chart to open a pop-up window for its best viewing experience.
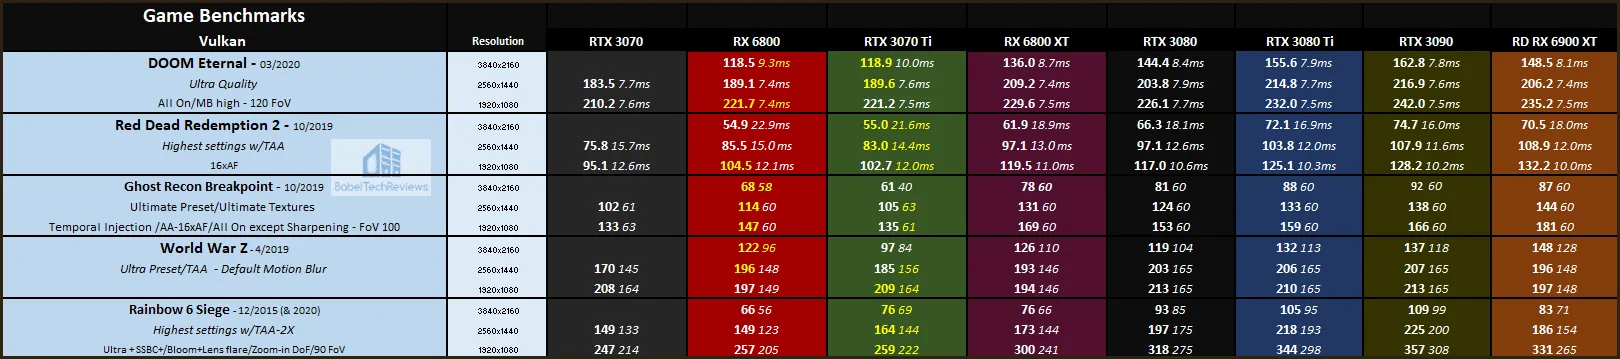

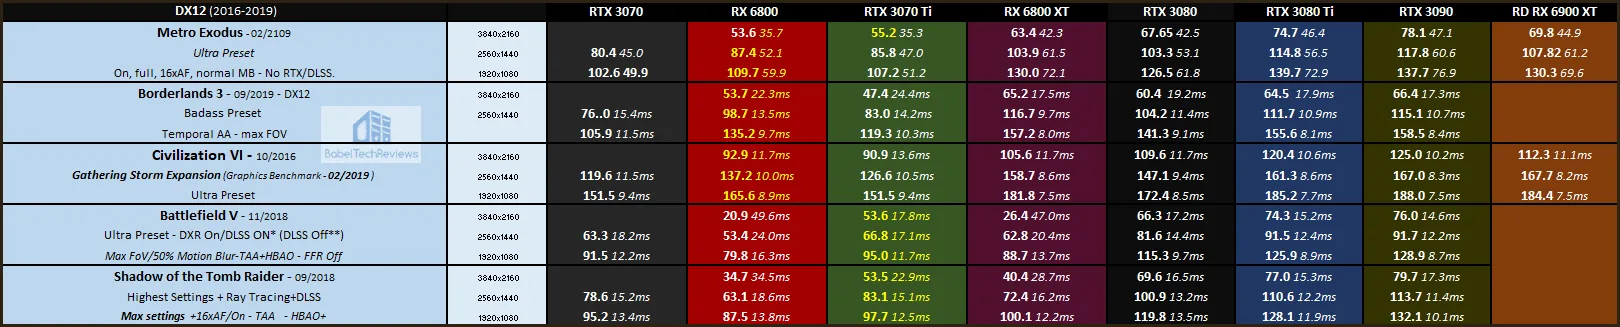
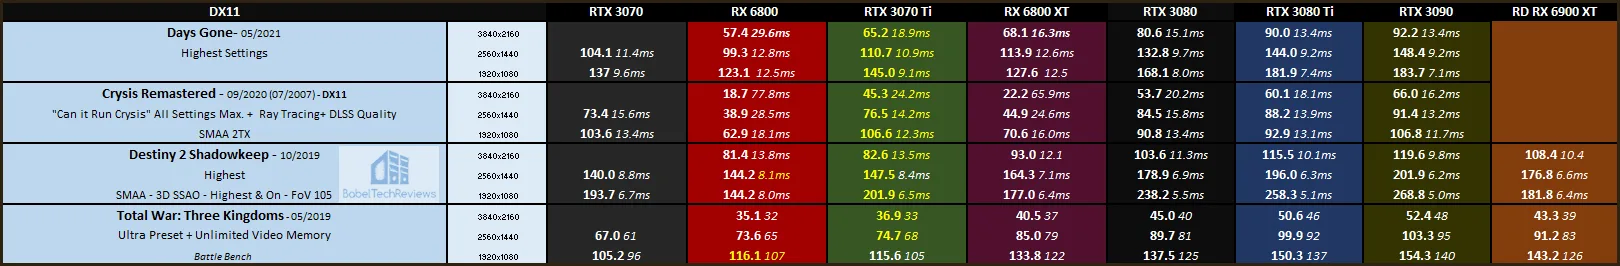
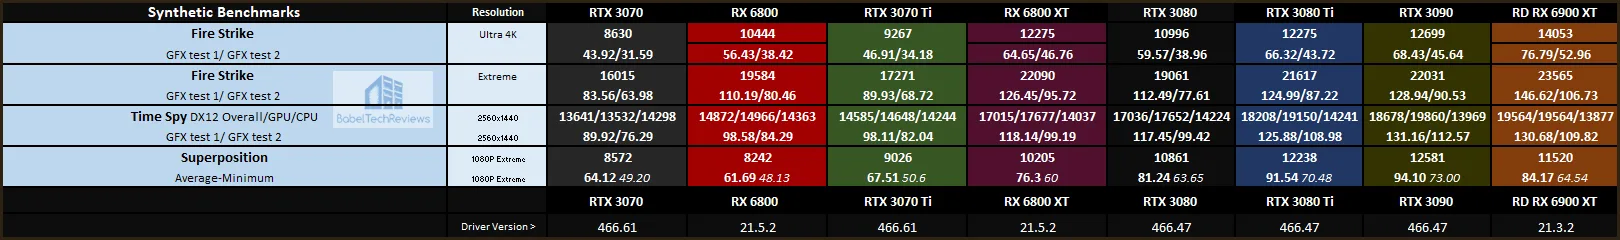
Although there is some game-dependent variability, the RTX 3070 Ti FE is only around 3-10% faster than the RTX 3070 FE but it is enough to now easily trade blows with the reference RX 6800 in rasterized games, winning more than it loses, and is much faster in most ray traced games and a lot faster when DLSS is used.
Next we look at overclocked performance.
Overclocked benchmarks
These benchmarks are run with the RTX 3070 Ti overclocked +150MHz on the core and +800MHz on the memory versus at stock clocks. The RTX 3070 Ti overclocked results are presented first and the stock results are shown in the second column.
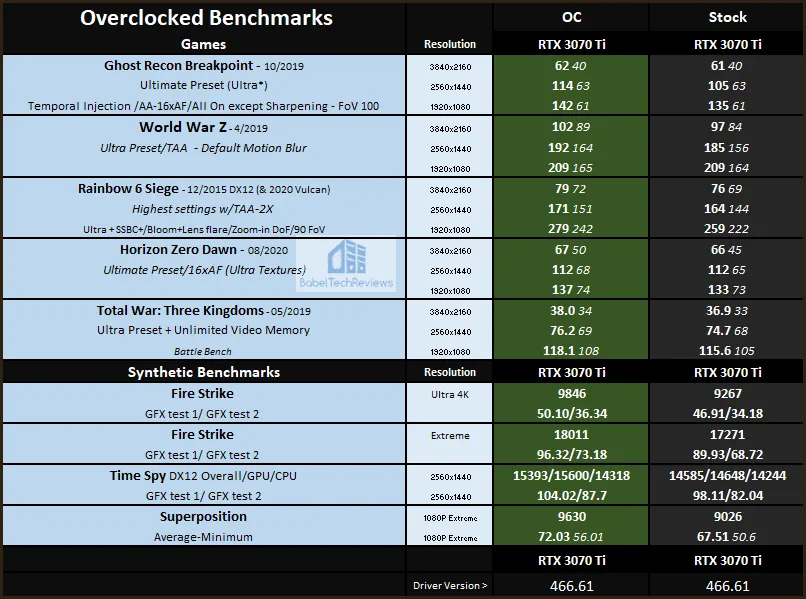 There is a small performance increase from overclocking the RTX 3070 Ti Founders Edition. Unfortunately, although we did not have enough time to optimize our overclock, it’s clear that NVIDIA has locked down Ampere cards’ overclocking in an attempt to maximize performance for all Founders Edition gamers. We would also suggest that the RTX 3070 Ti FE is rather voltage constrained and if you want a higher overclock, pick a factory-overclocked partner version instead of a Founders Edition.
Let’s next look at VR gaming with the Vive Pro 2. The following is not our review of the Vive Pro 2 – the full review will follow next week. Instead we are going to focus on performance.
VR Gaming with the Vive Pro 2
The Vive Pro 2 is a much more demanding headset than the Vive Pro or the Valve Index by virtue of its higher resolution. Image resolution has been increased per eye from the Pro’s (or Valve Index’) 1440 x 1600 to 2448 x 2448. This higher resolution gives it exceptional clarity with no screen door effect, but it is also demanding on video cards. By default at the Ultra or Extreme preset, the Vive console uses 150% SteamVR Render Resolution for the Vive Pro 2 which appeared to be set to 2748×2748 per eye for high end NVIDIA cards at the time we benchmarked our games.
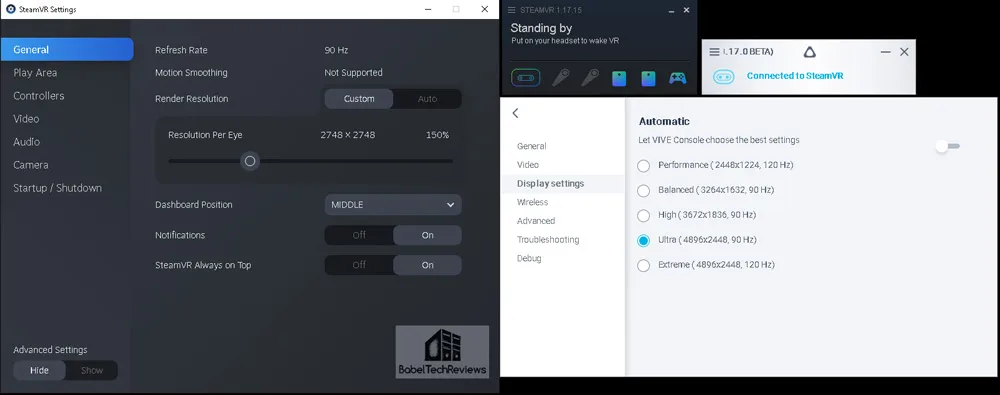
Here is the OpenVR benchmark result which requires 100% SteamVR Render Resolution for its default run. We used the Vive Console Ultra setting at native resolution and 90Hz. We did not test the Extreme setting which allows up to 120Hz.
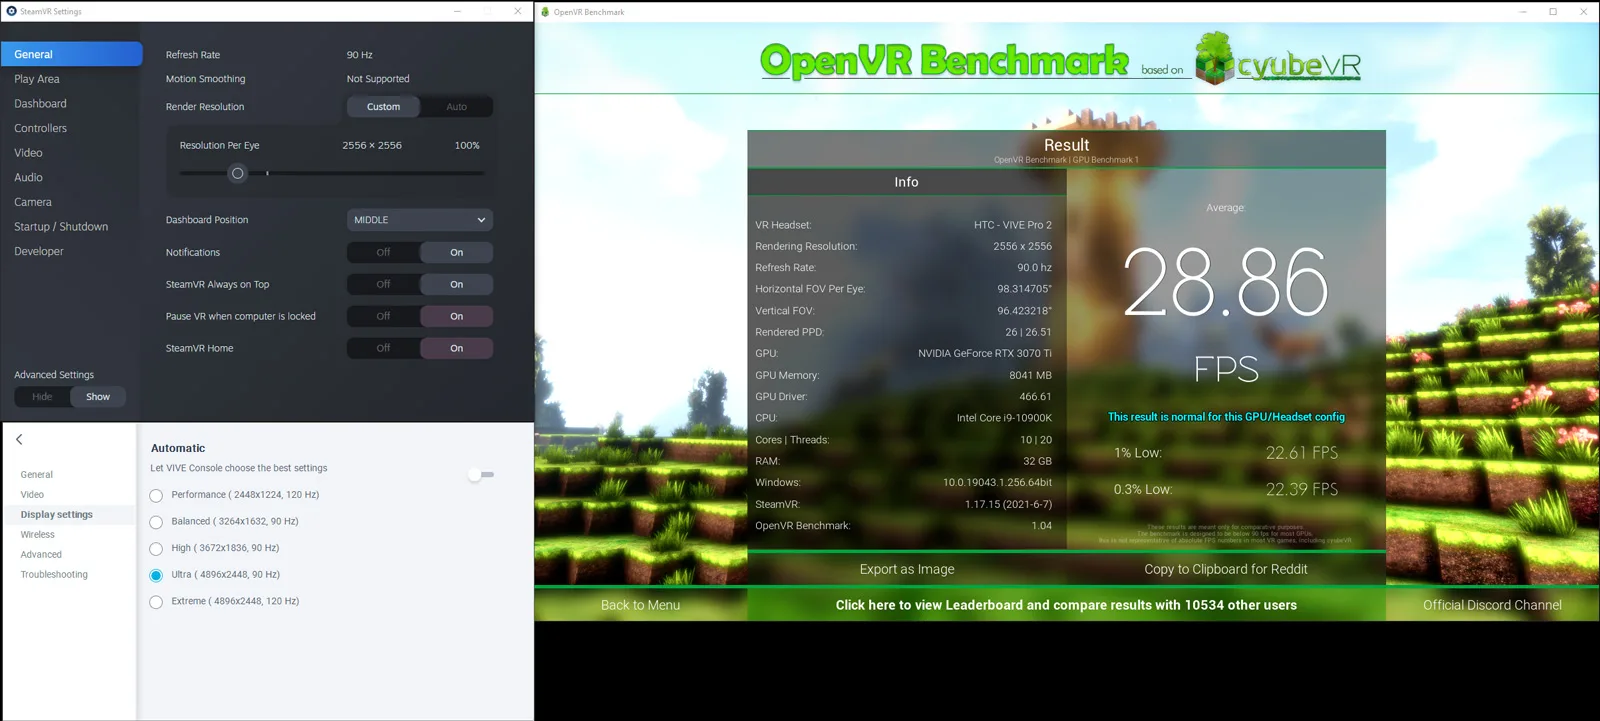
Although SteamVR sets the same resolution for the RTX 3090 and the RTX 3070 Ti, it uses a lower resolution for AMD cards at either 100% (2244×2244) or at 150%. In fact, yesterday’s Vive software update lowered the default SteamVR resolution slightly for NVIDIA cards which suggests that it is still a work in progress and is being fine-tuned. The 100% SteamVR render resolution was lowered from 2556×2556 to 2532×2532 yesterday. Our results reflect the higher render setting.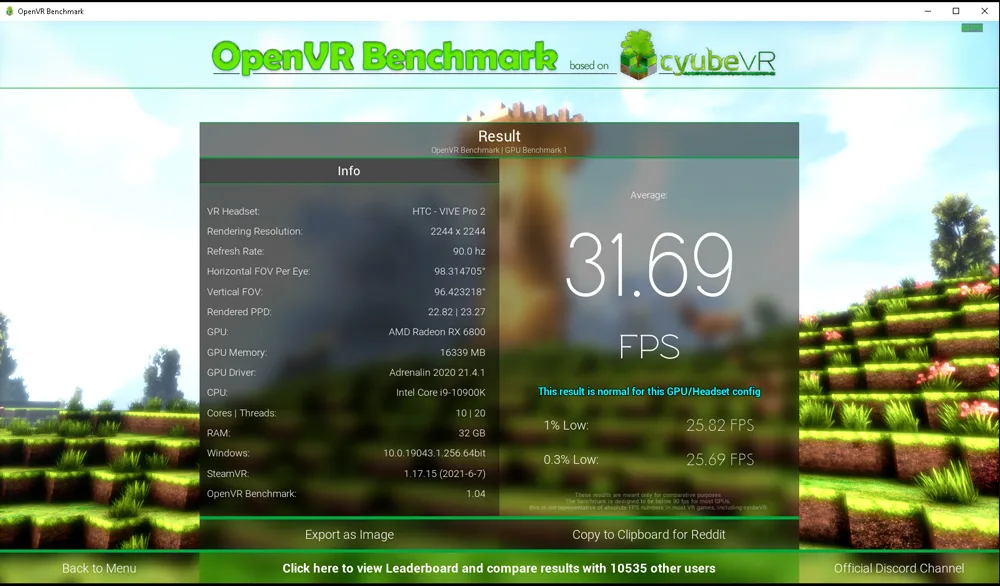 Some VR gamers prefer to lower the SteamVR Render Resolution which is set at 150% and is mostly used to compensate for the lens’ distortion instead of lowering a game’s preset or by dropping individual settings. We decided to initially test at 100% which is what we test the Reverb G2, the Vive Pro, and the Valve Index. Our follow up review will also benchmark at the default 150% resolution.
Yesterday, in response to our questions, Vive suggested that the SteamVR default Render Resolution should be left at 150%. Vive told BTR:
“Motion Compensation is the same as Motion Smoothing. The new lens and display requires our own motion compensation, and VIVE Console is the software that is driving the displays, so motion compensation is built into that.
For VIVE Pro 2, we set Steam’s supersampling setting as 150% by default, which makes up for the lens distortion. We found this to be the best value for SteamVR’s automatic performance scaling to scale and still reach 90 or 120 Hz on the majority of PCs we expect to be used to run VIVE Pro 2. However, users can still go into SteamVR to manually adjust their supersampling settings.
If we had set it to 100%, a lot of PCs would struggle under automatic settings. Render resolution is set by SteamVR and automatically scales to what it thinks is best for your system, VIVE Console handles display resolution.”
Motion Smoothing is disabled in SteamVR, but we actually didn’t see any FPS performance difference disabling or enabling Motion Compensation in the Vive console using fpsVR although the frametimes suffered. We see relatively minor visual differences between 100% and 150% SteamVR Render Resolution but even at the higher setting, lens distortion is still slightly visible to us particularly at the edges of the display.
At 50% SteamVR Render Resolution, there is a clear degradation of visuals which indicates that the SteamVR Render Resolution is working properly. However, at 150% Super Resolution, the frametime rates go up (which is bad) for several games that we tested although the FPS remain at 45 FPS which suggested to us that Vive’s Motion Compensation may still be on although Vive assures us it can be switched off in their console. We noticed that Motion Compensation artifacting became prominent and even disturbing if settings are pushed too high as we found with Elite Dangerous.
Please note that FCAT VR doesn’t distinguish dropped frames from synthesized frames using the Pro 2 (or the Reverb G2) like it properly does for the Valve Index and the Vive Pro. We suggest that the vast majority of the frames reported as dropped are actually synthetically generated (reprojected) frames. It is likely that FCAT VR is not yet optimized for the Pro 2.
It is important to remember that BTR’s charts use frametimes in ms where lower is better, but we also compare “unconstrained framerates” which shows what a video card could deliver (headroom) if it wasn’t locked to either 90 FPS or to 45 FPS by the HMD. In the case of unconstrained FPS which measures just one important performance metric, faster is better.
Let’s individually look at our five VR games’ performance using FCAT VR. All of our games were benchmarked at 100% SteamVR resolution.
First up, Assetto Corsa Competizione.
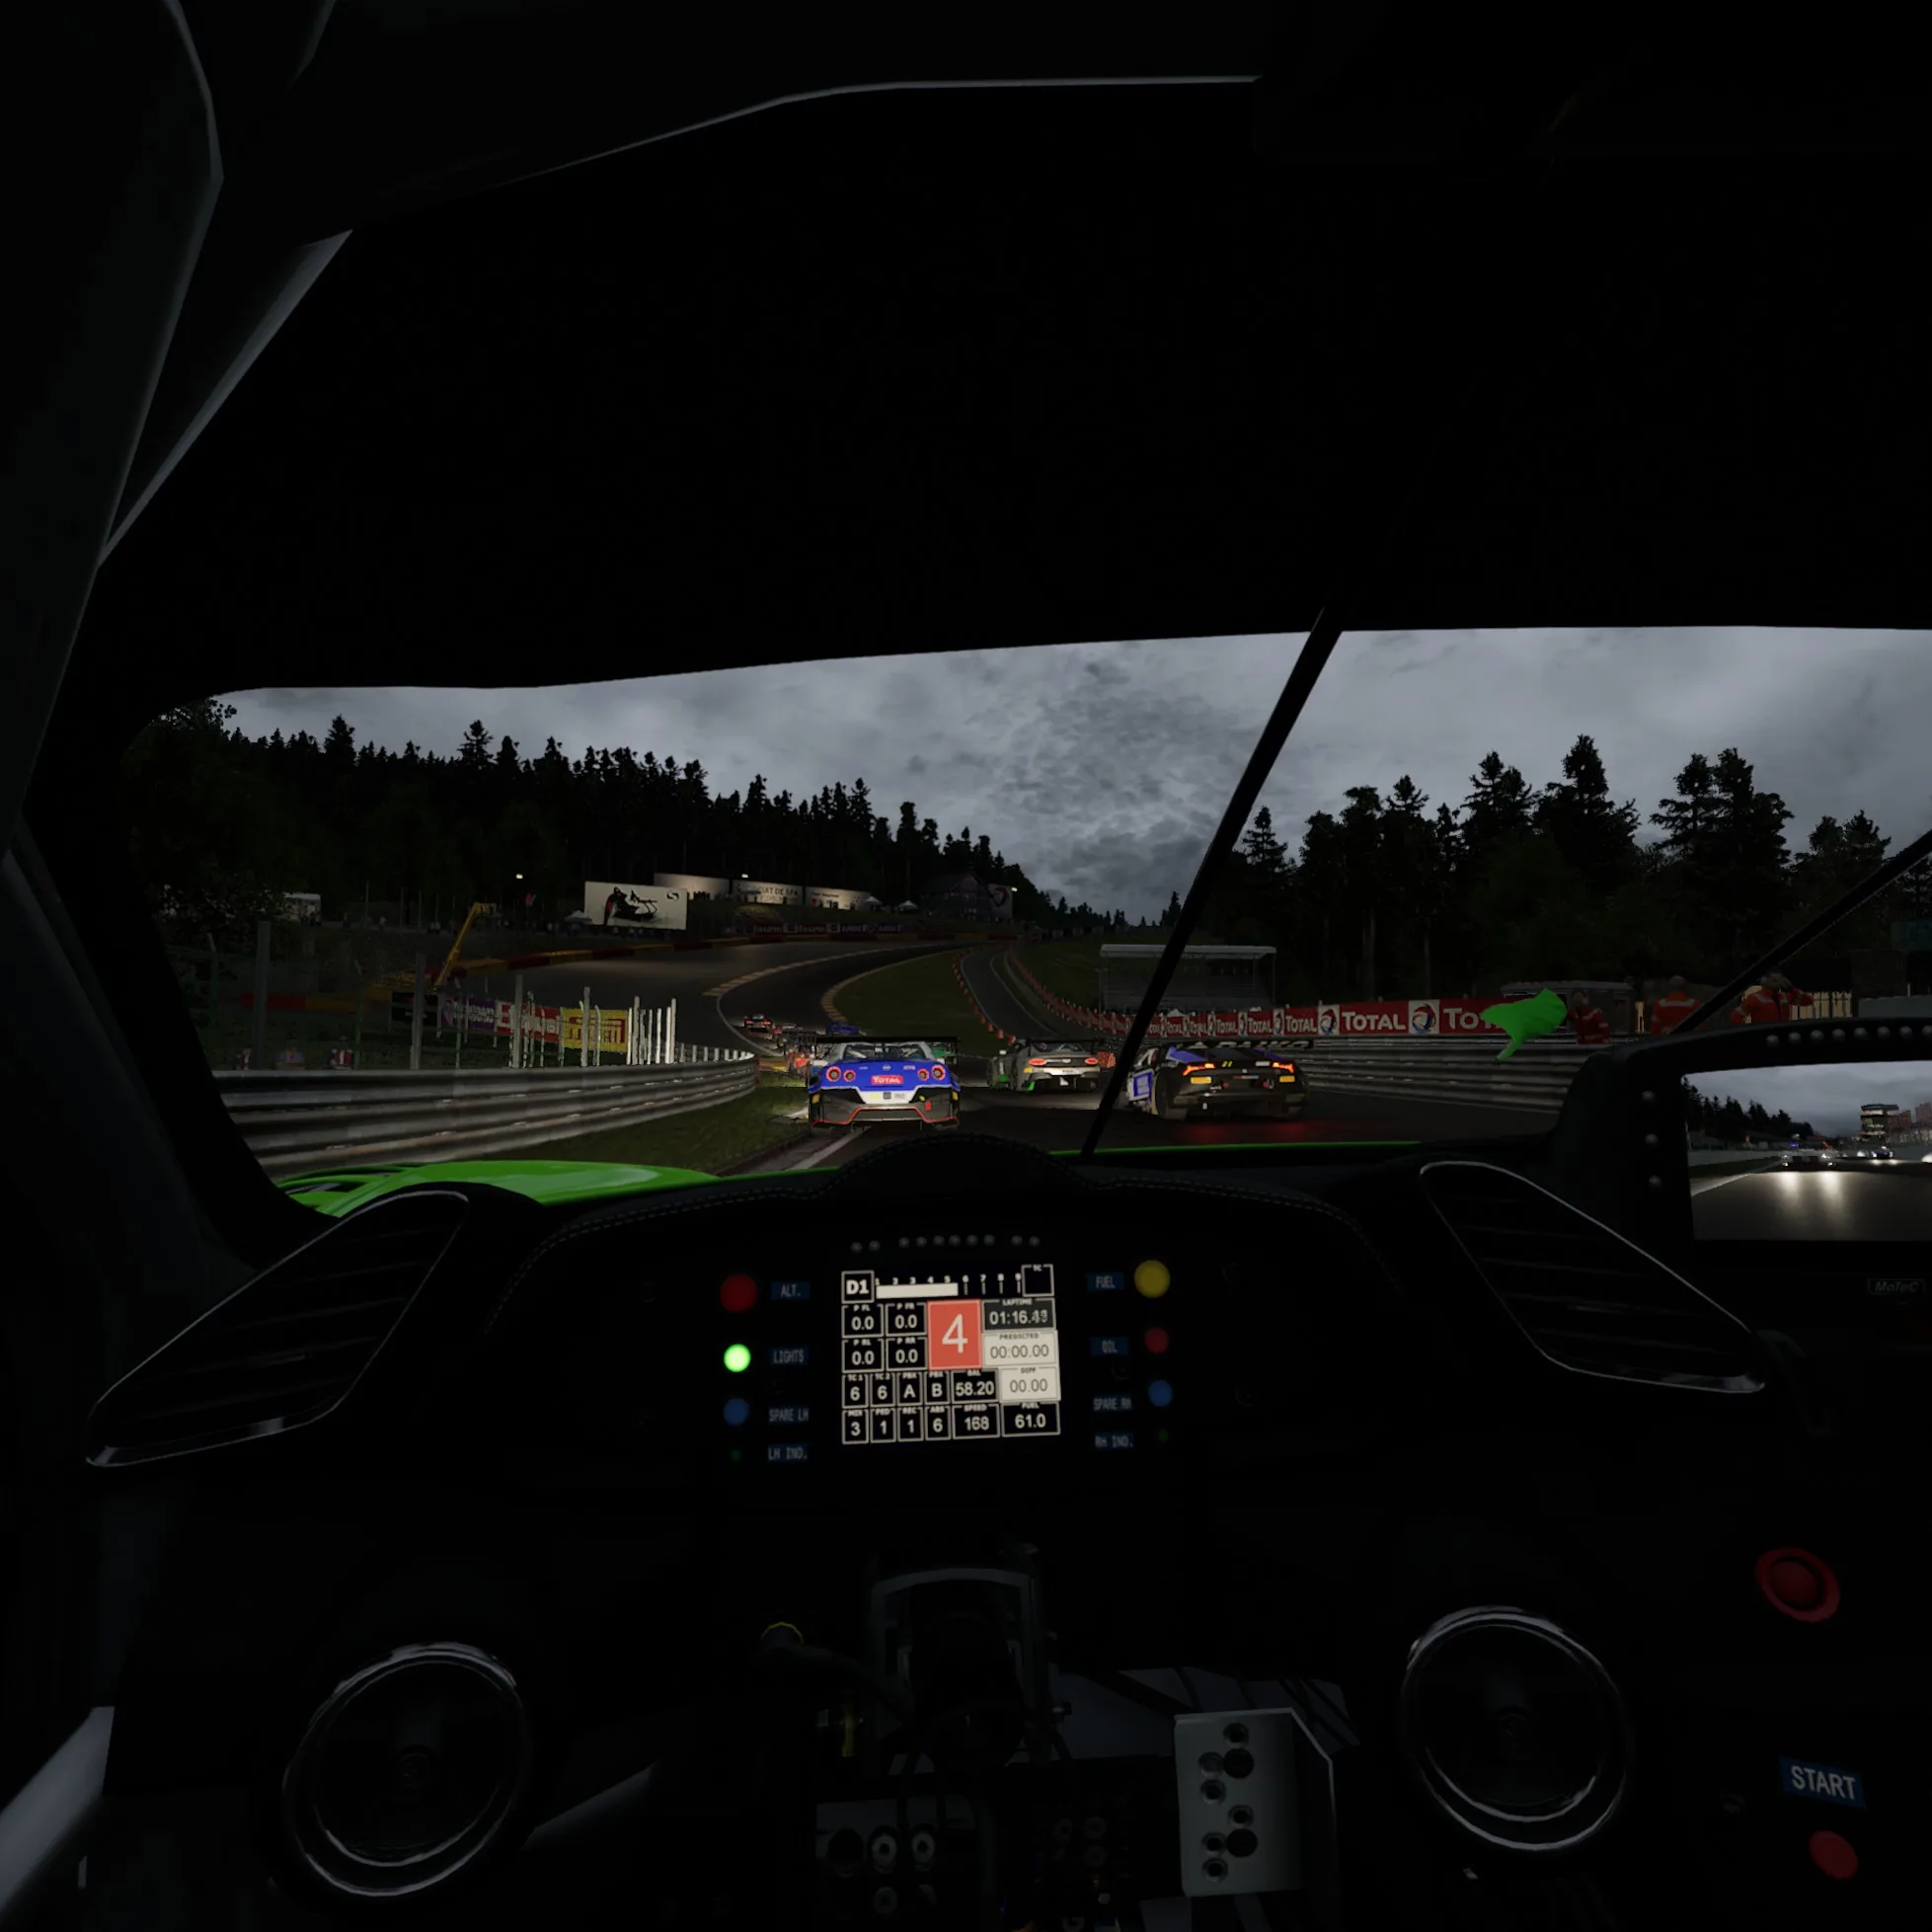
Assetto Corsa Competizione (ACC)
BTR’s sim/racing editor, Sean Kaldahl created the replay benchmark run that we use for both the pancake game and the VR game. It is run at night with 20 cars, lots of geometry, and the lighting effects of the headlights, tail lights, and everything around the track looks spectacular.
VR Low
Here are the ACC frametimes using VR Low.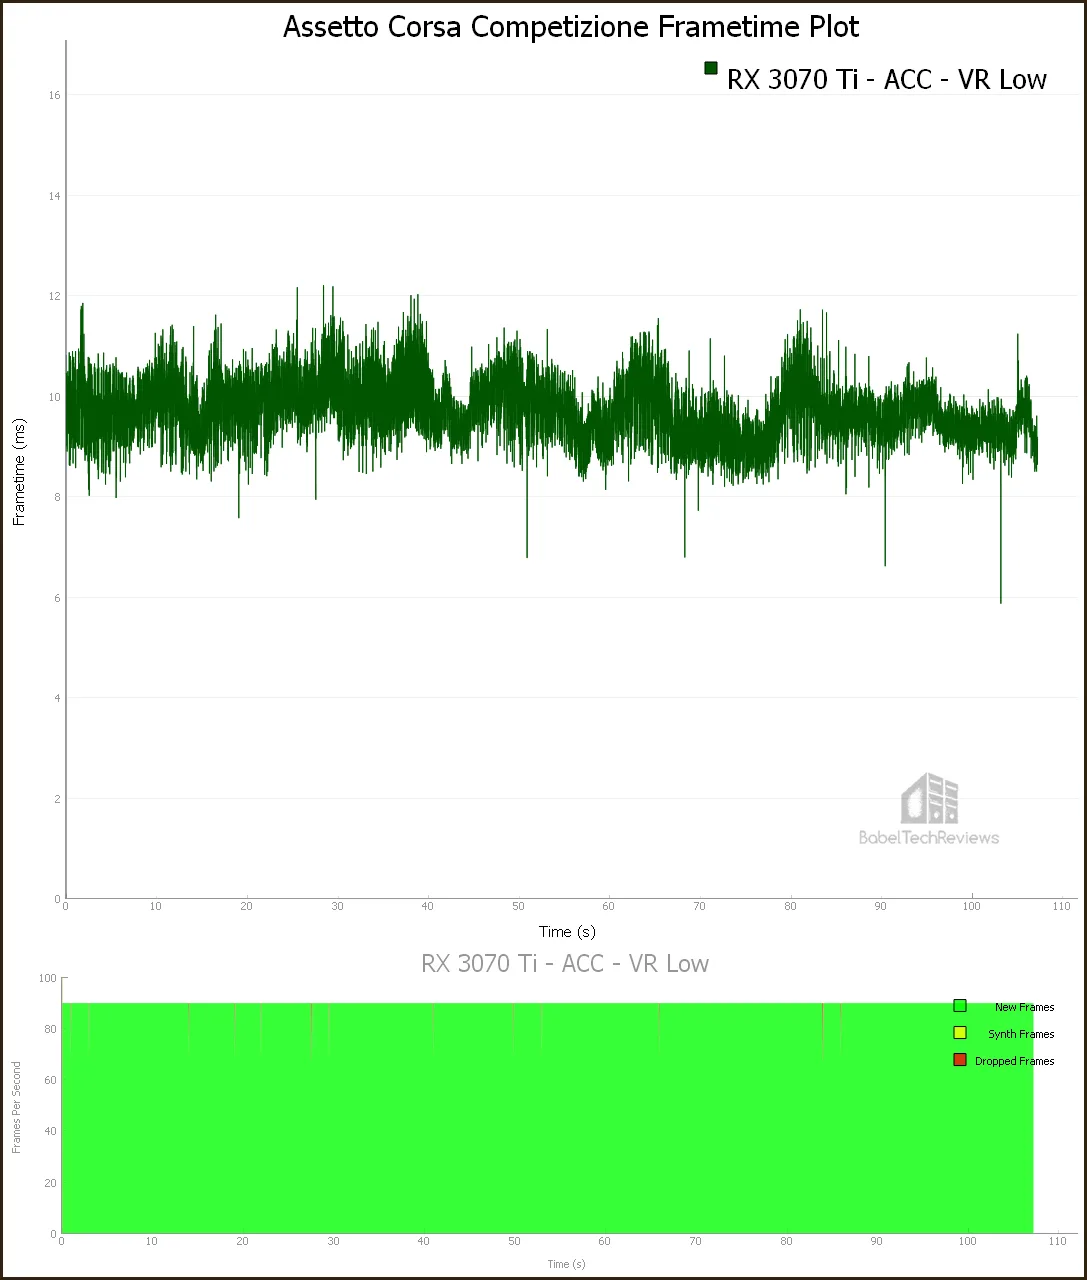
Here are the details are reported by FCAT-VR:
The RTX 3070 Ti delivered 102.85 unconstrained FPS with 15 dropped or synthesized frames and no Warp misses.
The RTX 3070 Ti has a little performance headroom and it is possible to play it using enhanced individual settings with minimal reprojected or synthesized frames but it is best suited for playing ACC on VR Low. VR High is unplayable.
Next, we check out Elite Dangerous.
Elite Dangerous (ED)
Elite Dangerous is a popular space sim built using the COBRA engine. It is hard to find a repeatable benchmark outside of the training missions.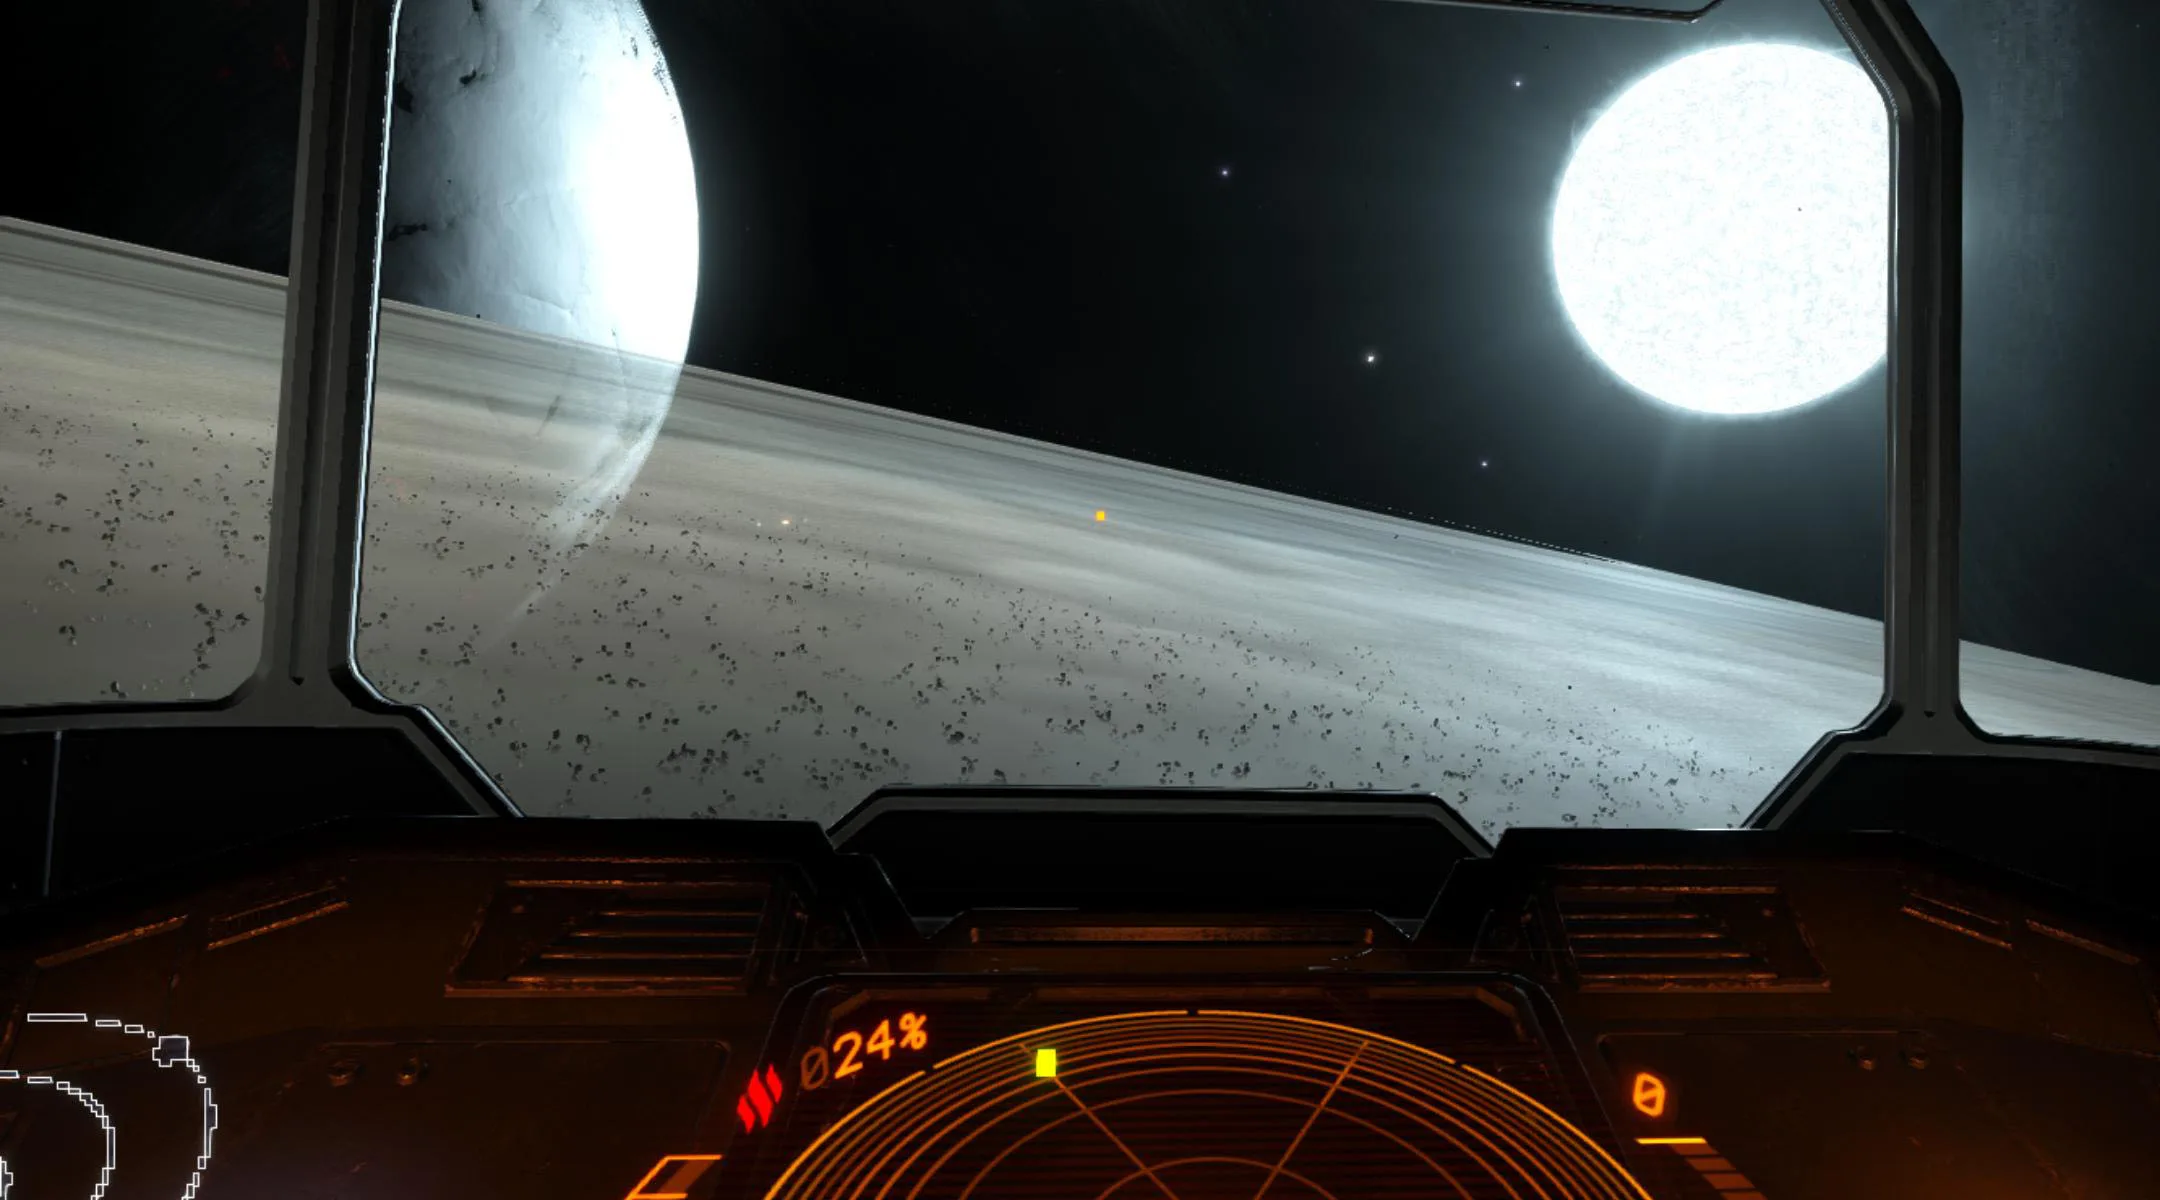
A player will probably spend a lot of time piloting his space cruiser while completing a multitude of tasks as well as visiting space stations and orbiting a multitude of different planets (~400 billion). Elite Dangerous is also co-op and multiplayer with a very dedicated following of players.
We picked the Ultra Preset with the maximum FoV originally but the shimmering and artifacting from reprojection/Motion Compensation was awful, so we set everything to Medium leaving the FoV at maximum. Here is the frametime plot.
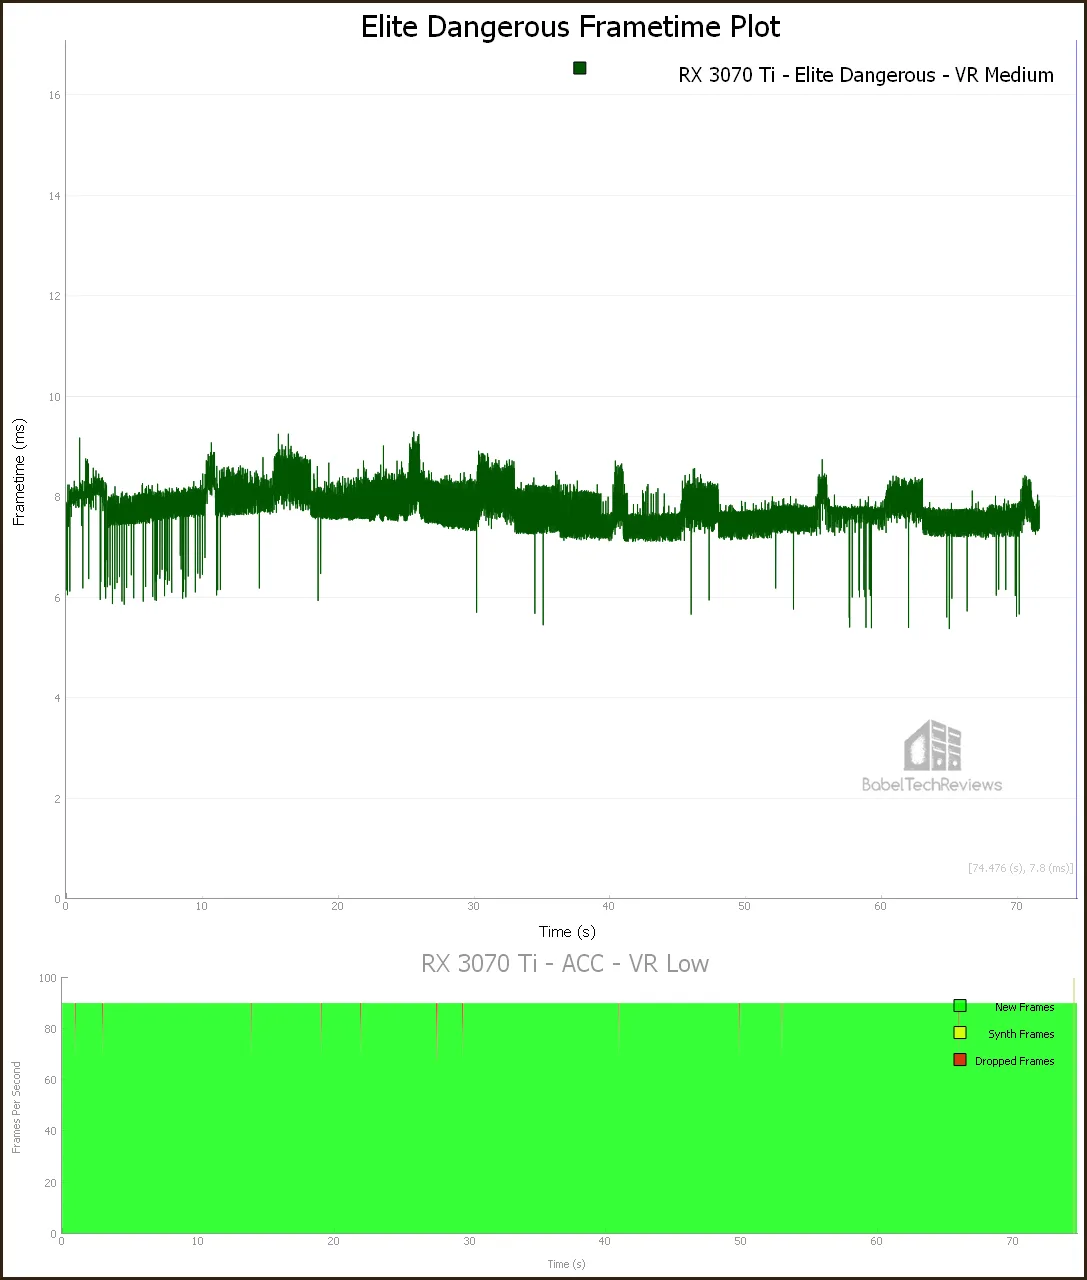 Here are the frametimes.
 Here are the details as reported by FCAT-VR:
The RTX 3070 Ti delivered 128.79 unconstrained FPS with no Warp Misses nor any dropped or synthetic frames.
The experience playing Elite Dangerous at Ultra settings is awful but Medium seems perfect with some performance headroom to increase individual settings.
Next, we will check out a really demanding VR game, No Man’s Sky.
No Man’s Sky
No Man’s Sky is an action-adventure survival single and multiplayer game that emphasizes survival, exploration, fighting, and trading. It is set in a procedurally generated deterministic open universe, which includes over 18 quintillion unique planets using its own custom game engine.
The player takes the role of a Traveller in an uncharted universe by starting on a random planet with a damaged spacecraft equipped with only a jetpack-equipped exosuit and a versatile multi-tool that can also be used for defense. The player is encouraged to find resources to repair his spacecraft allowing for intra- and inter-planetary travel, and to interact with other players.
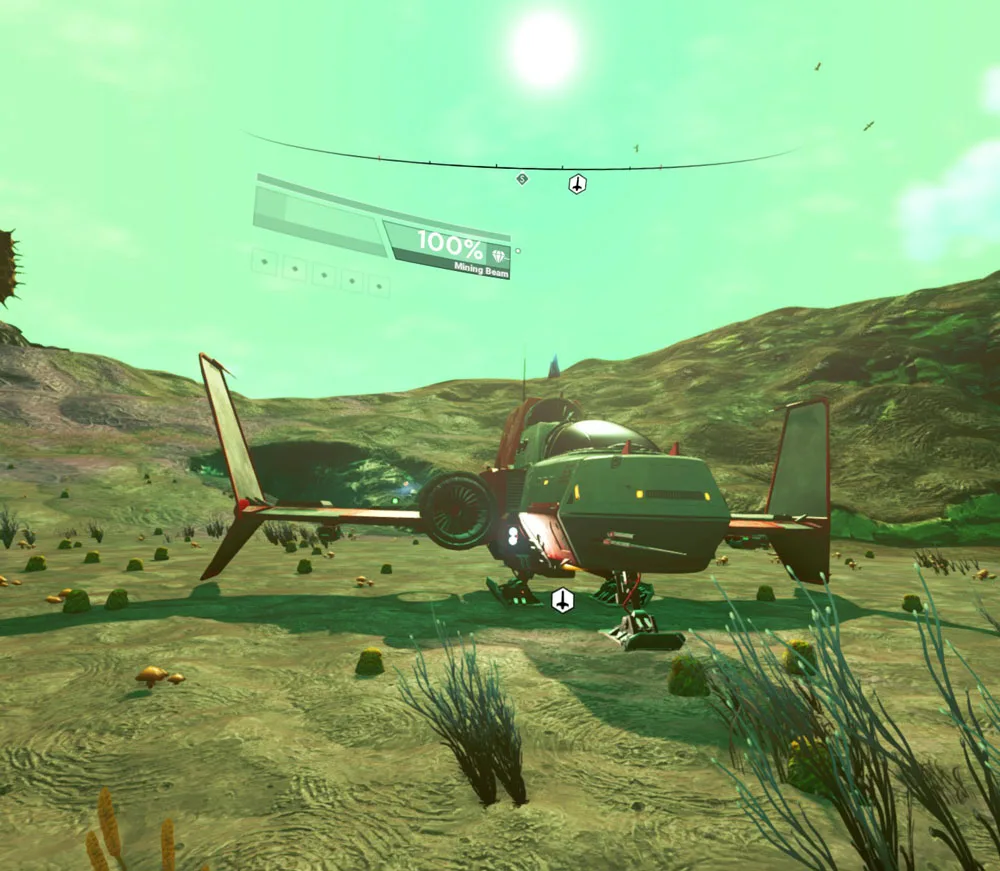
We set the settings to Enhanced which is above Low and below High, but we also set the anisotropic filtering to 16X and upgraded to FXAA+TAA. The game has recently implemented DLSS 2.1 and we used the highest visual quality preset, Quality which gives a much smaller performance boost than the others DLSS settings.
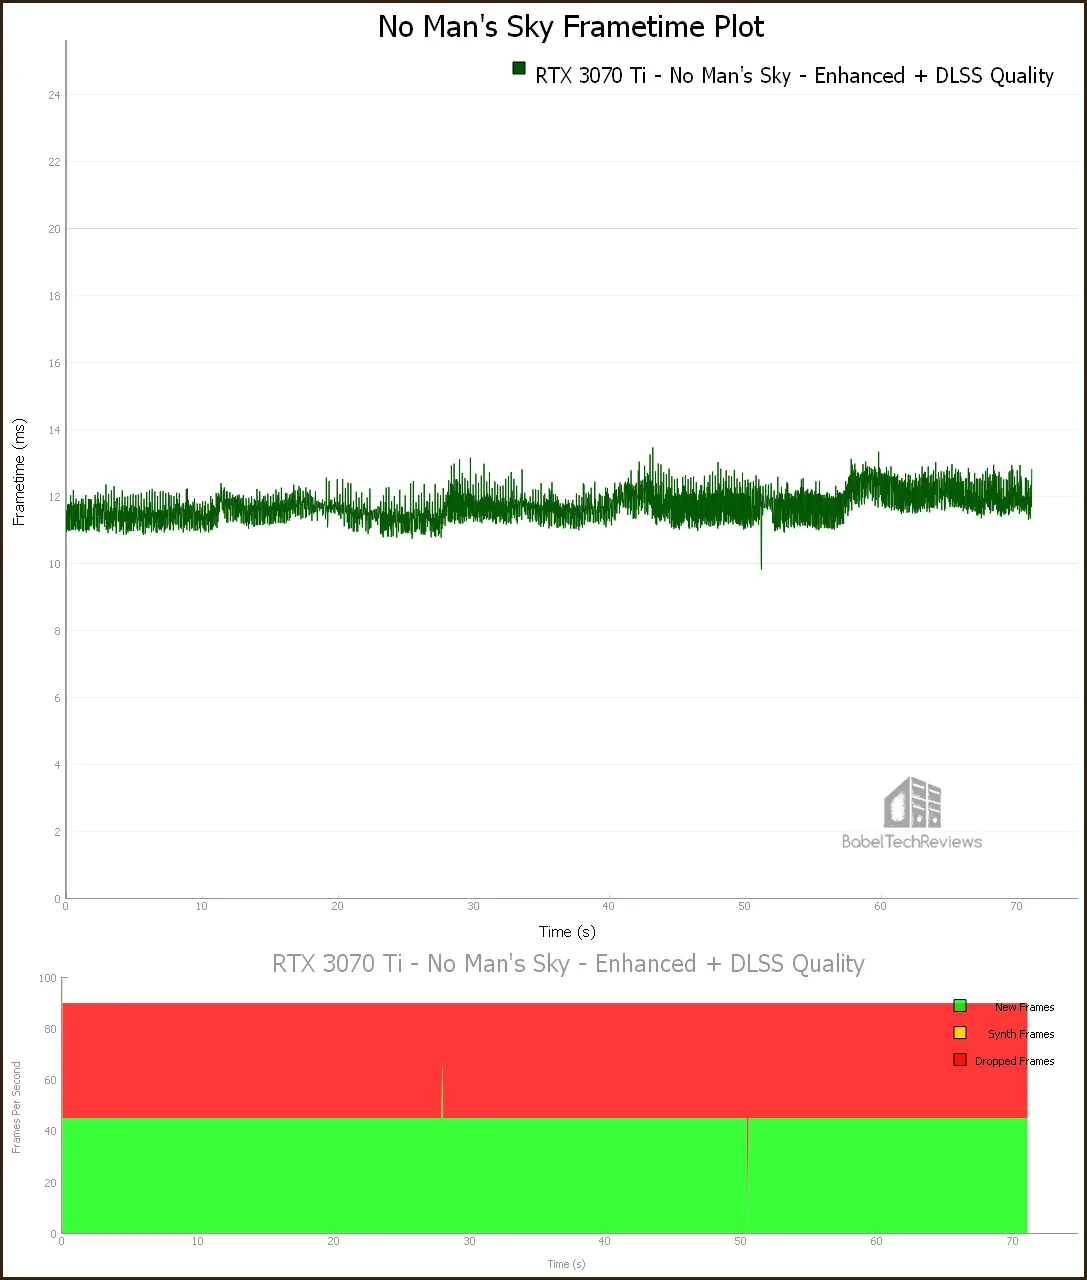
Here is the No Man’s Sky Frametime plot.
 Here are the FCAT-VR details of our comparative runs.
The RTX 3070 Ti produced 85.37 unconstrained FPS with no dropped frames or Warp misses, but it required 3200 (50%) synthetic frames.
The Low Preset may be better suited for play with the RTX 3070 Ti, or else individual setting may be lowered to maintain a balance of performance to visuals. However, it may be best to use DLSS Performance instead and accept a slight artifacting. We were very impressed with the Enhanced preset using DLSS Quality, and the high resolution screen of the Vive Pro 2 makes playing this game an even more extraordinary experience where the game comes more alive.
Let’s continue with another demanding VR game, Project CARS 2, that we still like better than its successor.
Project CARS 2 (PC2)
There is a real sense of immersion that comes from playing Project CARS 2 in VR using a wheel and pedals. It uses its in-house Madness engine, and the physics implementation is outstanding. We are disappointed with Project CARS 3, and will continue to use the older game instead for VR benching.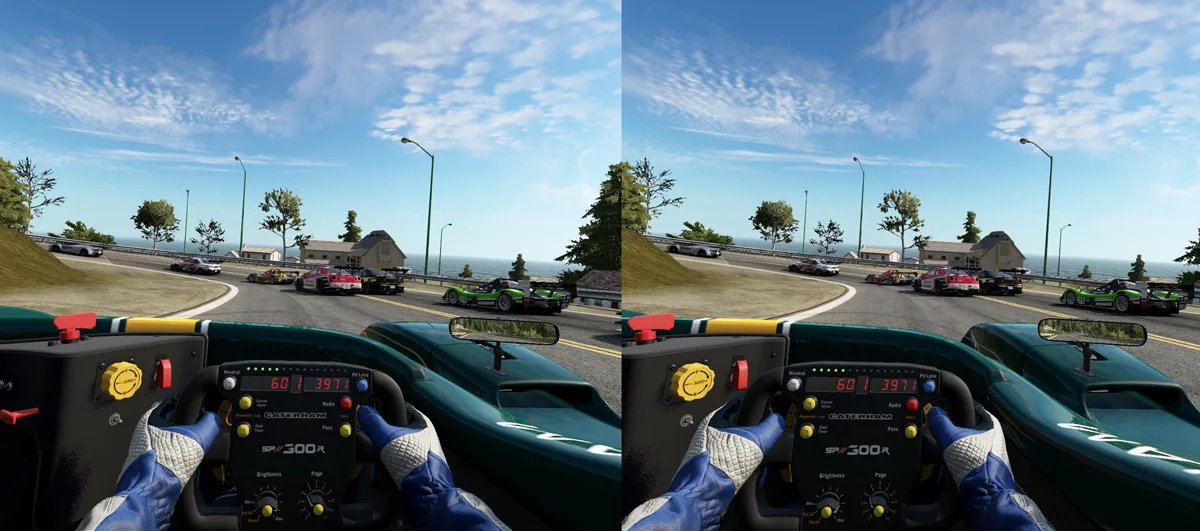
Project CARS 2 offers many performance options and settings and we prefer playing with SMAA rather than to use MSAA.
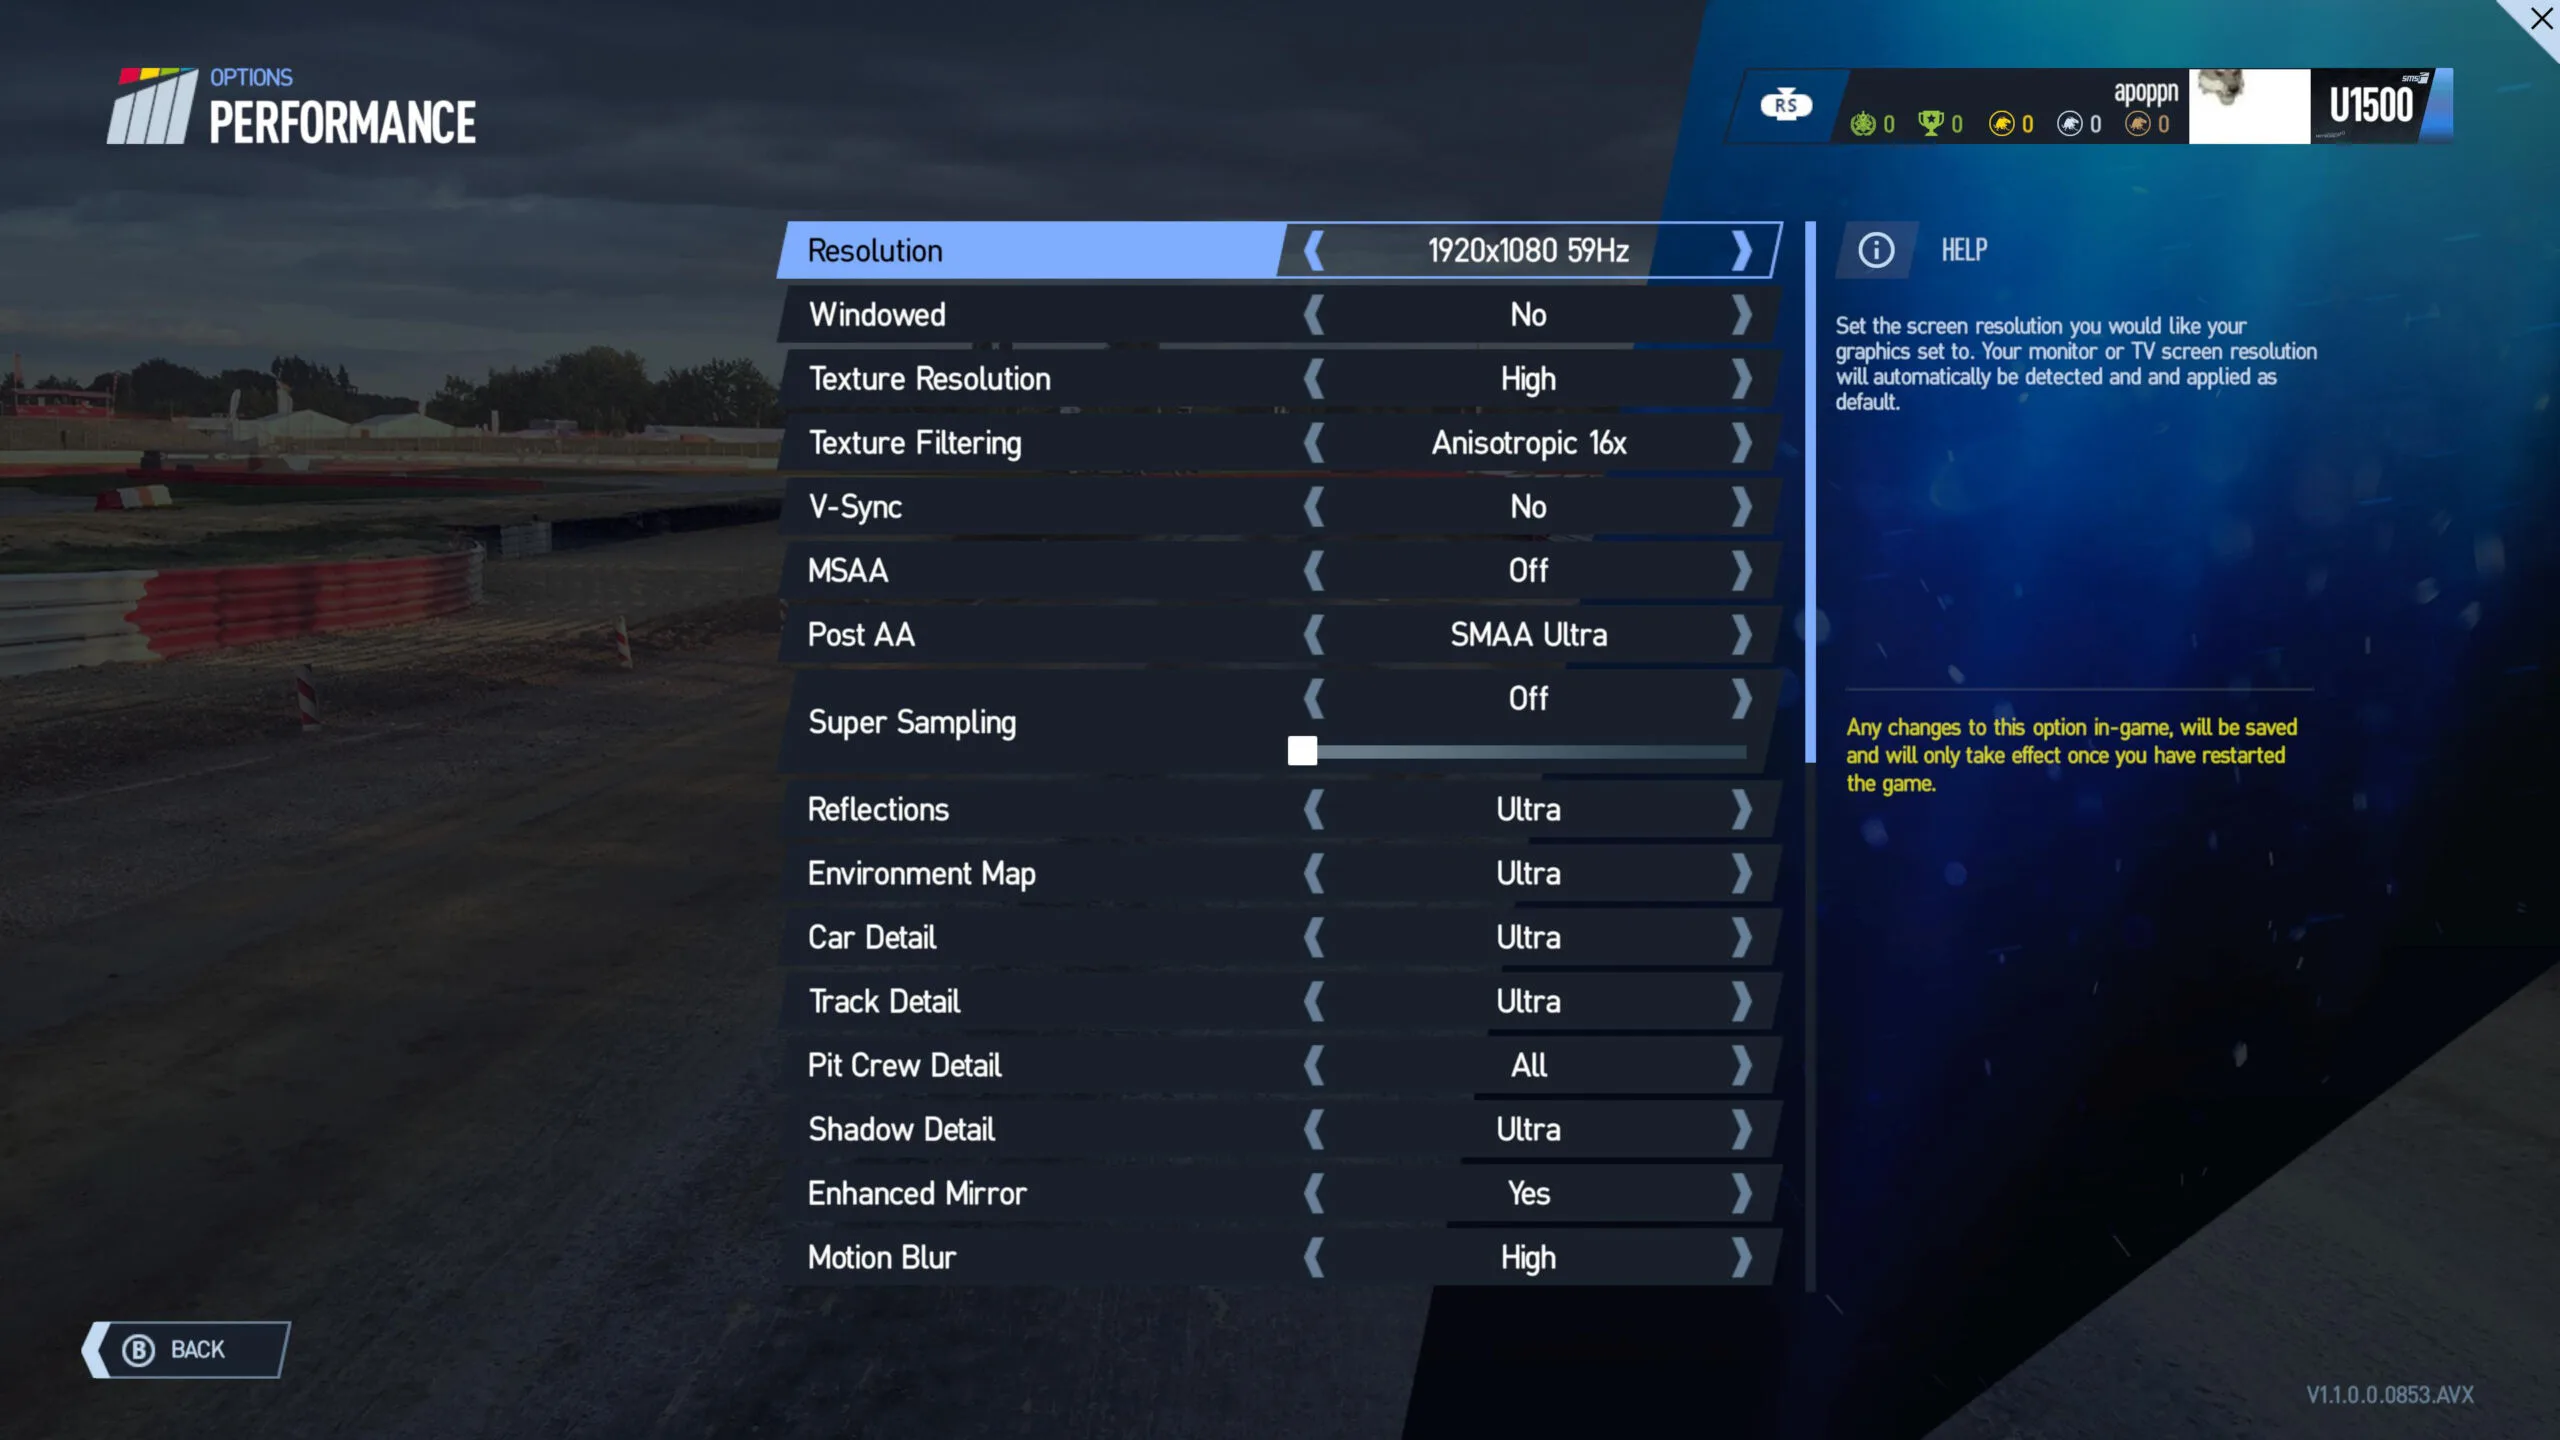
We originally tried maximum settings including for Motion Blur but that wasn’t possible so we set everything to Medium.
Here is the frametime plot.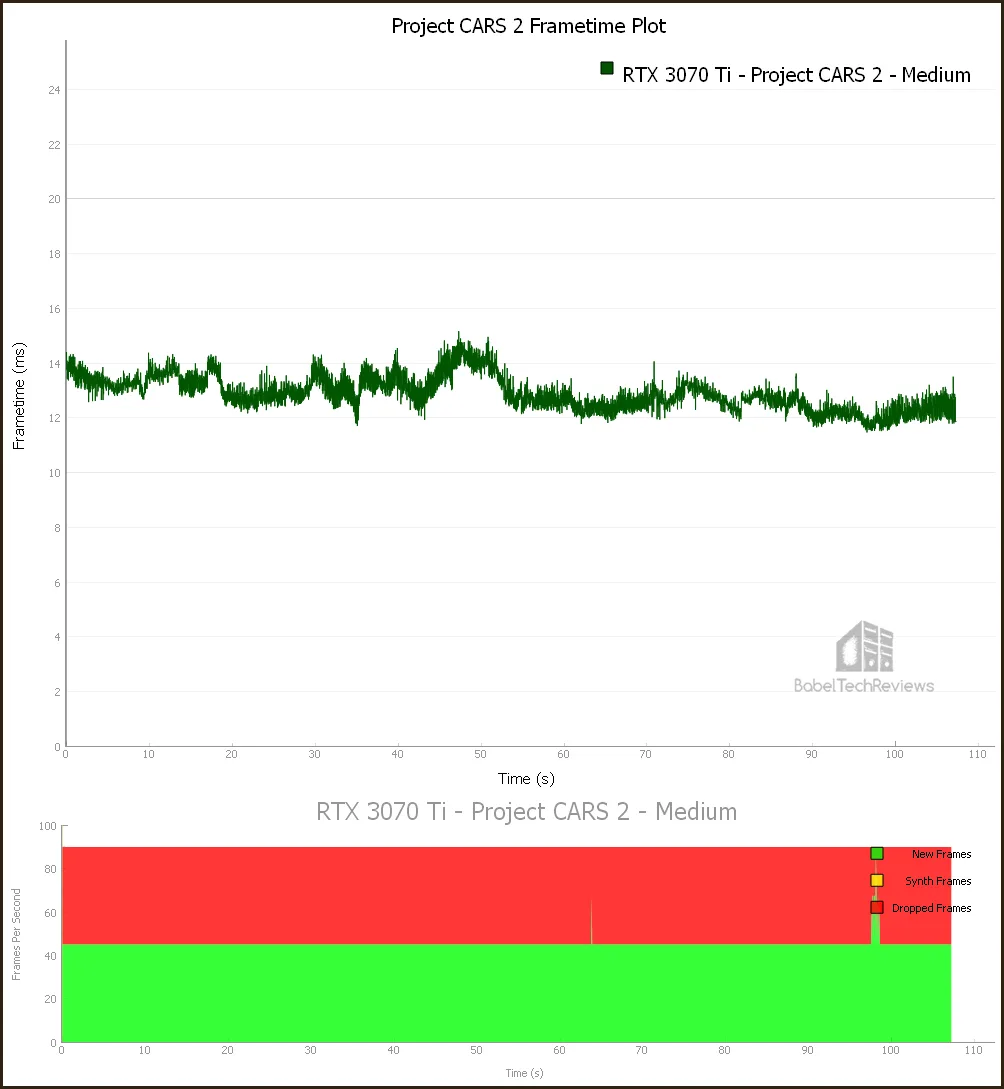 Here are the FCAT-VR details.
The RTX 3070 Ti delivered 77.49 unconstrained FPS with 4802 (50%) synthesized or dropped frames and with no Warp misses.
The experience playing Project CARS 2 on the Medium preset requires that we would recommend lowering individual settings or even lower the resolution a as needed to stay out of reprojection. However, even on Medium, the game looks great using the Vive Pro 2.
Let’s benchmark Skyrim VR.
Skyrim VR
Skyrim VR is an older game that is no longer supported by Bethesda, but fortunately the modding community has adopted it. It is not as demanding as many of the newer VR ports so its performance is still very good on maxed-out settings using its Creation engine.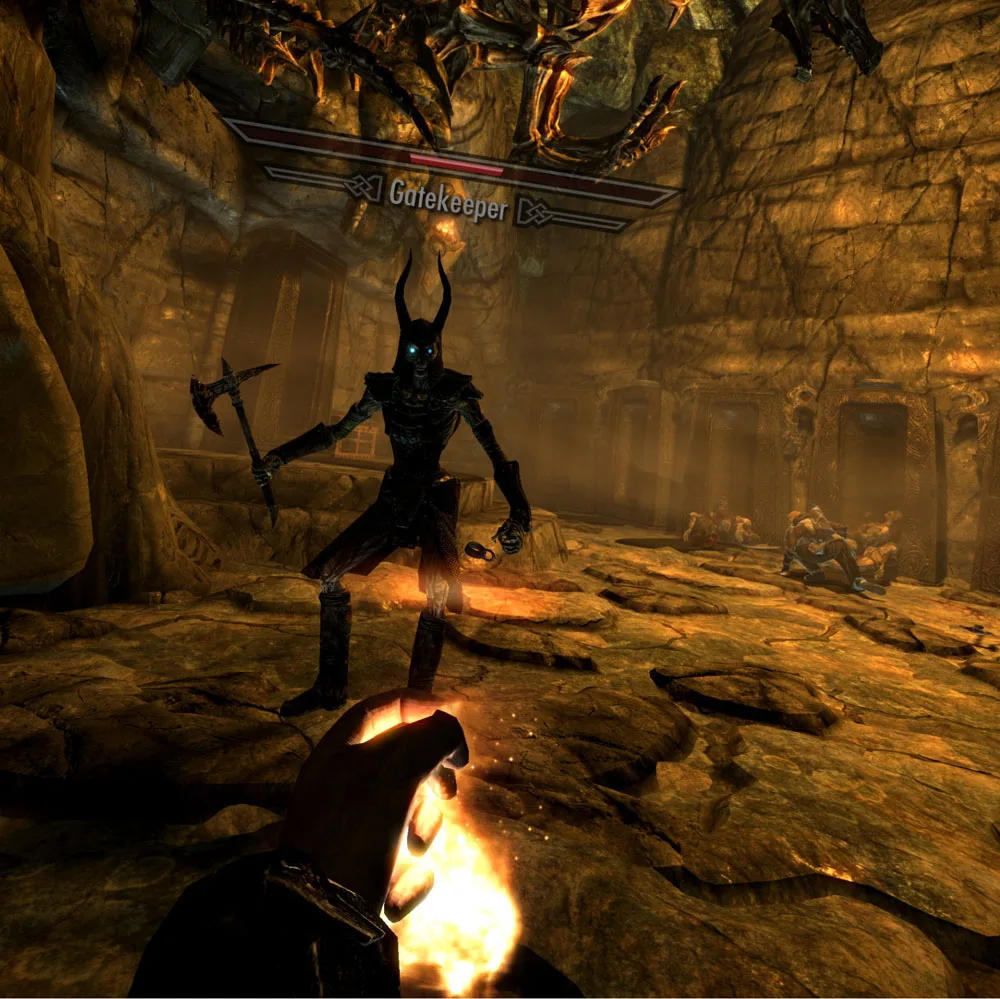
We benchmarked Skyrim VR using its highest settings, but we did not increase its in game supersampling.
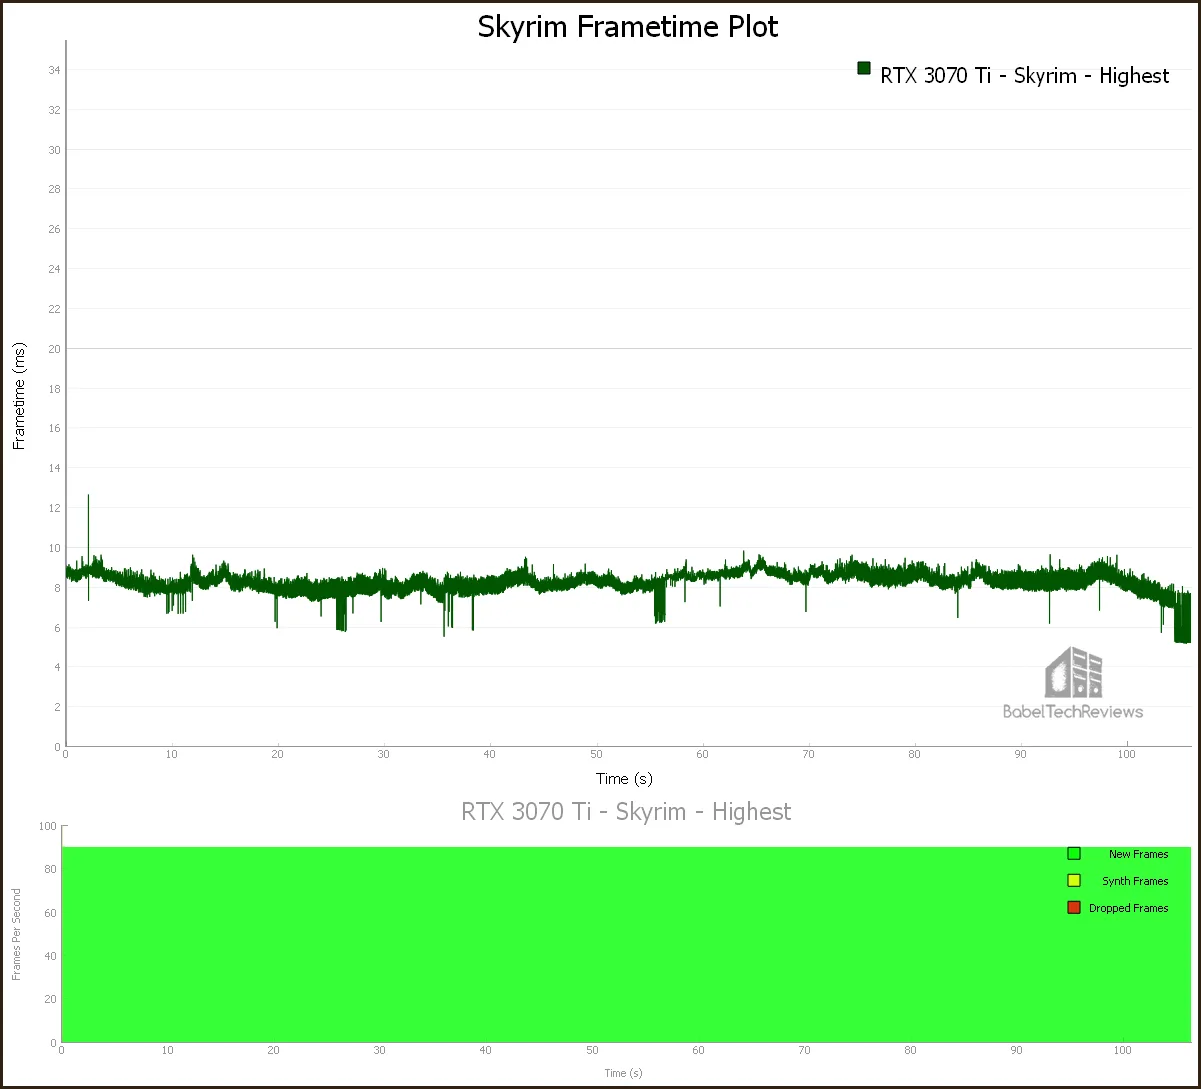 Here are the frametime results.
The RTX 3070 Ti managed 130.68 unconstrained FPS with no dropped frames, no synthetic frames, and no Warp misses.
The RTX 3070 Ti can play Skyrim at its maxed out in-game settings although we did not benchmark in-game Supersampling since we saw reprojecting or synthesized frames. Since there is some performance headroom, it suggests to us that mods may be used with the Vive Pro 2 and a RTX 3070 Ti class of video card.
These benchmarks results bring up more questions than answers that we hope to cover in a follow up review dedicated to the Vive Pro 2 next week. However, we love the Pro 2 and have ordered our own headset and will keep it for future VR benchmarking.
To see if the RTX 3070 Ti is a good upgrade from the other video cards we test workstation, creative, and GPGPU benchmarks starting with Blender.
Blender 2.92 Benchmark
Blender is a very popular open source 3D content creation suite. It supports every aspect of 3D development with a complete range of tools for professional 3D creation.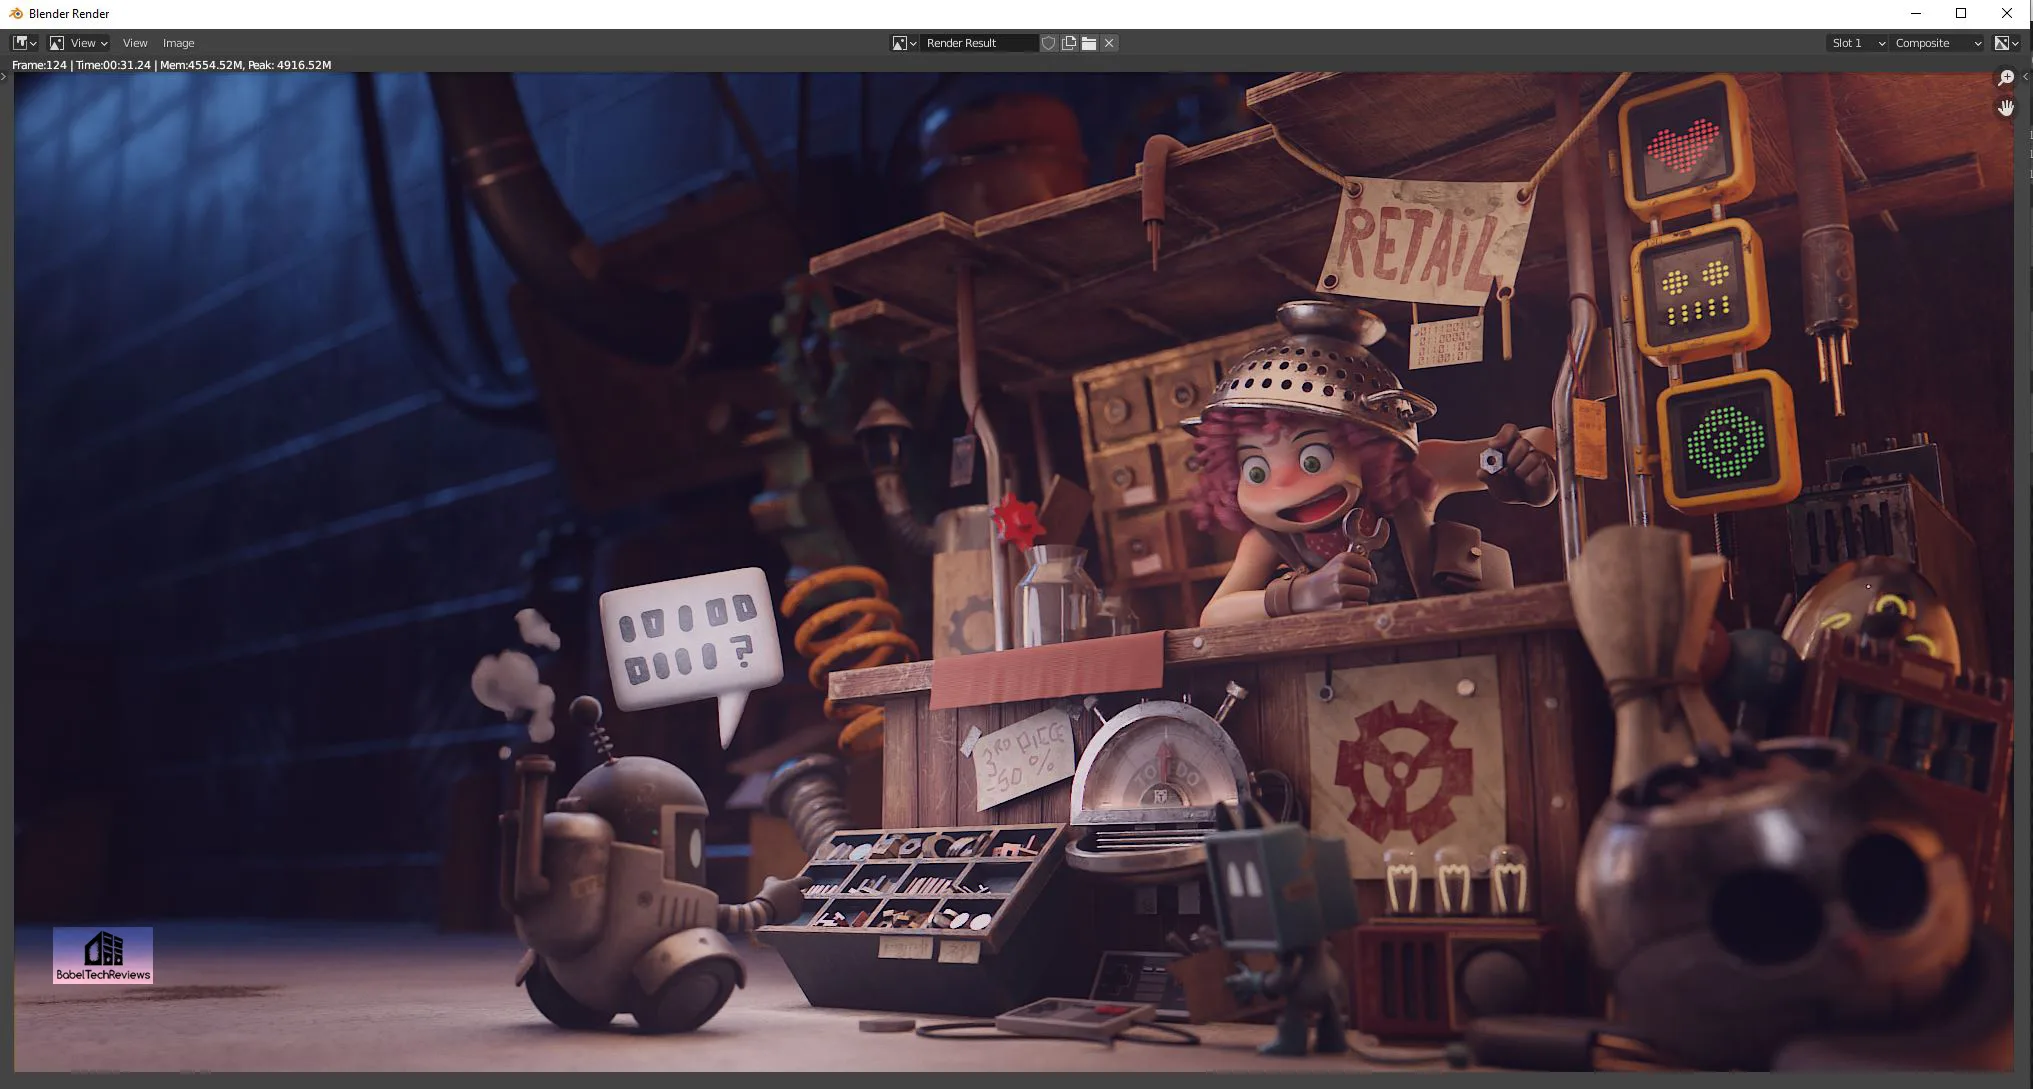
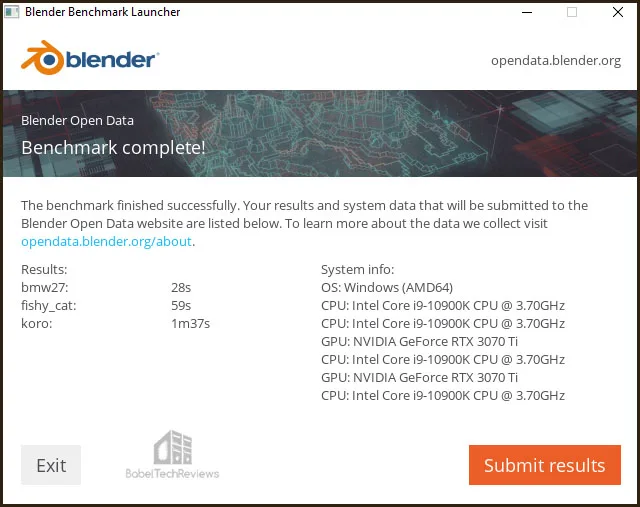
We benchmarked three Blender 2.92 benchmarks which measure GPU performance by timing how long it takes to render production files. We tested seven of our comparison cards with both CUDA and Optix running on the GPU instead of using the CPU. We benchmarked the RX 6800 XT and the RTX 3080 using OpenCL because Radeons do not support CUDA.
Here are the RTX 3070 Ti’s CUDA and OPTIX scores.
 For the following chart, lower is better as the benchmark renders a scene multiple times and gives the results in minutes and seconds.
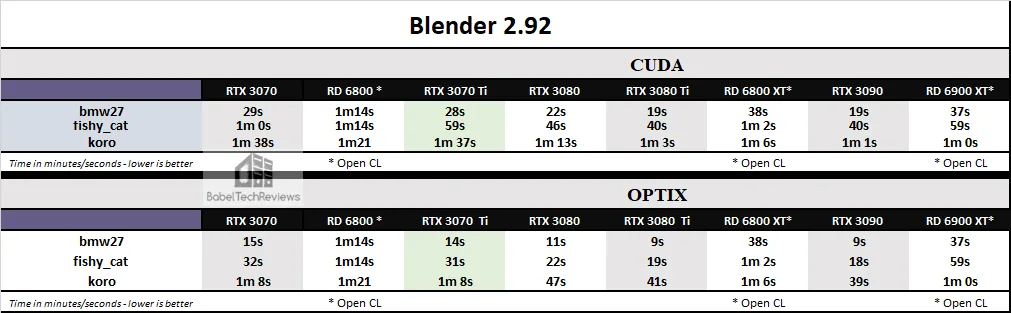
Blender’s benchmark performance is slower using the RTX 3070 Ti compared with the RTX 3080 and slightly faster than te RTX 3070.
Next we look at the OctaneBench.
Octane Bench
OctaneBench allows you to benchmark your GPU using OctaneRender. The hardware and software requirements to run OctaneBench are the same as for OctaneRender Standalone.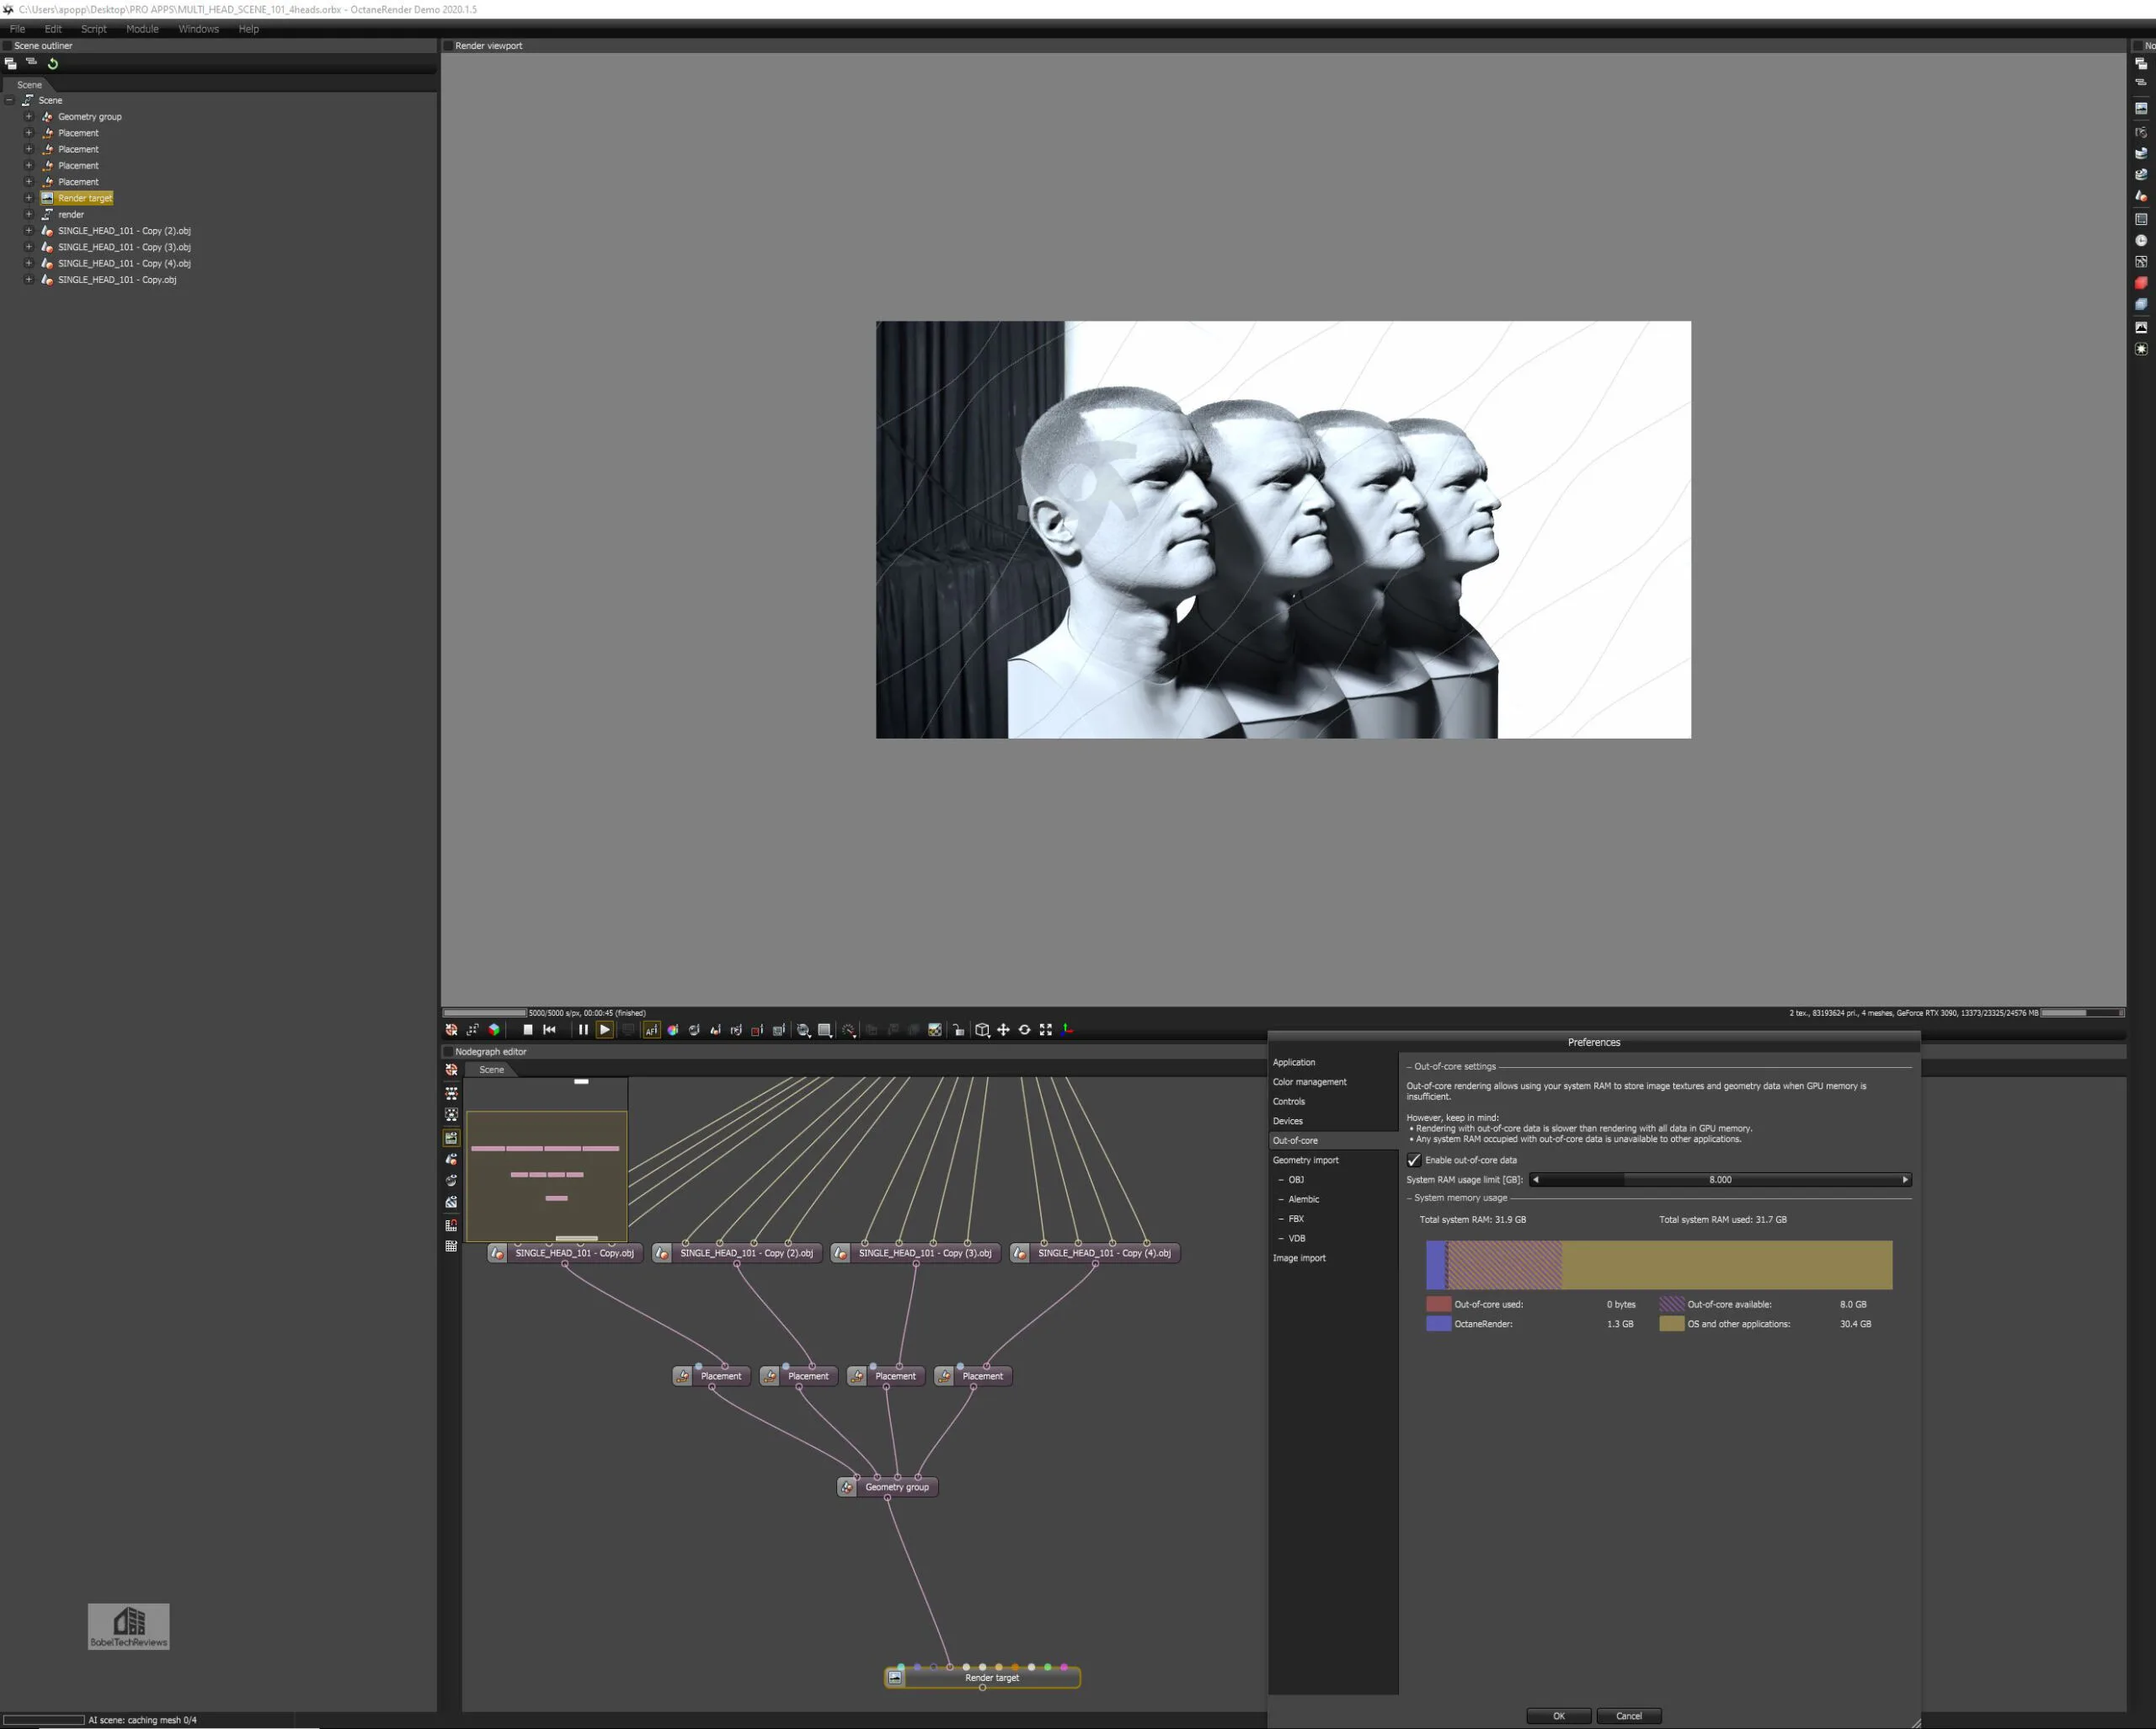
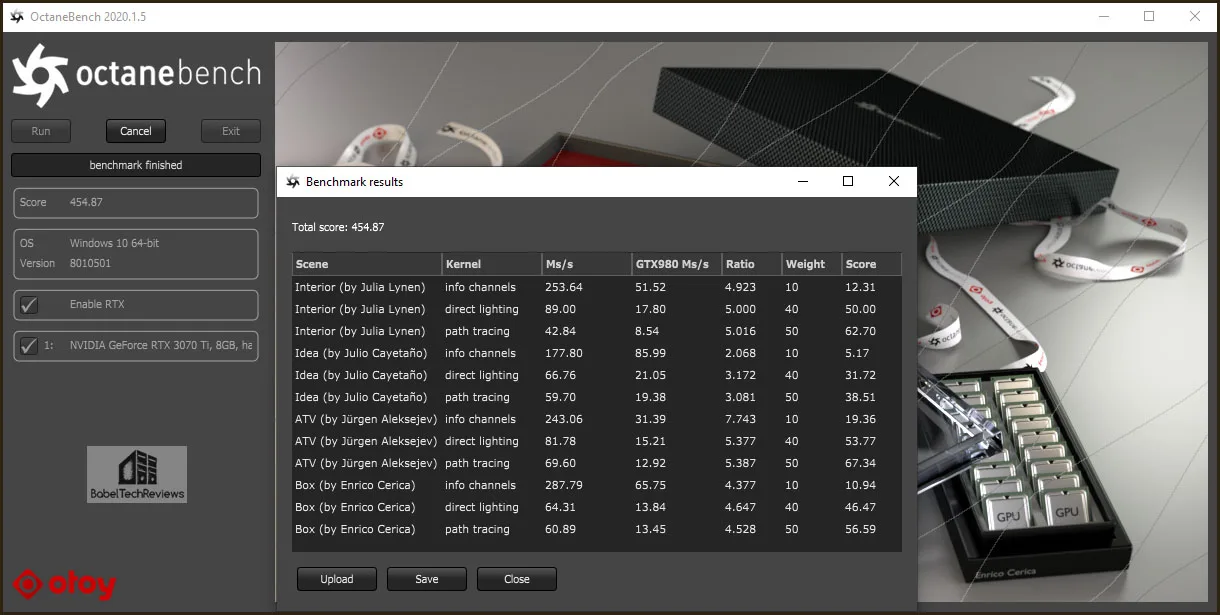
We run OctaneBench 2020.1.5 for Windows and here are the RTX 3070 Ti’s complete results with an overall score of 454.87.
Here is the summary chart comparing our five GeForce cards. Radeons cannot run the Octane benchmark.

The RTX 3070 Ti is a decent card when used for rendering but closer to the RTX 3070 in performance than the RTX 3080.
Next, we move on to AIDA64 GPGPU benchmarks.
AIDA64 v6.33
AIDA64 is an important industry tool for benchmarkers. Its GPGPU benchmarks measure performance and give scores to compare against other popular video cards.
AIDA64’s benchmark code methods are written in Assembly language, and they are well-optimized for every popular AMD, Intel, NVIDIA and VIA processor by utilizing the appropriate instruction set extensions. We use the Engineer’s full version of AIDA64 courtesy of FinalWire. AIDA64 is free to to try and use for 30 days.
Here are the RTX 3070 Ti AIDA64 GPGPU results.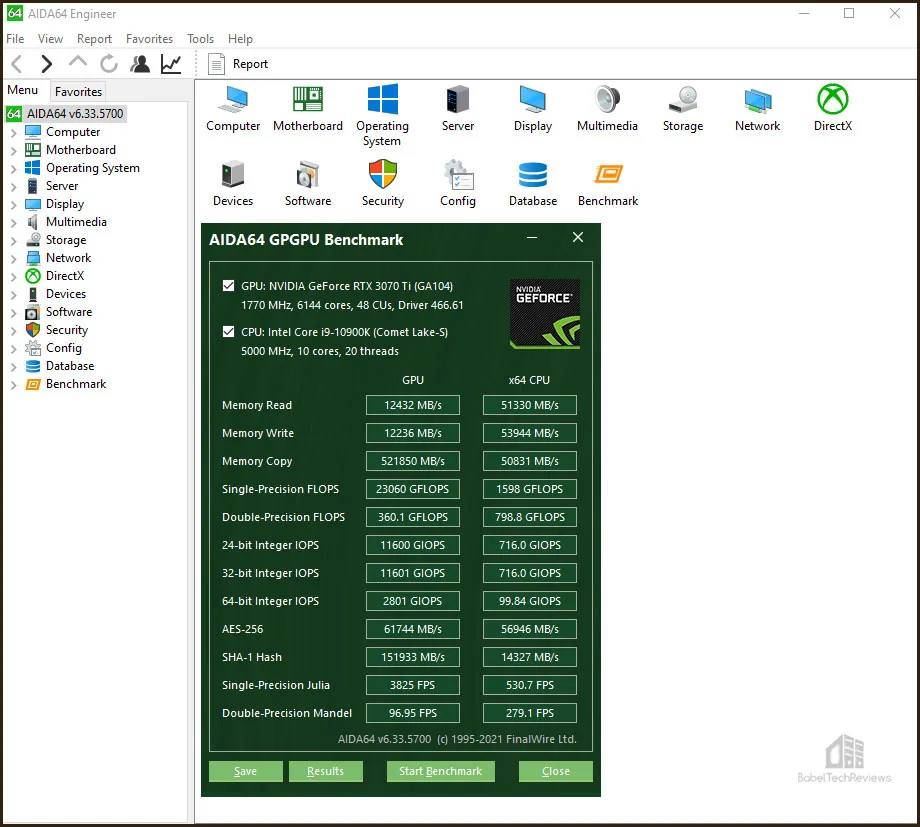
Here is the chart summary of the AIDA64 GPGPU benchmarks with seven of our competing cards side-by-side.
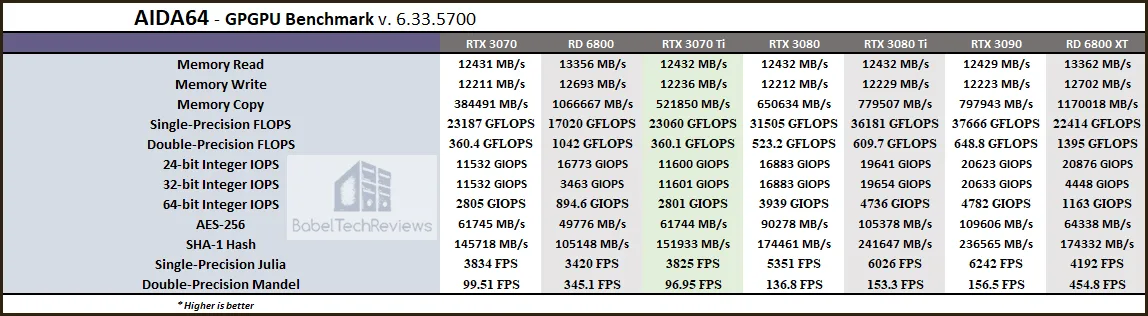
The RTX 3070 Ti is a fast GPGPU card that is slightly faster than the RTX 3070. So let’s look at Sandra 2020 next.
SiSoft Sandra 2020/21
To see where the CPU, GPU, and motherboard performance results differ, there is no better tool than SiSoft’s Sandra 2020. SiSoftware SANDRA (the System ANalyser, Diagnostic and Reporting Assistant) is a excellent information & diagnostic utility in a complete package. It is able to provide all the information about your hardware, software, and other devices for diagnosis and for benchmarking. Sandra is derived from a Greek name that implies “defender” or “helper”.
There are several versions of Sandra, including a free version of Sandra Lite that anyone can download and use. Sandra 2021 R2 is the latest version, and we are using the full engineer suite courtesy of SiSoft. Sandra 2020/21 features continuous multiple monthly incremental improvements over earlier versions of Sandra. It will benchmark and analyze all of the important PC subsystems and even rank your PC while giving recommendations for improvement.
We ran Sandra’s intensive GPGPU benchmarks and charted the results summarizing them. There was a bug in one Processing benchmark that affected the Red Devil RX 6800 XT with OpenCL that was addressed by SiSoft by the time we tested the RX 6800.
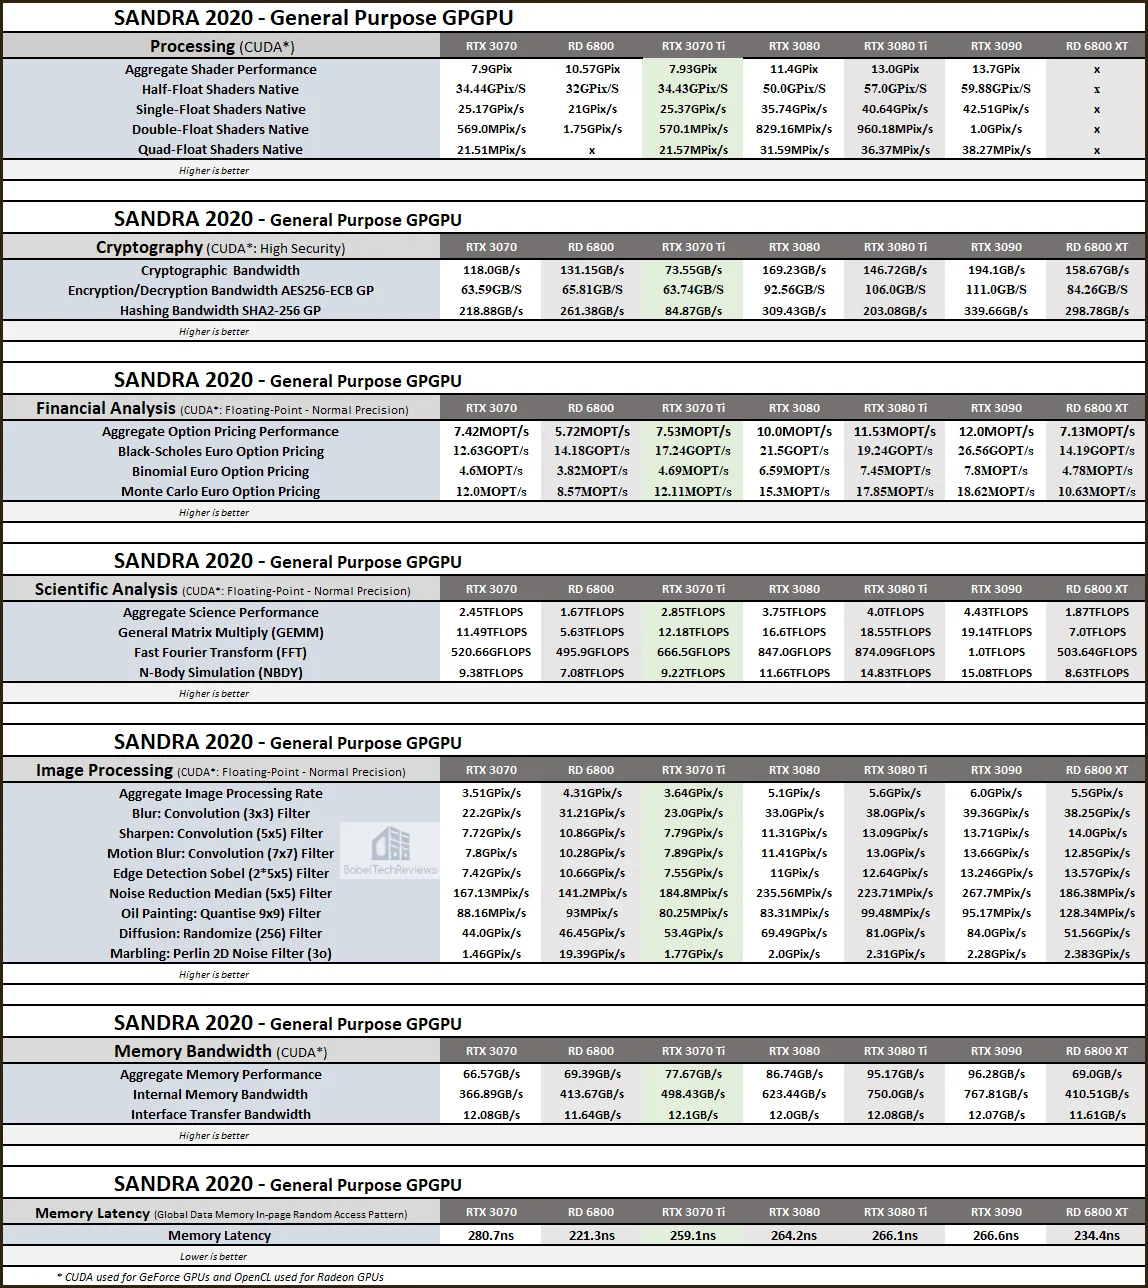
In Sandra GPGPU benchmarks, the RTX 3070 Ti is similar in performance to the RTX 3070. Interestingly, the RTX 3070 Ti (and RTX 3080 Ti’s) Hashing bandwidth is much lower than the RTX 3080/RTX 3070 and even the RX 6800 XT as NVIDIA has limited its cryptocurrency mining ability. However, since the architectures are different, each card exhibits different characteristics with different strengths and weaknesses.
SPECworkstation3 Benchmarks
All the SPECworkstation3 benchmarks are based on professional applications, most of which are in the CAD/CAM or media and entertainment fields. All of these benchmarks are free except for vendors of computer-related products and/or services.
The most comprehensive workstation benchmark is SPECworkstation3. It’s a free-standing benchmark which does not require ancillary software. It measures GPU, CPU, storage and all other major aspects of workstation performance based on actual applications and representative workloads. We only tested the GPU-related workstation performance as checked in the image above.
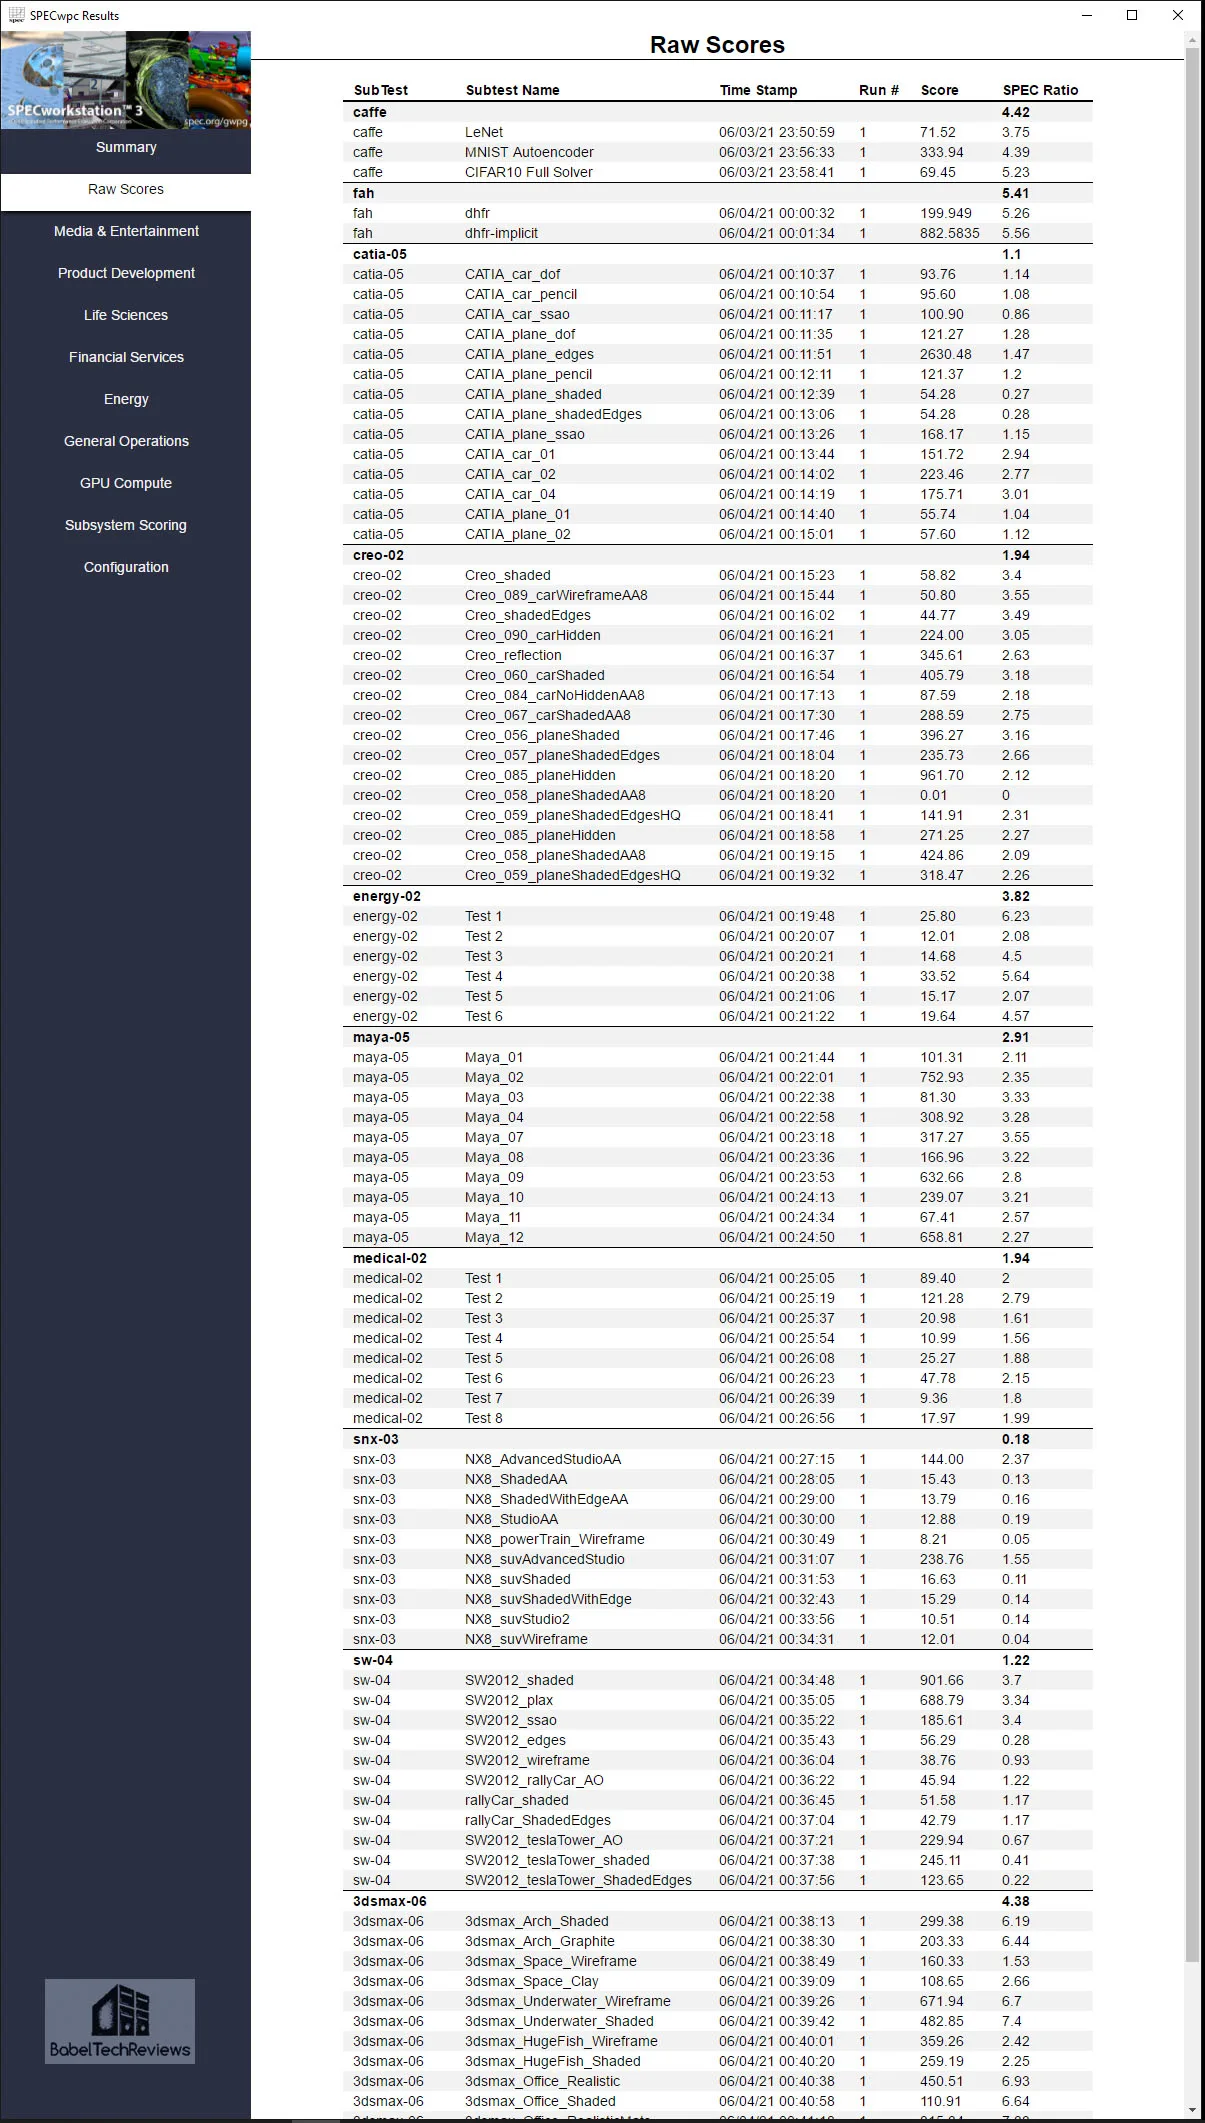
Here are our raw SPECworkstation 3.0.4.summary and raw scores for the RTX 3070 Ti.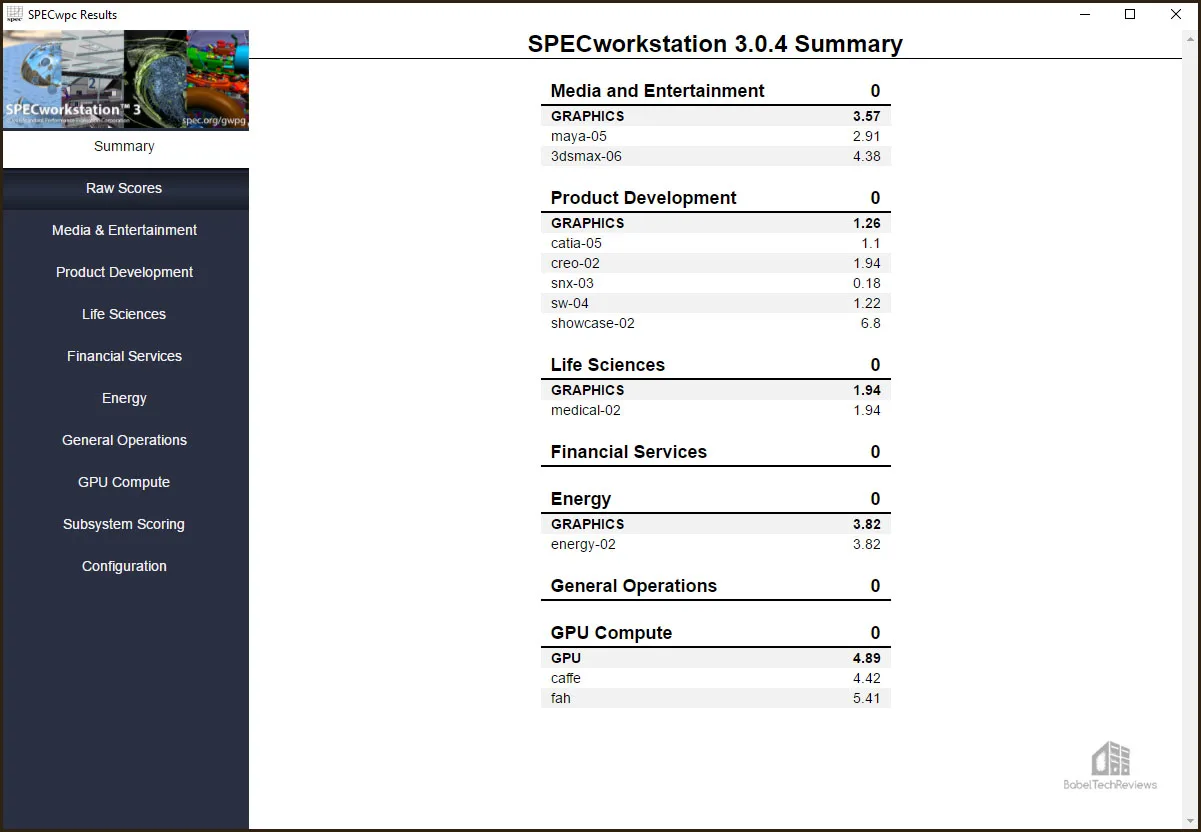

Here are the SPECworkstation3 results summarized in a chart along with six competing cards. Higher is better.
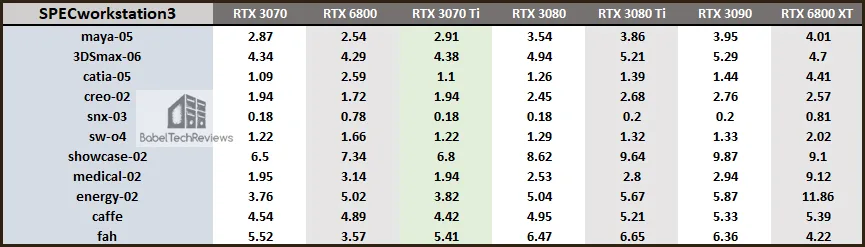
Using SPEC benchmarks, the RTX 3070 Ti is closer in performance to the RTX 3070 than it is to the RTX 3080. However, since the architectures are different, the cards each exhibit different characteristics with different strengths and weaknesses.
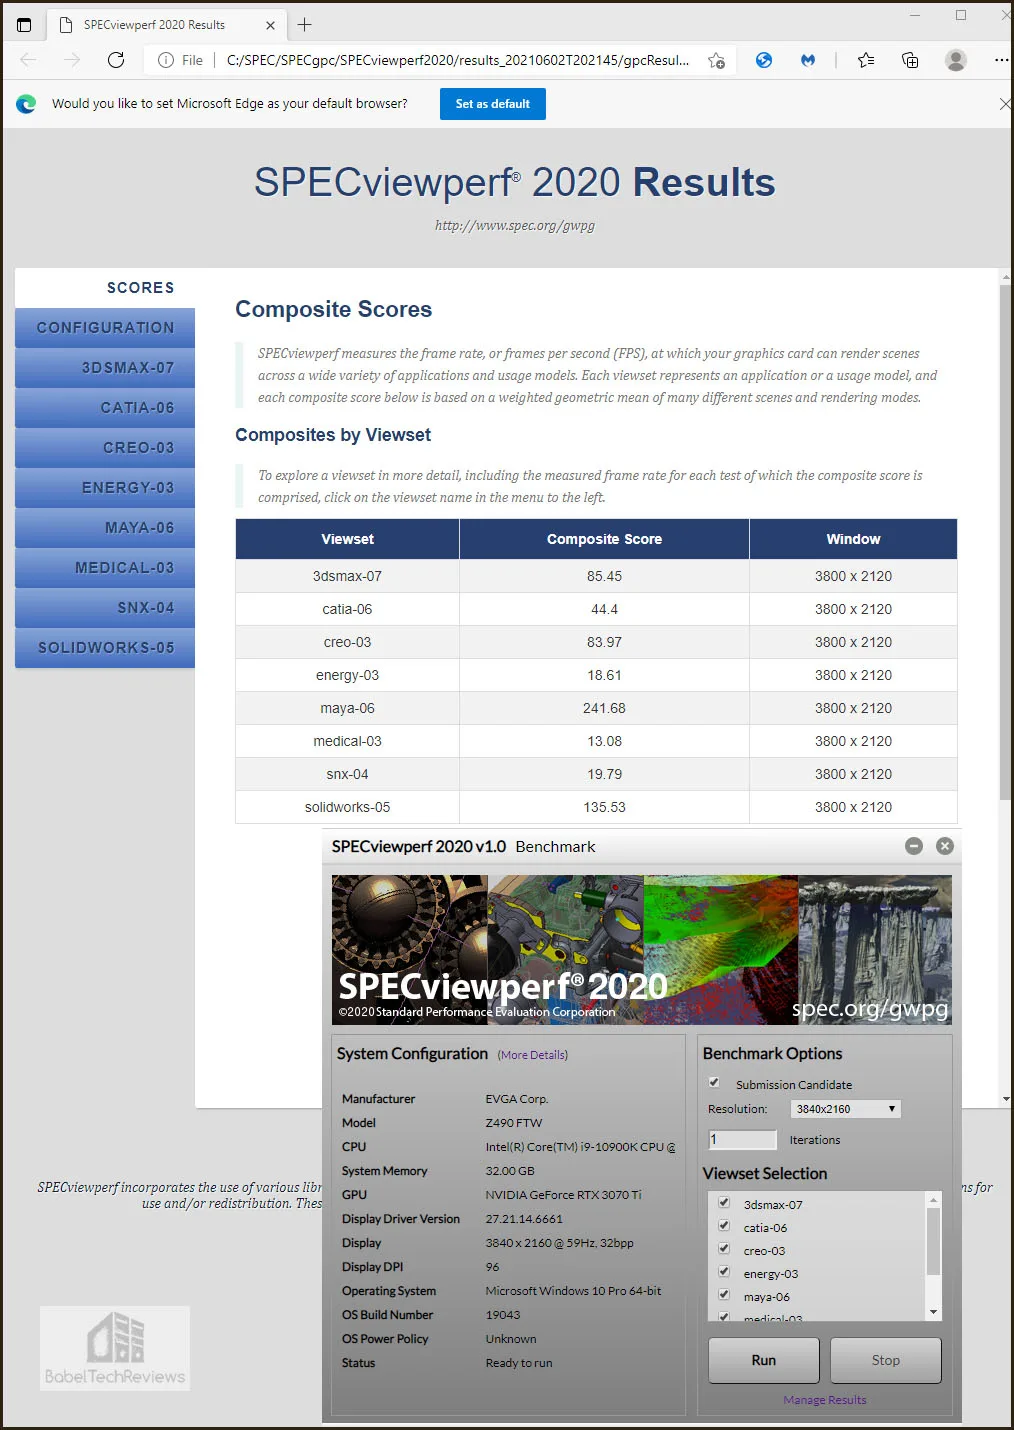
SPECviewperf 2020 GPU Benches
The SPEC Graphics Performance Characterization Group (SPECgpc) has released a 2020 version of its SPECviewperf benchmark that features updated viewsets, new models, support for both 2K and 4K display resolutions, and improved set-up and results management.
We benchmarked at 4K and here is the summary for the RTX 3070 Ti.
Here are SPECviewperf 2020 GPU benchmarks summarized in a chart together with six other cards.
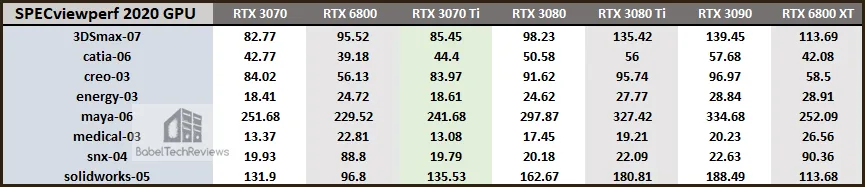
Again the RTX 3070 Ti is slightly faster than the RTX 3070 but not close to RTX 3080 performance.
After seeing these benches, some creative users may wish to upgrade their existing systems with a new RTX 30X0 series card based on the performance increases and the associated increases in productivity that they require. The question to buy an RTX 3070 Ti should be based on the workflow and requirements of each user as well as their budget. Time is money depending on how these apps are used. However, the target demographic for the RTX 3070 Ti is primarily gaming for gamers, especially at 1440P and at 1080P.
Let’s head to our conclusion.
Final Thoughts
The $599 RTX 3070 Ti FE performed well performance-wise compared to the RX 6800. However at only around 3-10% faster than the $100 less expensive RTX 3070 it is not priced particularly well based on its value to performance. It does have faster GDDR6X memory, slightly more cores and a mini-clockspeed bump together with a much better cooling system
If a gaming enthusiast wants a very fast card upper-midrange card, the RTX 3070 Ti is an excellent card for ultra 1080P or 1440P gaming. It can also be used for 4K gaming if settings are lowered.
The Founders Edition of the RTX 3070 Ti is well-built, solid, and good-looking, and it stays cool and quiet even when overclocked. The RTX 3070 Ti Founders Edition will offer a solid upgrade for first generation Turing owners of the RTX 2070 or any earlier generation cards. However, it is not really an upgrade from a $499 RTX 3070 FE which has a higher value to price ratio – if it can be found at MSRP.
Pros
- The RTX 3070 Ti is fast enough for VR gaming with the Vive Pro 2 at 100% SteamVR render resolution
- The RTX 3070 Ti is perfect for 1440P or 1080P gaming although settings have to be lowered for 4K; and it’s also very useful for intensive creative, SPEC, or GPGPU apps
- Ray tracing is a game changer in every way and the RTX 3070 Ti is much faster than the RX 6800 XT or RX 6800 XT when DLSS 2.0 or ray tracing features are enabled. DLSS 2.0 has been rightly called “a miracle” for gamers including for VR gamers
- Reflex and Broadcast are important features for competitive gamers and broadcasters
- Ampere improves over Turing with AI/deep learning and ray tracing to improve visuals while also increasing performance with DLSS 2.0 and Ultra Performance DLSS
- The RTX 3070 Ti Founders Edition design cooling is quiet and efficient and its upgraded flow-through design is a real upgrade over the RTX 3070 FE. The GPU in a well-ventilated case stays cool even when overclocked and it remains quiet using the stock fan profile
- The industrial design is eye-catching and it is solidly built
Cons
- High Price
- Lack of availability
The Verdict
If you are a gamer who plays at maxed-out 1080P, 1440P, or even at 4K with lesser settings, you may want to upgrade to a RTX 3070 Ti. The Founders Edition offers good performance value as an upgrade from previous generations with the additional benefit of being able to handle ray tracing much better. It is much faster in ray traced games than any Radeon, and DLSS 2.0 is a true game changer that brings extra performance without any compromise in visuals.
The RTX 3070 Ti Founders Edition is available starting tomorrow for $699 from NVIDIA’s online store, and USA customers can purchase these cards also directly from Best Buy both online and in person. Only a relatively few lucky gamers will be able to buy one at SEP, but we believe the supply issue will ease and pricing will return to normal by the Autumn and this review will be even more useful in making a high end card selection then.
Stay tuned, there is a lot more on the way from BTR. Next week, we will test multiple cards in VR using the brand new Vive Pro 2. We are in touch with HTC/Vive and hope to have answers and solid performance results by then. Stay tuned to BTR!
Happy Gaming!
Comments are closed.