Sabrent Rocket 4 Plus 2TB SSD NVMe M.2 PCIe 4.0 Gen 4 x4 Gaming Review
BTR recently received a 2TB Rocket 4 Plus SSD from Sabrent which is a very fast 7,000/6850MBps Read/Write PCIe 4.0 Gen 4 x4 drive. Although its thin heatsink is perfect for the PlayStation 5 (PS5) and tight installations, Sabrent recommends using an external NVMe or PS5 heatsink to dissipate the heat generated to avoid thermal throttling and to maximize performance.
We put the Sabrent Rocket 4 Plus through its paces against eight other SSDs: (1) a 2TB CARDEA A440 Pro Special Series (7,400/7,000MBps Gen 4 x4), (2) a 1TB CARDEA A440 (7,000/6000MBps Gen 4 x4), (3) a 2TB CARDEA Zero Z440 (5,000/4400MBps Gen 4 x4), (4) a 2TB CARDEA Ceramic C440 (5,000/4400MBps Gen 4 x4), (5) the 1TB CARDEA IOPS SSD (3,400/3000MBps, Gen 4 x3), (6) a midrange TeamGroup 1TB MP33 (1,800/1,500MBps, Gen 3 x4 SSD), (7) a 4TB M200 portable USB 3.2 Type C SSD (2,000/2,000MBps), and (8) a fast 1TB Delta MAX White RGB (560MBps/510MBps) SATA III SSD.
The Sabrent Rocket 4 Plus is available from Sabrent for $299 but at the time of writing it’s offered with a 15% off promotion at Newegg for $254.99 (!) The T-FORCE CARDEA A440 Pro Special Series SSD is priced at Newegg at $359.99 for the 2TB version. The T-FORCE CARDEA A440 (vanilla) SSD is at Amazon for $249.99 for 2TB, but it comes with two heatsinks, the 2TB CARDEA Ceramic C440 is priced at $229.99, and the 2TB T-FORCE CARDEA ZERO Z440 SSD is available at Amazon at $227.99 for the 2TB version.
For additional price comparisons, the TeamGroup 2TB MP33 NVMe SSD is $145.99, the T-FORCE NVMe CARDEA IOPS is $132.33 and only offered in a 1TB capacity as is the SATA III Delta MAX at Amazon for $89.99 but it offers RGB lighting. The 4TB M200 Portable USB 3.2 Gen2 x2 Type C SSD is $527.99 while the 2TB version is $189.59.
Features & Specifications
Here are the features and specifications of the Sabrent Rocket 4 Plus 2TB SSD which are taken directly from Sabrent’s website.
Features
- PCIe 4.0 x4 interface, NVMe 1.3 compliant. APST/ASPM/L1.2 support.
- Supports SMART and TRIM functions. Works in an enclosure.
- Wide flash compatibility. Uses TLC with DRAM.
- Advanced endurance features for a long drive lifespan.
- Upgradeable firmware and software support.
- 4.0-capable motherboard and M.2 heatsink are recommended, but the drive is backward compatible with PCIe 3.0 and 2.0 M.2 sockets.
- All Sabrent SSDs come with Sabrent Acronis True Image for Sabrent
Specifications
The 2TB Sabrent Rocket 4 Plus specifications, based on CrystalDiskMark, boast up to 7,000 Read MB/s / 6,850 MB/s Write which are excellent for an current Gen 4 x4 PCIe 4.0 NVMe SSD and exceptional for gaming and most applications. The 2TB model is rated for a solid lifespan of 1,400 terabytes written backed by a five year warranty with registration, and it features S.M.A.R.T and Trim support.
Next, we unbox the Rocket 4 Plus and take a closer look at it.
Unboxing, Heatsink installation, and Temperatures Under Load
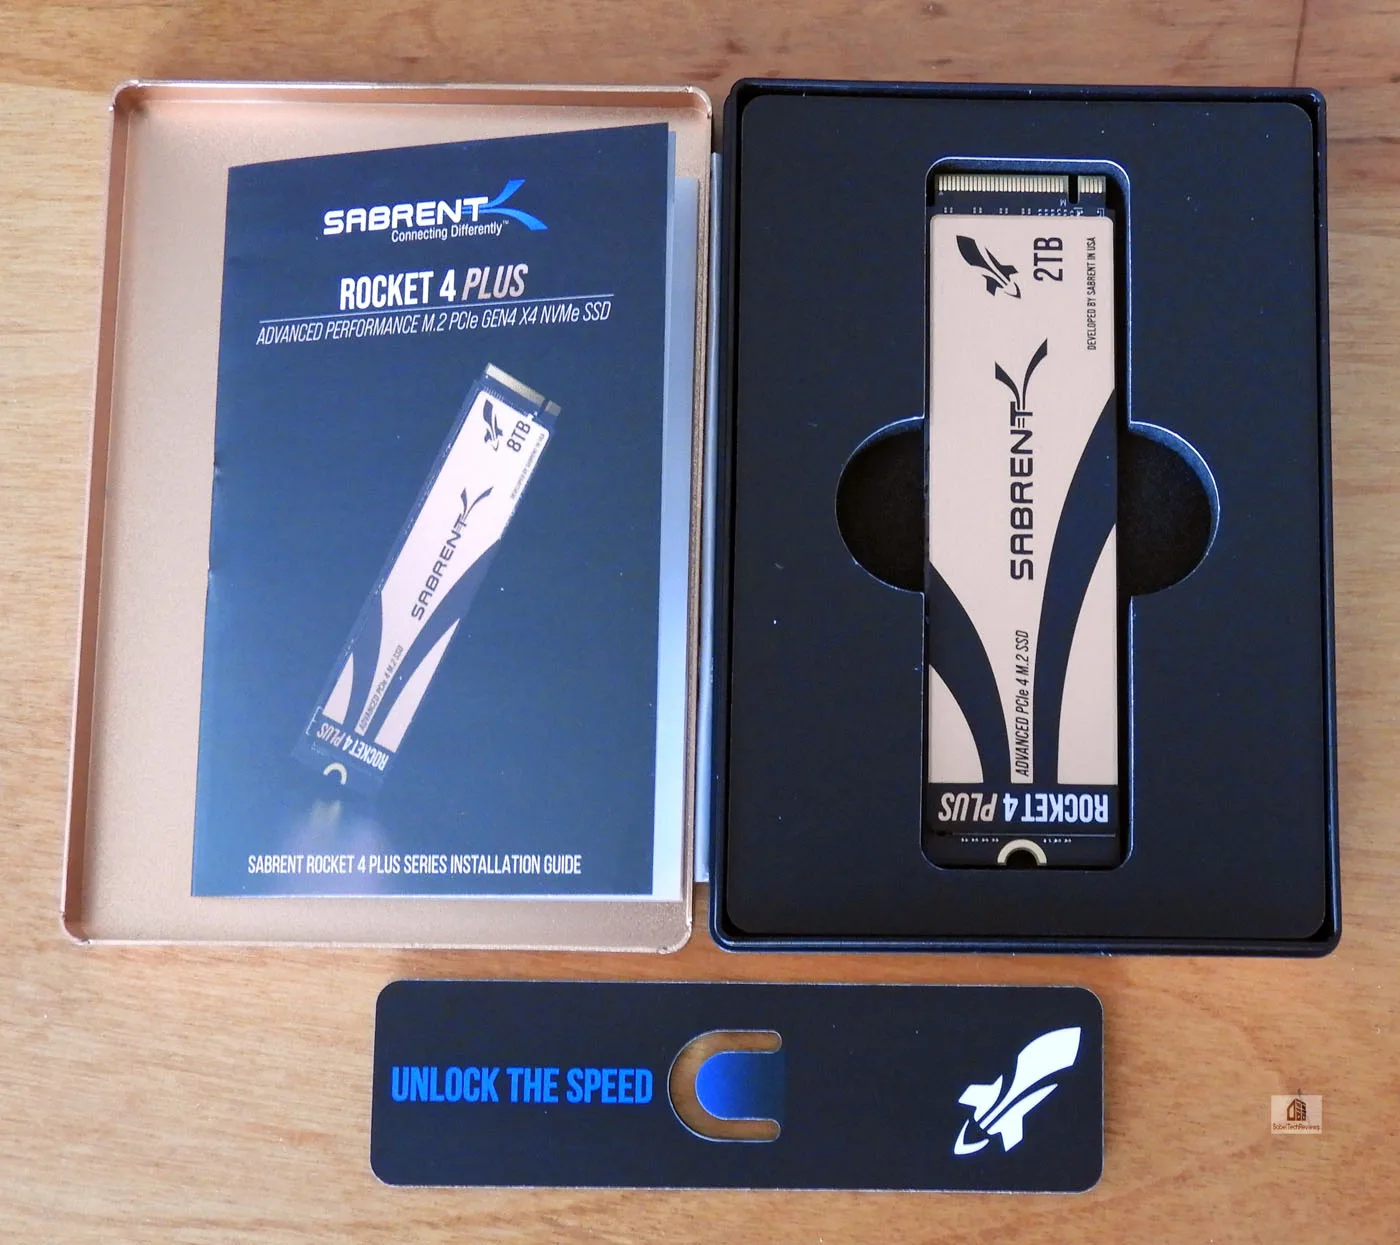
The Sabrent Rocket 4 Plus comes in a small box that advertises it as an advanced performance M.2 PCIe Gen4 x4 NVMe SSD. Sabrent also sent us an aluminum heatsink for the PS5 console as well a copper/aluminum NVMe heatsink for the PC. As it turns out, we don’t have a PS5 nor do we need a NVMe heatsink – although we tested it – since the ASUS ROG Maximus Apex has a heavy duty heatsink integrated into the motherboard.
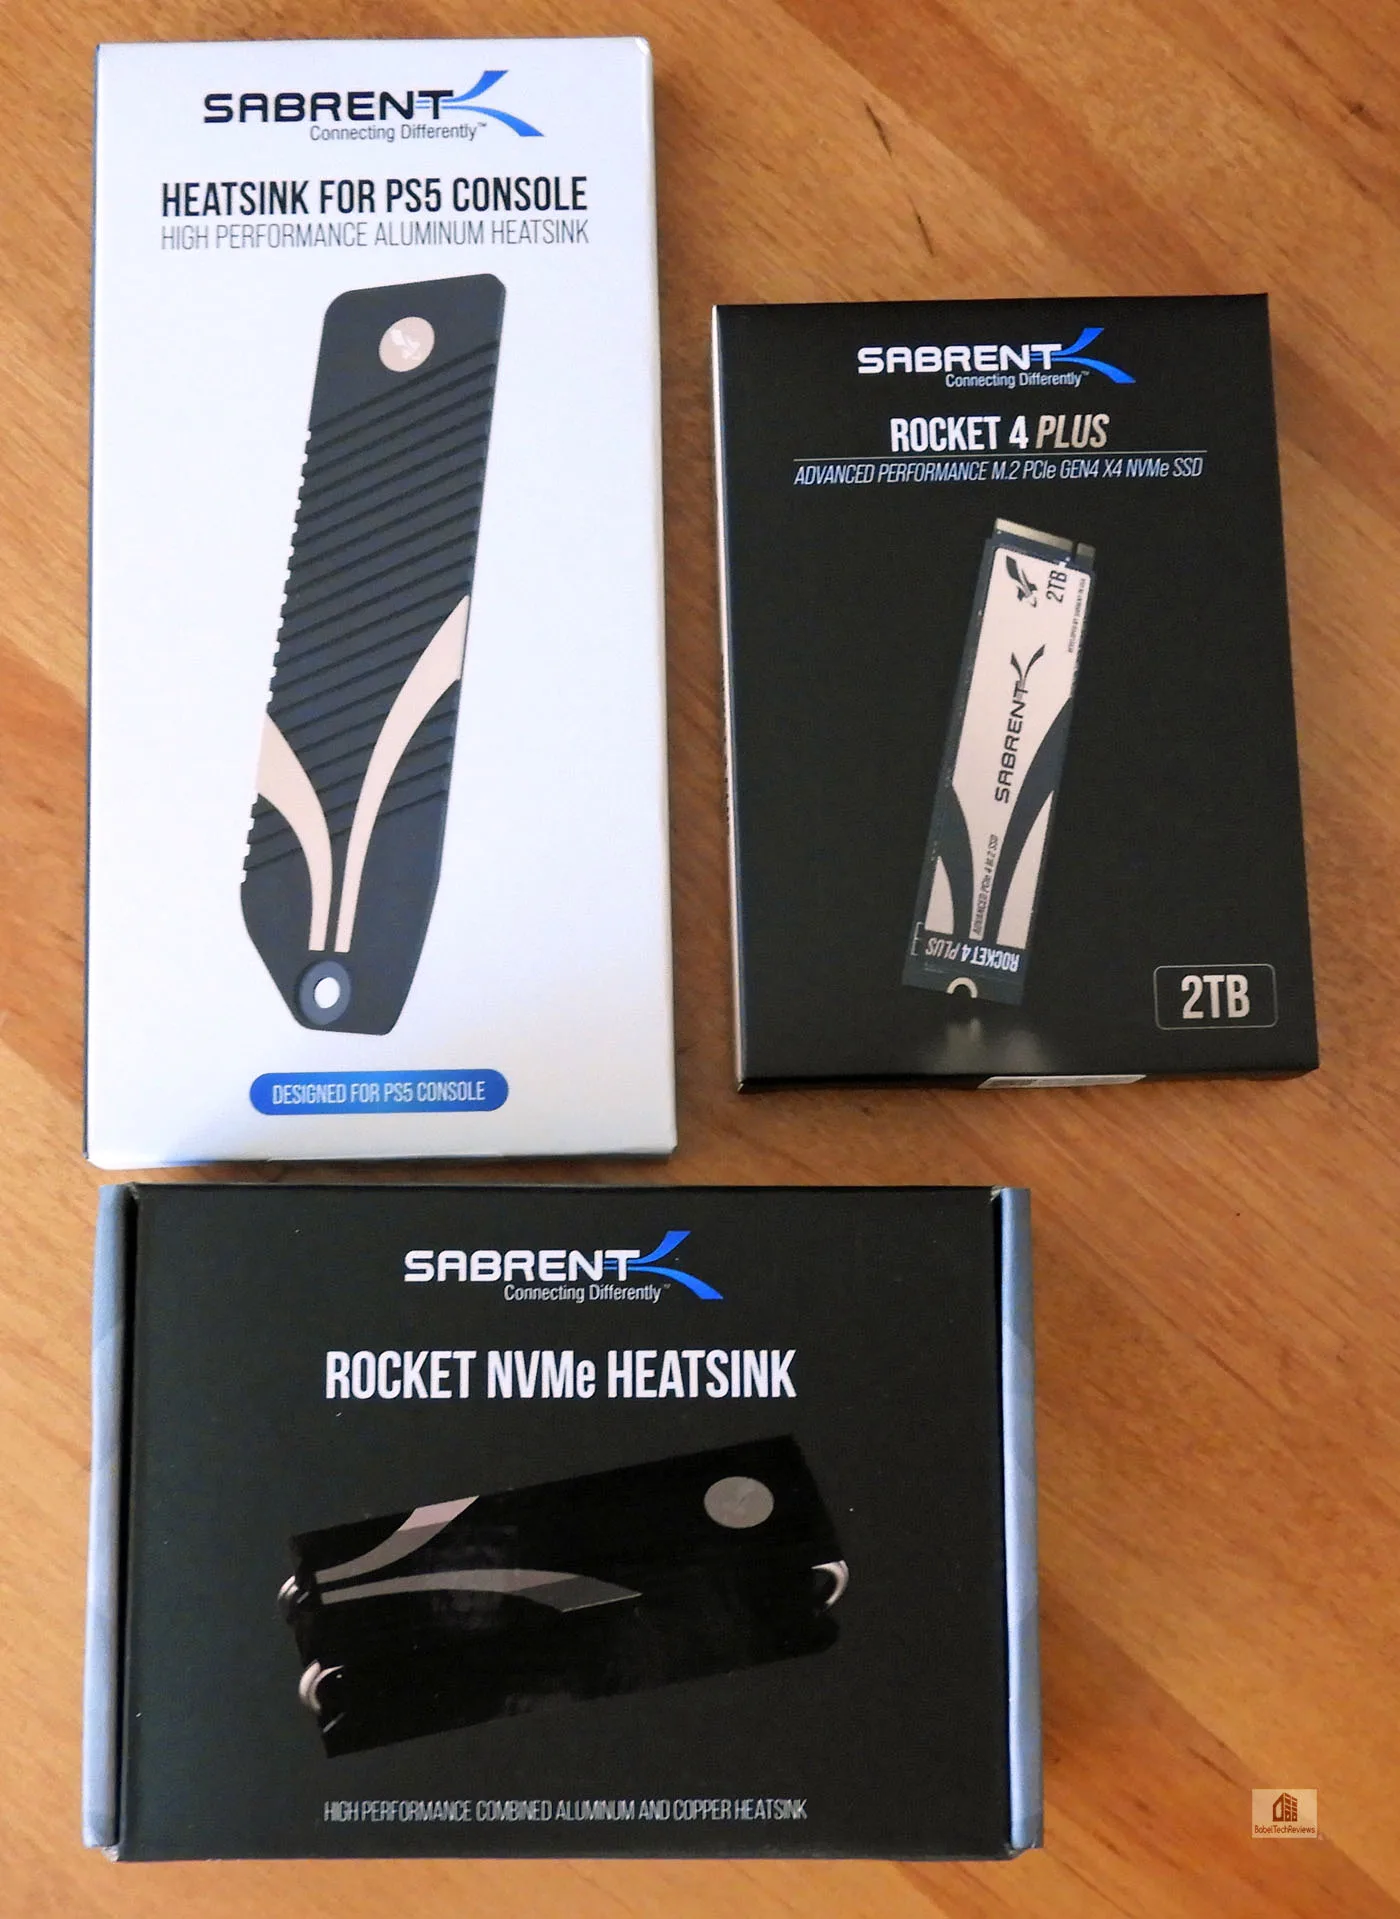
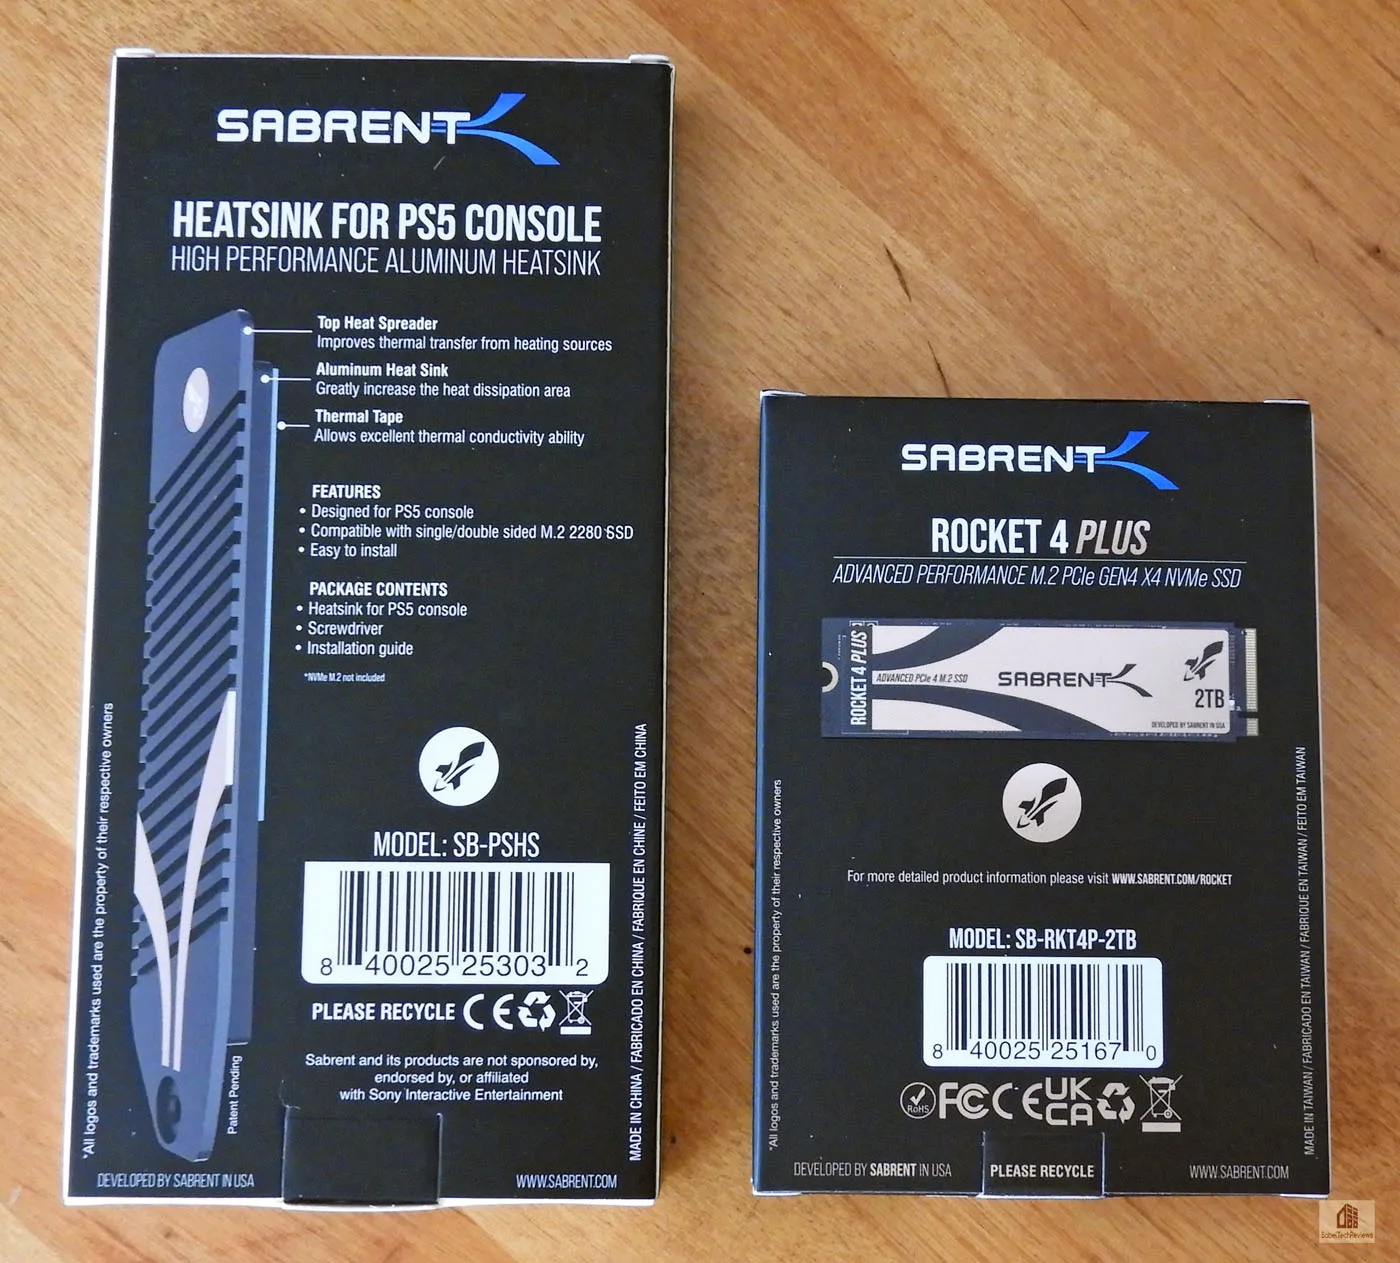
The back of the Rocket 4 Plus box doesn’t give any further details except to recommend visiting www.sabrent.com/rocket. In contrast, the PS5 heatsink details are spelled out on the back of the box.
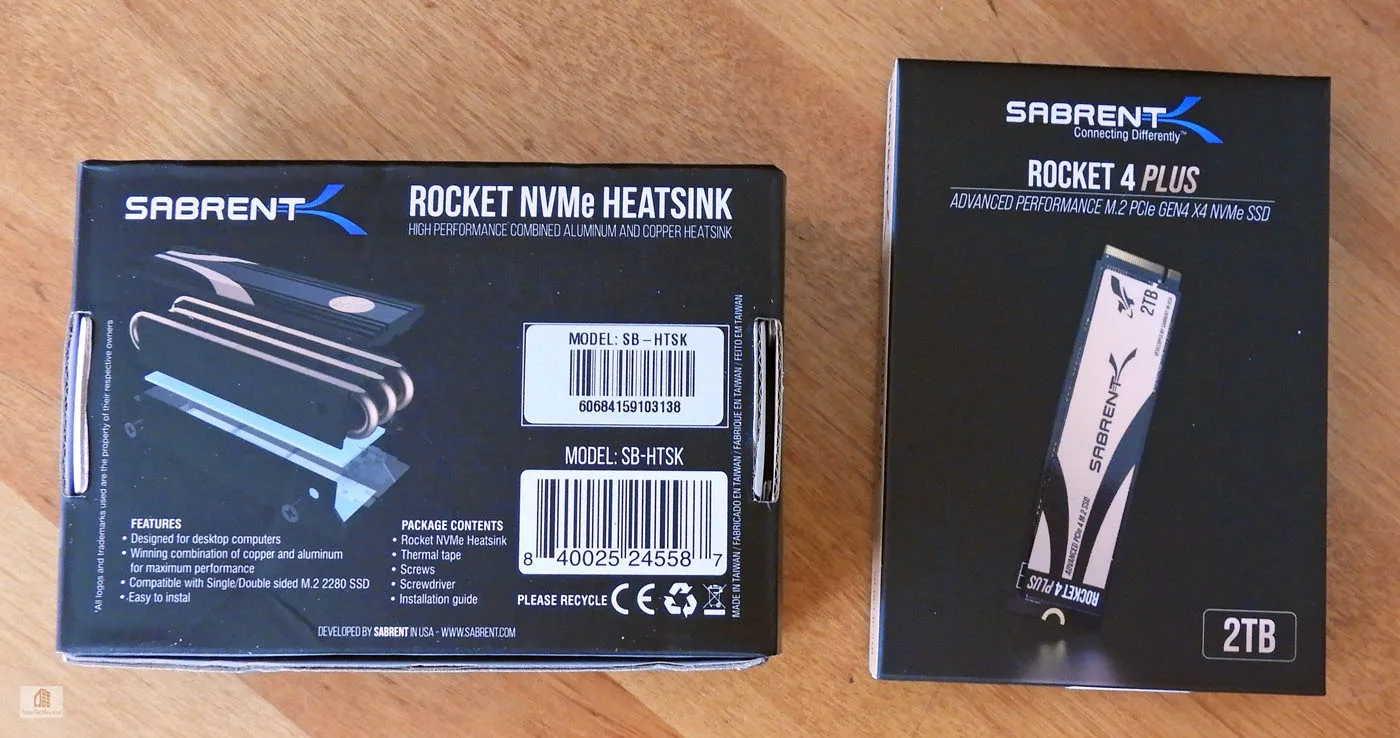
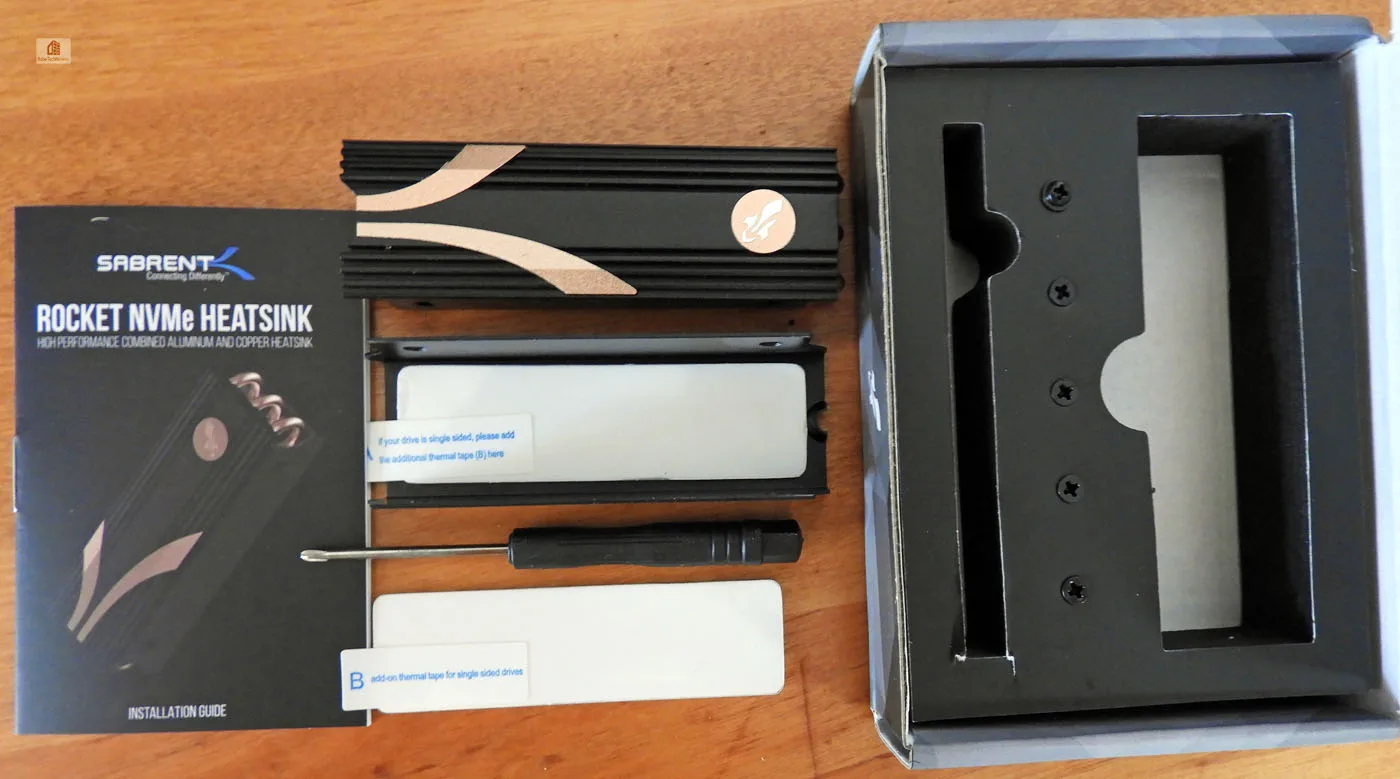
Here is the Rocket 4 Plus box again next to the PC heatsink box which spells out its details.
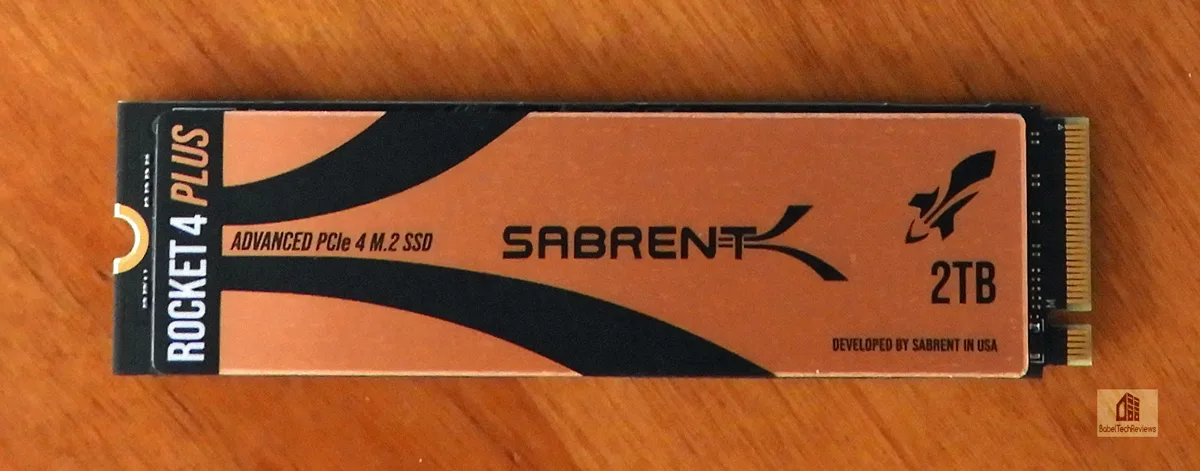
The presentation of the Rocket 4 Plus is outstanding as the SSD comes in an aluminum jewel box style container with the installation instructions.
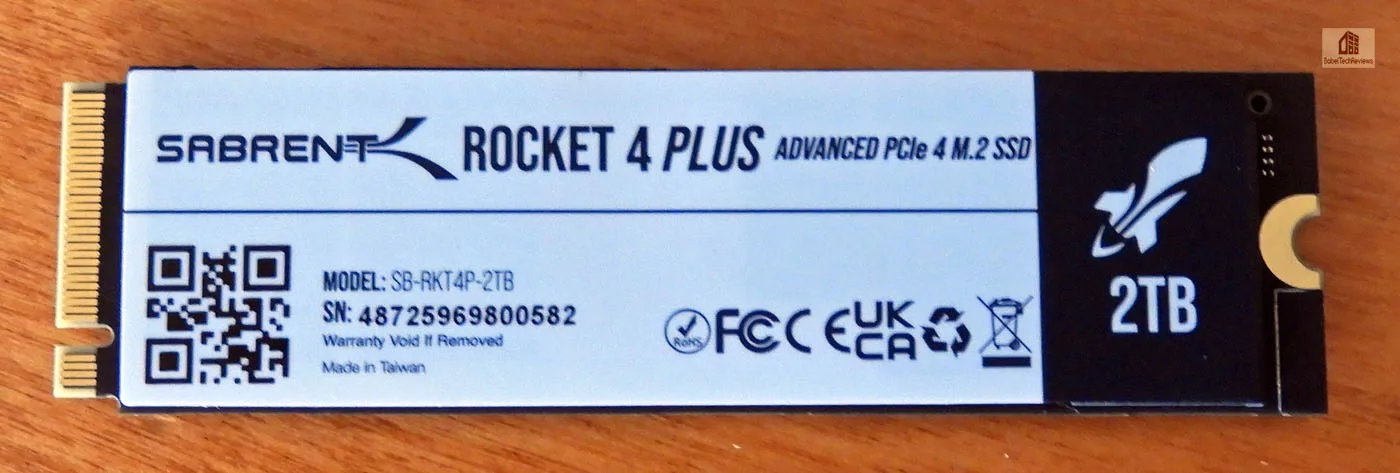
Pictured below are both sides of the Rocket 4 Plus.
Of course, the end user is not supposed to remove the heatsink or the paper on the back with a warning that the warranty is voided. We did it anyway to show the ICs below the heatsink and under the paper.
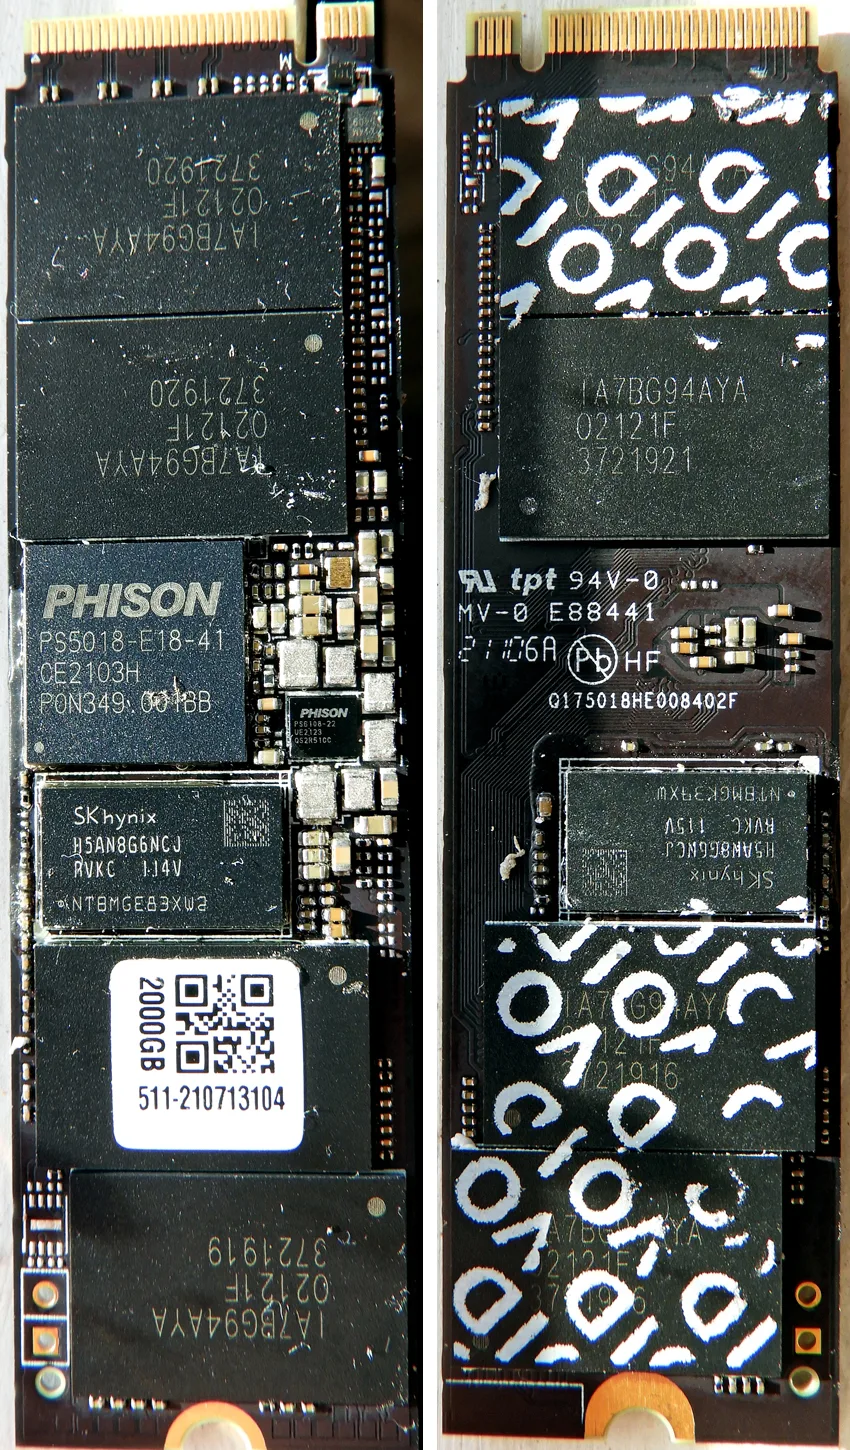
ICs are on both sides of the PCB unlike the single-sided Cardea A440 Pro Special Series. A Phison PS5018-E18 controller is coupled with Micron B47R NANAD and SK Hynix DDR4 DRAM to achieve its blazing fast 7,000MB/s specifications.
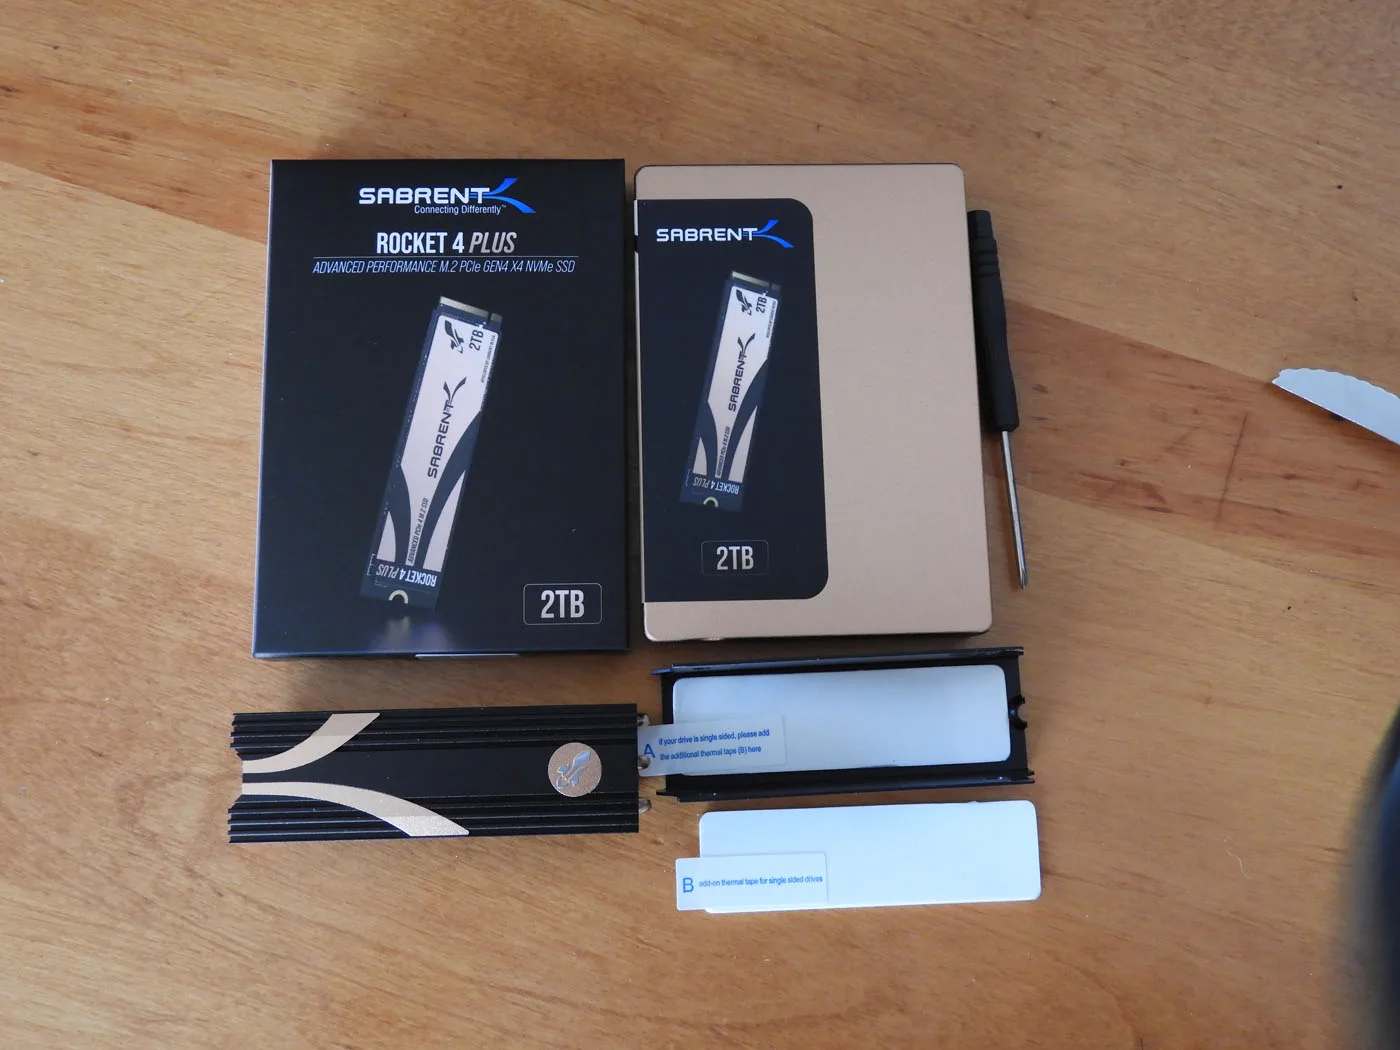
It is very unwise to operate the Rocket 4 Plus with only the foil heatsink as the heat generated by the ICs will throttle performance as temperatures will easily exceed 80C. The $24.99 Rocket NVMe heatsink – purchased separately – is a complete easy-to-install kit that will securely lock down using an M.2 screw to the motherboard following the simple instructions.
Unfortunately, we were unable to install the Rocket 4 NVMe heatsink into our Apex motherboard as its twist locks could not hold it down. So for the following picture, we installed it in our i9-10900K PC. It’s a very good-looking heatsink and quite effective also.
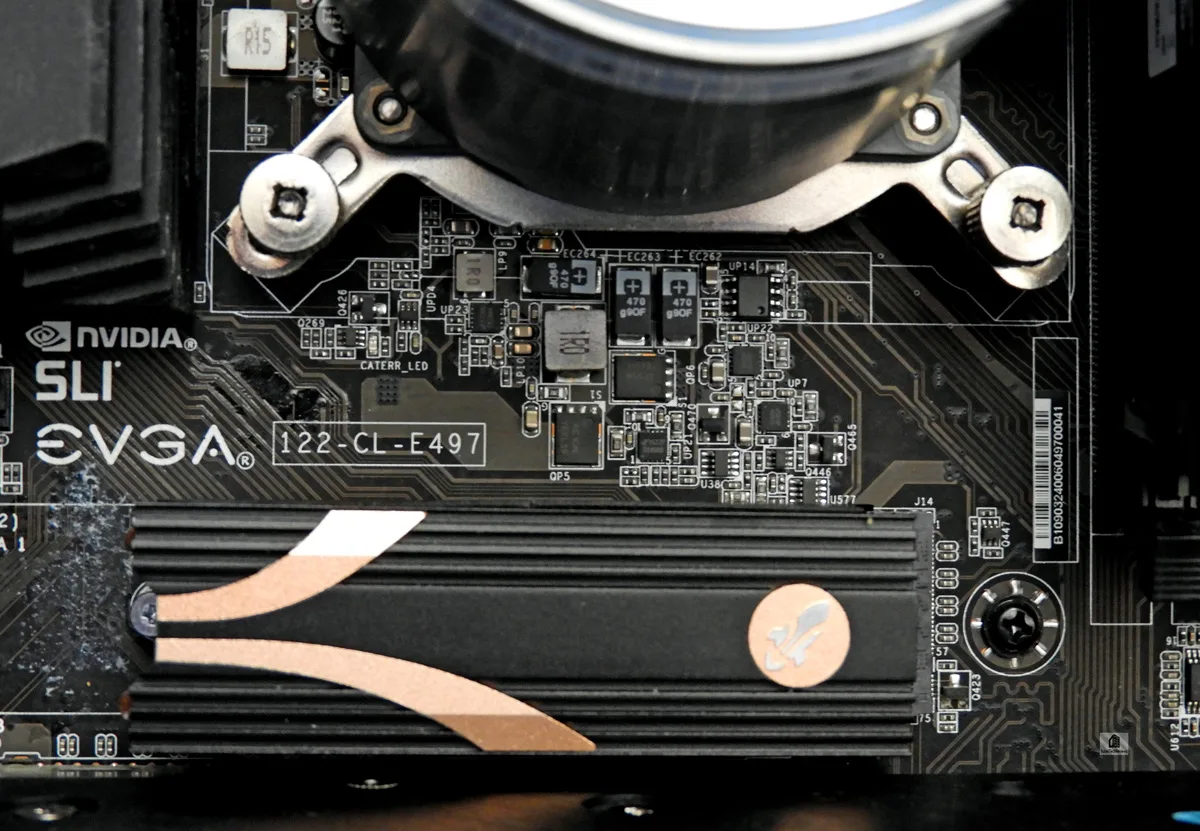
We benchmarked the Rocket 4 Plus in our Apex motherboard using its included 5.6oz (159g) heatsink. In comparison, the Rocket NVMe heatsink weighs in at 4oz (115g) which also makes it a very solid cooling solution.
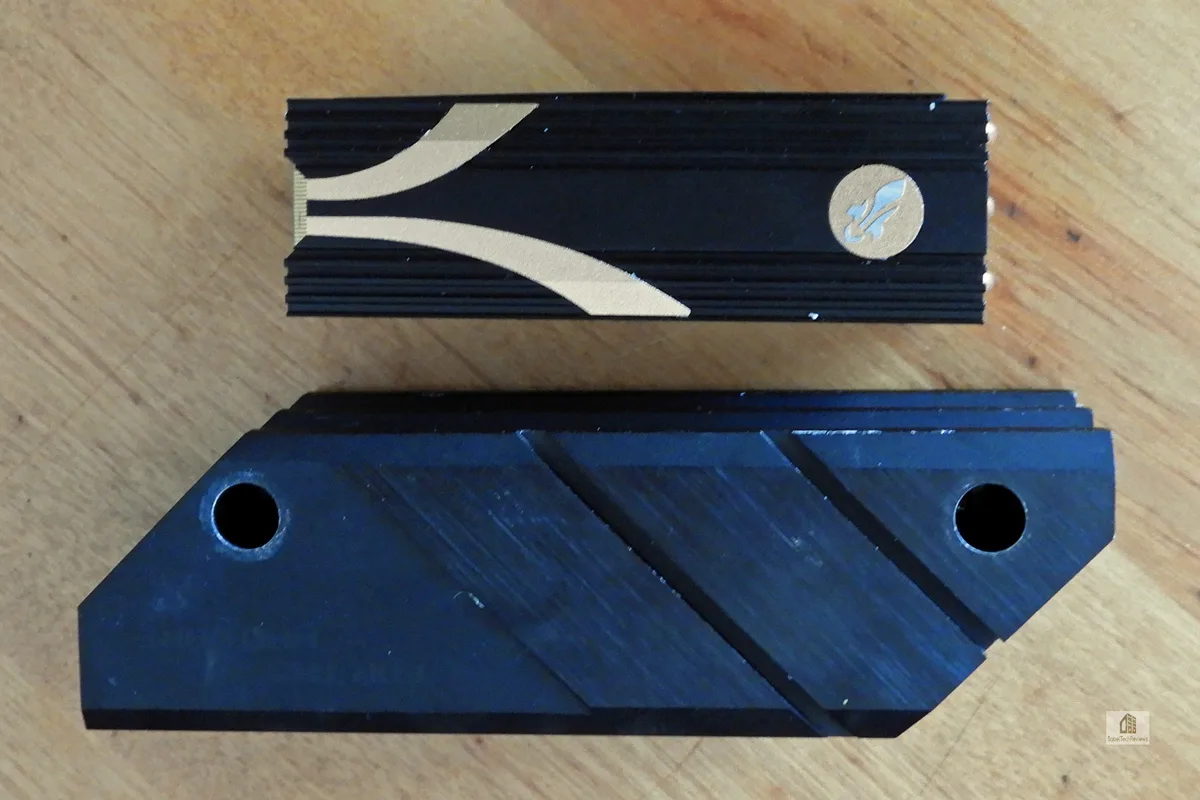
Above are the Apex MB and Rocket NVMe heatsinks compared.
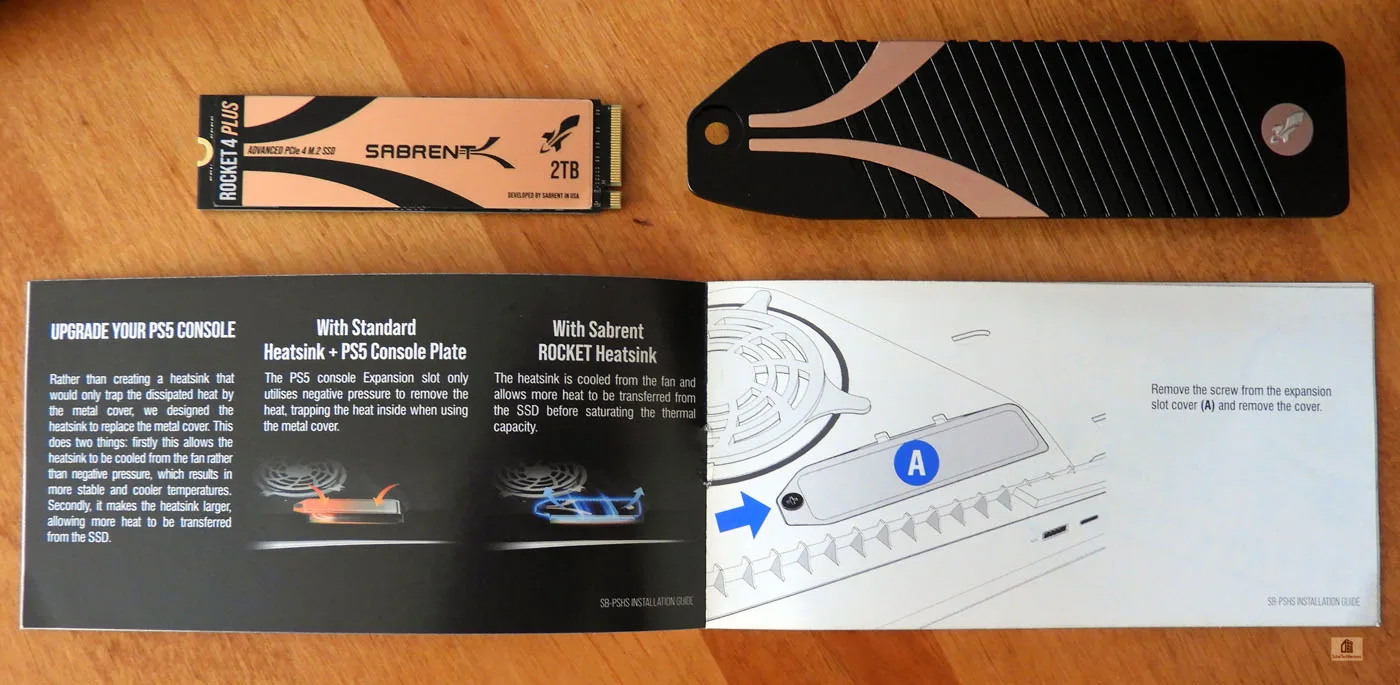
If you have a PS5, the Rocket 4 Plus is an ideal fast SSD and a $19.99 heatsink is also available for it.
Temperatures
Do not operate your Rocket 4 Plus SSD without a heatsink unless you are only going to use it for light duty or you will get temperatures approaching 80C with performance throttling.
Using the massive NVMe heatsink included with the ASUS ROG Maximus Apex motherboard, we never saw temperatures rise above 40C. Using the Rocket NVMe heatsink, the highest temperatures we observed was 46C under the most demanding conditions.
After installing the Rocket 4 Plus, the user may need to format it before use. If you are planning to clone it, make sure both disks are GUID or convert one of them first. You can use the free Acronis True Image cloning software for Sabrent included with every Sabrent SSD purchase.
Lets look at our test configuration next.
Test Configuration – Hardware
- Intel Core i9-12900KF (HyperThreading and Turbo boost at stock settings)..
- ASUS ROG Maximus Z690 Apex LGA 1700 motherboard (Intel Z690 chipset, latest BIOS, PCIe 5.0, DDR5)
- T-FORCE DELTA RGB PC5-51200 6400MHz DDR5 CL40 2x16GB kit, supplied by TeamGroup
- GeForce RTX 3080 Ti, supplied by NVIDIA
- Sabrent Rocket 4 Plus 2TB M.2 NVMe PCIe 4.0 SSD, supplied by Sabrent
- T-FORCE CARDEA A440 Pro Special Series 2TB M.2 NVMe PCIe 4.0 SSD, supplied by TeamGroup
- T-FORCE CARDEA A440 1TB M.2 NVMe PCIe 4.0 SSD, supplied by TeamGroup
- T-FORCE T-FORCE CARDEA ZERO Z440 2TB M.2 NVMe PCIe 4.0 SSD, supplied by TeamGroup
- T-FORCE CARDEA Ceramic C440 2TB PCIe Gen 4 x4 NVMe SSD
- T-FORCE CARDEA IOPS 1TB PCIe Gen 4 x3 NVMe SSD, supplied by TeamGroup
- TeamGroup MP33 1TB NVMe Gen 3 x4 PCIe SSD
- T-FORCE M200 4TB Portable Gen 2 x2 USB 3.2 Type C SSD, supplied by TeamGroup
- T-FORCE DELTA MAX White 1TB SATA III SSD, supplied by TeamGroup
- Super Flower LedEx, 1200W Platinum 80+ power supply unit
- MSI MAG Series CORELIQUID 360R (AIO) 360mm liquid CPU cooler
- Corsair 5000D ATX mid-tower (plus 1 x 140mm fan; 2 x 120mm Noctua fans)
- BenQ EW3270U 32? 4K HDR 60Hz FreeSync monitor
Test Configuration – Software
- Gaming results show loading time in seconds and lower is better
- Windows 11 Professional edition; latest updates/build
- Latest DirectX
- All benchmarking programs are updated to their latest versions
- IOmeter
PC Game & Level Loading Suite
- PCMark 8 (World of Warcraft & Battlefield 3)
- Final Fantasy XIV: Shadowbringers Benchmark – loading times of five different levels
- Final Fantasy XIV: Endwalker Benchmark – loading times of five different levels
- 3DMark Storage Benchmark (Battlefield V, Call of Duty, Overwatch)
Synthetic Benching Tests & Suites
- SiSoft Sandra 2020/2021
- AIDA64
- PCMark 10 Pro version courtesy of UL (Full Storage Benchmark, Express, Extended)
- PCMark 8
- SPECworkstation3 (3.0.4) Benchmarks
- Anvil’s Storage Utilities
- CrystalDiskMark
- TxBENCH Basic
- HD Tune
- AS SSD
- HD Tach
- 100GB File Copy Timed Test
Let’s head to our benching results.
Benchmarking the Sabrent Rocket 4 Plus SSD
Benchmarking SSDs is not an exact science as there is variability between runs, and different benchmarks may show different results depending on how they run their tests and how up-to-date the benchmarks are. However, by using enough real world and synthetic tests, it may be possible to get a good idea of the relative performance across all nine tested drives. For benchmark results, the drives are listed in the following order on the charts:
- Sabrent Rocket 4 Plus 2TB M.2 NVMe PCIe 4.0 Gen 4 x4 SSD
- T-FORCE CARDEA A440 Pro Special Series 2TB M.2 NVMe PCIe 4.0 Gen 4 x4 SSD
- T-FORCE CARDEA A440 1TB M.2 NVMe PCIe 4.0 Gen 4 x4 SSD
- T-FORCE CARDEA Ceramic C440 1TB PCIe 4.0 Gen 4 x4 NVMe SSD
- T-FORCE CARDEA ZERO Z440 2TB M.2 NVMe PCIe 4.0 Gen 4 x4 SSD
- T-FORCE CARDEA IOPS 1TB PCIe Gen 3 x4 NVMe SSD
- TeamGroup MP33 1TB NVMe Gen 3 x4 PCIe SSD
- T-FORCE M200 4TB Portable Gen 2 x2 USB 3.2 Type C SSD
- T-FORCE Delta MAX SATA III 1TB SSD
We did not set up Windows on the Delta MAX SSD, so not all of the benchmarks could be run on it. All of the drives will have their results summarized by multiple charts although we will only show the details for the PCIe 4.0 Gen 4 x4 SSDs. Let’s start first with UL’s 3DMark storage benchmark.
3DMark Storage Benchmark
3DMark’s Professional version by UL includes a Storage Benchmark (optional in the Advanced version) which also measures the time it takes to load several popular games. We only show the Gen 4 x4 SSD detailed results but will summarize all of them.
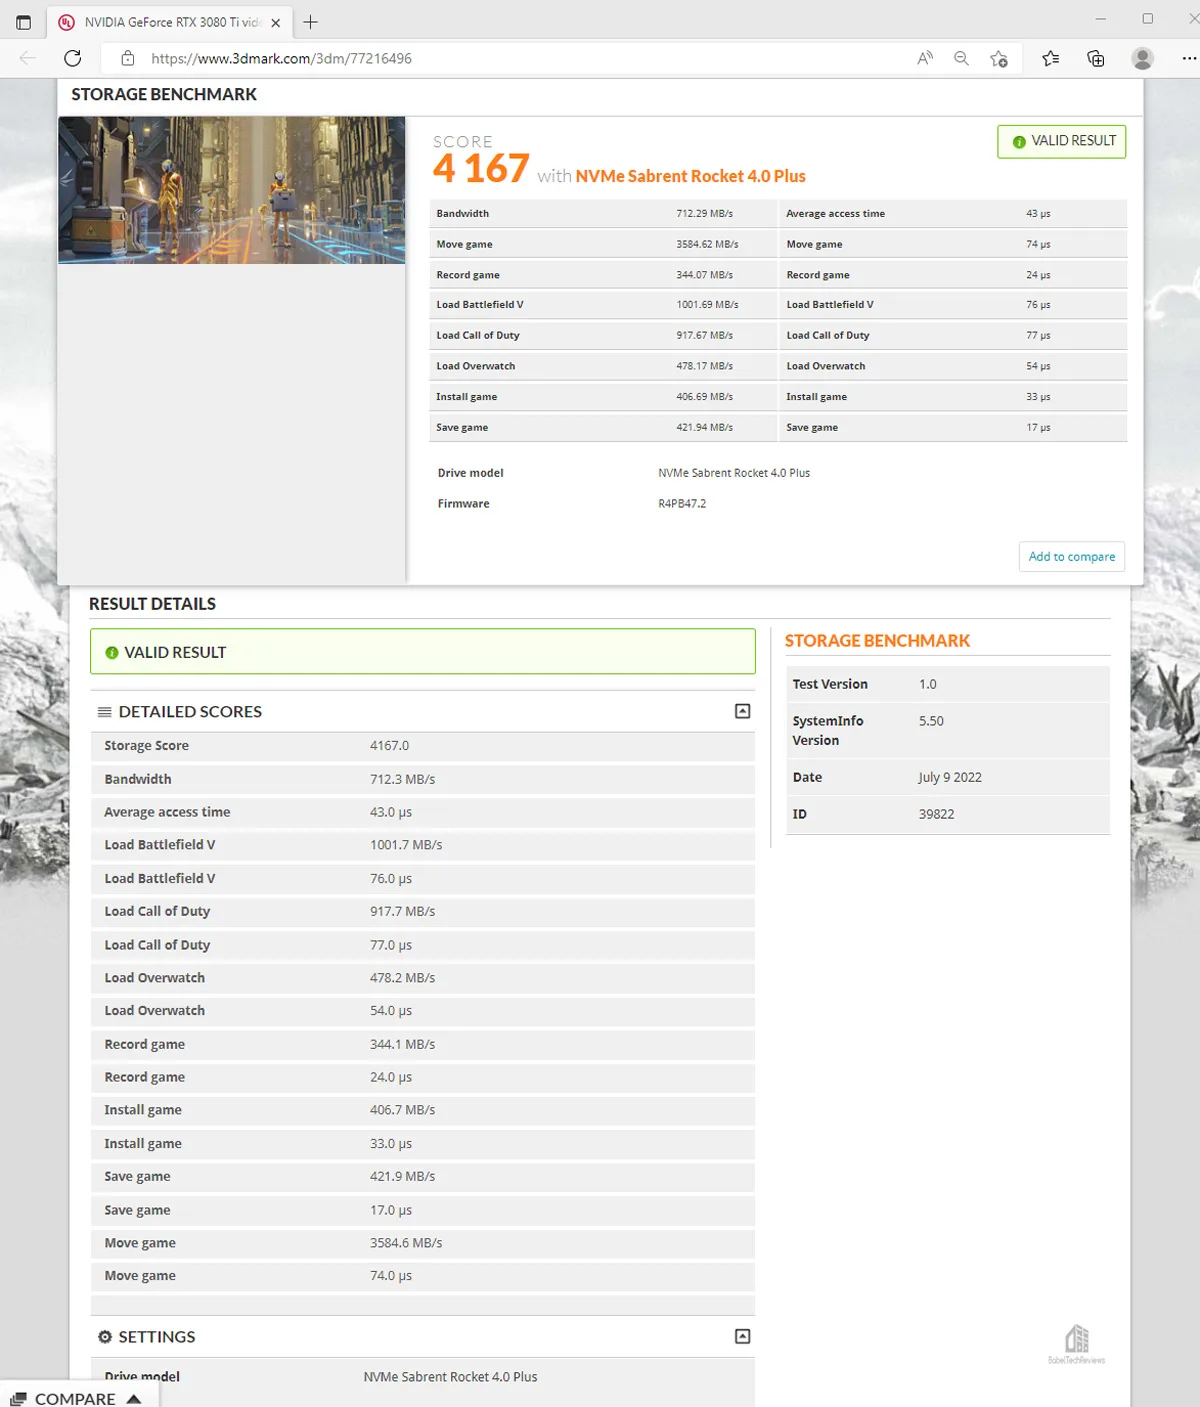
First, the Rocket 4 Plus results with 4167.
Next, the A440 Pro Special Series results with 3229. 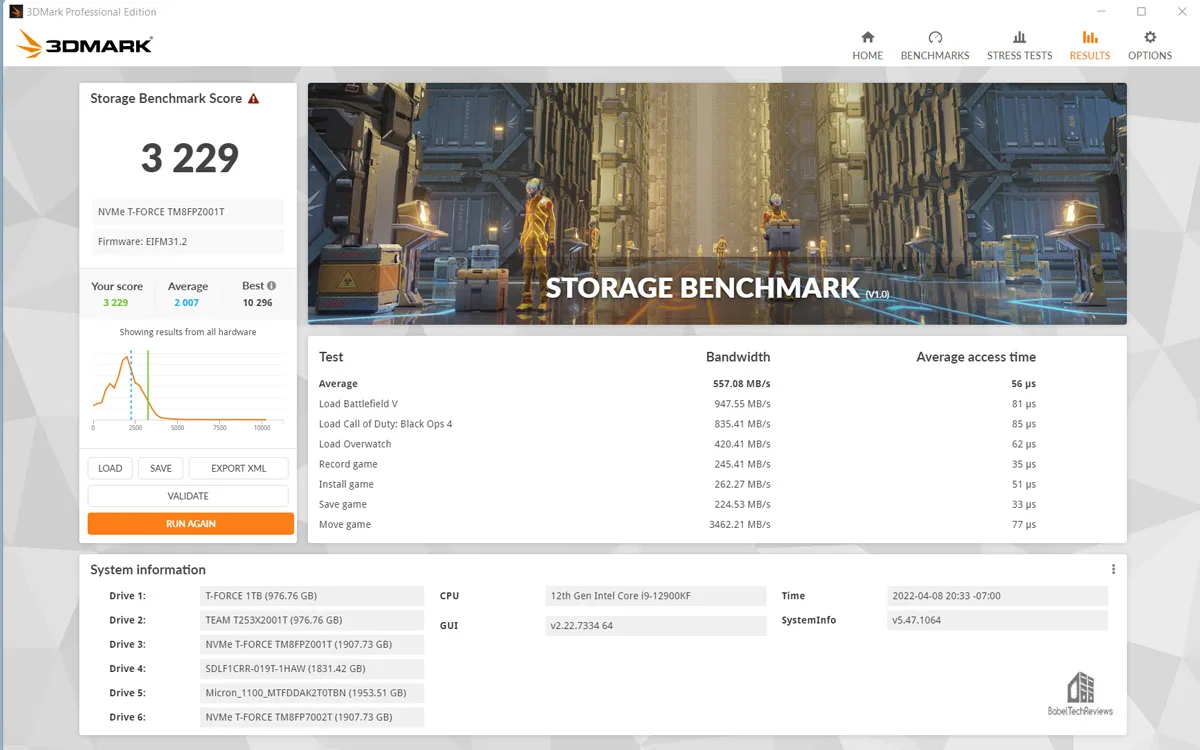 Now, the CARDEA A440 results with 3844.
 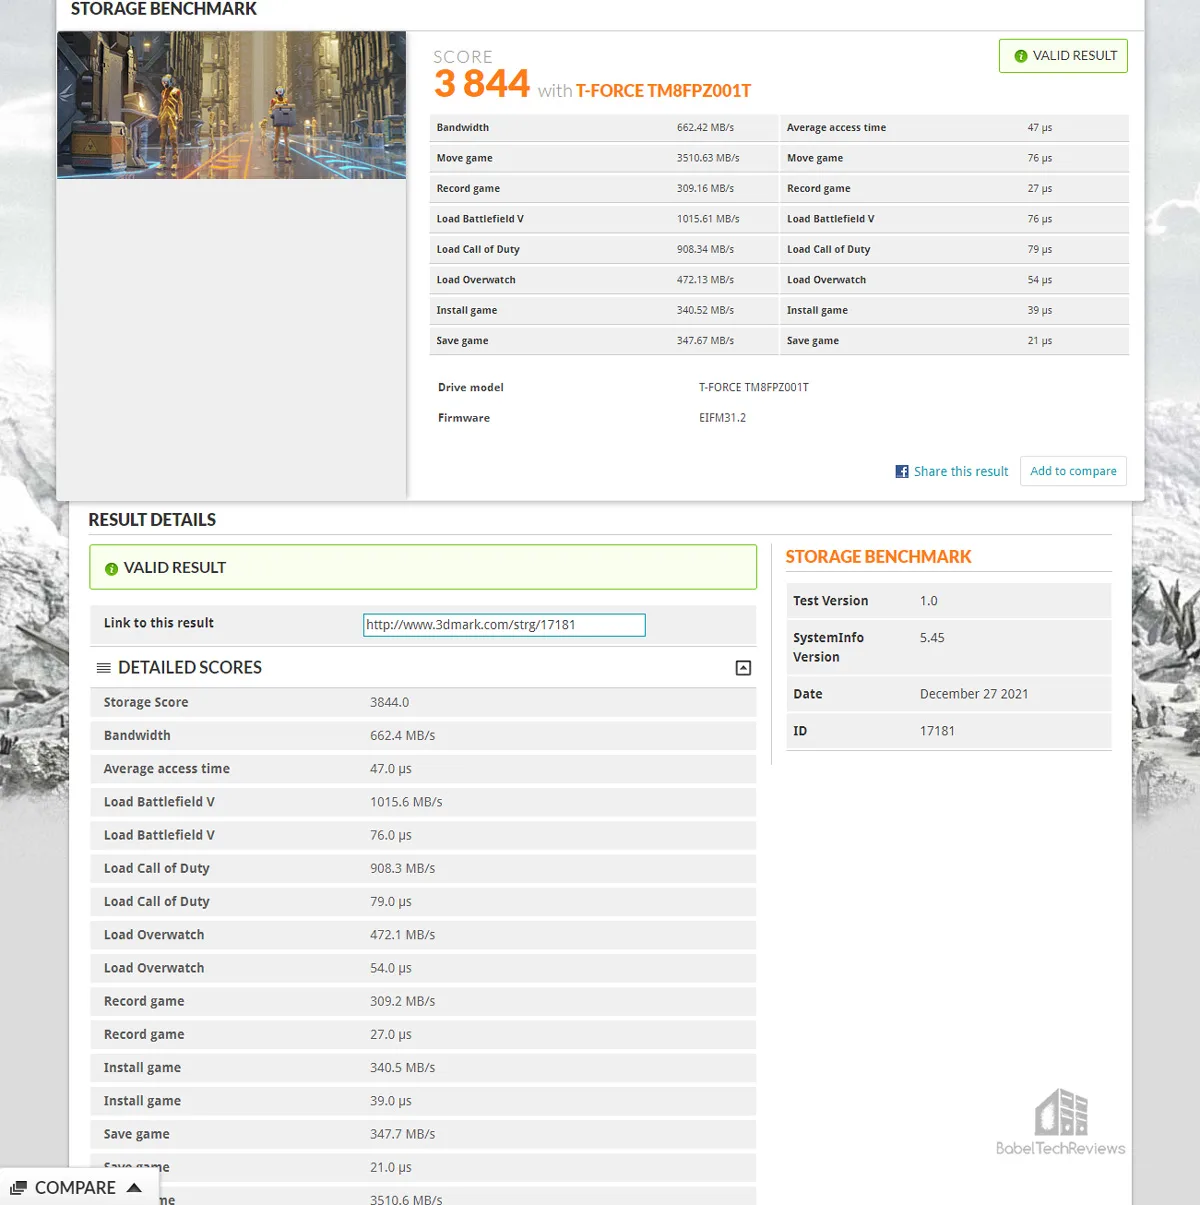 The CARDEA Ceramic C440 scores 3009.
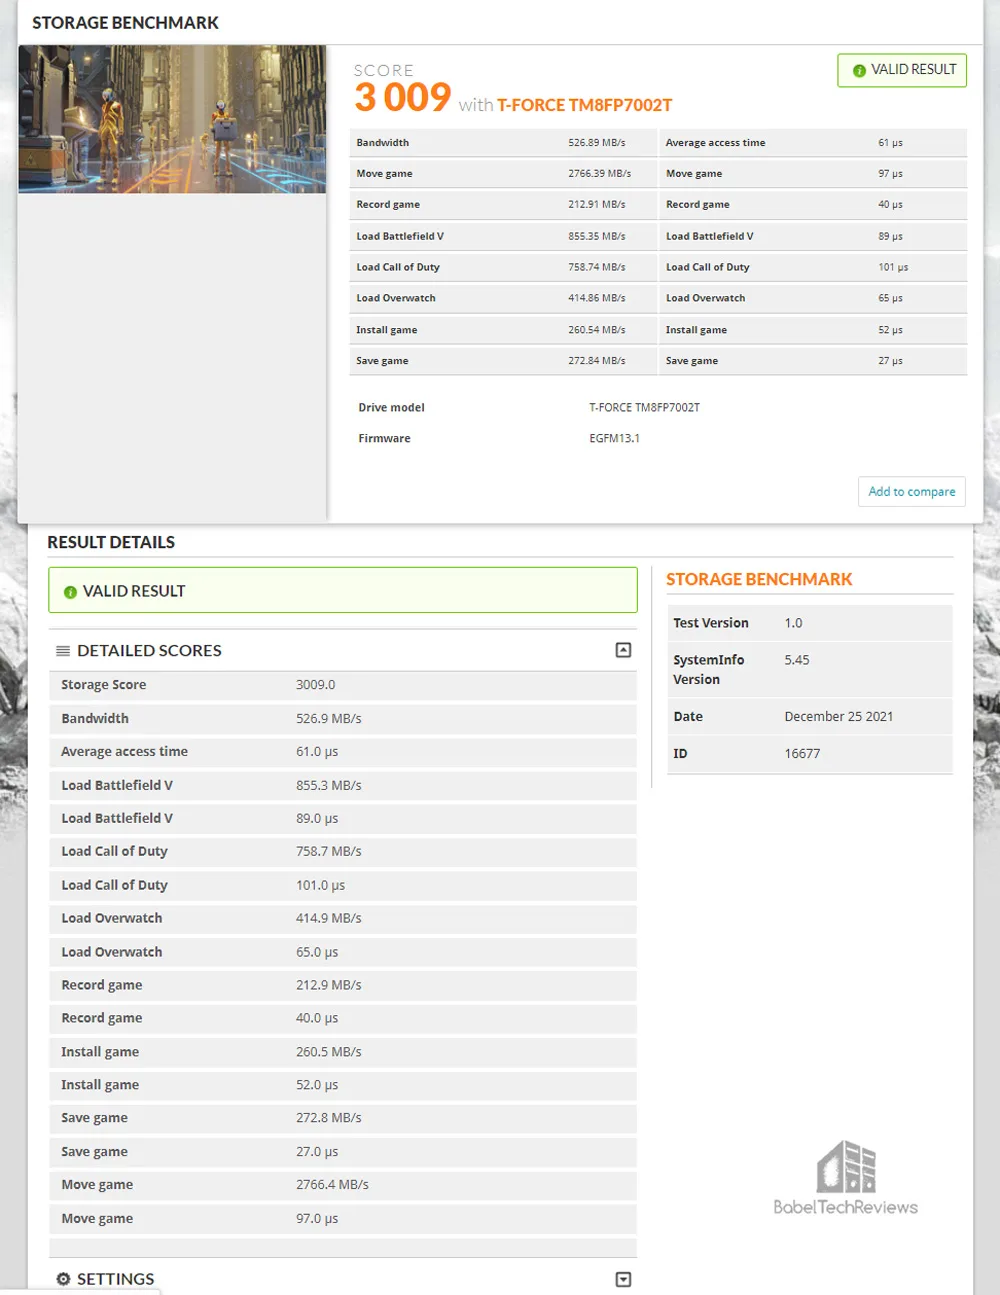
Finally, the ZERO 440 results with 2606.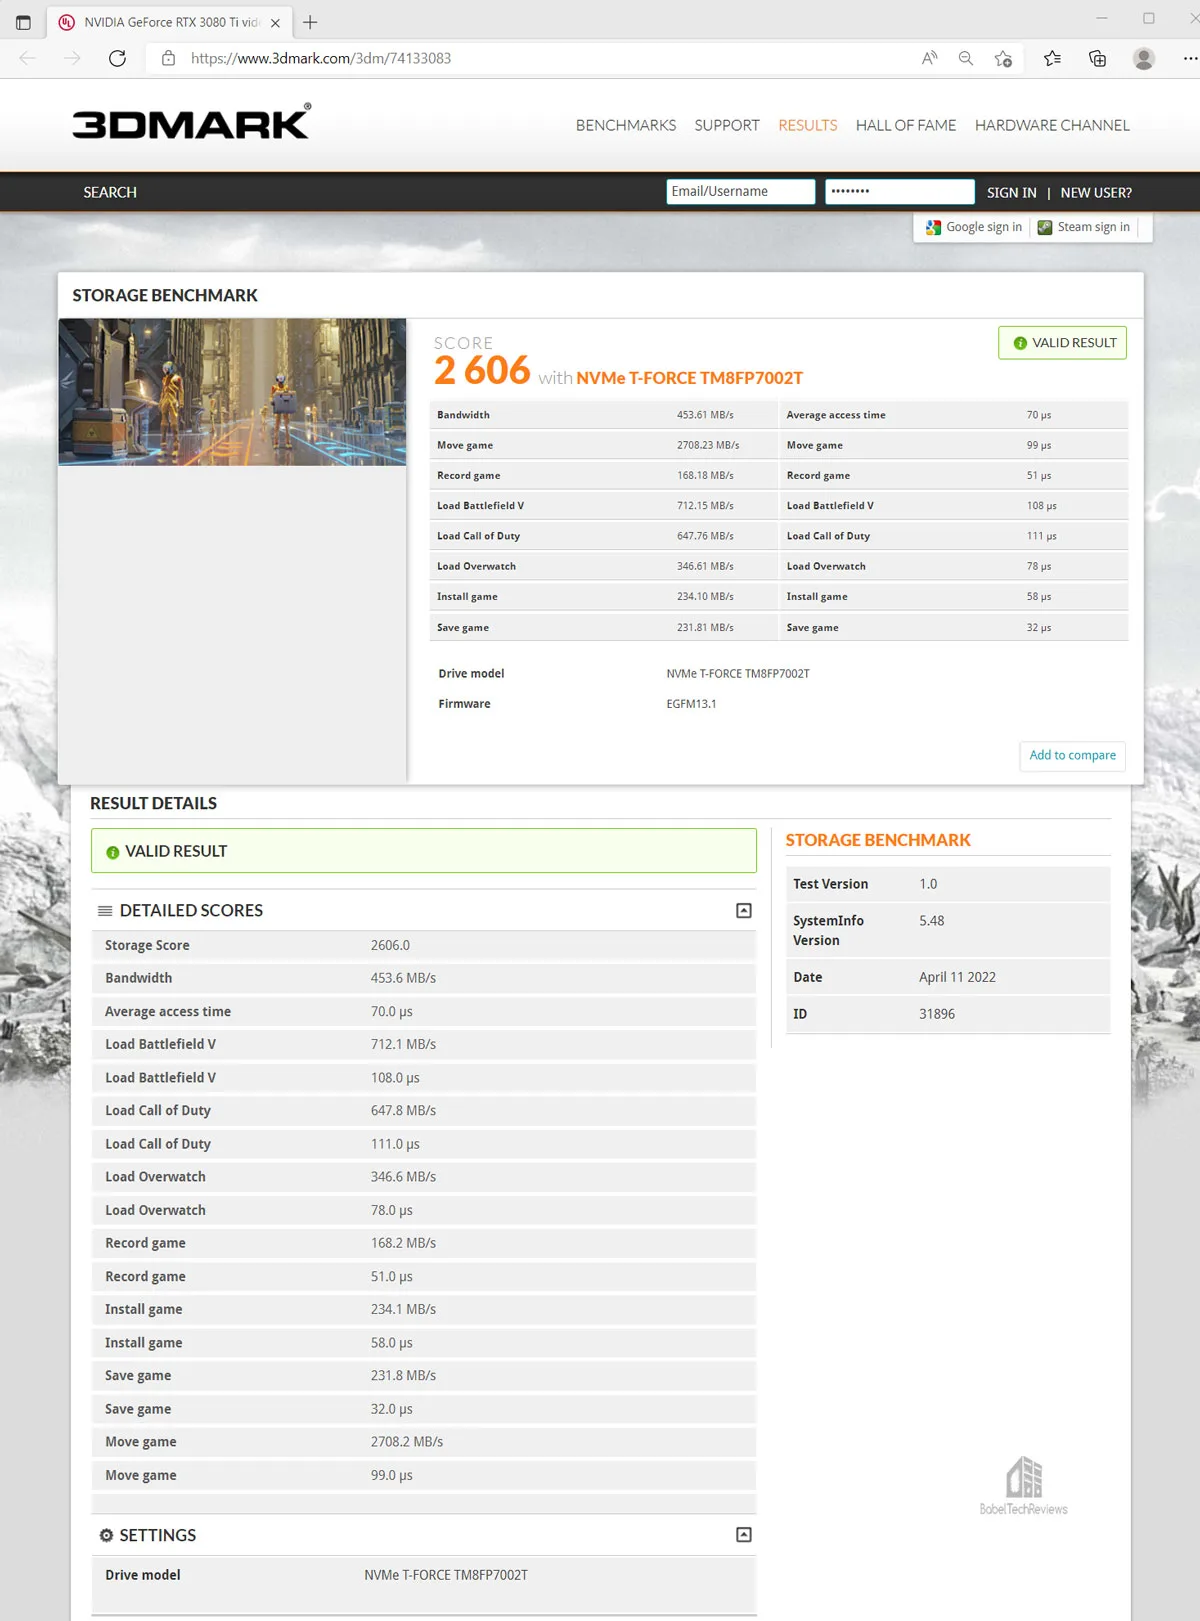 Here’s the summary chart of all nine of our tested drives.
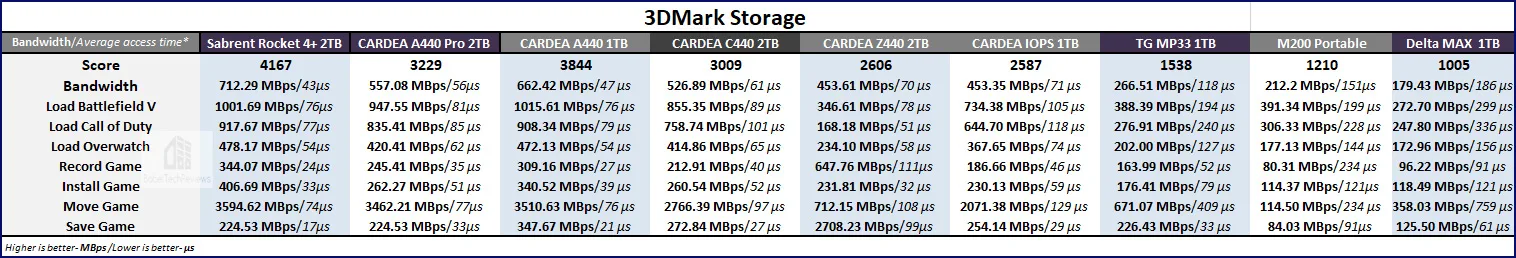
The Sabrent Rocket 4 Plus is the standout as the fastest SSD using the 3DMark Storage benchmark by a wide margin, followed by the CARDEA A440, the A440 Pro Special Series, the C440, the Z440, the IOPS, the MP33, the portable Type C SSD, and the SATA III DELTA MAX.
Next up, another important UL benchmark suite, PCMark 10, including its benching suites – Express, Extended, and the Full System Drive Benchmark.
PCMark 10 Professional
UL (formerly Futuremark) has been a developer and publisher of PC benchmark applications for nearly two decades. Although PCMark benches are synthetic suites, they provide a good measure of system performance. PCMark 10 was primarily developed for Windows 10 and it builds upon the PCMark 8 suite for a package of vendor-neutral home and office benchmarks.
The regular version of PCMark 10 misses several key elements such as detailed storage testing, but the Professional version, which we use courtesy of UL, includes a storage benchmark and a full system drive benchmark. In addition, We use both PCMark 10’s Express and Extended suite.
First up is the Full System Drive Benchmark.
Full System Drive Benchmark
The CARDEA ZERO Z440 scores 3396. 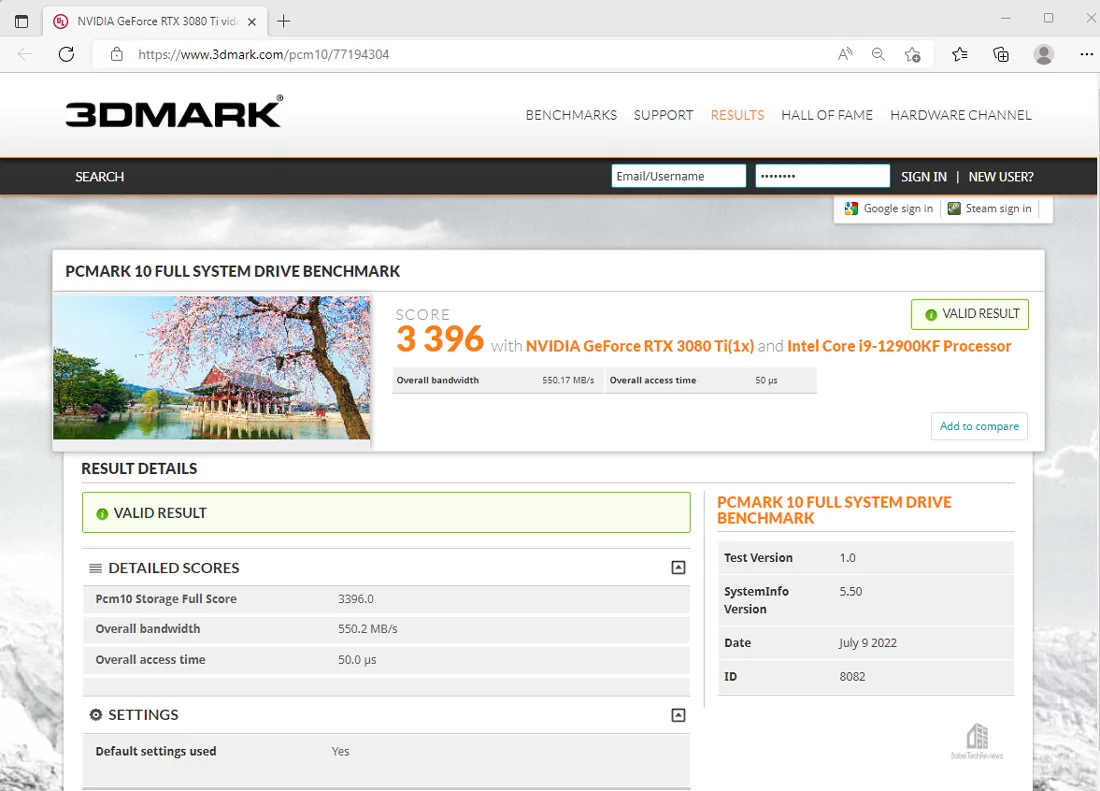 Here’s the summary chart of all of our tested drives.

The Rocket 4 Plus is the second fastest SSD after the Cardea A440. On to PCMark 10.
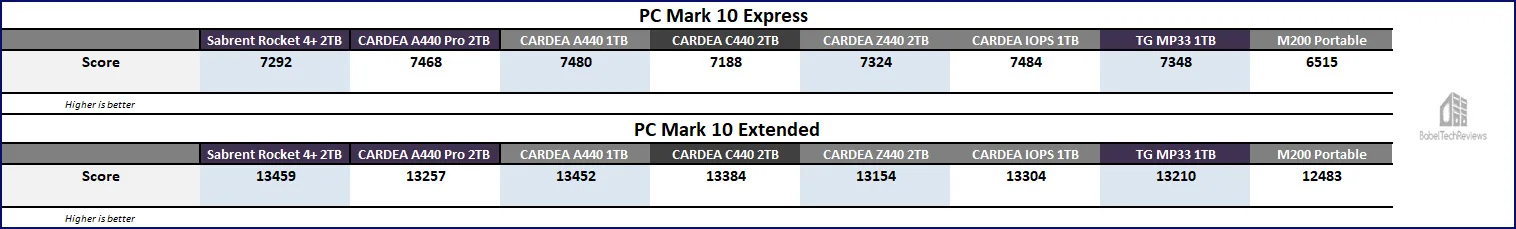
PCMark 10 Express
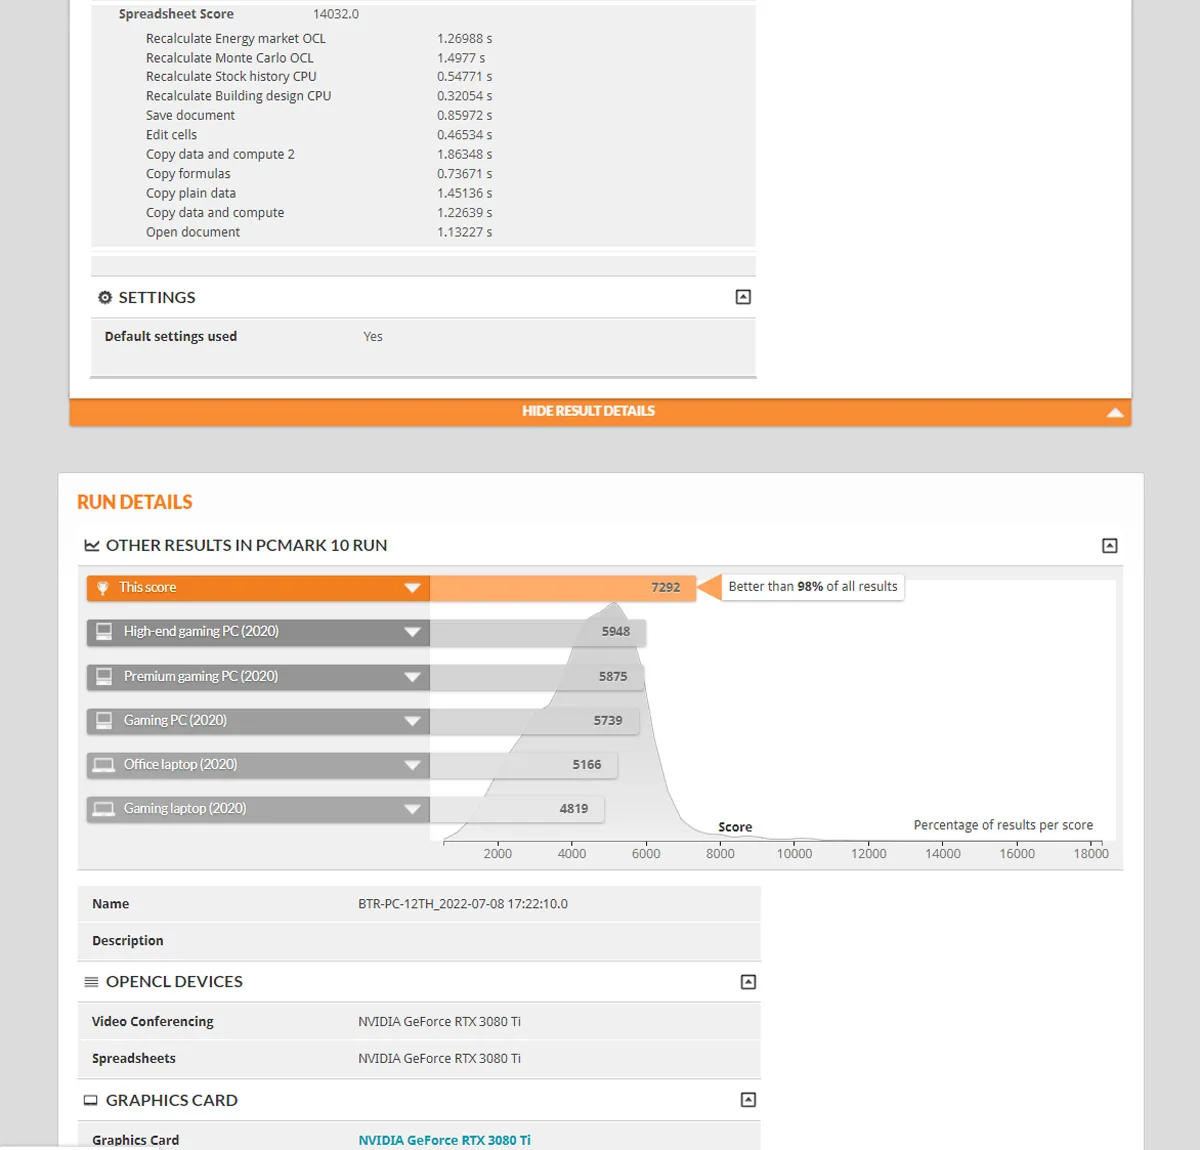
First, the Sabrent Rocket 4 Plus scores 7292.
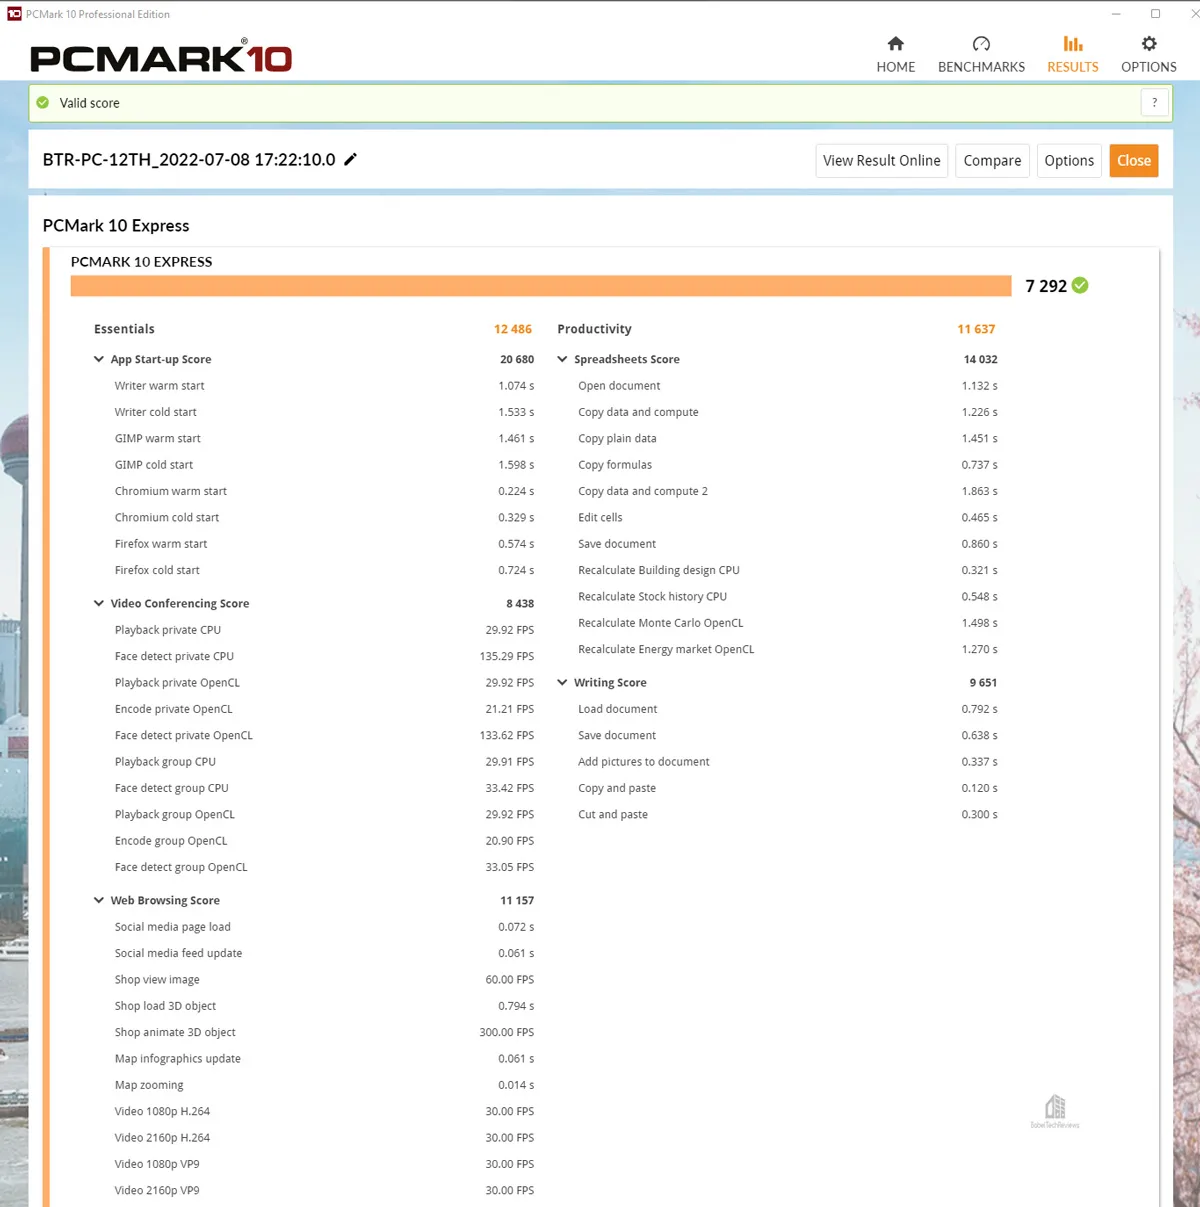
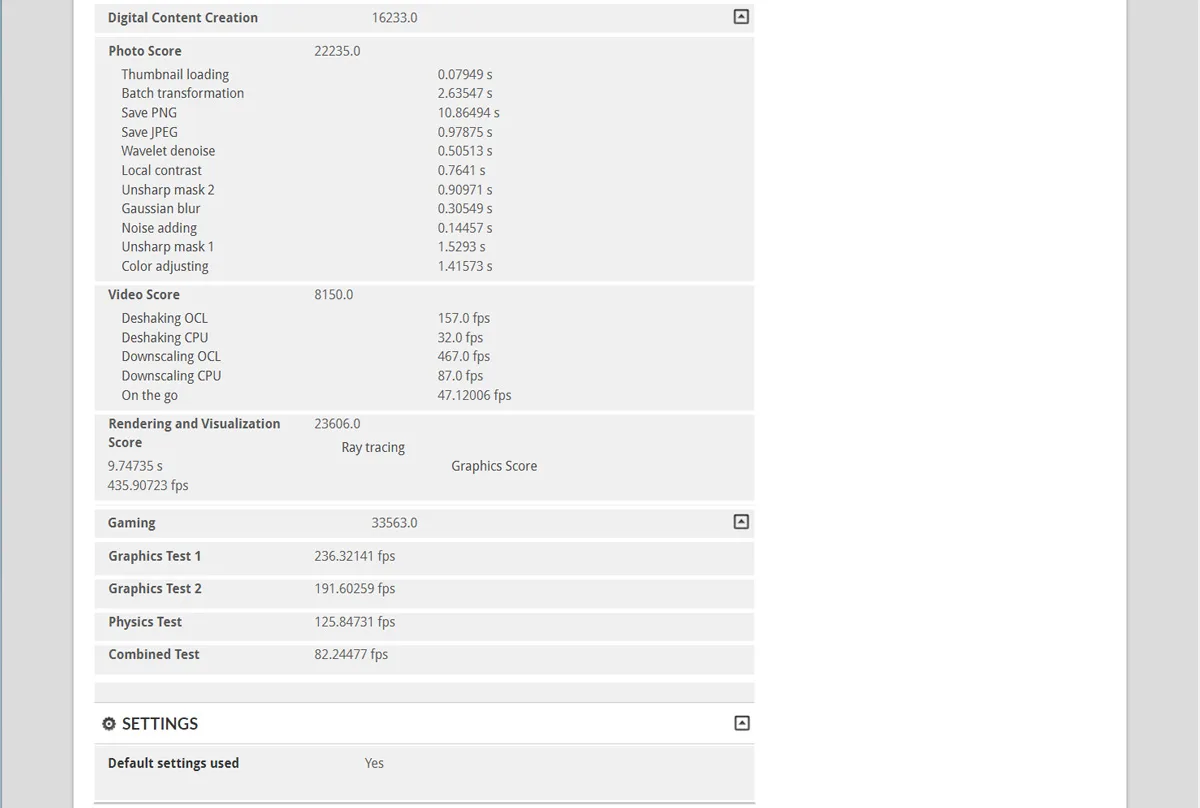
Below are the Rocket 4 Plus online validated score which gives more detailed results.
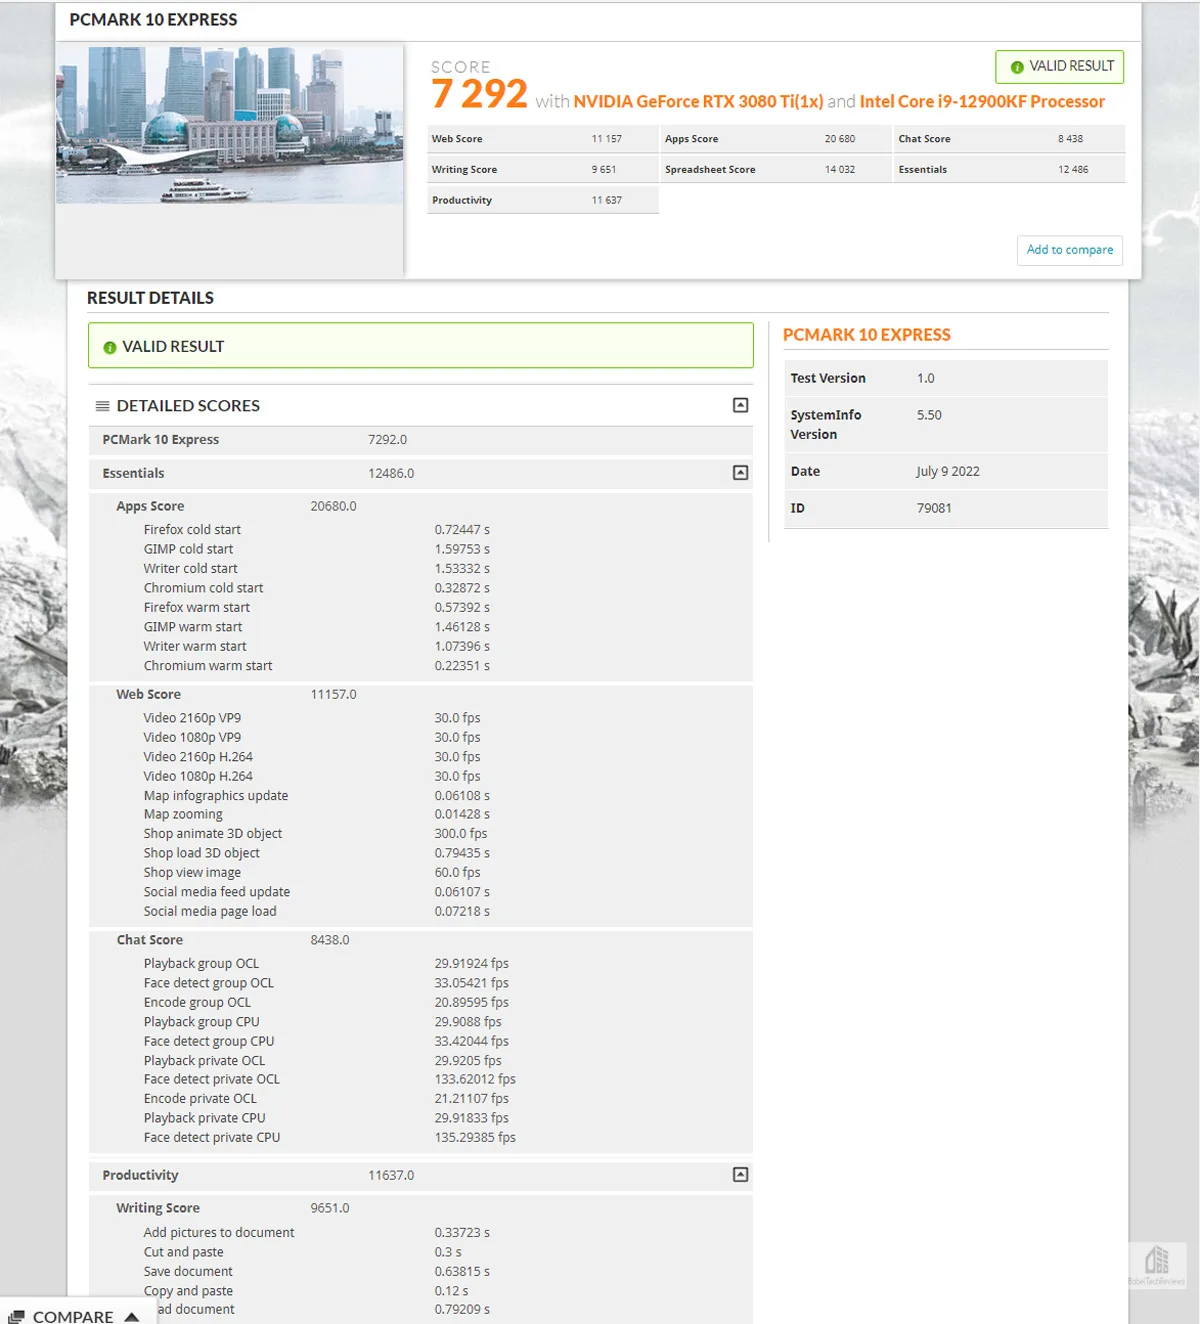
Next, the A440 Pro Special Series results with 7468. 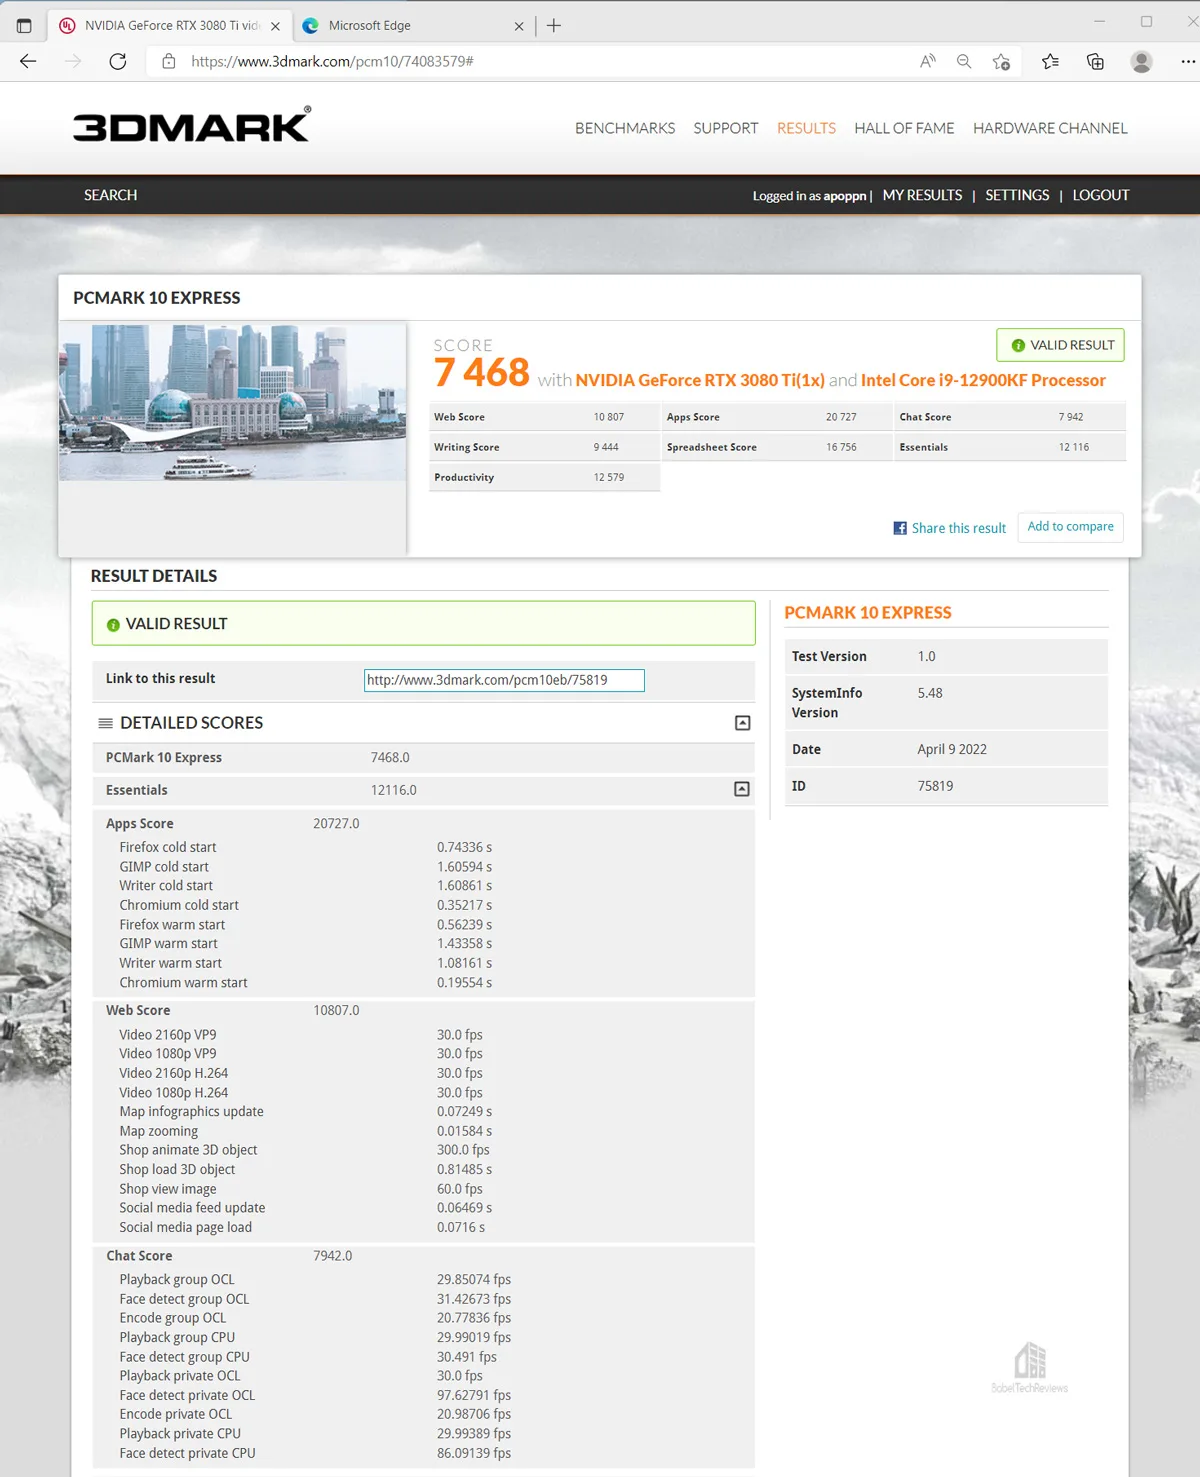
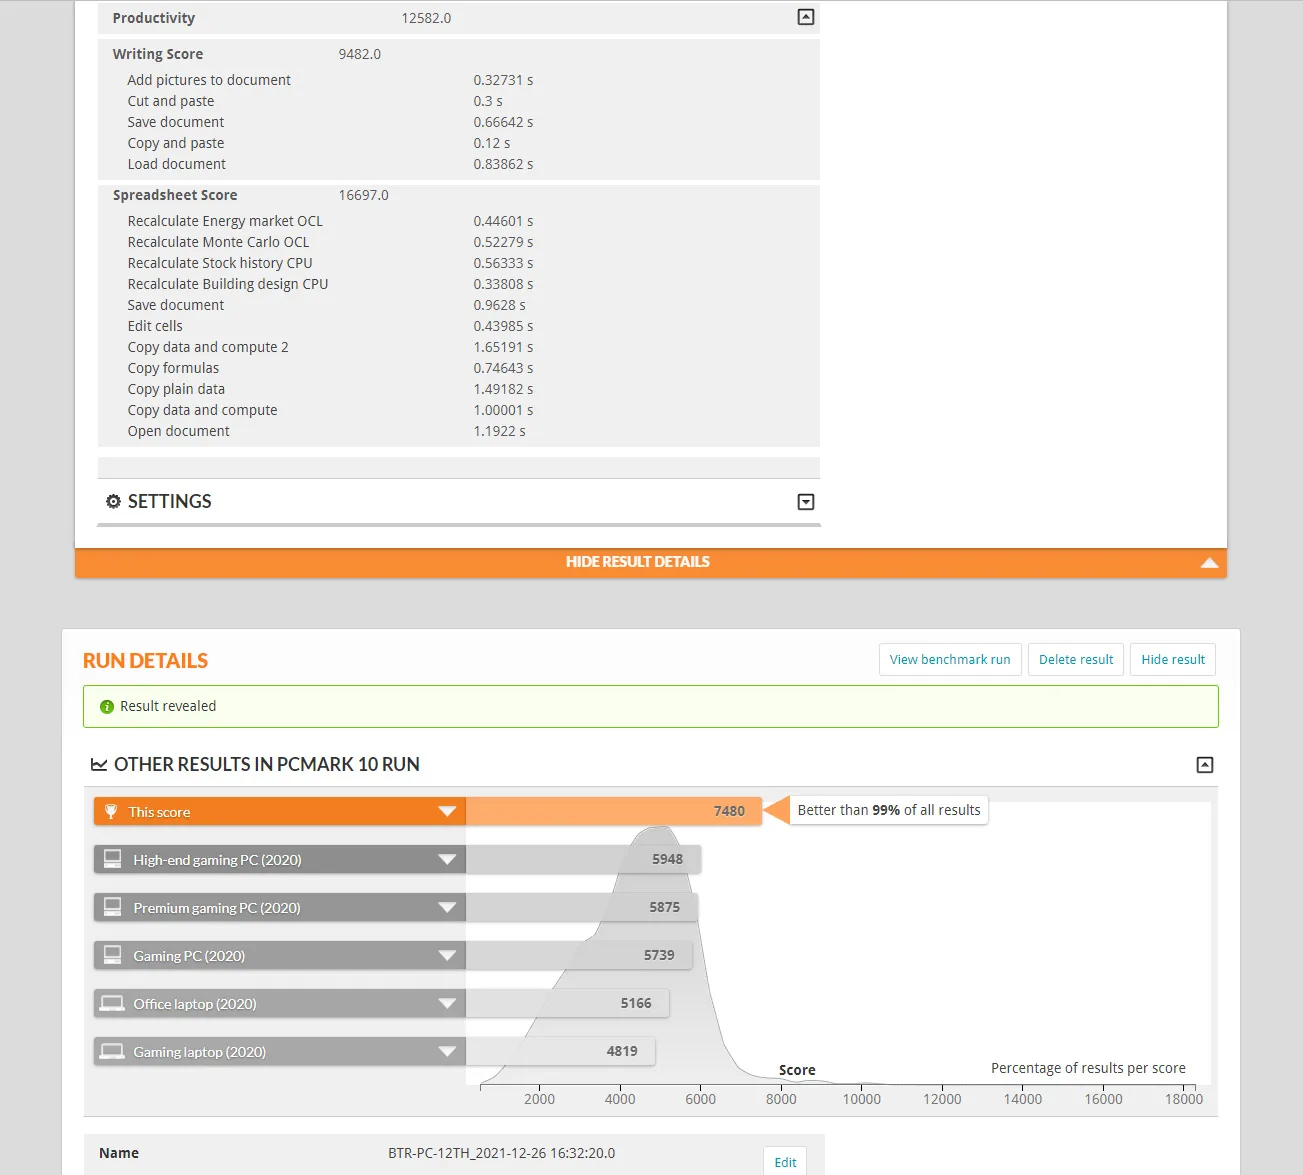
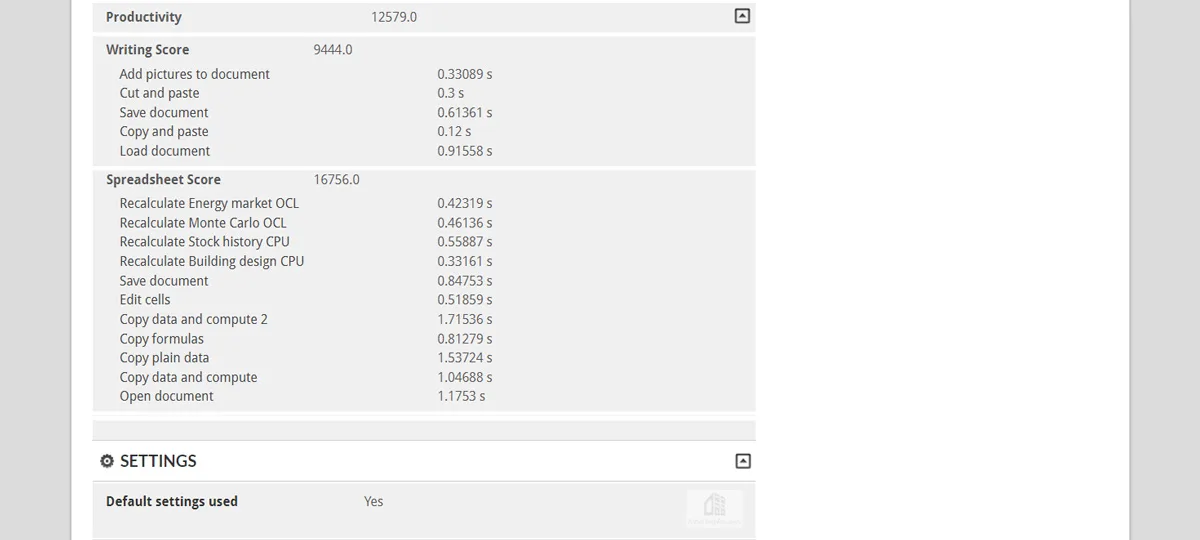 Below is the CARDEA A440 Express score with 7480.
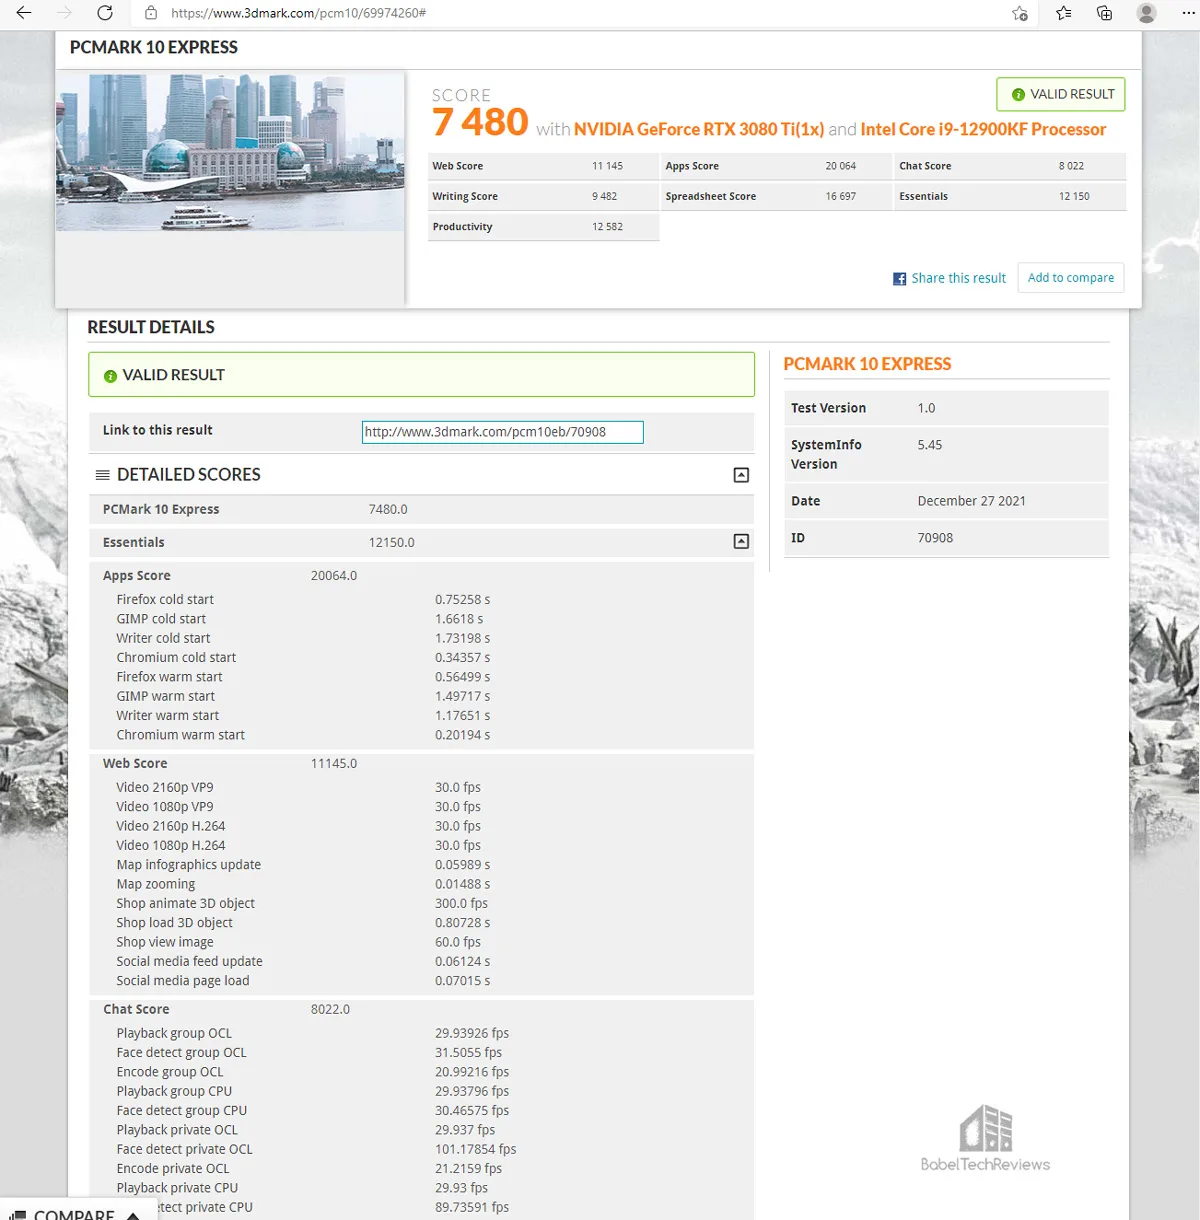
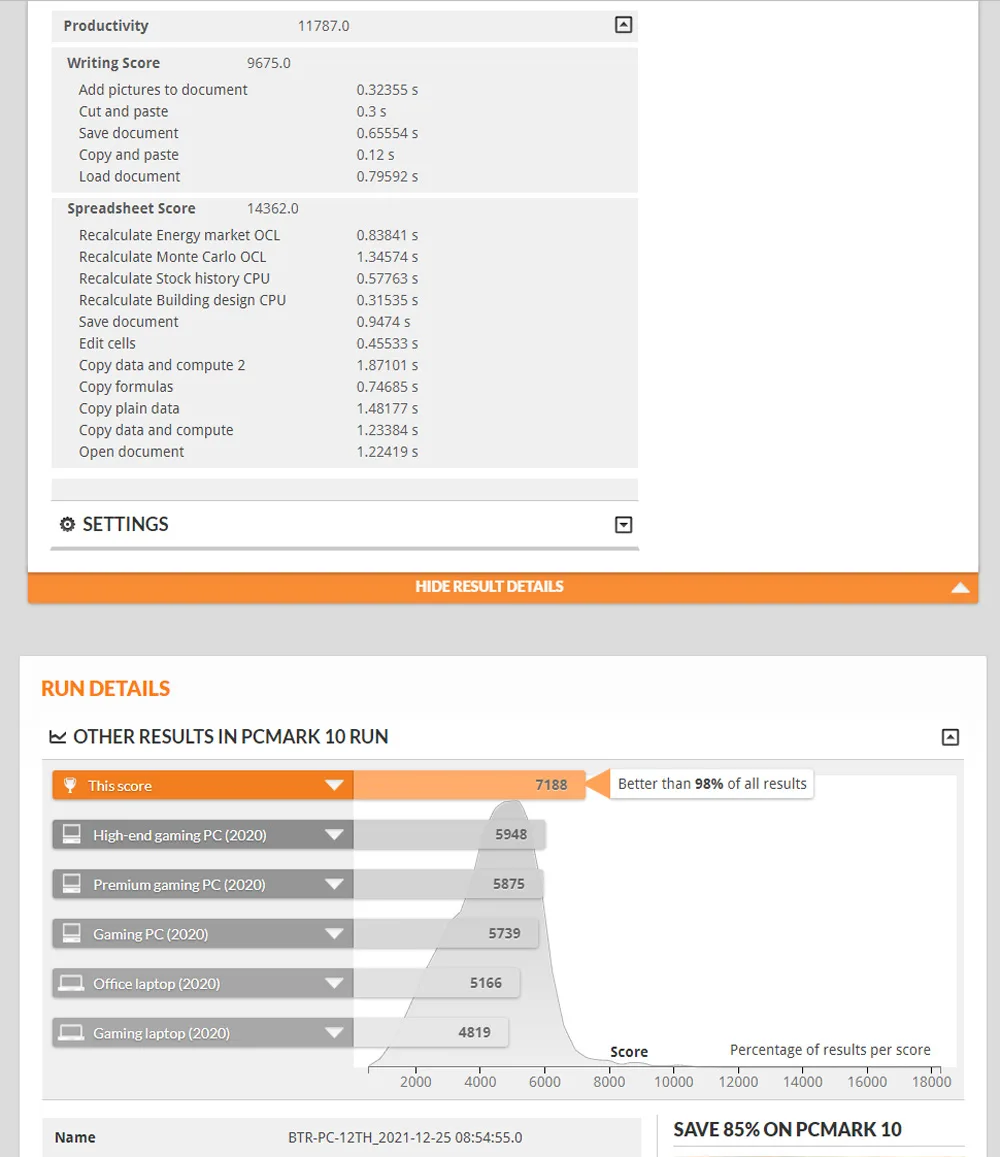
 The CARDEA Ceramic C440 Express score is 7188.
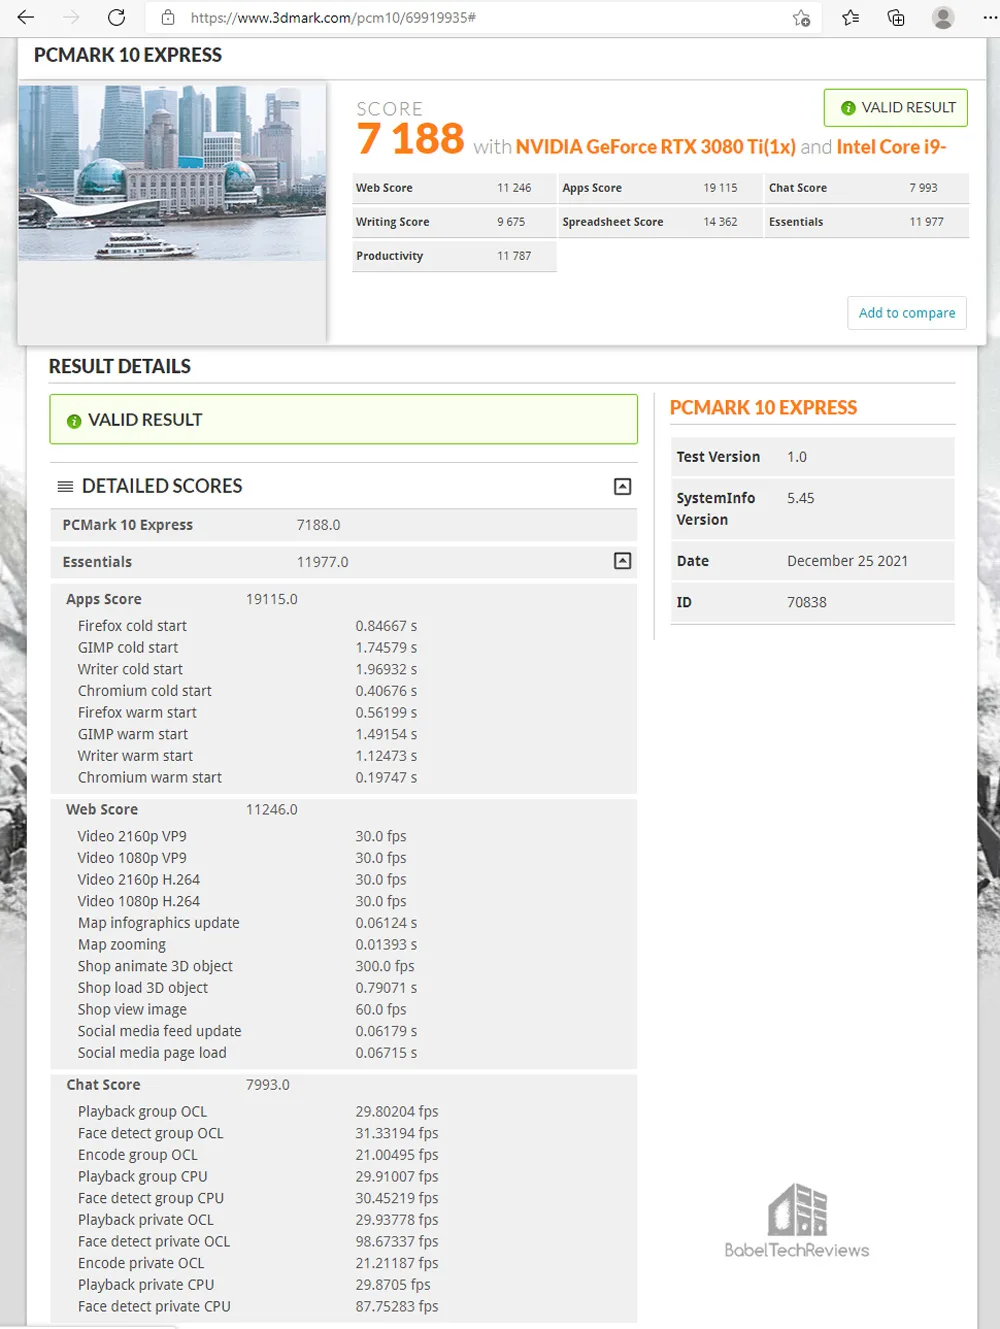
The Z440 scores 7324.
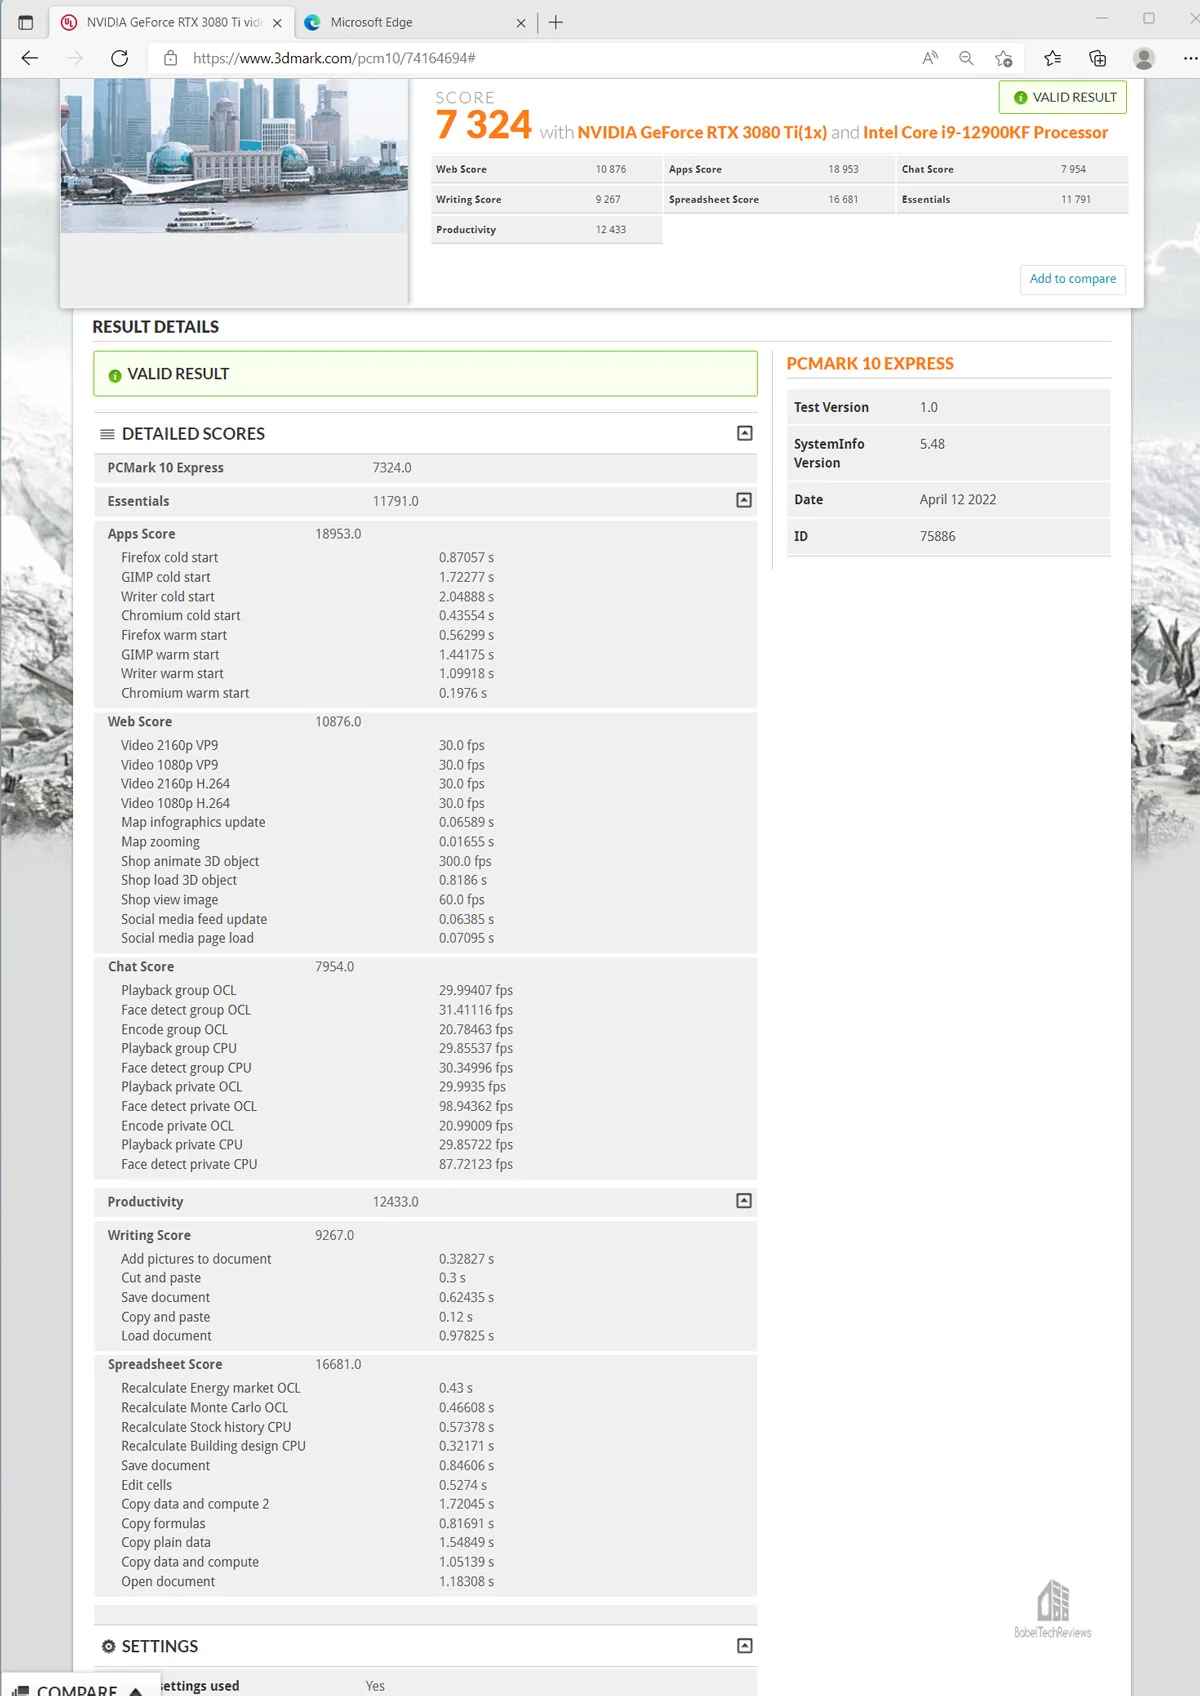
The summary chart is presented after the Extended scores.
PCMark 10 Extended
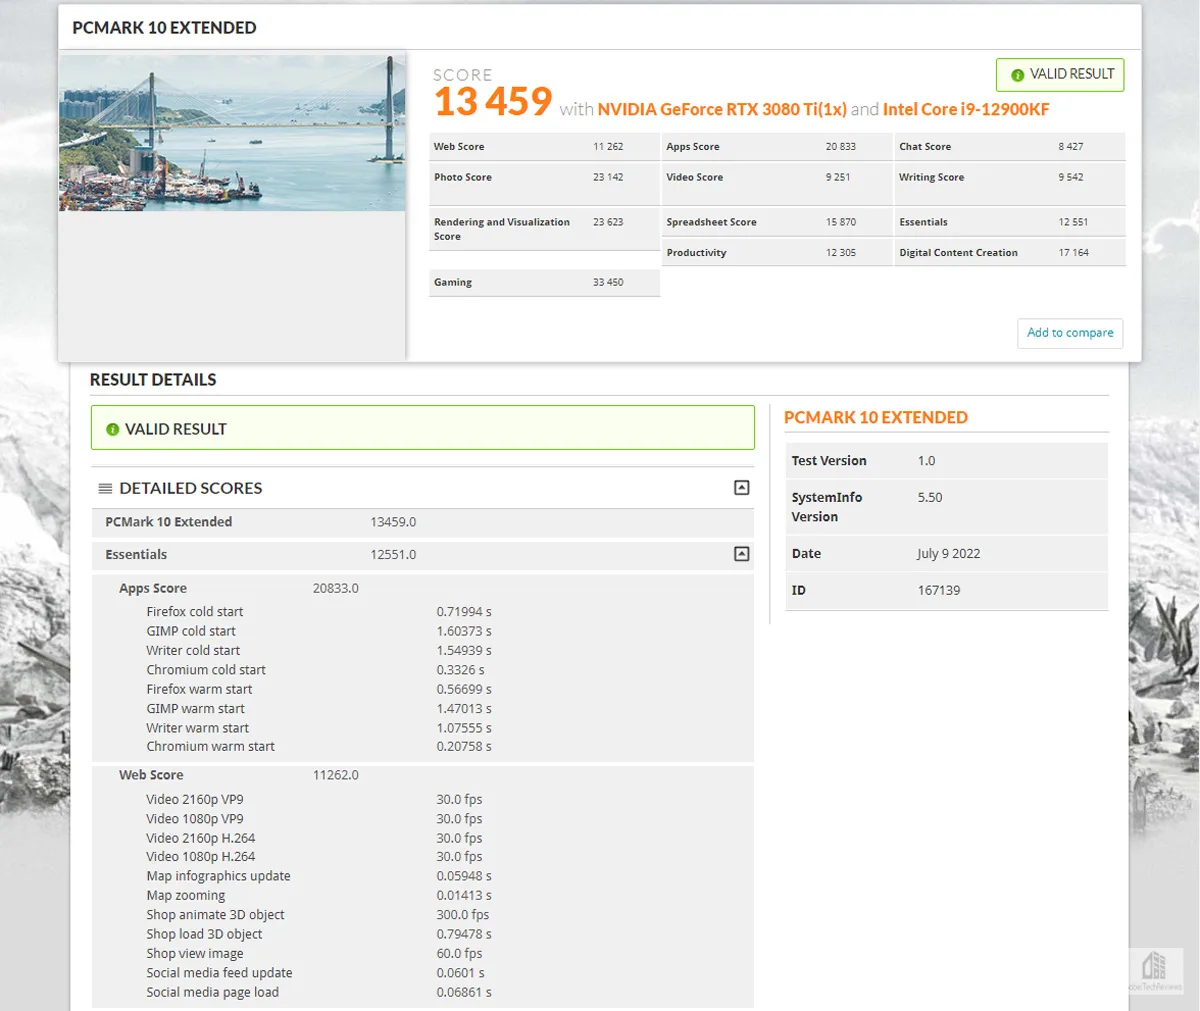
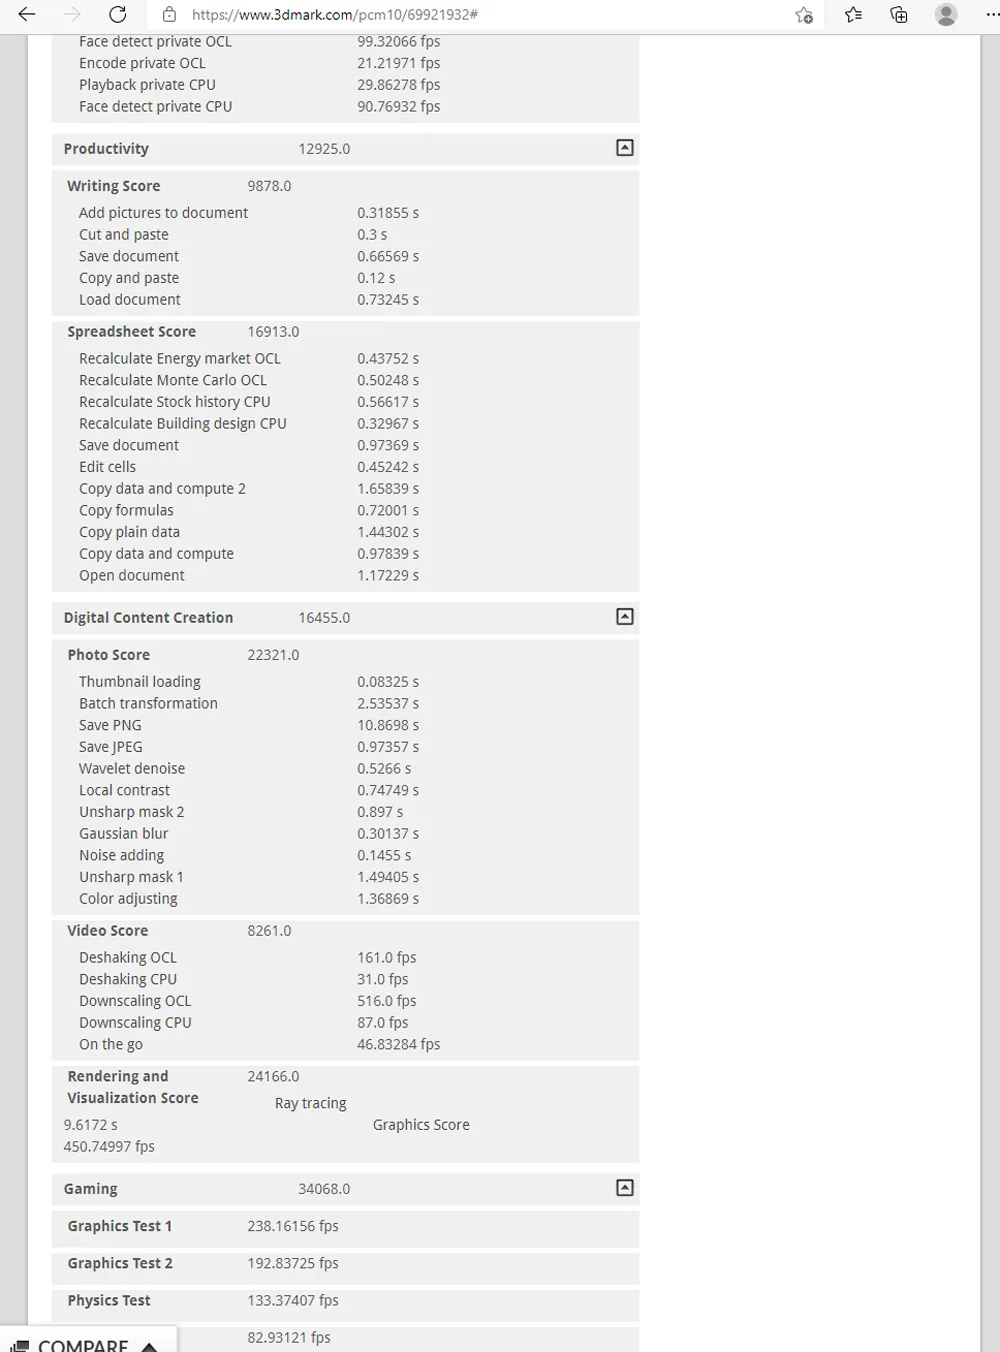
First up, the Sabrent Rocket 4 Plus Extended score with 13459.
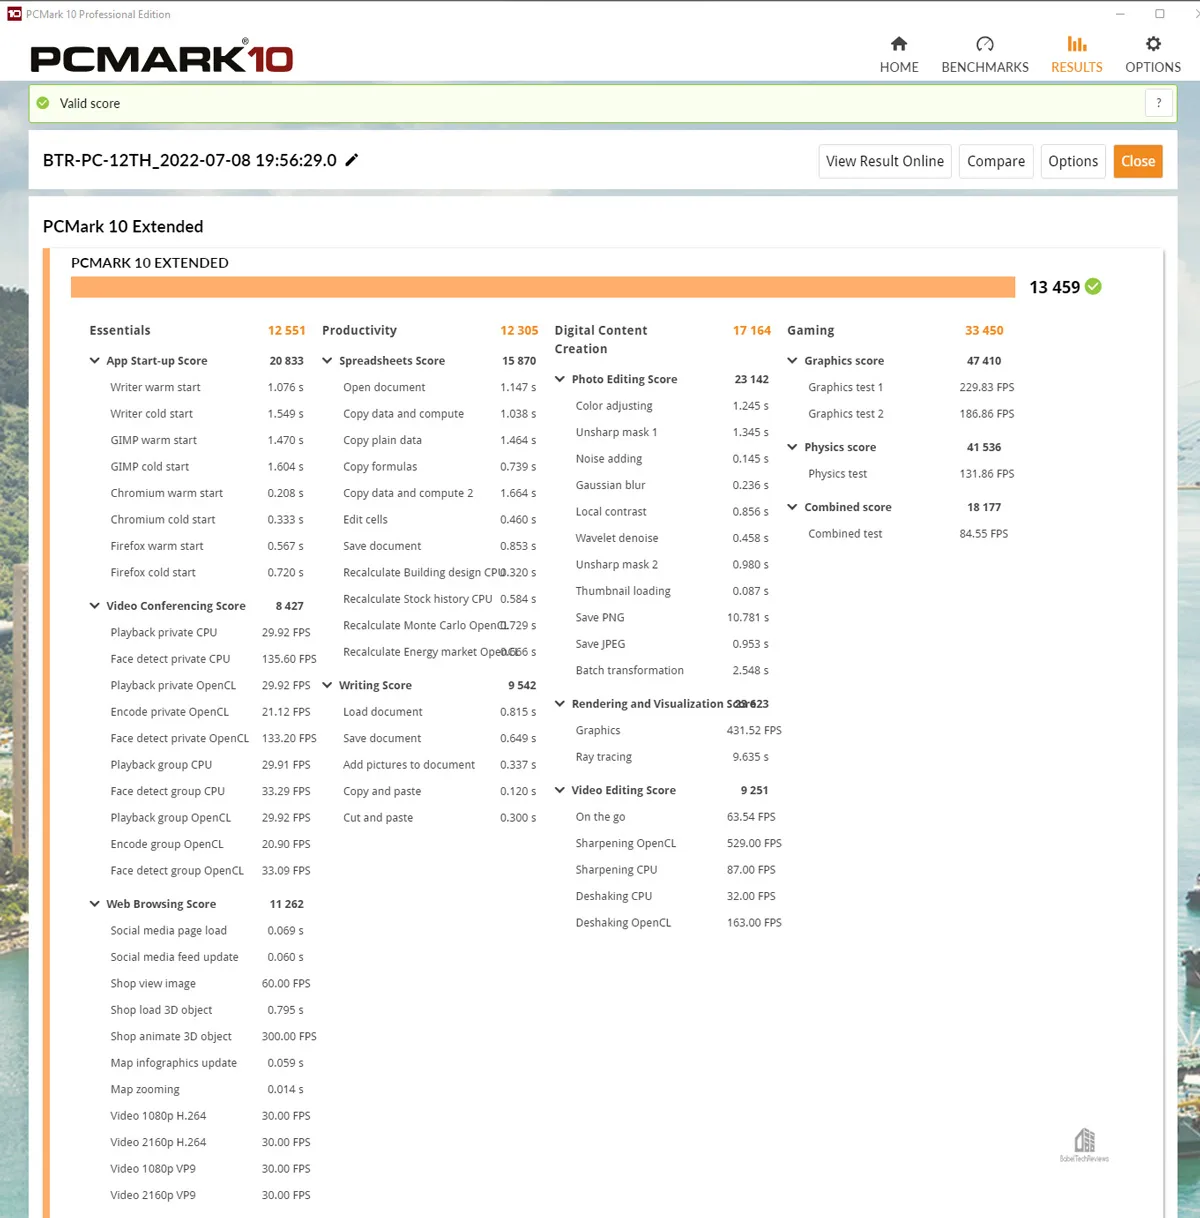
Next the Rocket 4 Plus online details.
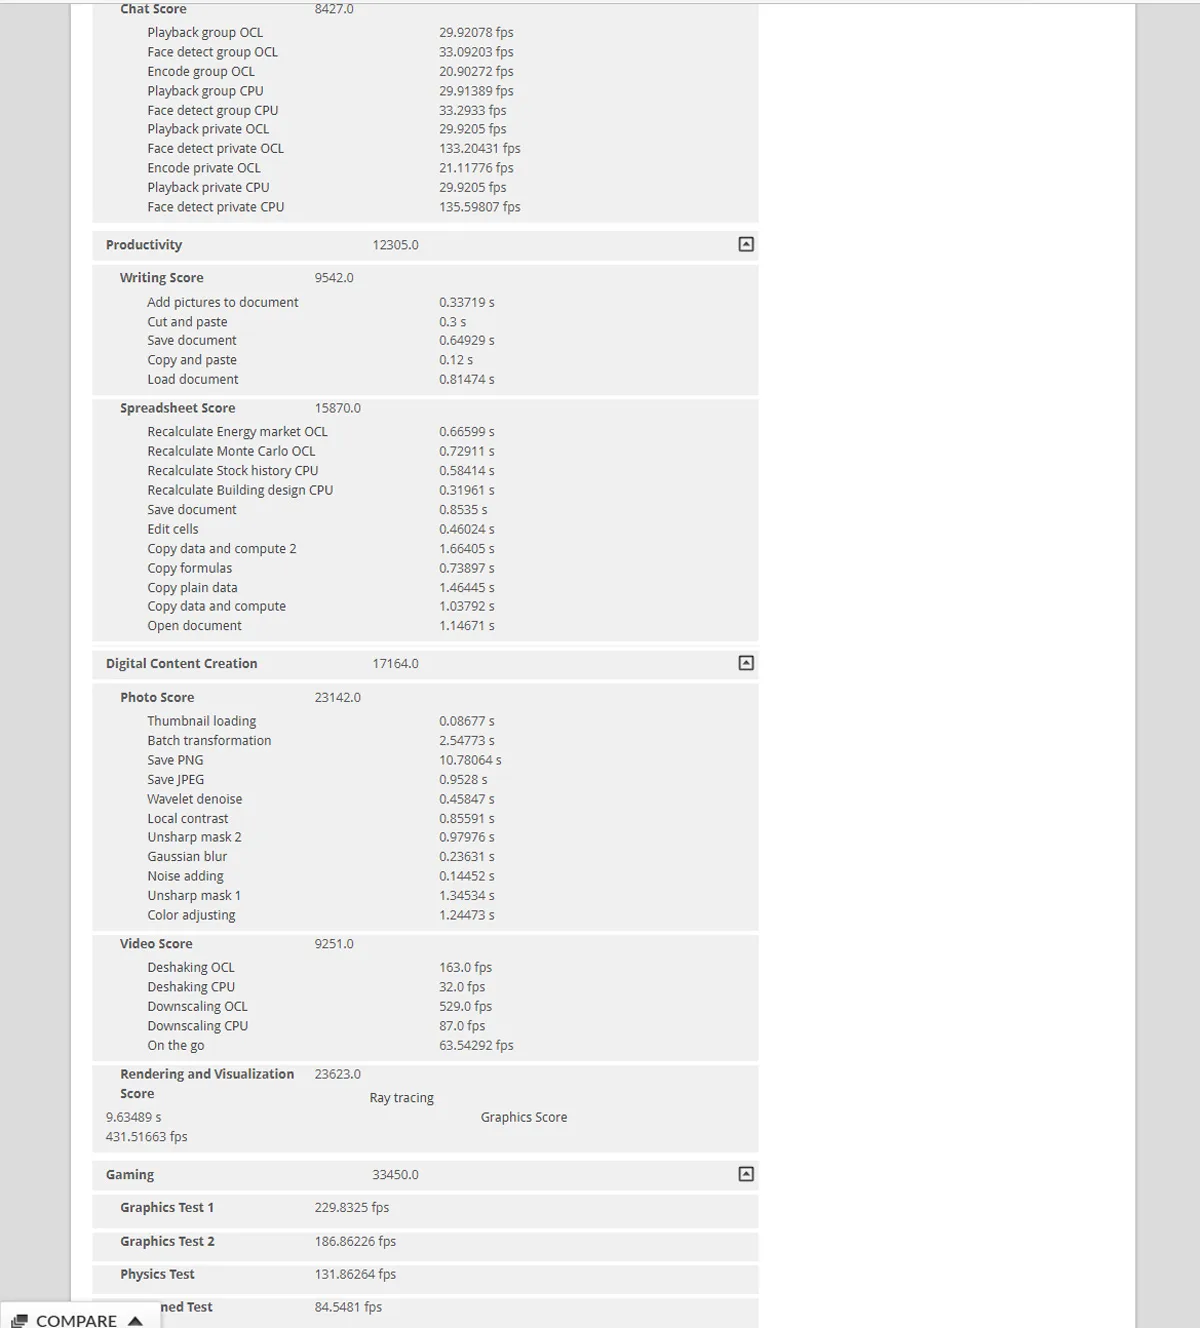
The CARDEA A440 Pro Special Series Extended score is 13257.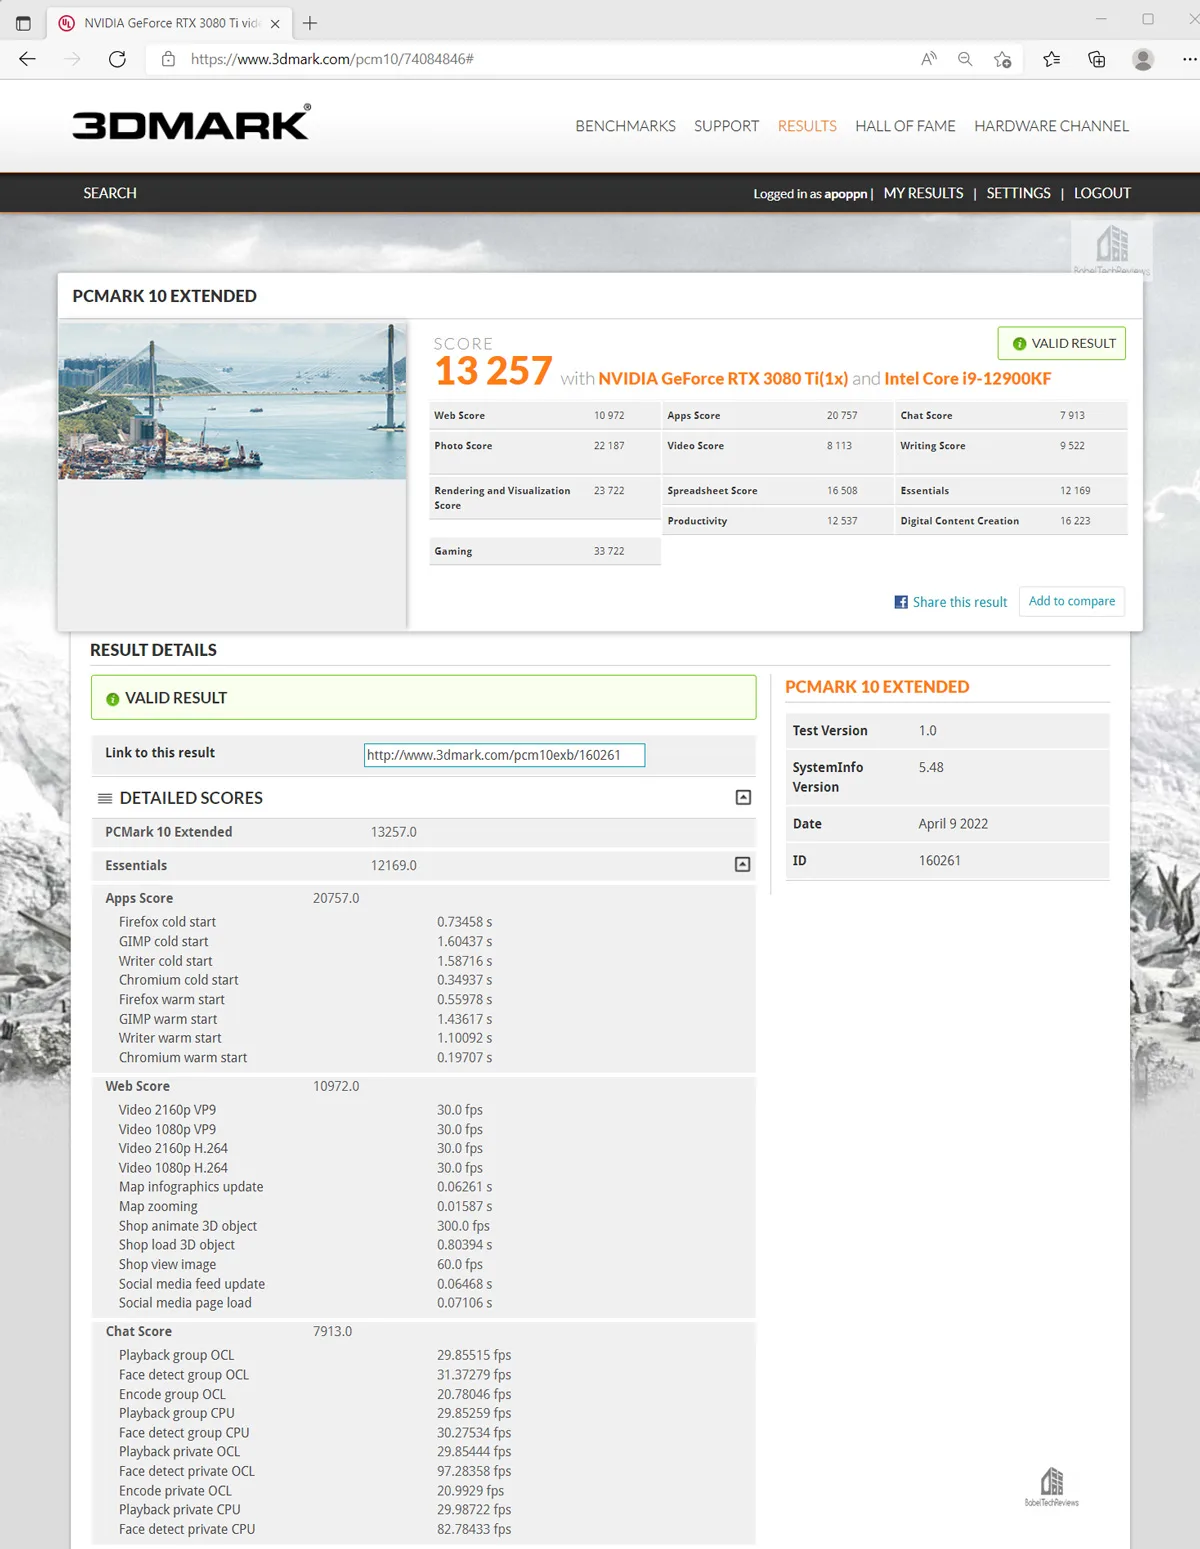
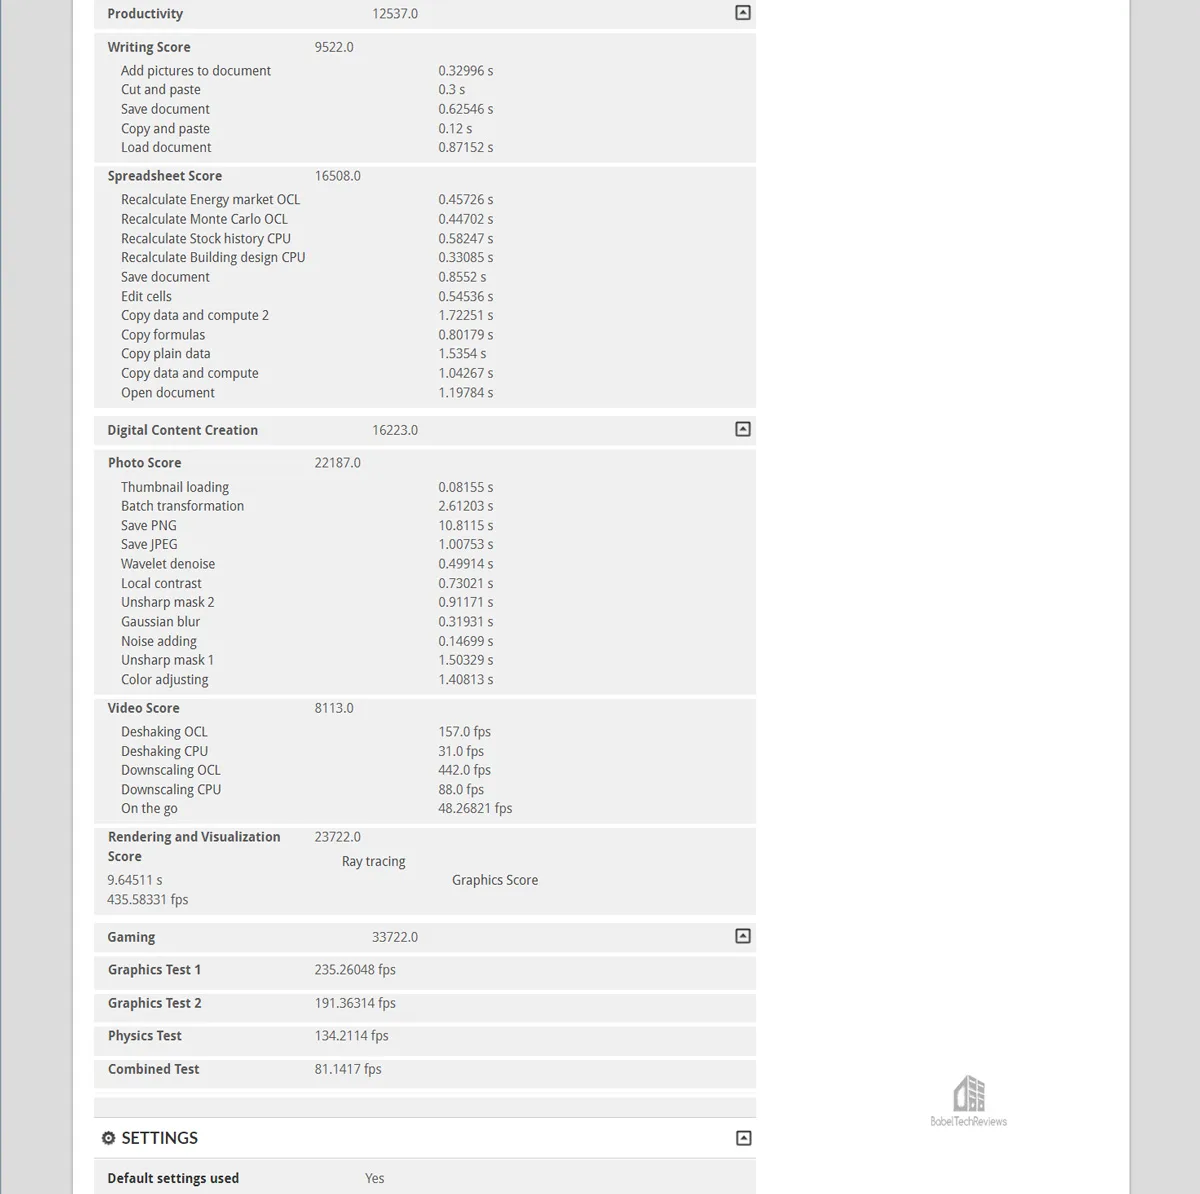 Next, the CARDEA A440 Extended score is 13452.
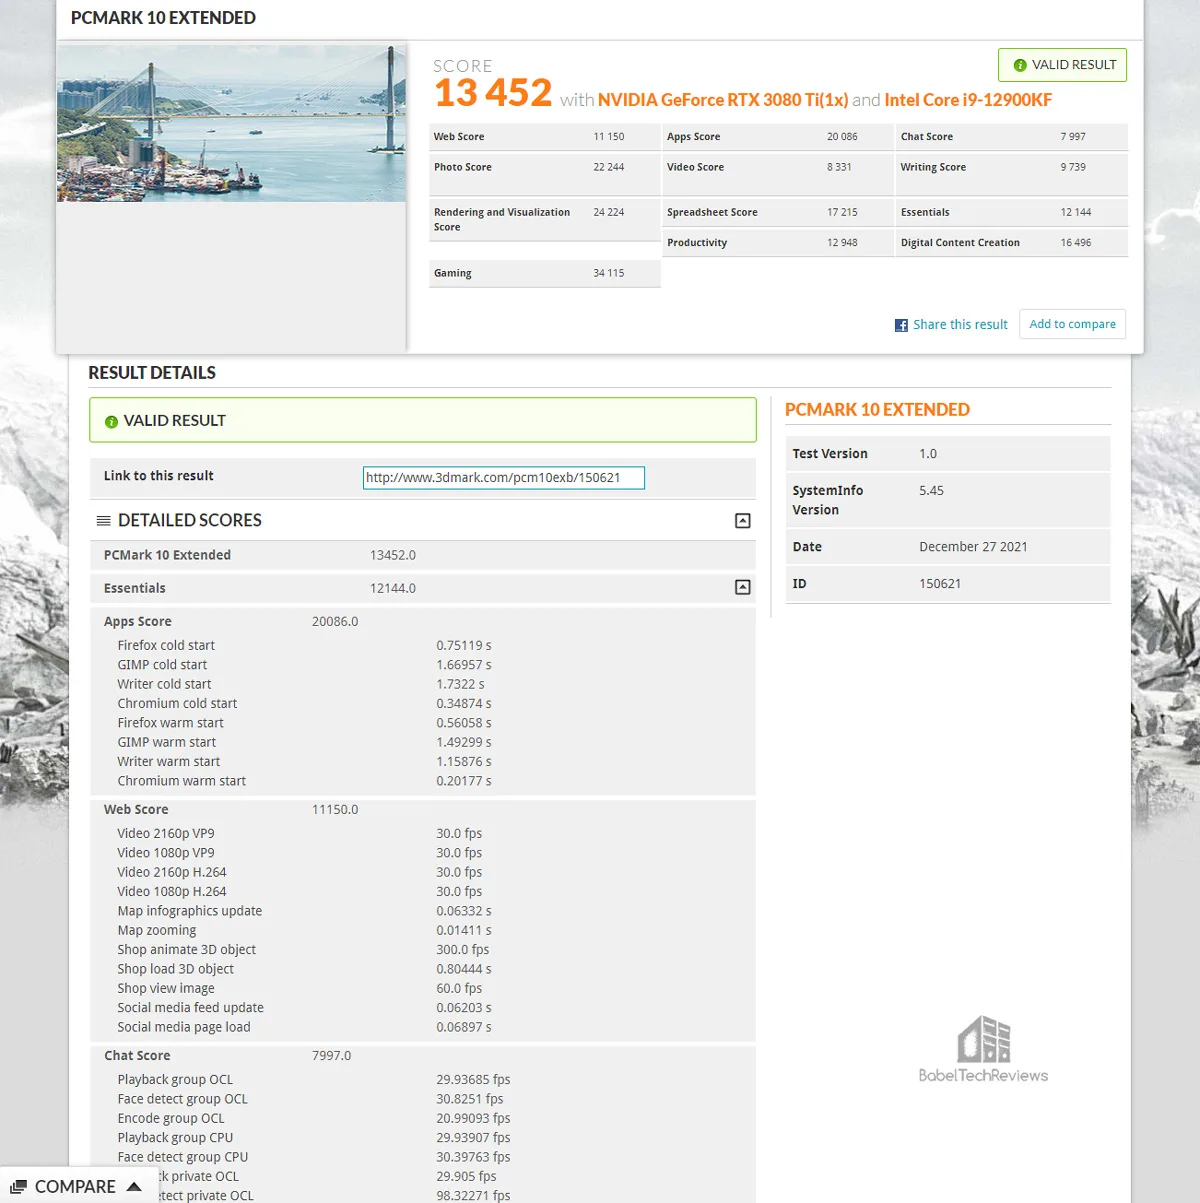
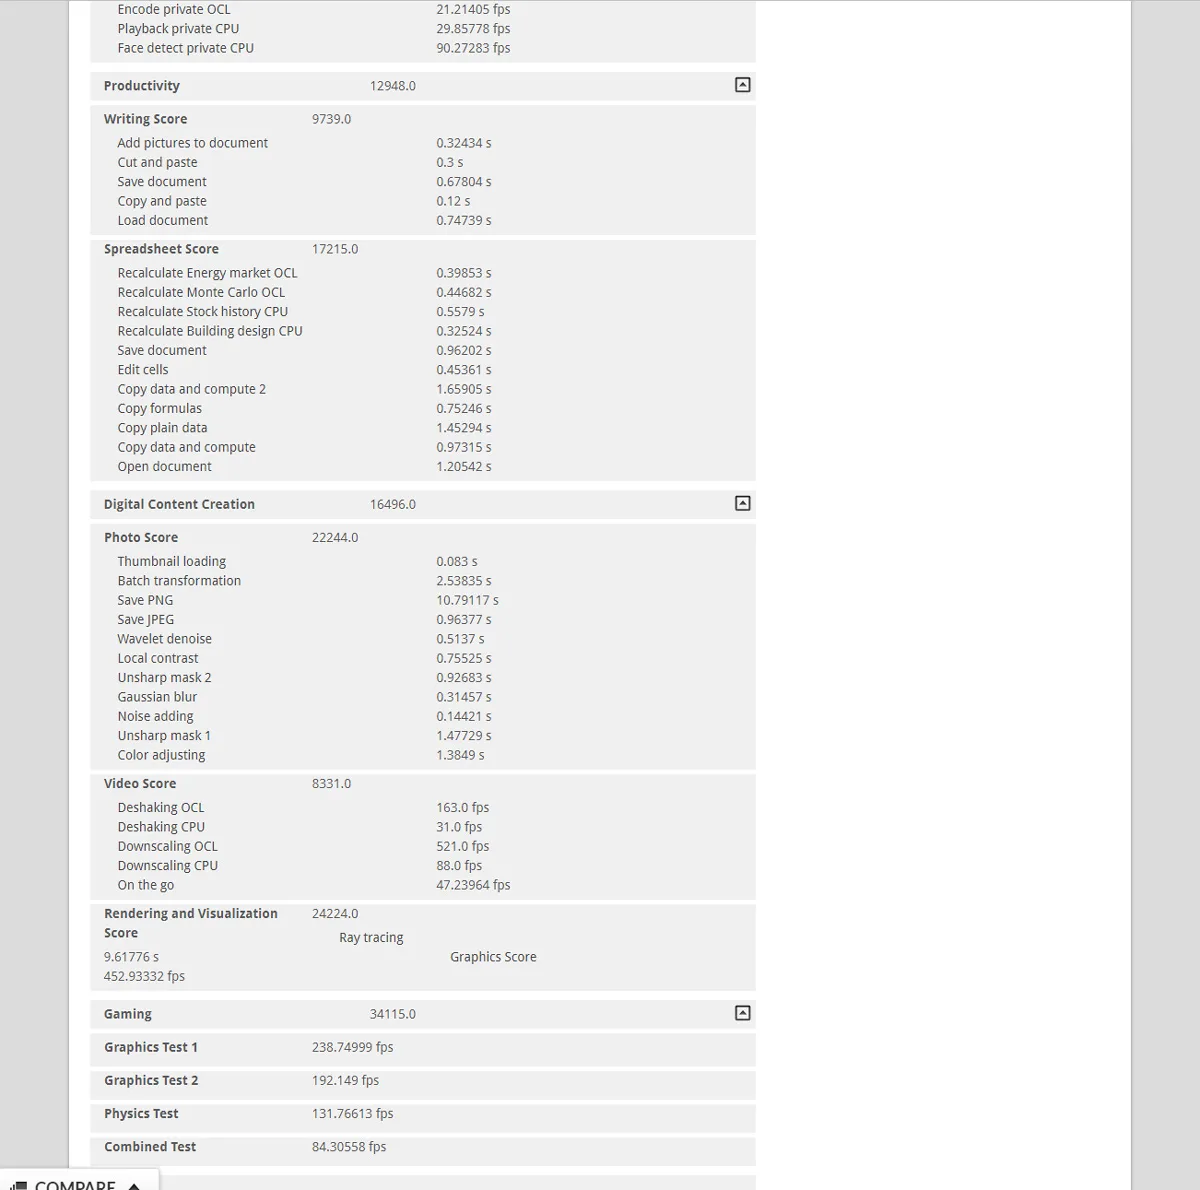 The CARDEA Ceramic C440 Extended score is 13384.
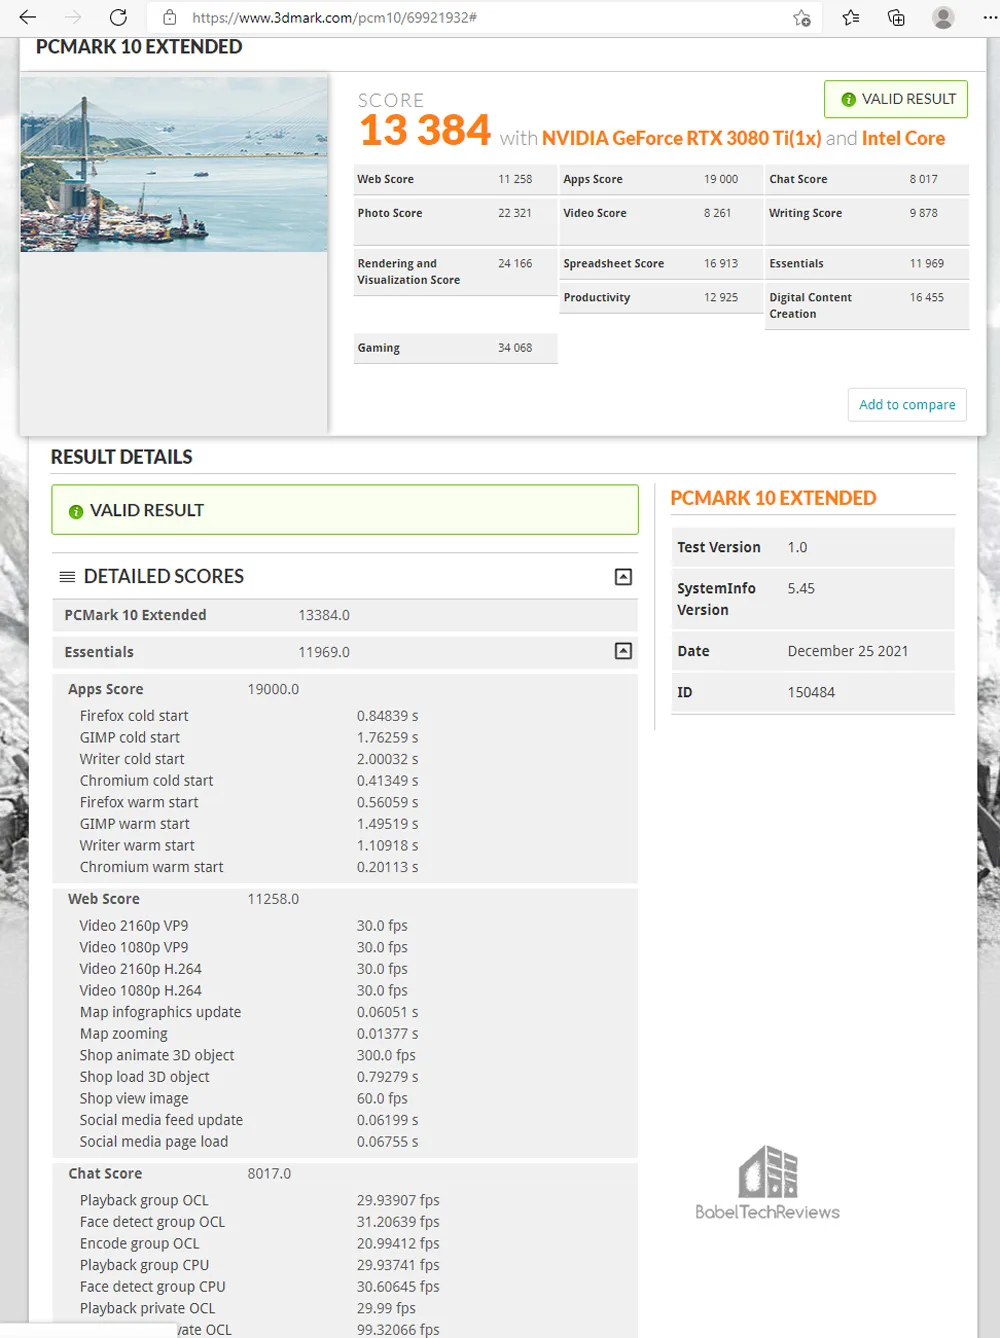
Finally, the CARDEA ZERO Z440 Extended score is 13154. 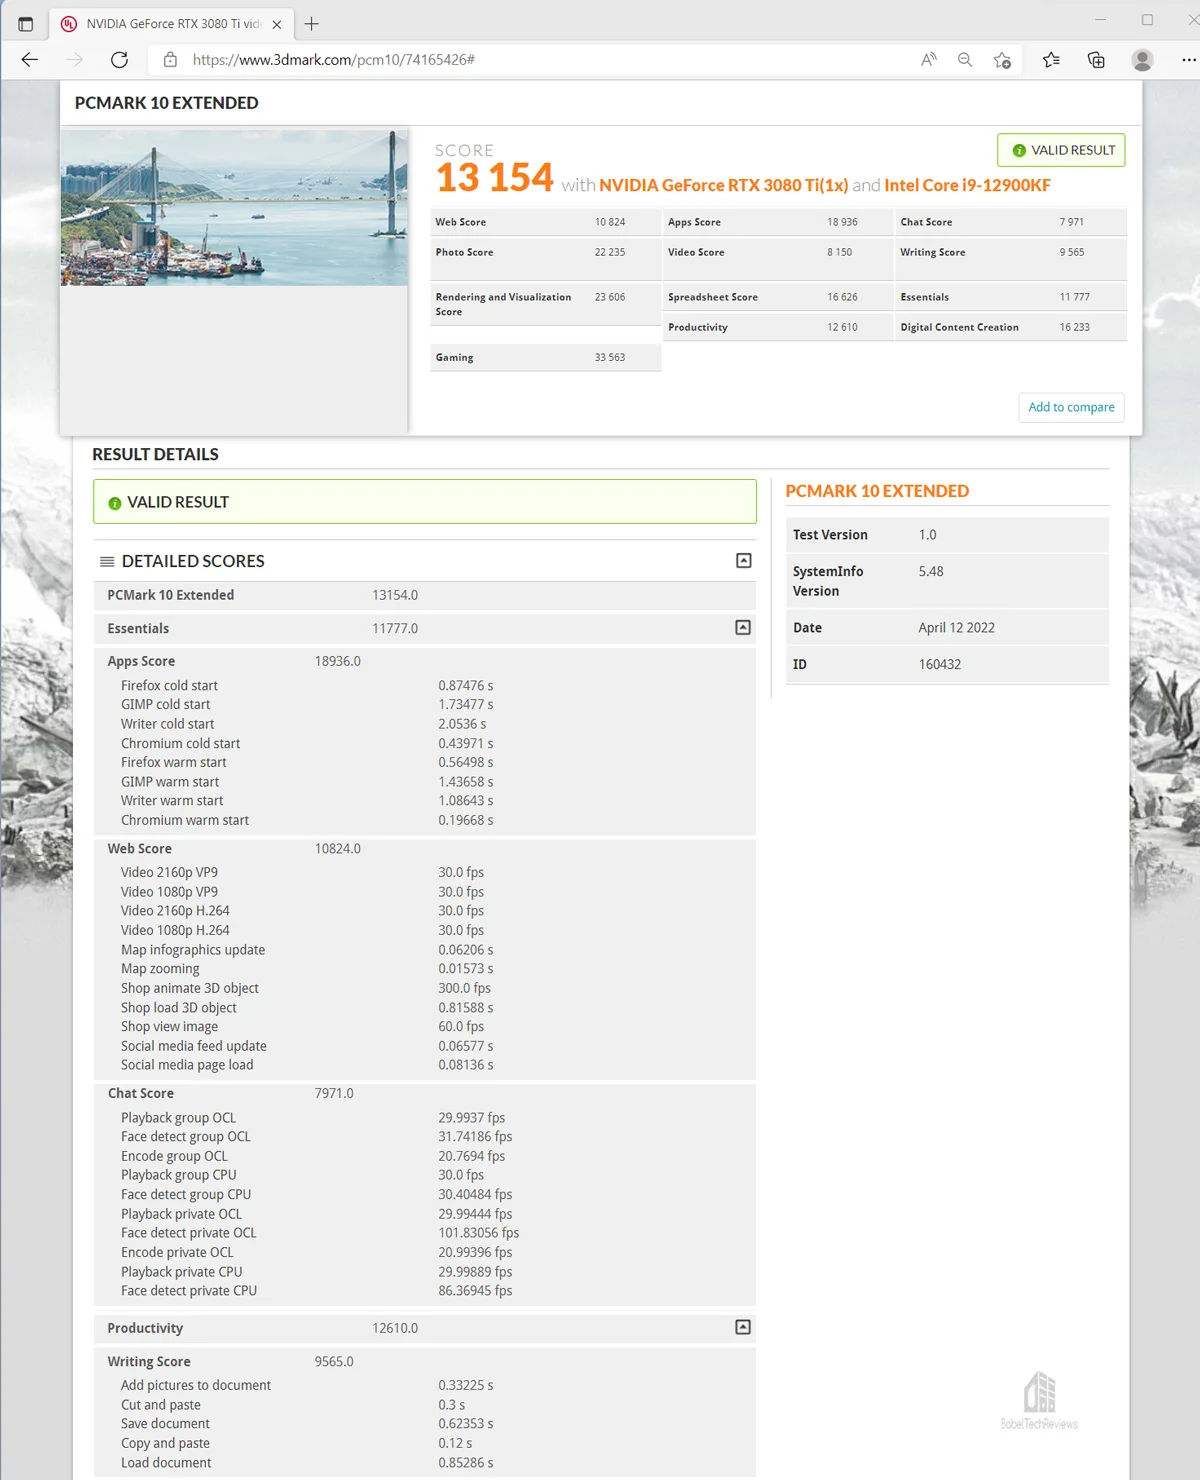
Here’s the summary chart.
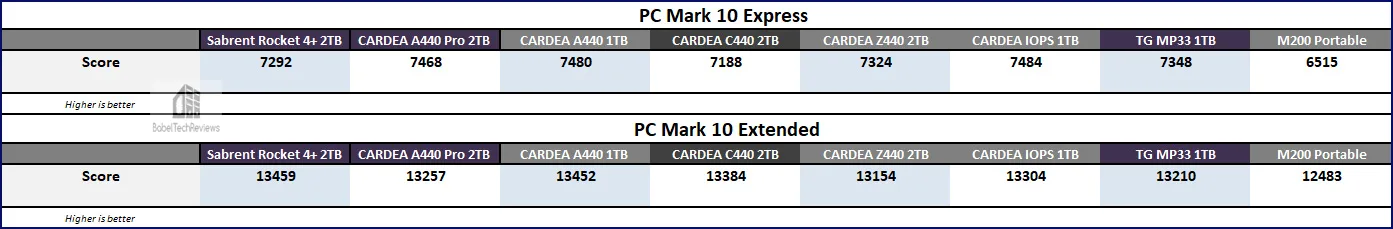
In the Express suite, the Rocket 4 Plus trails most of the PCIe drives except for the Cardea C440. In the more demanding Extended suite, the Rocket 4 Plus is the fastest SSD. The Delta MAX SATA III SSD could not be tested since Windows is not set up on it.
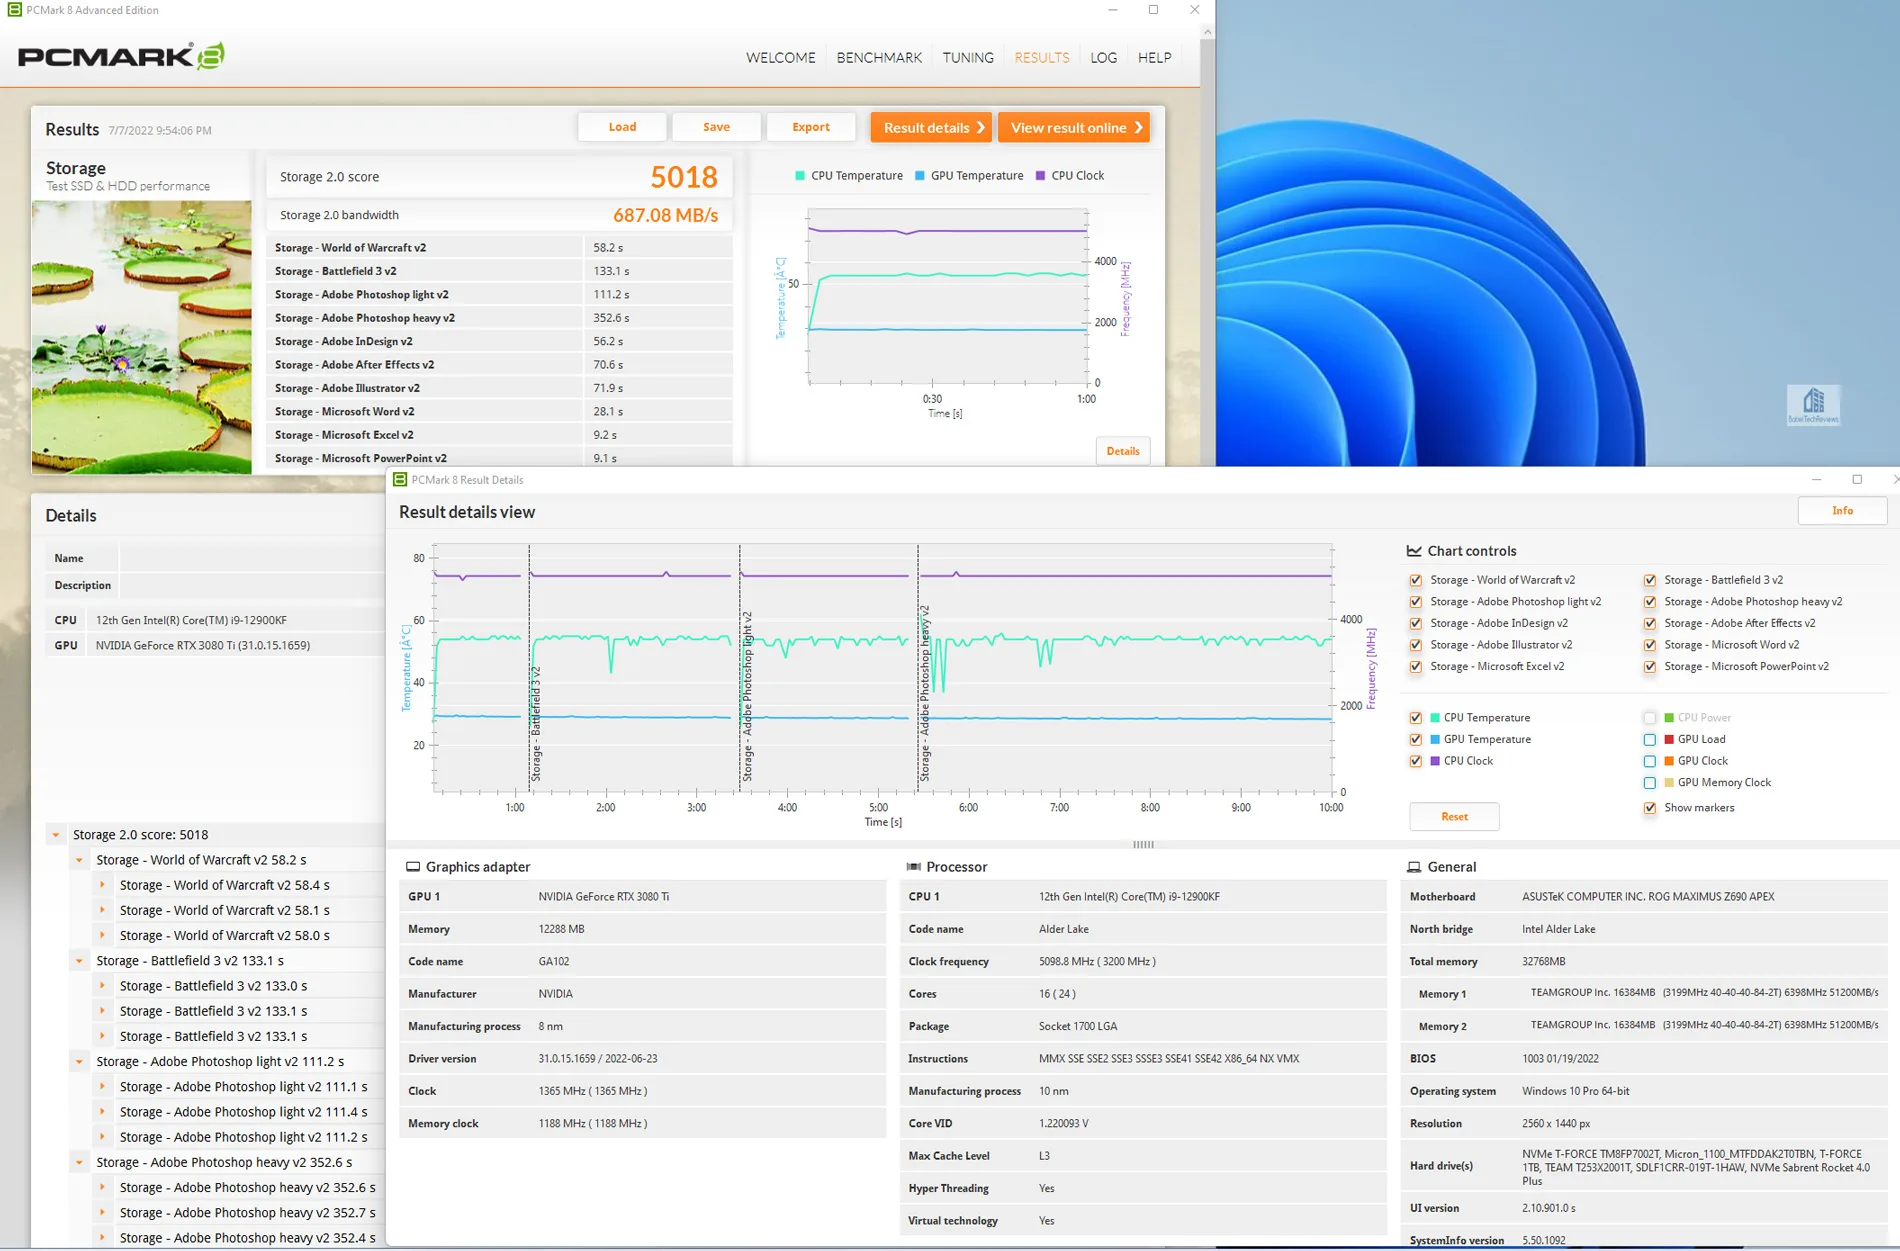
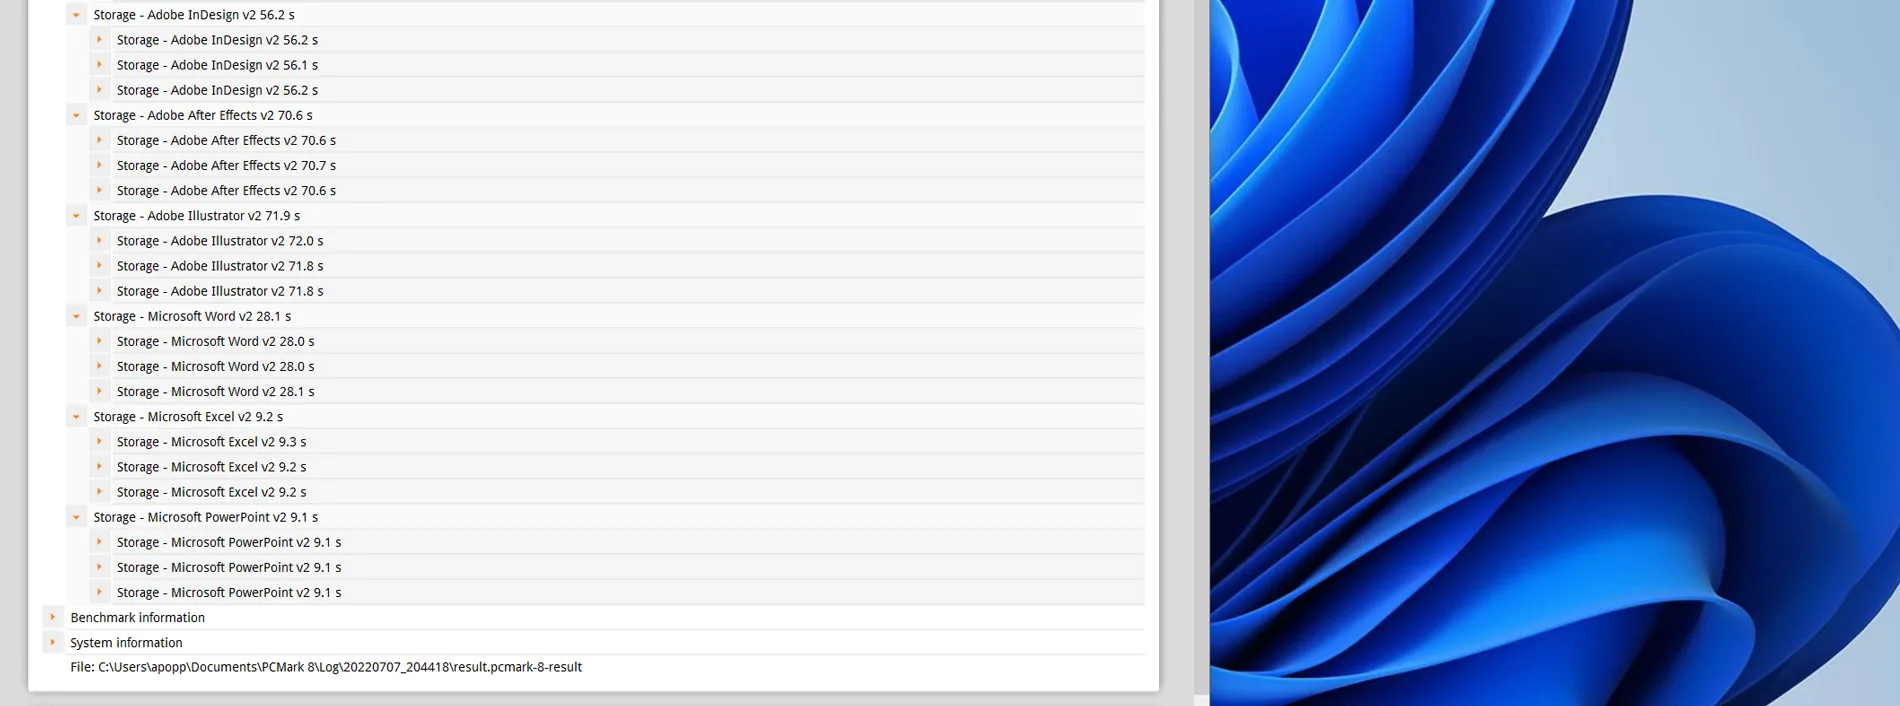
Let’s check out the older PCMark 8 benchmark suite which also uses dedicated storage tests.
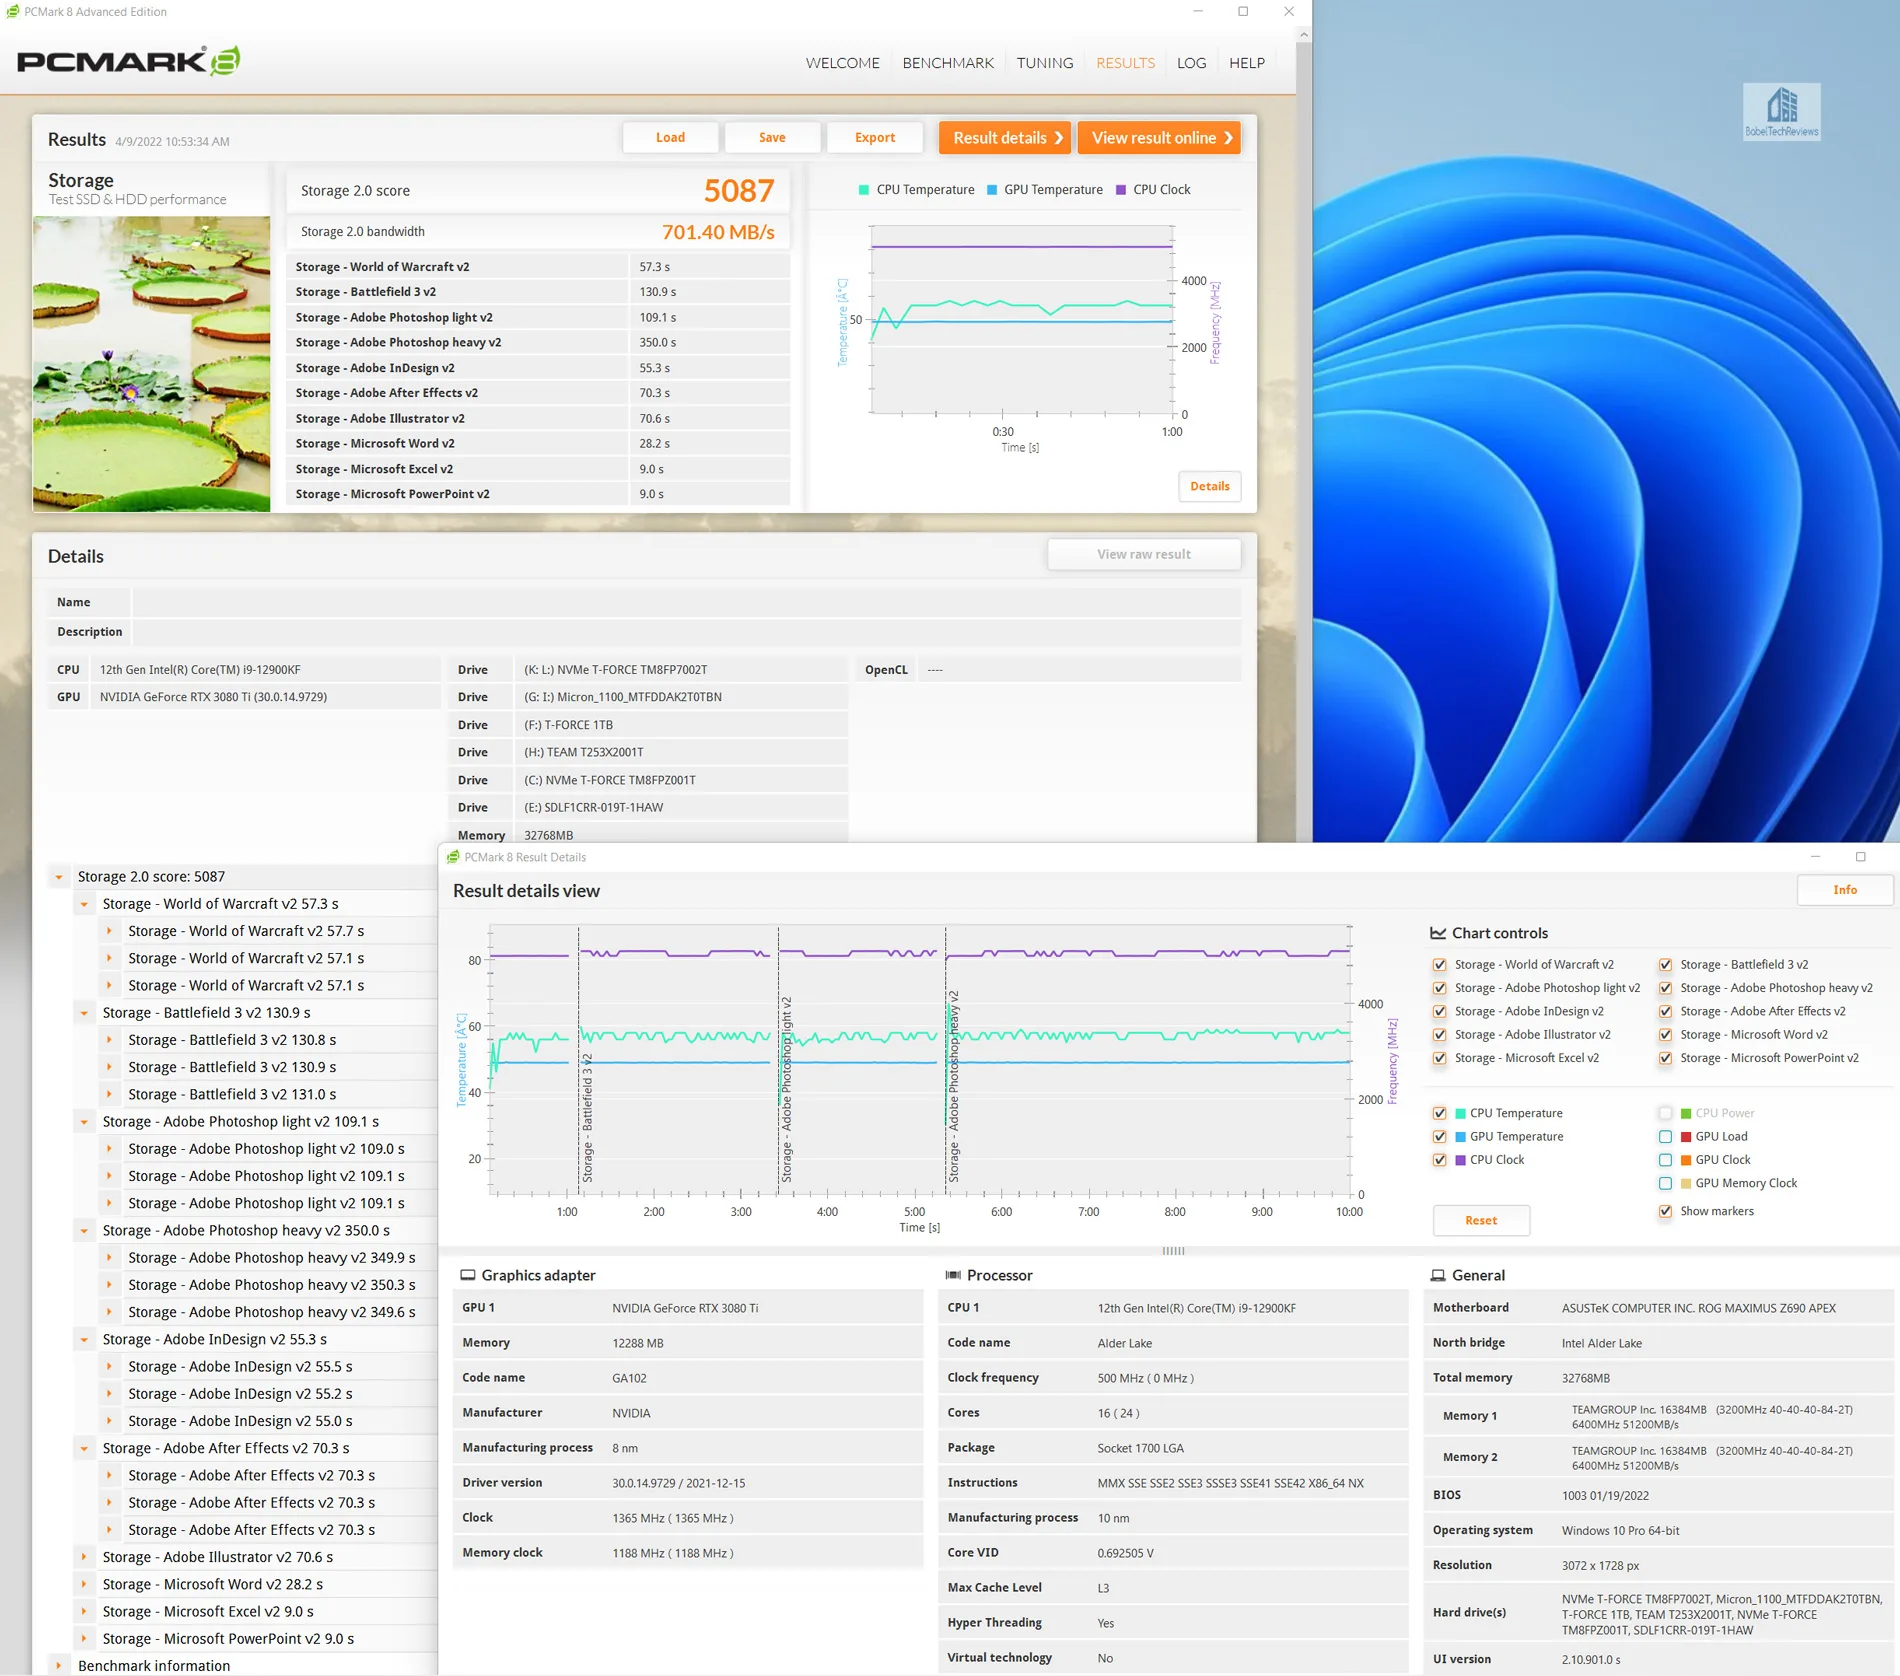
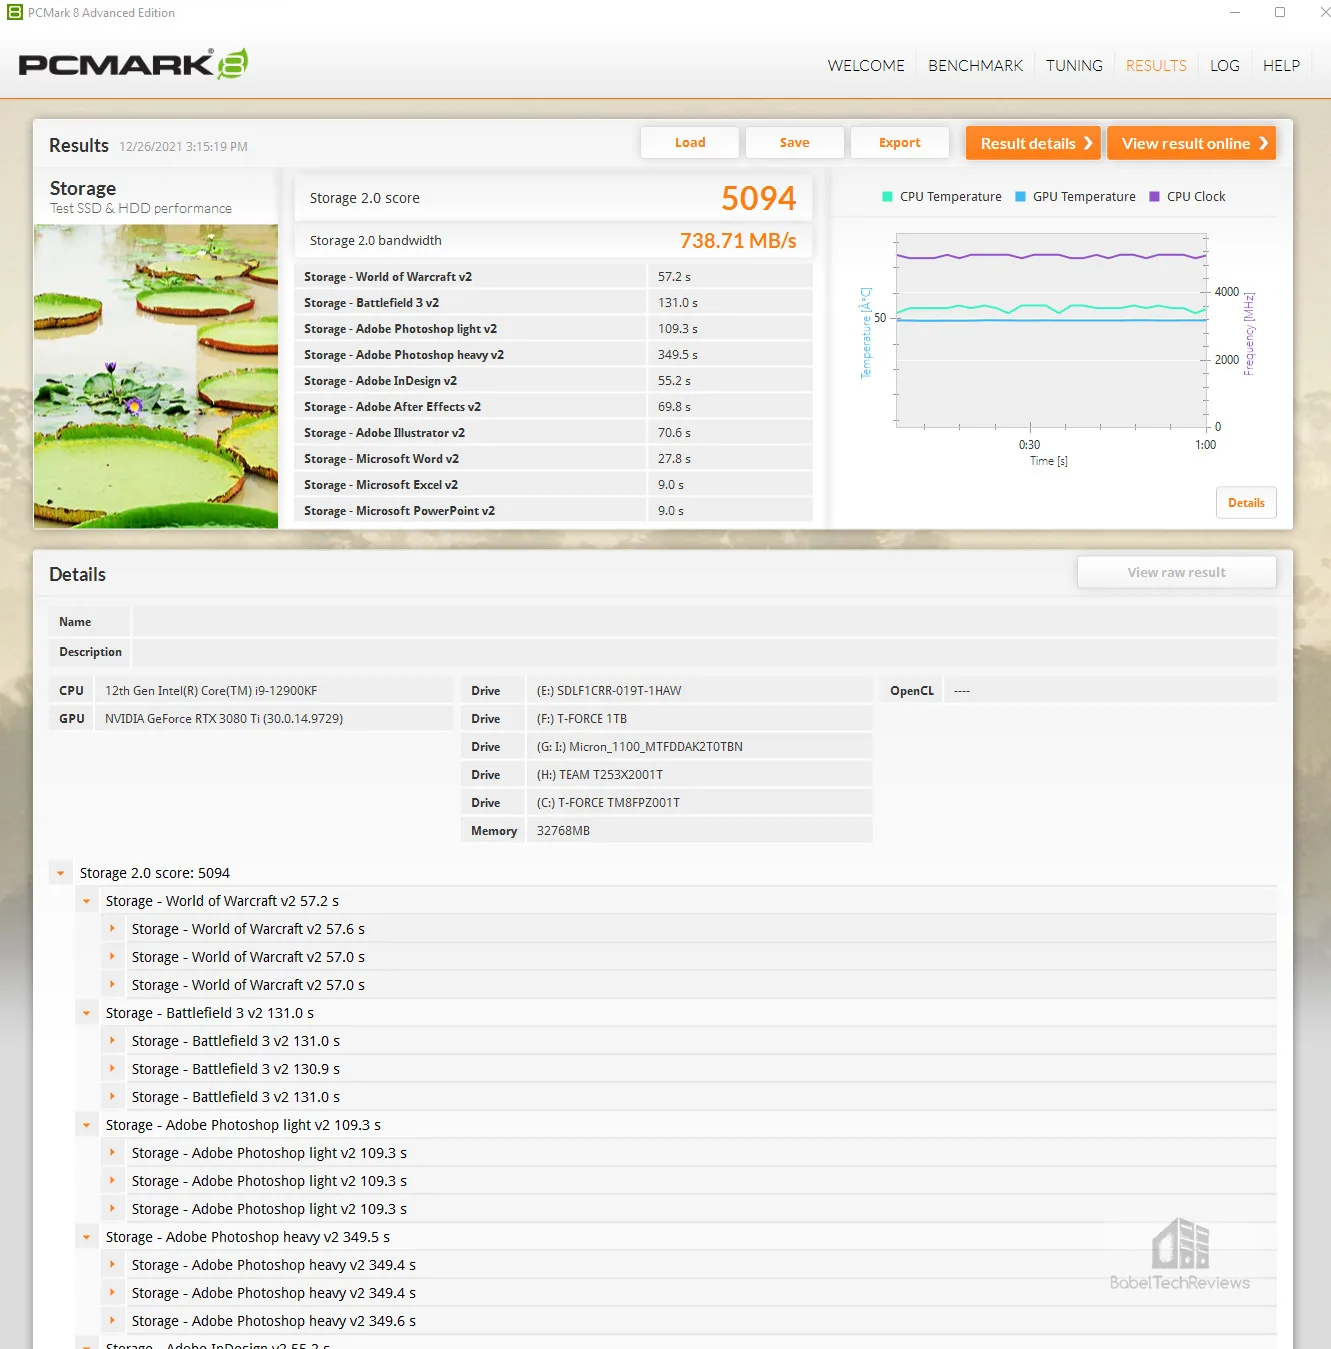
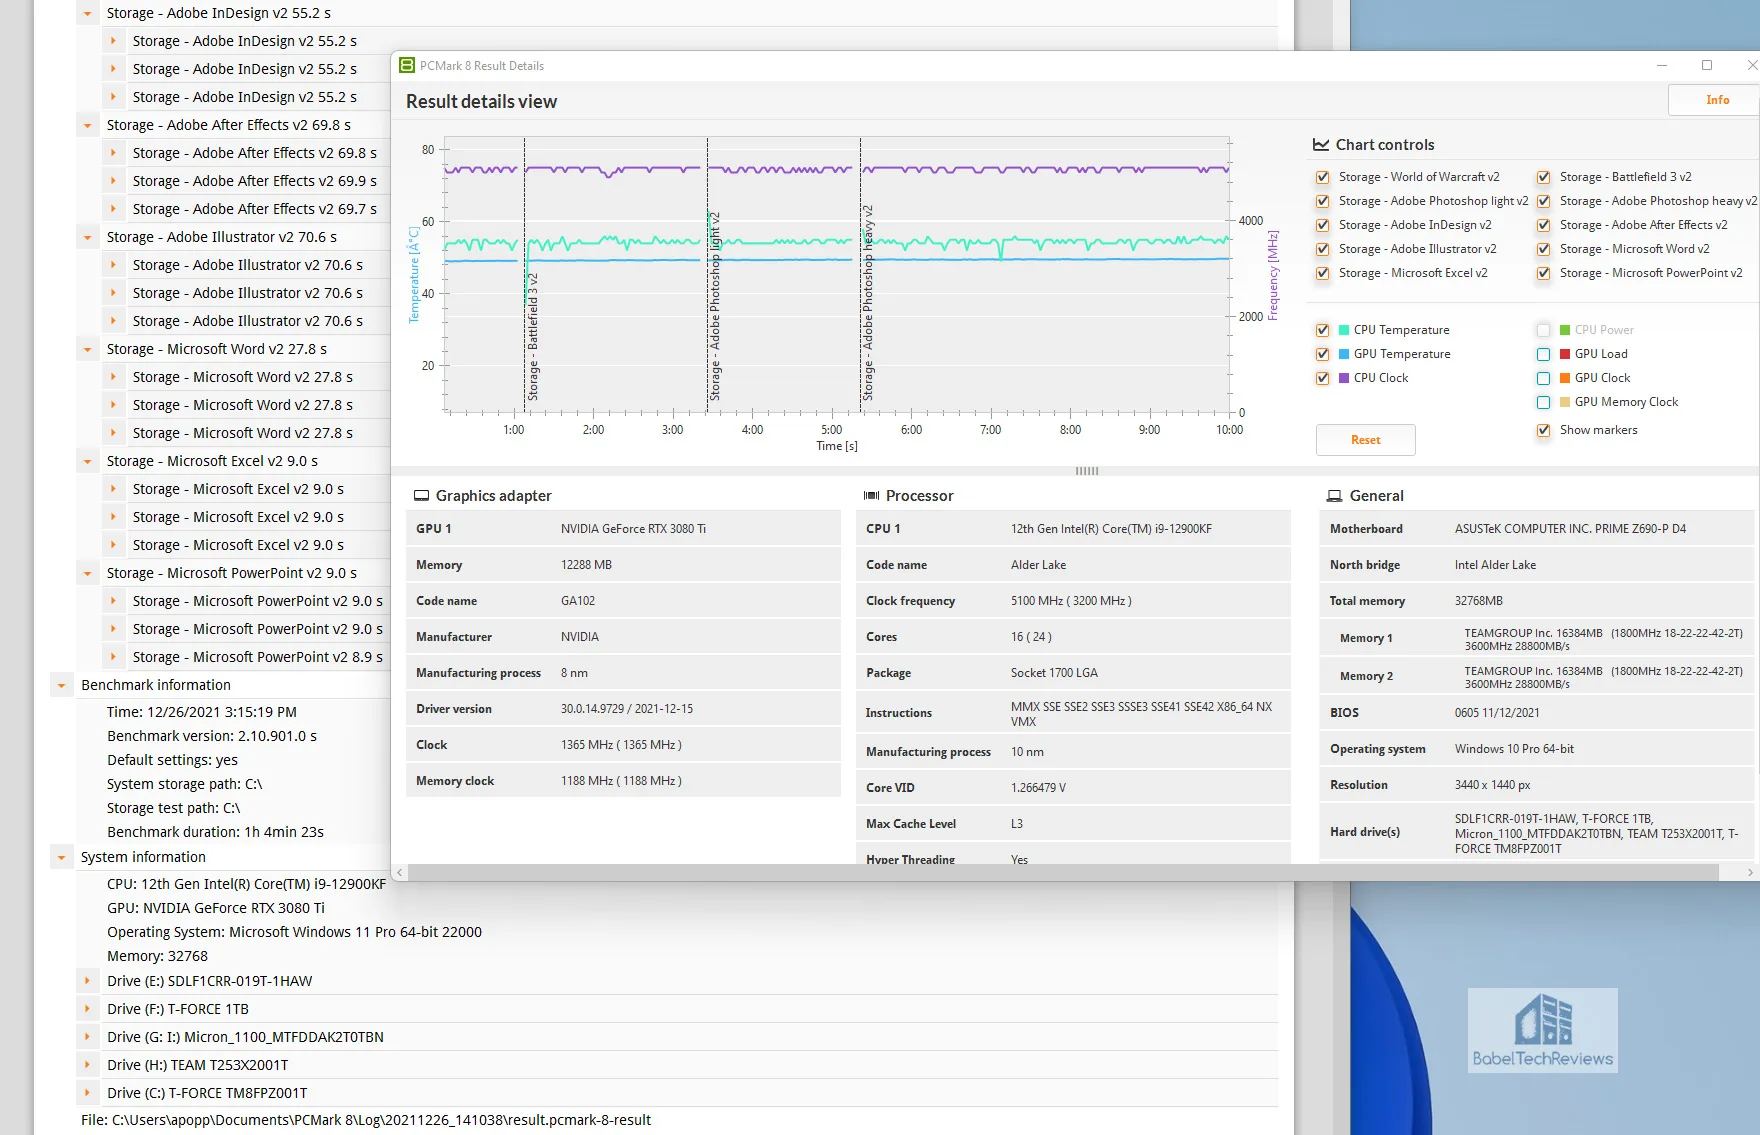
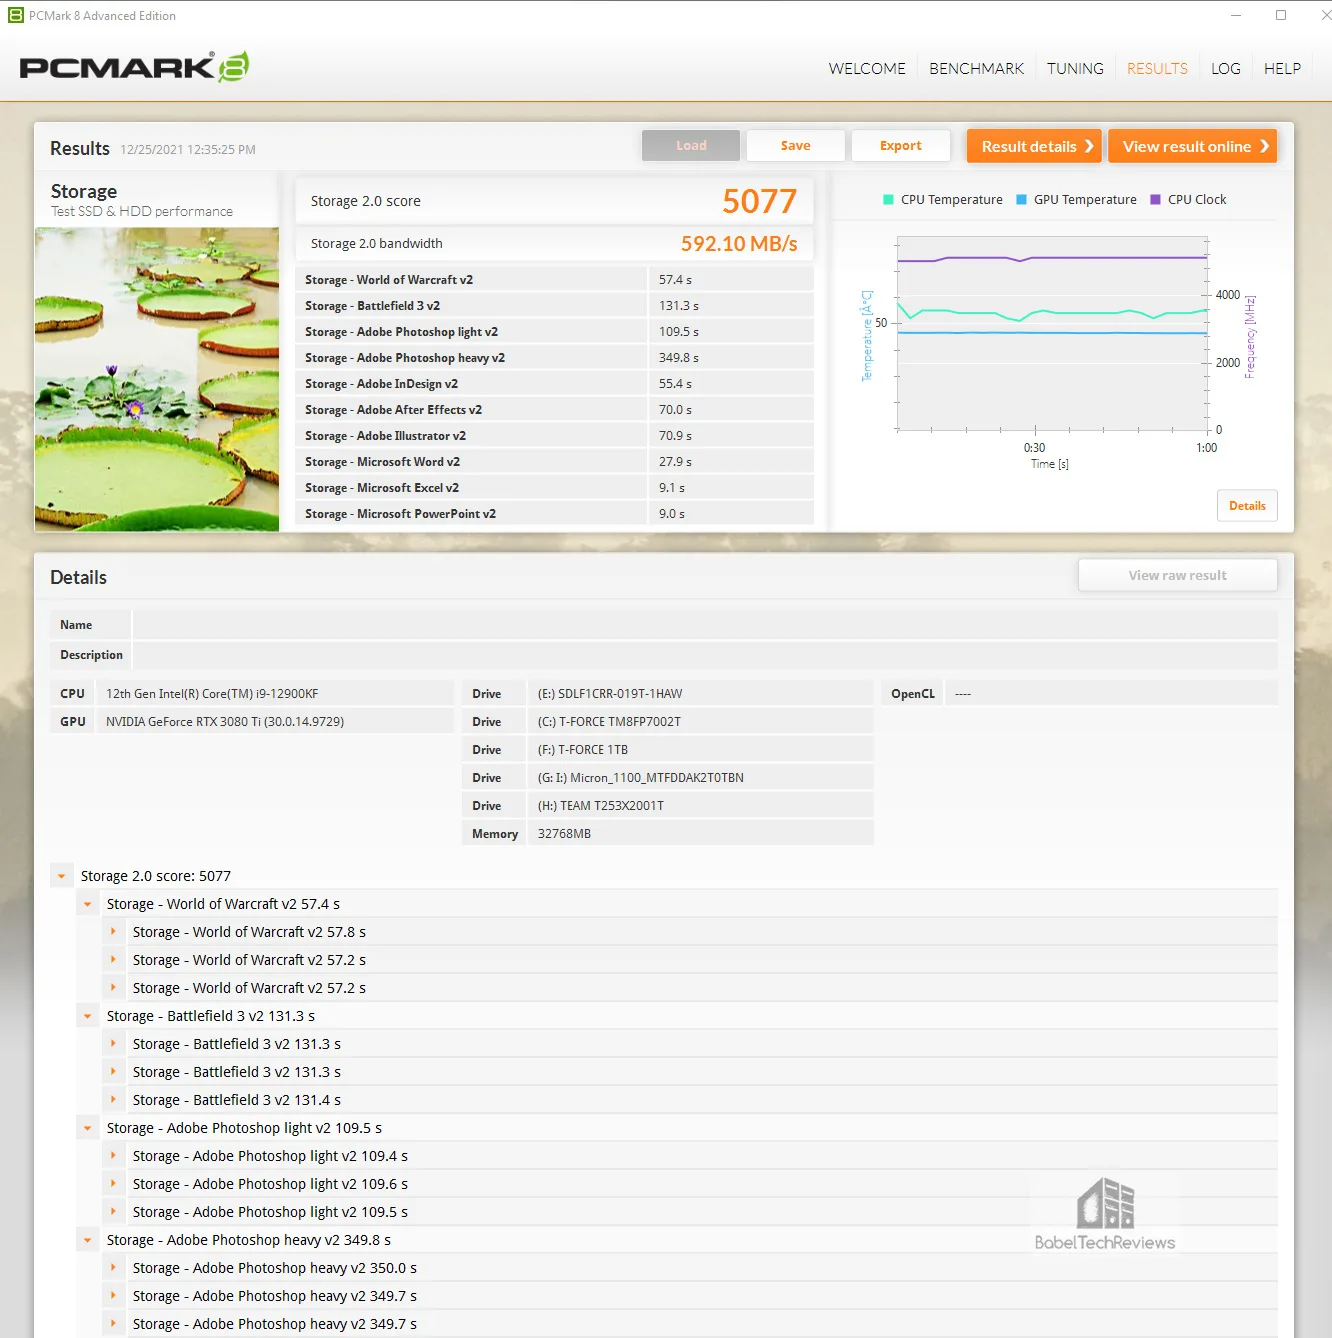
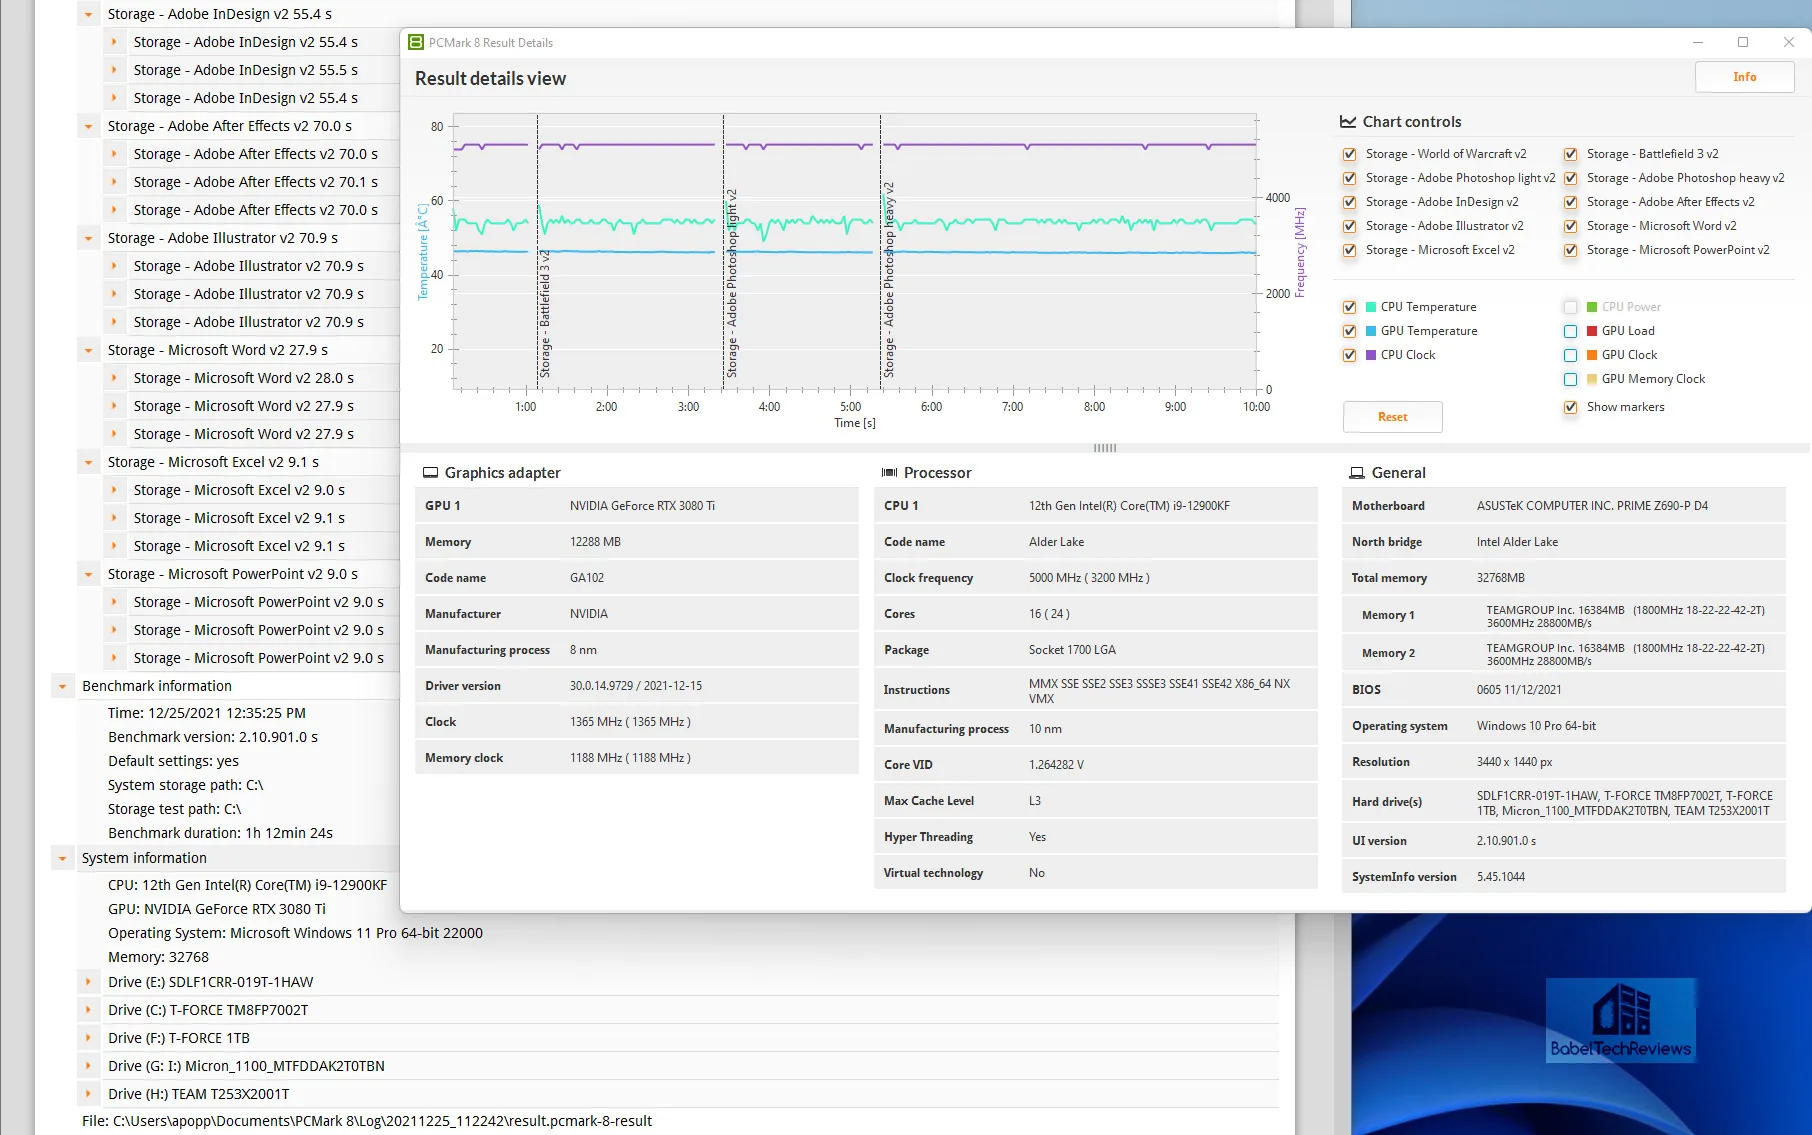
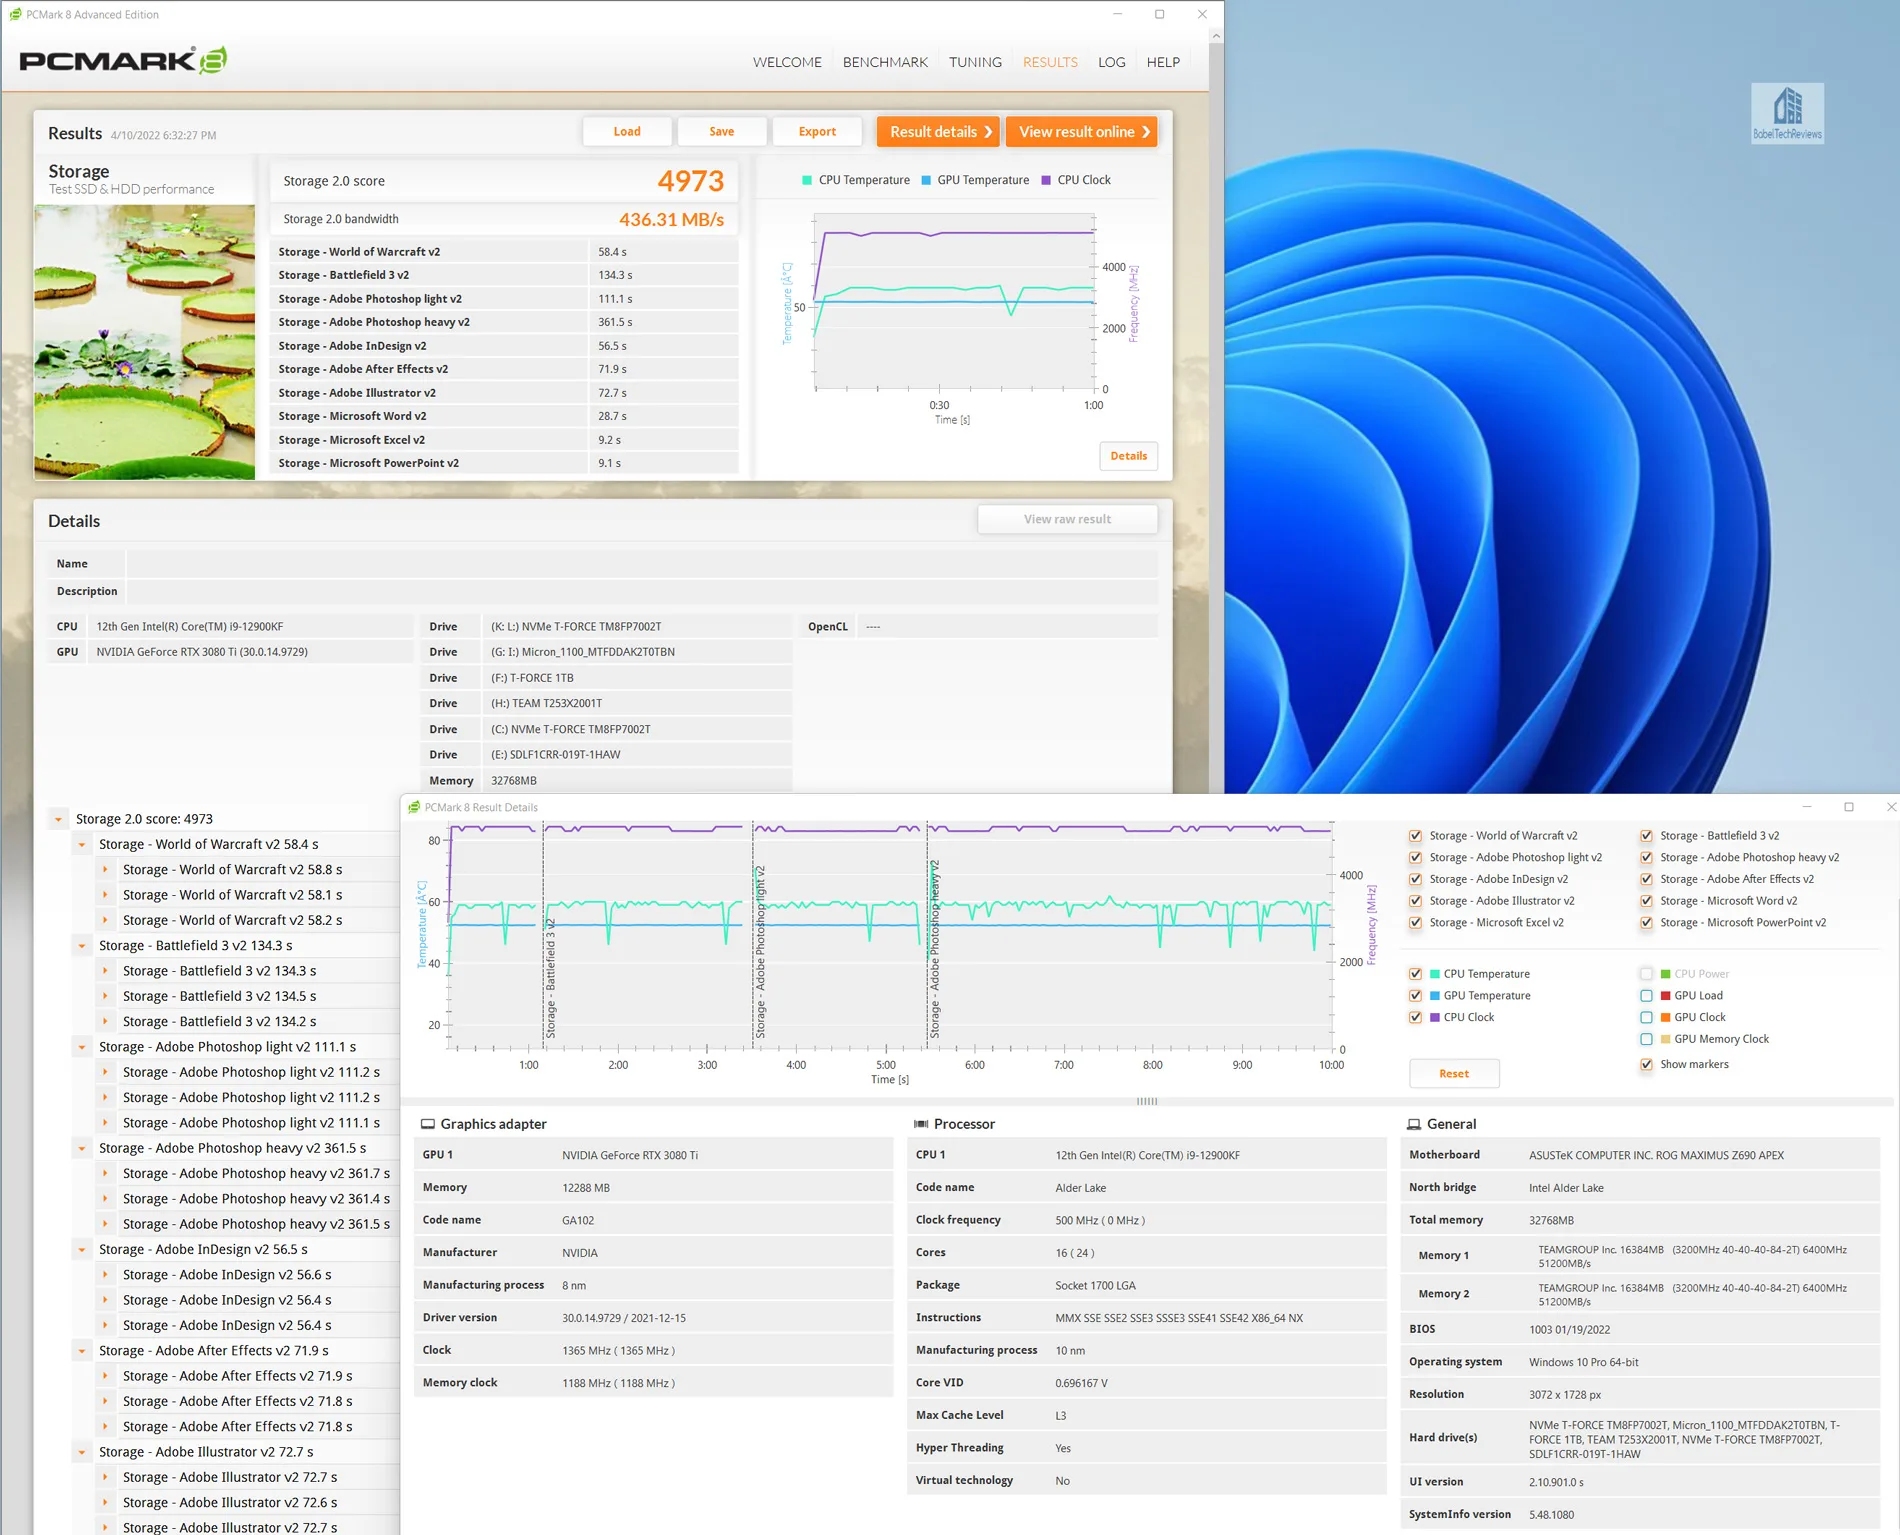
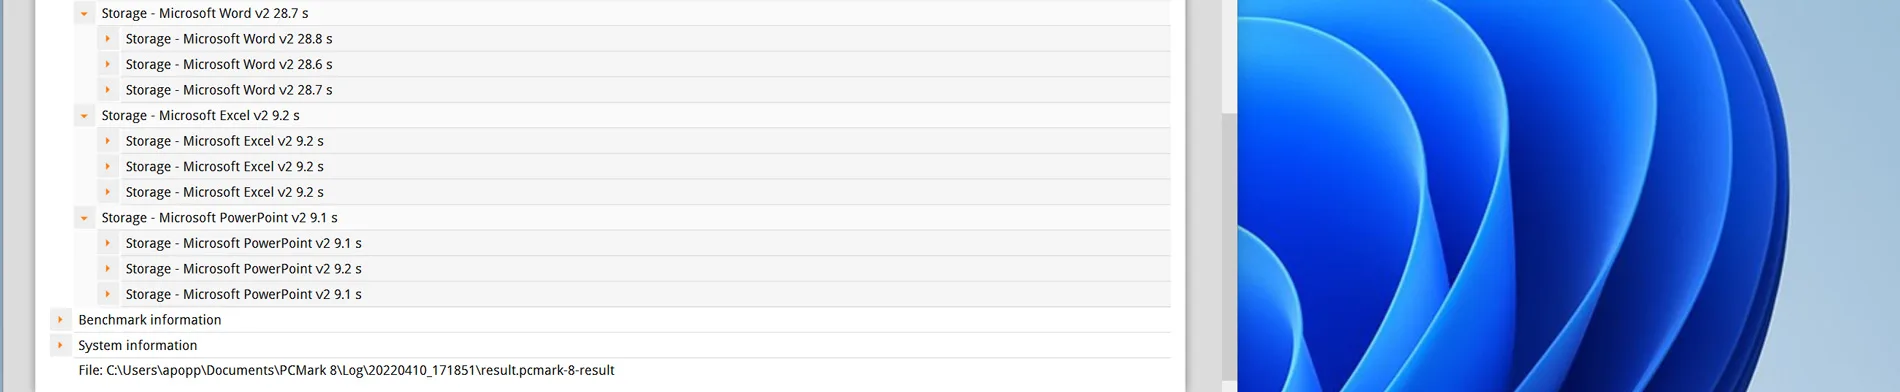
PCMARK 8


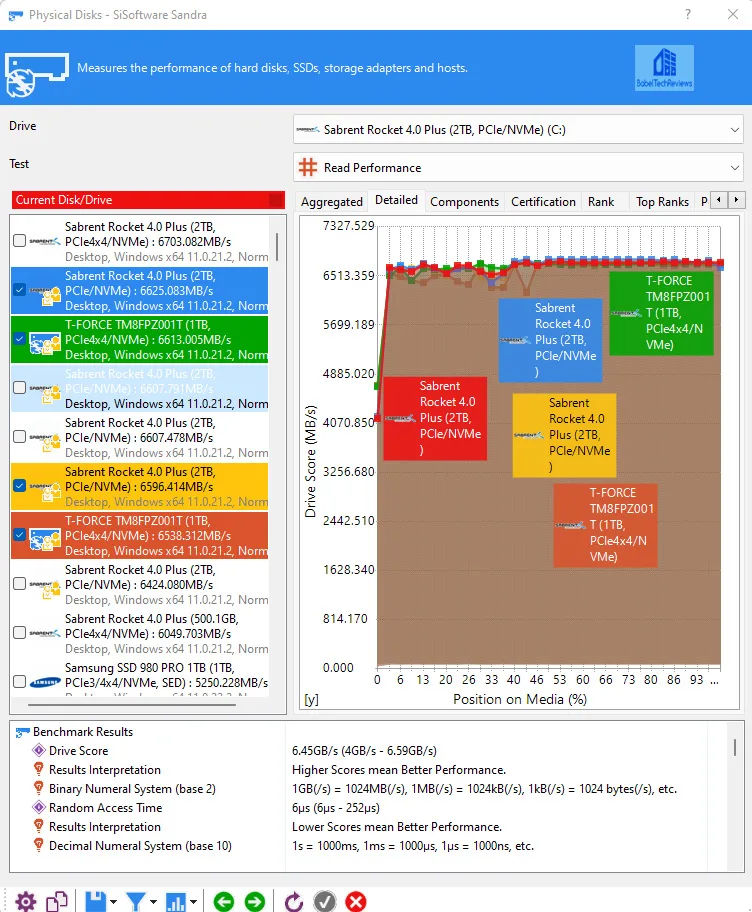
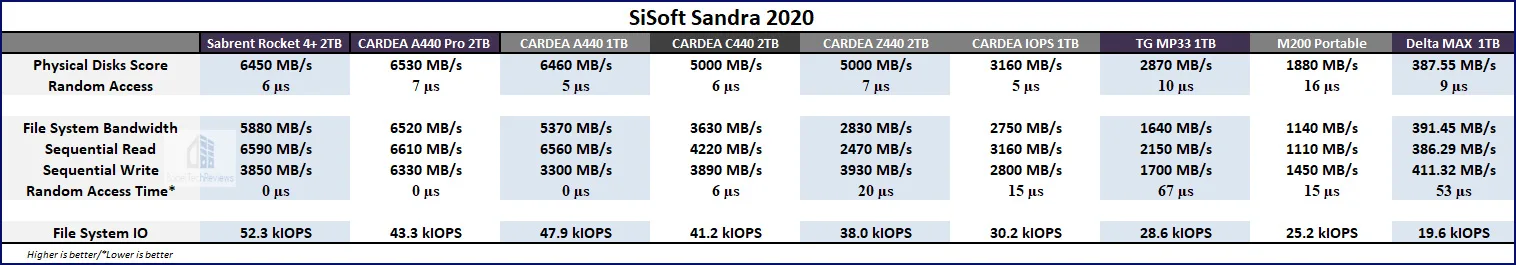
SiSoft Sandra 2020/2021
To see exactly where drive performance results differ, there is no better tool than SiSoft’s Sandra 2020. Sandra (the System ANalyser, Diagnostic and Reporting Assistant) is a complete information & diagnostic utility in one package. It is able to provide all of the information about your hardware, software, and other devices for diagnosis and for benchmarking.
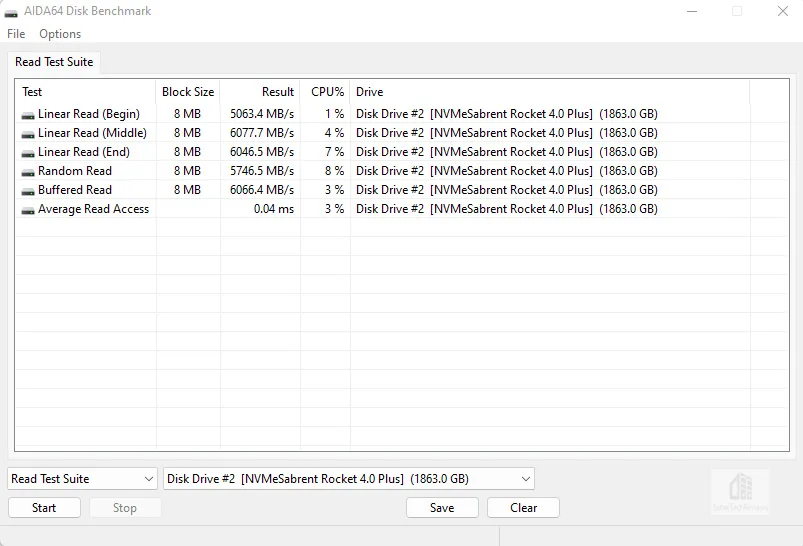
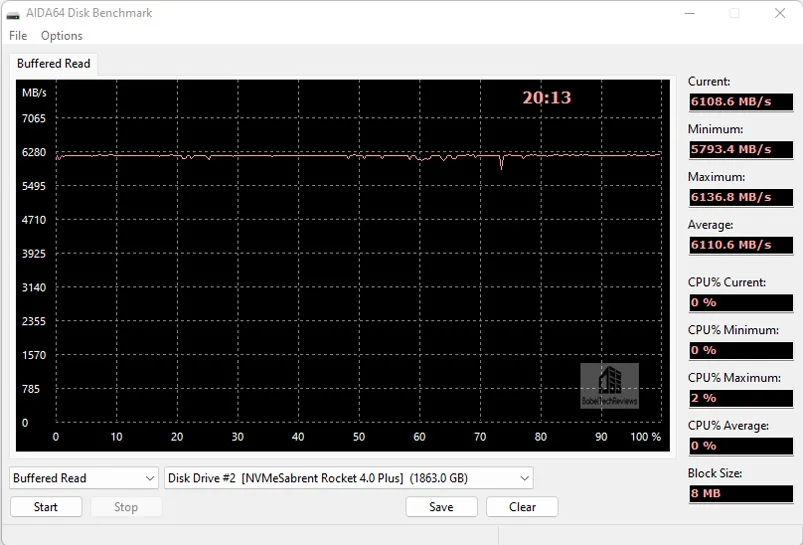
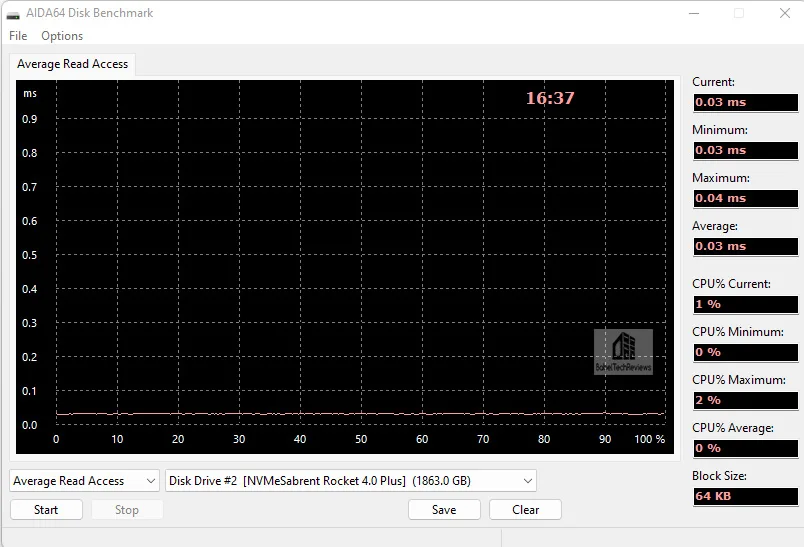
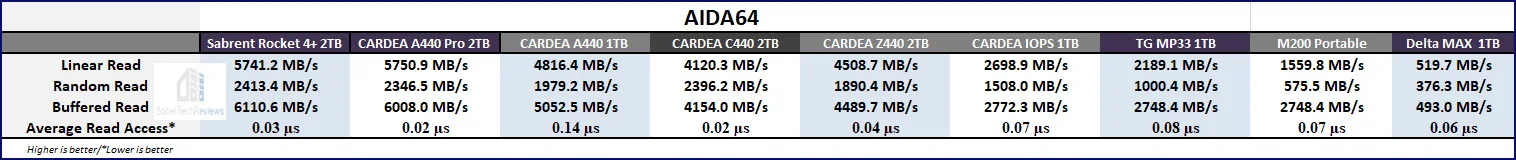
AIDA64 v6.32
AIDA64 is the successor to Everest and it is an important industry tool for benchmarkers. AIDA64’s benchmark code is written in Assembly language, and they are well-optimized for AMD, Intel and VIA processors by utilizing the appropriate instruction set extensions. We use the Engineer’s version of AIDA64 courtesy of FinalWire. AIDA64 is free to to try and use for 30 days.
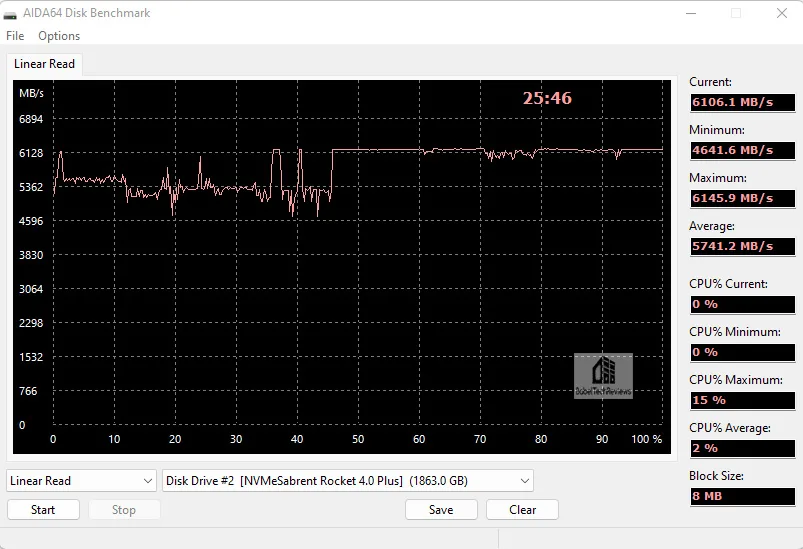
- The Linear Read test measure sequential performance by reading or writing all sectors without skipping any. It’s a linear view of the drives overall performance from its beginning to end.
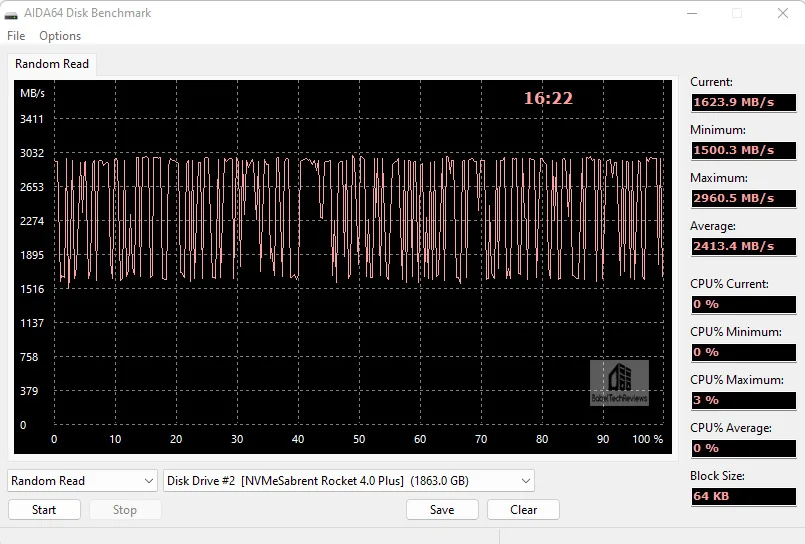
- The Random Read test measures the random performance by reading variable-sized data blocks at random locations on the drive and they are combination of both speed and access times as its position changes before each new operation.
- The Buffered Read test measures the drive caching.
- The Access time tests are designed to measure the data access performance by reading 0.5 KB data blocks at random drive locations
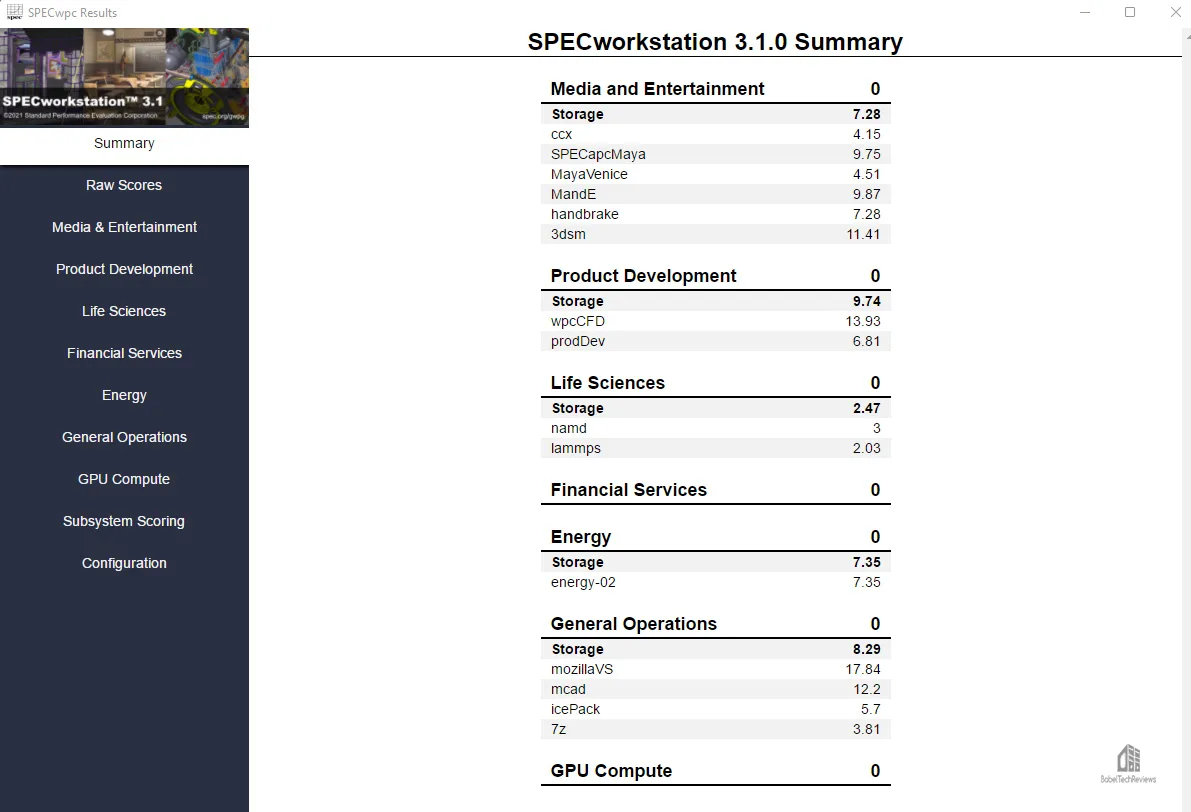
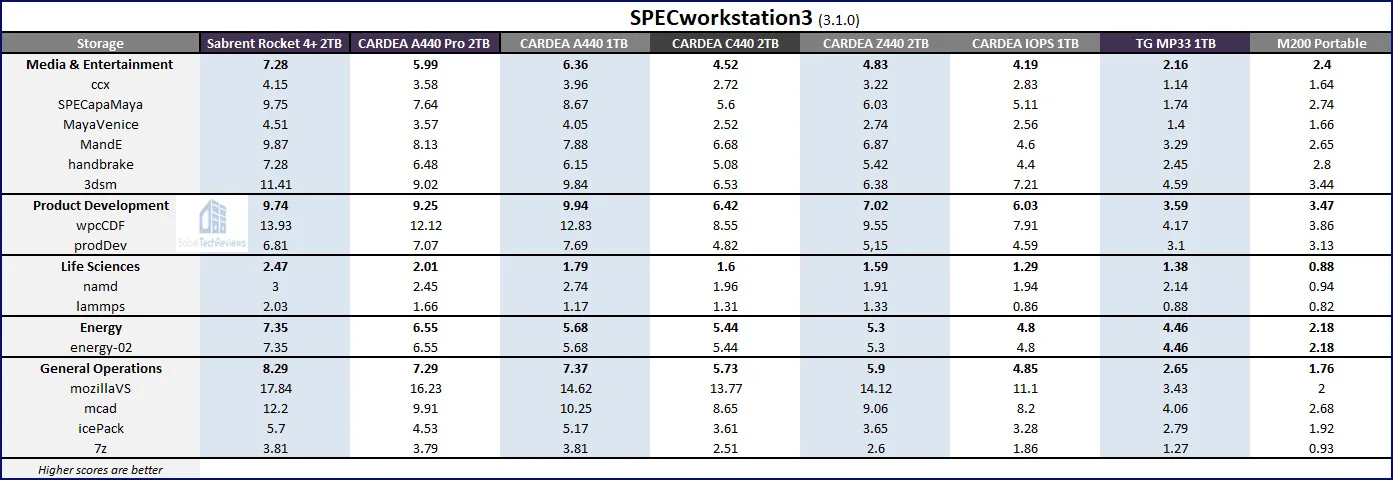
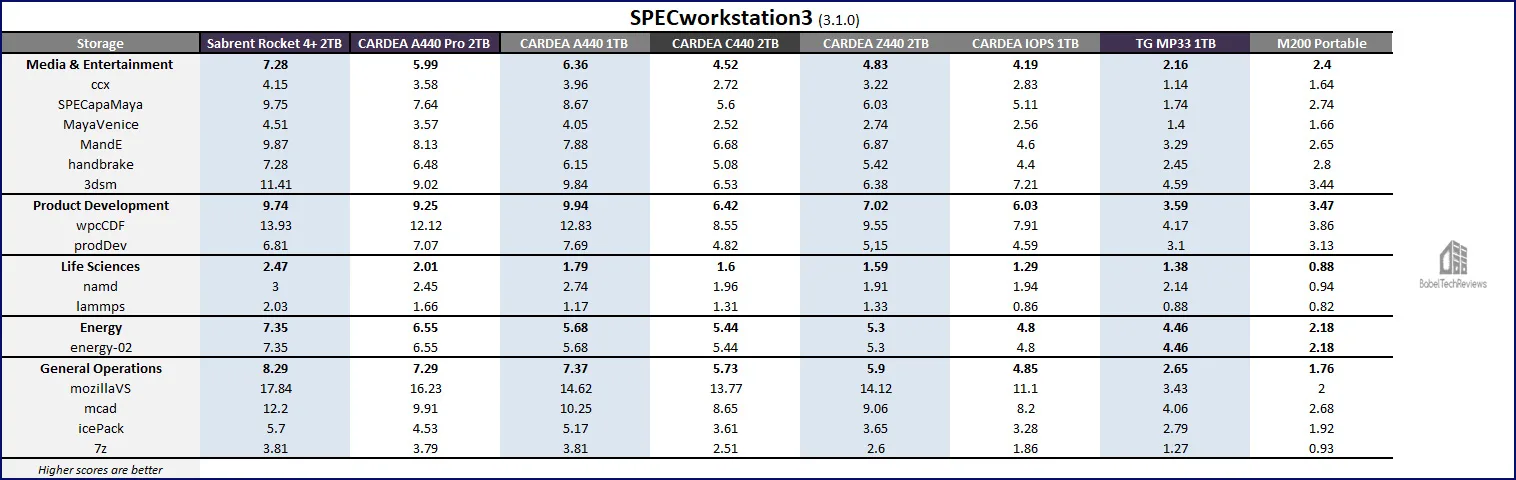
SPECworkstation3 (3.0.4) Storage Benchmarks
All the SPECworkstation3 benchmarks are based on professional applications, most of which are in the CAD/CAM or media and entertainment fields. All of these benchmarks are free except to vendors of computer-related products and/or services. The most comprehensive workstation benchmark is SPECworkstation3. It’s a free-standing benchmark which does not require ancillary software. It measures GPU, CPU, storage and all other major aspects of workstation performance based on actual applications and representative workloads.
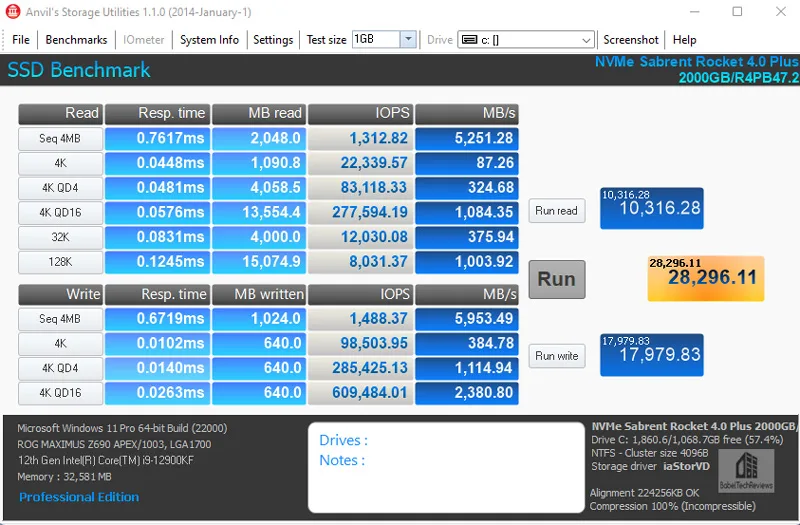
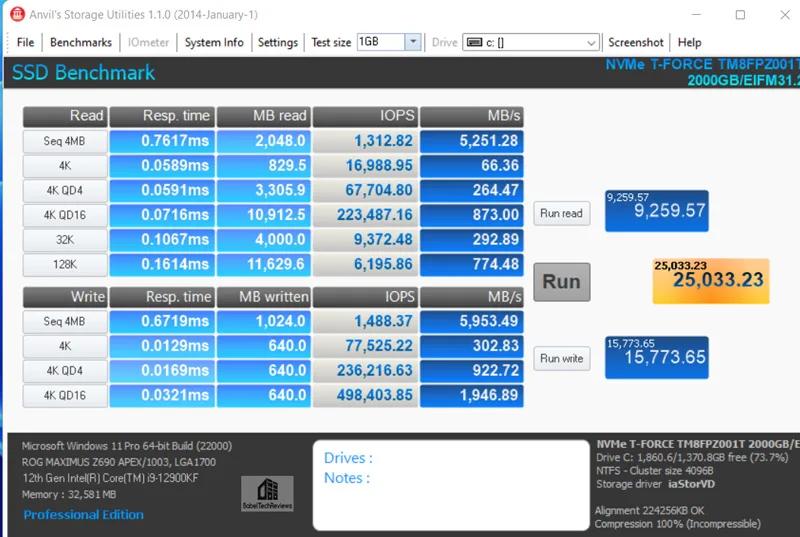
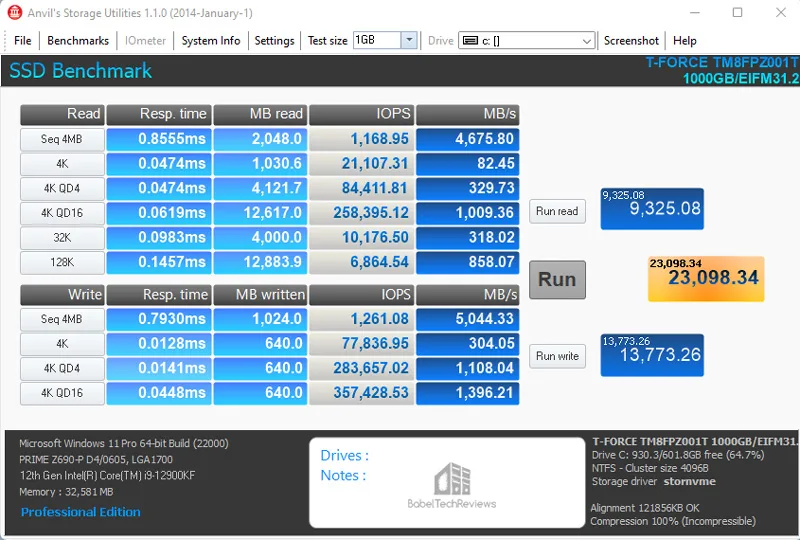
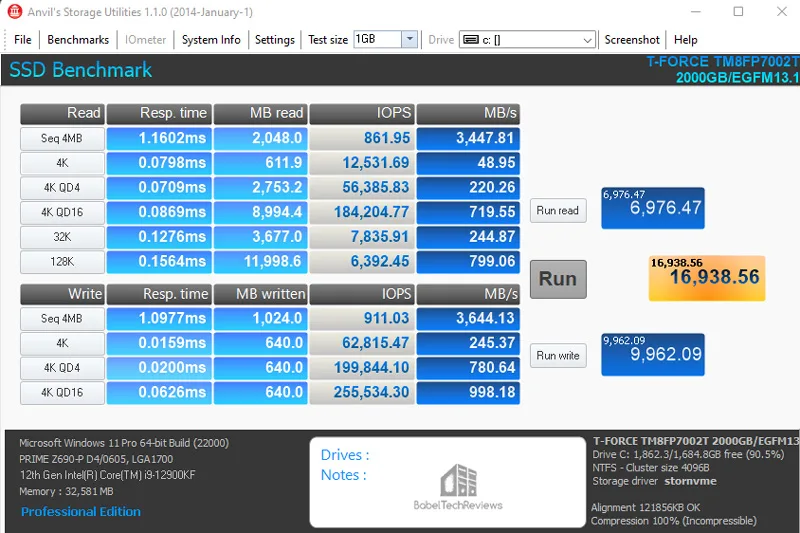
Anvil’s Storage Utilities
Anvil’s Storage Utilities is a tool designed to benchmark and evaluate the Read and Write performance of SSDs and HDDs. It gives overall bandwidth as well separate Read and Write scores, the response times, and IOPS capabilities.


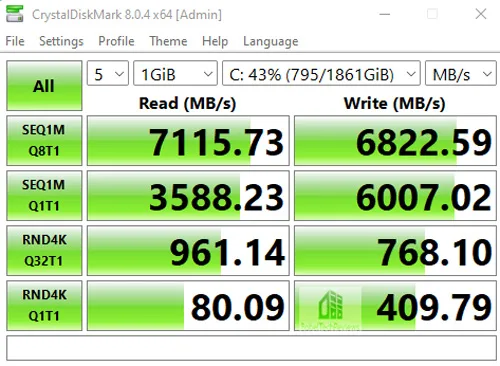
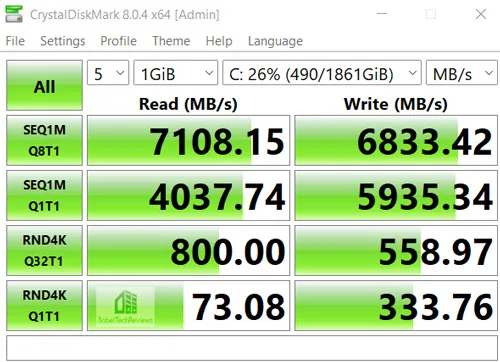
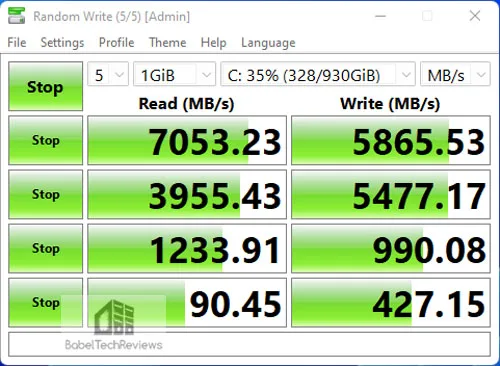
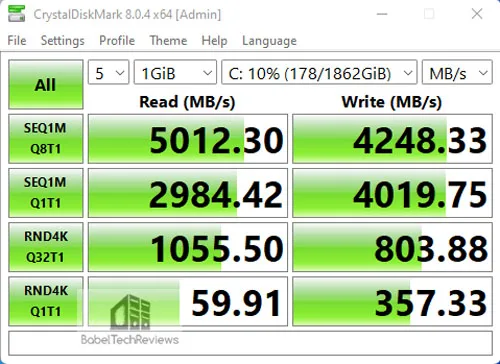
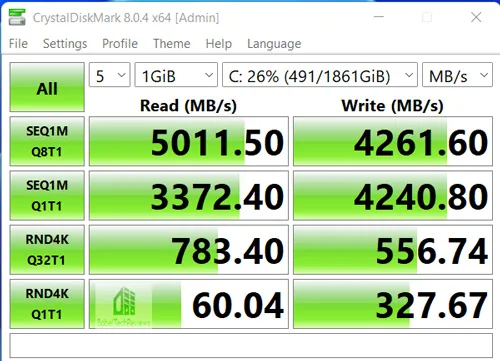
CrystalDiskMark 8.0.4
CrystalDiskMark is a HDD benchmark utility for your drives that measure sequential and random read/write speeds. Here are some key features of “CrystalDiskMark”:
- Measure sequential reads/writes speed
- Measure random 512KB, 4KB, 4KB (Queue Depth=32) reads/writes speed
- Results given in IOPS or MB/s
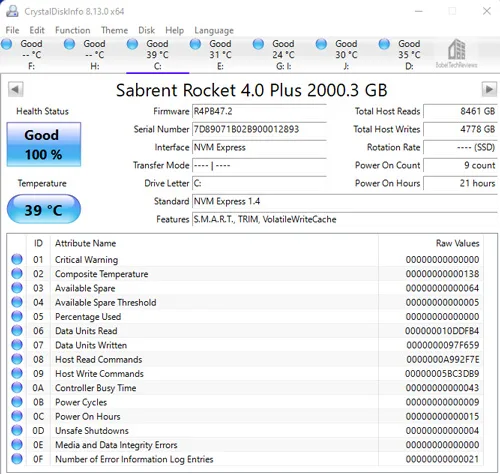
First up is the Rocket 4 Plus and notice that it exceeds its Read speed advertised specifications of 7,000MB/s but falls a bit short of its 6,850MB/s Write spec. It appears that most SSD manufacturers use an empty second drive for their testing whereas BTR does real world testing on primary drives that are in use with Windows 11 installed

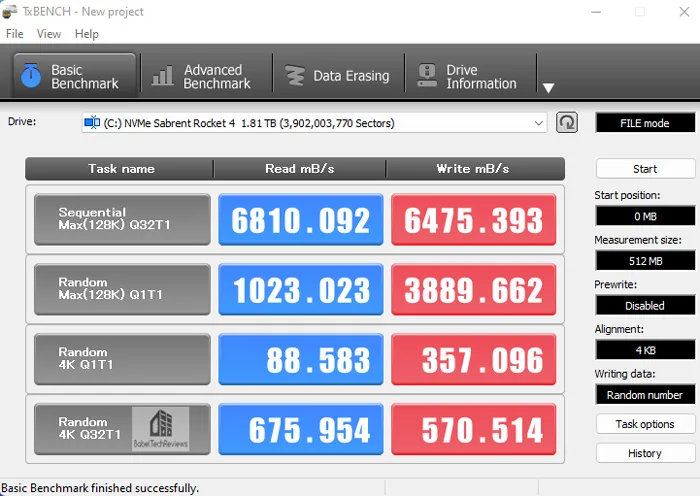
TxBENCH
TxBENCH is similar to CrystalDiskMark but with additional features including secure erase. According to the website, “It not only measures the performance of storage easily but also performs detailed speed measurements based on specified access patterns and long-period speed measurements. It also allows you to see each drive’s supported features, enabled features, and S.M.A.R.T. information.”
First up are the Rocket 4 Plus TxBench results.
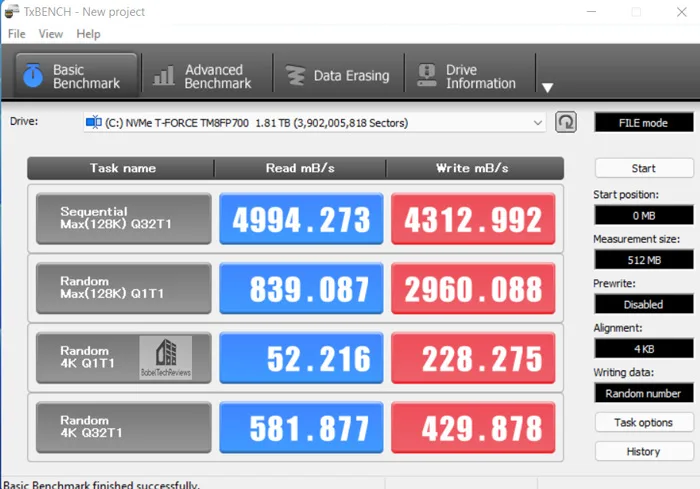
Next up, the A440 Pro Special Series SSD. 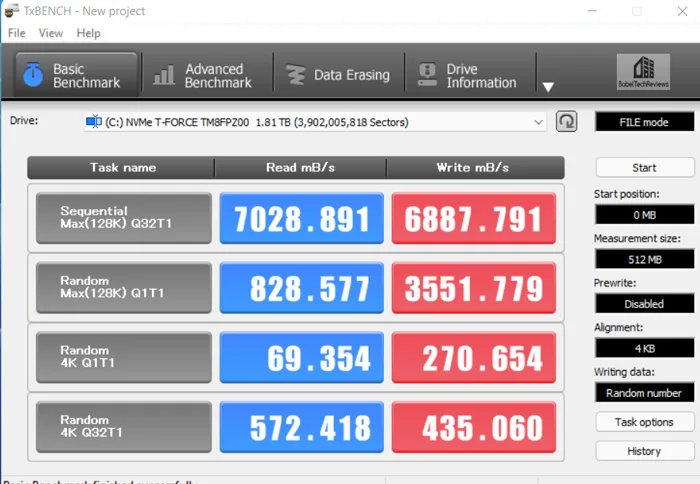 The A440 results are below.
 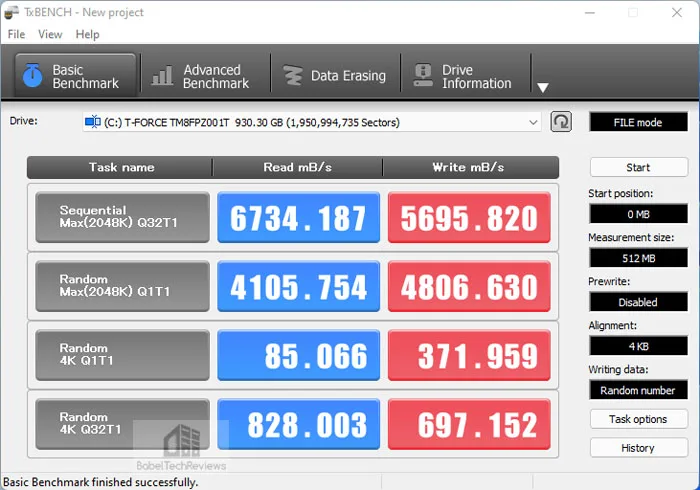 Finally, the CARDEA Ceramic C440 results.
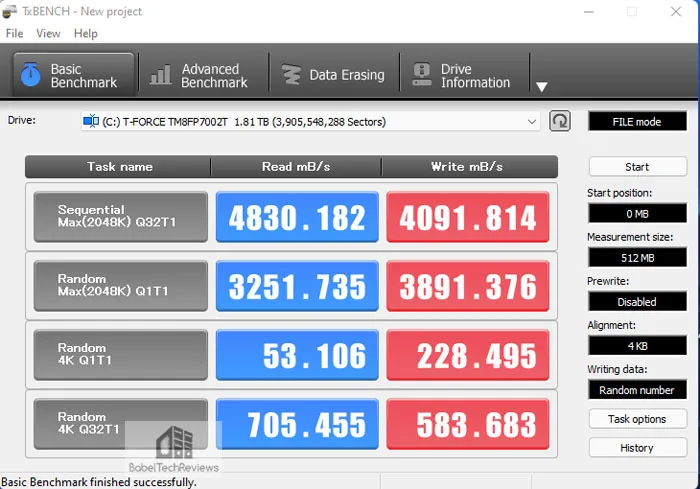
 The TxBENCH rankings are summarized by the chart below.
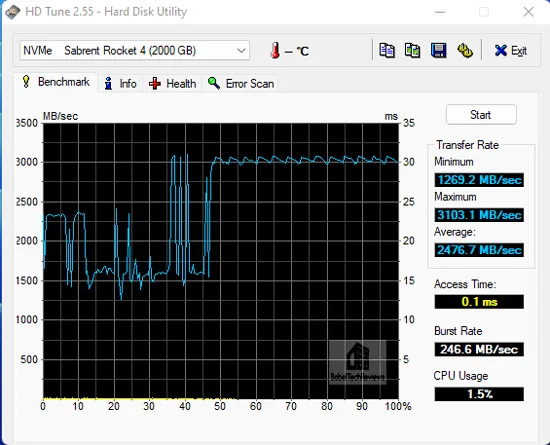
HD Tune
This free standalone synthetic test is old and it doesn’t represent real world performance but it does test some important drive metrics. There is also a pay-for HD Tune Pro which is up-to-date and offers more functionality. We tried the Pro trial recently just to make sure the free version is still relevant. HD Tune has the following functions, and it measures the performance of:
- Transfer Rate
- Access Time
- CPU Usage
- Burst Rate
- Random Access test
- Write benchmark
Hard Disk information includes partition information, supported features, firmware version, serial number, disk capacity, buffer size, transfer mode.
- Hard Disk Health
- S.M.A.R.T. Information (Self-Monitoring Analysis and Reporting Technology)
- Power On Time
- Error scan
- Temperature display

Next, we benchmark using AS SSD.
AS SSD
AS SSD is designed for Solid State Drives (SSD). This tool contains synthetic and practice tests. The synthetic tests determine the sequential and random read and write performance of the SSD without using operating system caches. In Seq-test the program measures how long it takes to read and write a 1GB file.
In the 4K test, read and write performance for random 4K blocks are determined. The 4K-64-thrd test are similar to the 4K procedure except that the read and write operations on 64 threads are distributed as in the usual start of a program. For the copy test, two large ISO file folders are created, programs with many small files, and a games folder with small and large files. These three folders are copied by the OS copy command with the cache turned on. AS SSD gives an overall score after it runs the benchmarks.
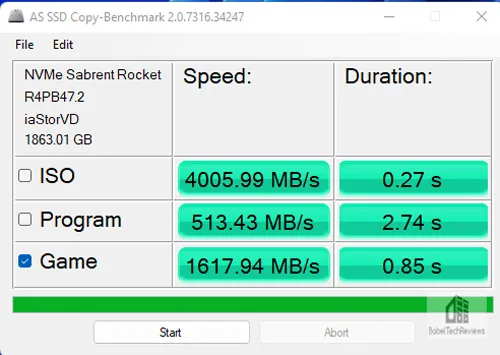
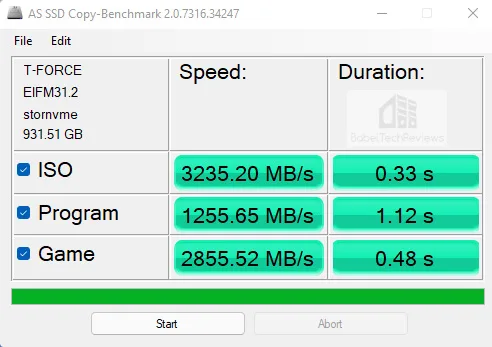
First up is the Sabrent Rocket 4 Plus with the results in MB/s and the copy speeds.

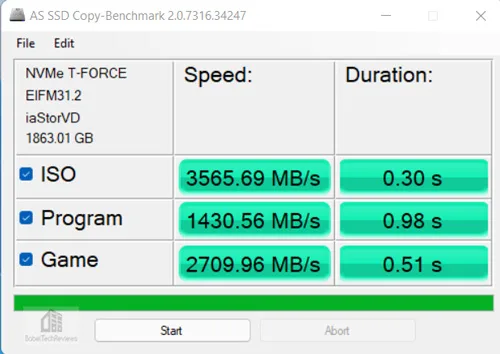
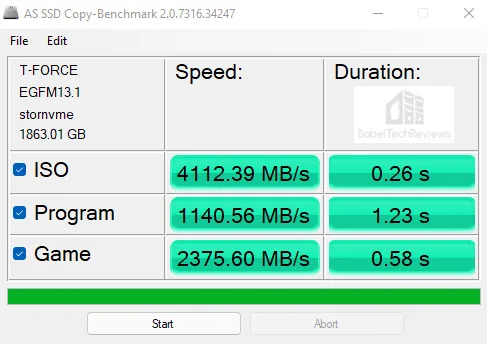
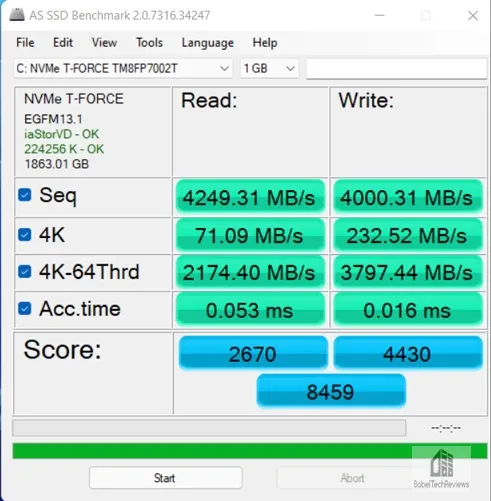
Below are the T-FORCE CARDEA A440 Pro Special Series SSD results.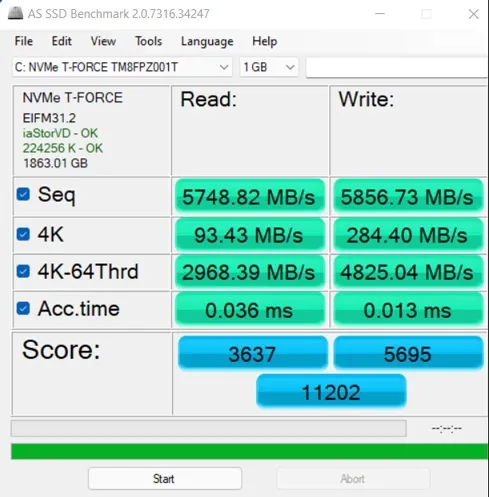
Next up are the T-FORCE CARDEA A440 AS SSD results. 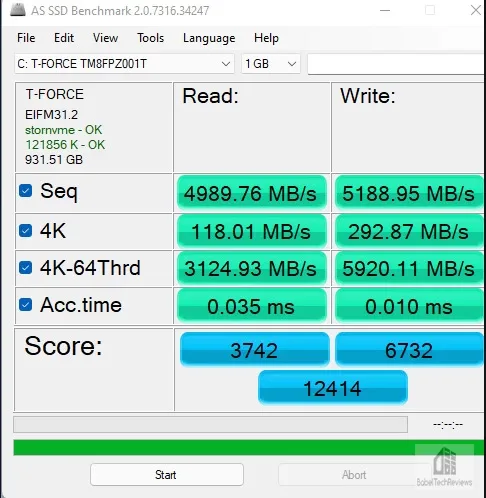
 Below, the T-FORCE CARDEA Ceramic C440 AS SSD results.
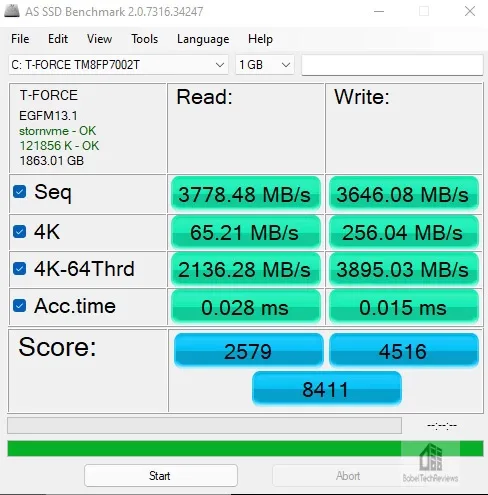

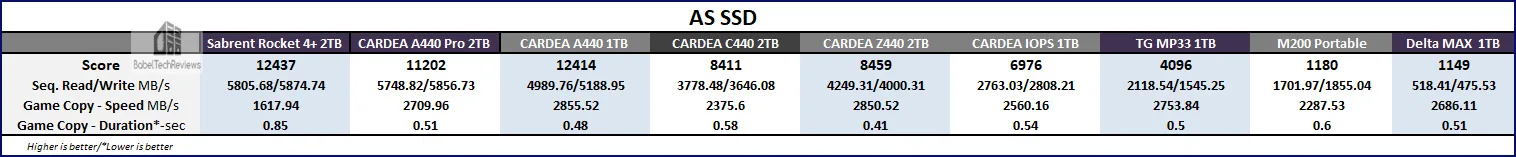
The Sabrent Rocket 4 Plus is the overall highest scoring SSD but it has the slowest game copy speeds.
HD Tach is up next.
HD Tach
HD Tach is a low level hardware benchmark for random access read/write storage devices that was developed by Simpli Software. HD Tach uses custom device drivers and low level Windows interfaces to determine the physical performance of the device. It is no longer supported and needs to be run in compatibility mode for Windows 10.
We present the benchmarks first with the Quick benchmark (8MB zones) on the left and the Long benchmark (32MB zones) on the Right.
The CARDEA ZERO Z440 gives an average read of 2119.8MB/s for the Quick bench and 2210.3MB/s for the Long bench. 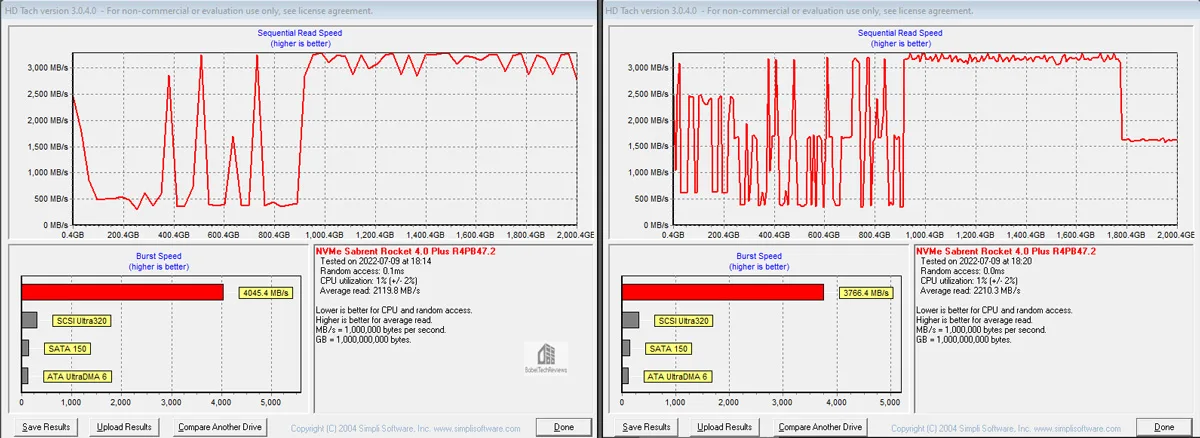 Below are the HD Tach Disk benches summarized in a chart comparing our nine drives. For read speeds, higher is better but for access times, lower is better.
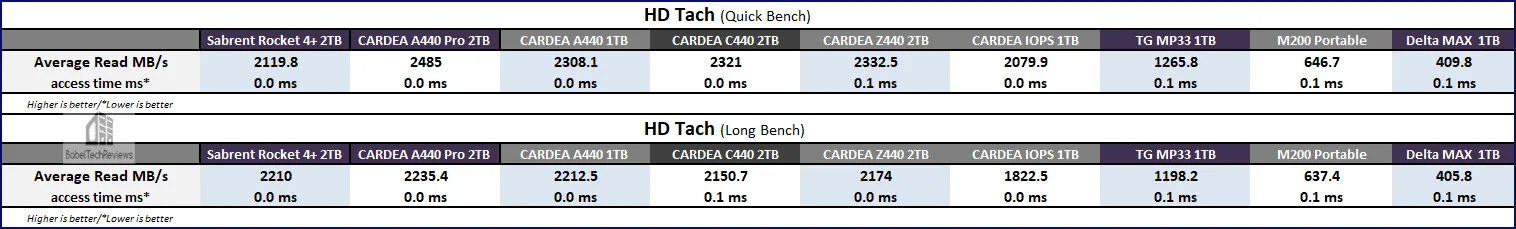
The Sabrent Rocket 4 Plus scores fifth in the Quick bench and third in the Long bench.
Next we look at game/level loading speeds.
The Game/Level Loading Timed Results – FFXIV
Game and game level loading time results are difficult to measure precisely but generally SSDs perform similarly with regard to game loading times and they all load significantly faster than any HDD. Even SSHDs require loading the same level or program over-and-over to get quicker. We accurately tested 5 levels and overall loading times by using the Final Fantasy XIV: Stormbringer & Endwalker benchmarks.
Shadowbringers Benchmark
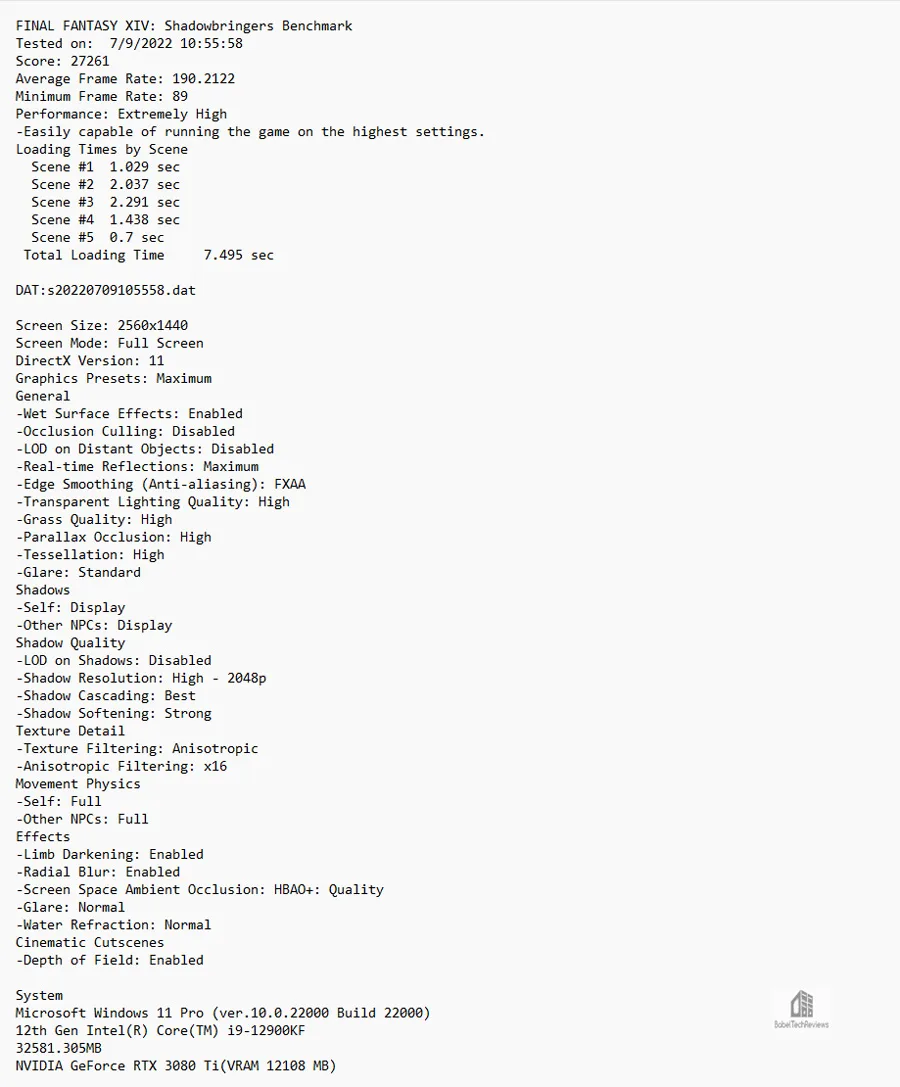
The Shadowbringers Benchmark will not only give you accurate framerates averages, it precisely times how long it takes to load each of 5 different levels and the total loading time. We used maximum settings.
Let’s start with the Shadowbringer benchmark using the Rocket 4 Plus. Total Loading times are 7.495 seconds.
Here’s the Shadowbringer summary chart.
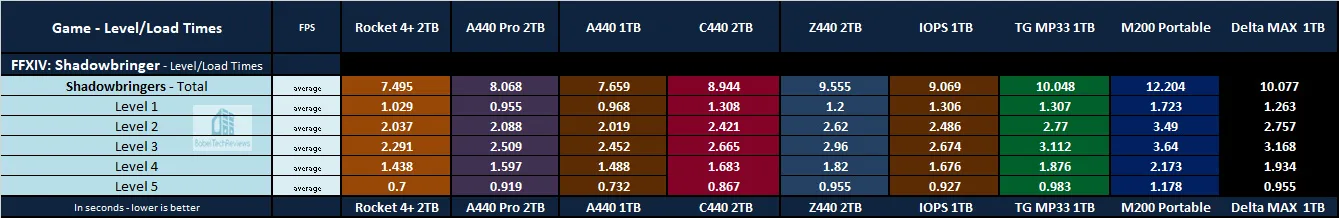
Although all the PCIe SSDs are fast, the Rocket 4 Plus SSD is the fastest at loading Shadowbringers. We also use the newer Endwalker benchmark.
Endwalker Benchmark
The Endwalker benchmark is just as detailed as Shadowbringers and is a very accurate test of loading game and level times. We test using the Endwalker benchmark with the Rocket 4 Plus.
Total Loading times are 7.475 seconds.
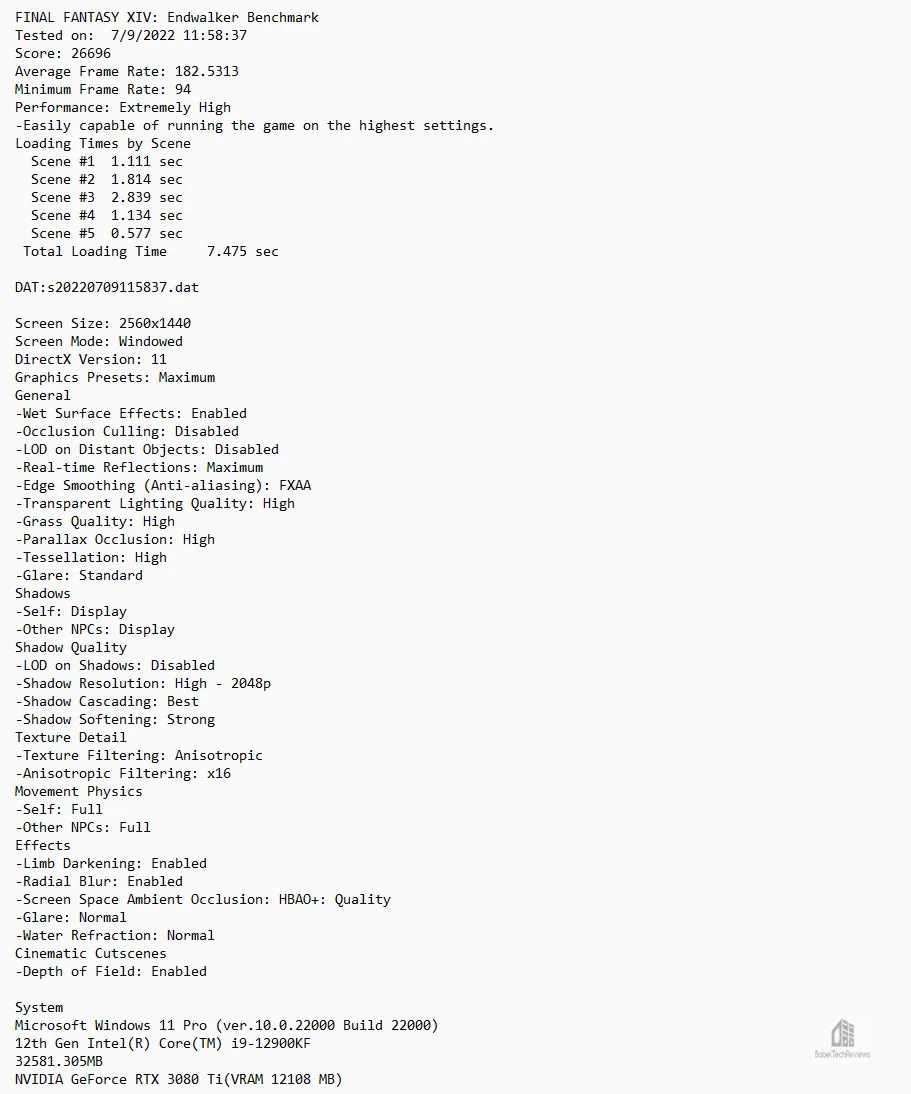
Here is the Endwalker summary chart.

Although we see a 2-3 second difference between our fastest SSD and our slowest SATA III SSD with an additional second required to load from an external drive, the fastest SSD is the Rocket 4 Plus.
It may make an immersion difference for getting right back into the game. However, until developers start to target SSDs for PC game storage, only then we may see SSDs fully achieve the game loading performance they are capable of on Windows. In the meantime, PS5 gamers can take full advantage of the Rocket 4 Plus fast loading speeds.
Faster is better when a gamer wants to get right back into a game. Lets look at file copy speeds next.
File Copy 104GB
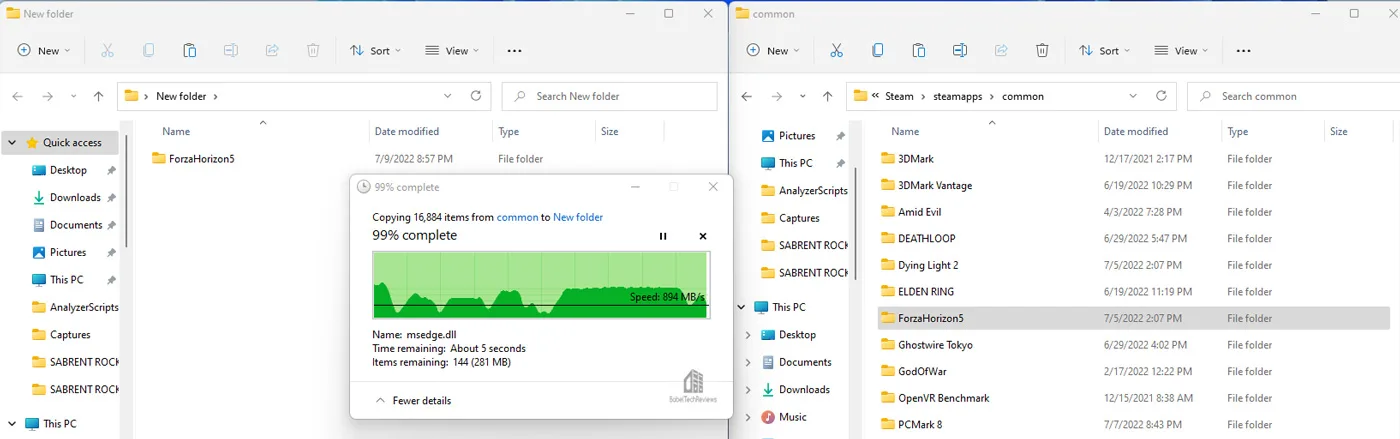
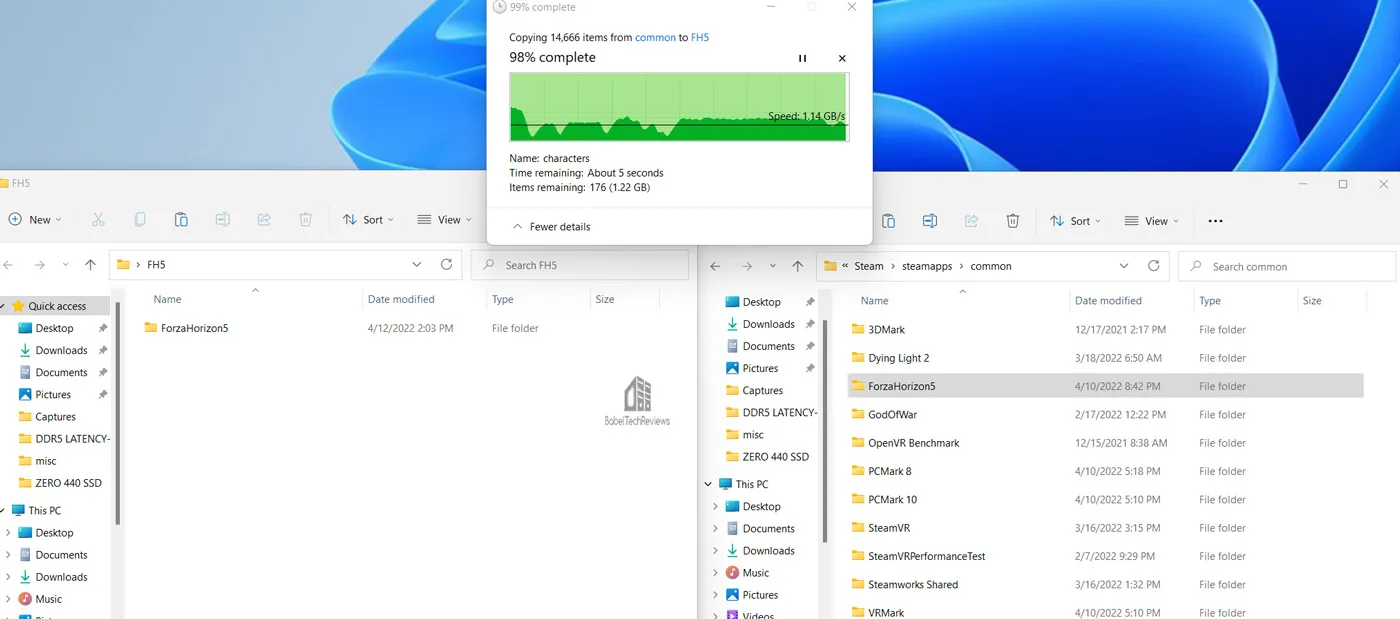
File copy speeds are important to gamers especially when they want to quickly transfer their game files from one location to another. We copy a 104GB folder containing Horizon 5 from its Steam folder to a desktop folder which is something we do regularly when setting up Steam games on multiple PCs. Pay careful attention to the charts (in green) that show the consistency and speed of file copies. They tend to show the ups and downs where each SSD runs out of cache and how long it takes to empty and refill it.
104GB File Copy
The Sabrent Rocket 4 Plus took 1 minutes and 36.0 seconds to copy 104GB.
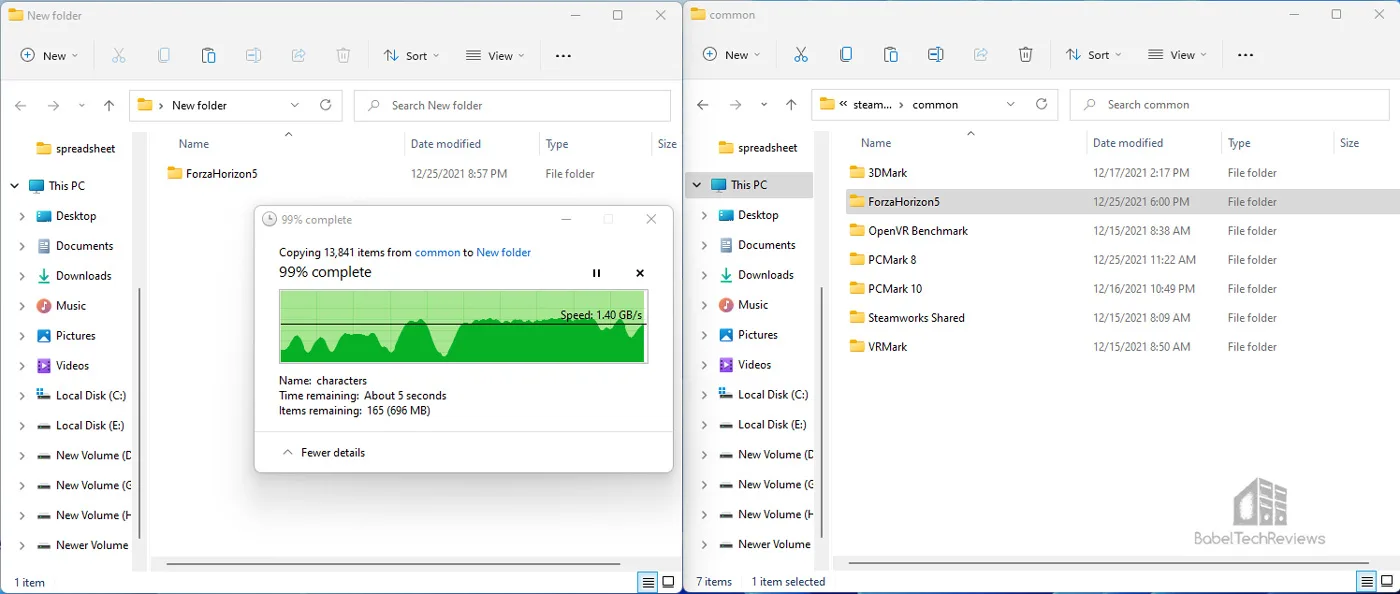
The A440 Pro Speciall Series SSD took 1 minutes and 17.0 seconds. to copy 104GB. 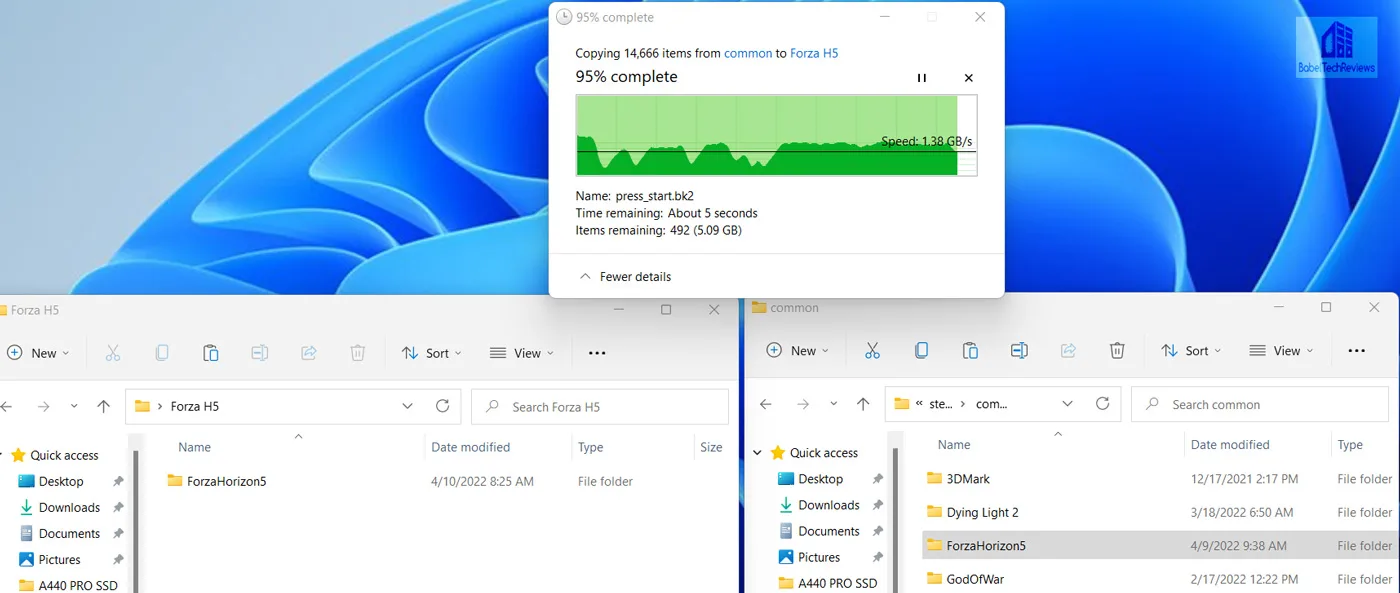 The A440 took 1 minutes and 44.0 seconds to copy 104GB.
 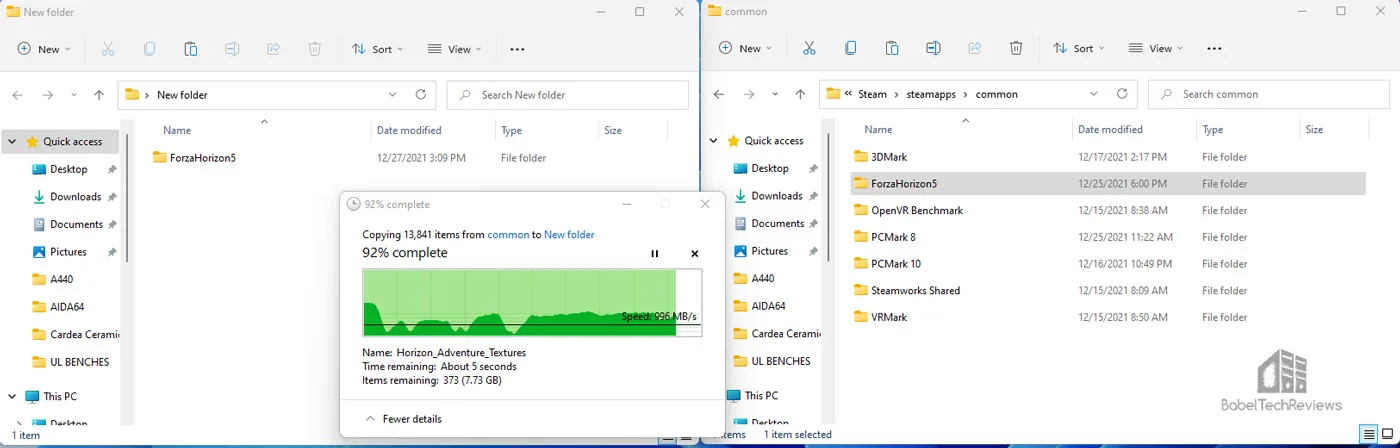 The Ceramic C440 took 1 minutes and 59 seconds for the same copy.
 Let’s summarize our copy times using a chart.
The Sabrent Rocket 4 Plus is the second fastest SSD after the A440 Pro for copying 104GB. However, even a SATA III SSD is much faster than any HDD or SSHD for copying large files. Consider taking a nap if you are going to copy 104GB using a hard drive.
Finally, let’s revisit game/level loading times plus all of our Summary charts and then reach our conclusion.
Summary Charts and Conclusion
Here are all of the gaming and summary charts again for easy reference followed by our conclusion.
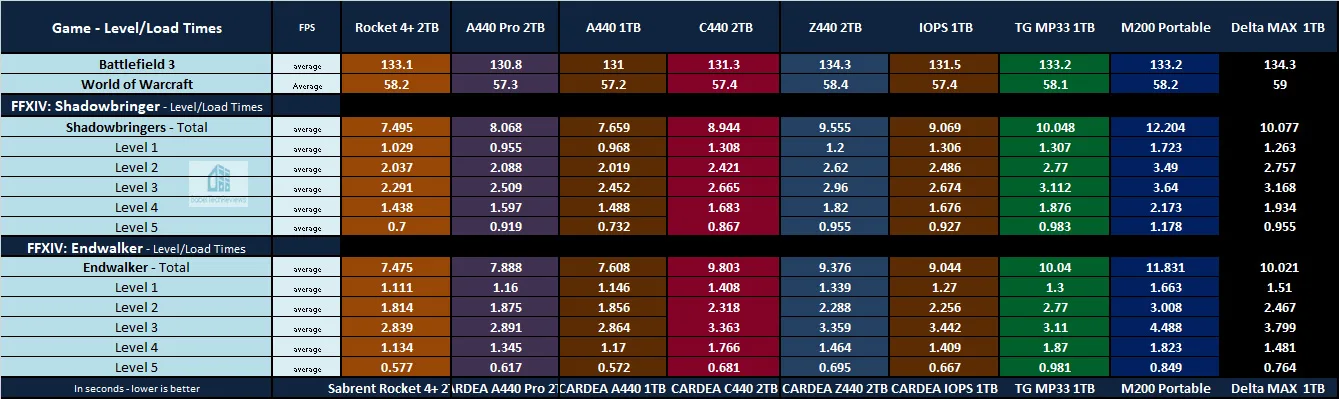
The Game/Level Loading Time Results
Game and game level loading time results are difficult to measure precisely (such as by using a stopwatch) but our tests are far more consistent. Here are the World of Warcraft and Battlefield 3 loading times again as measured precisely by PCMark 8’s storage test and accurately by Final Fantasy XIV: Stormbringer/Endwalker’s benchmarks. Lower (quicker/faster) loading times (measured in seconds) are better.
3DMark’s Storage Benchmark also provides precise SSD bandwidth, loading times, game record, install, and save time comparisons.
All nine SSDs load games quickly but the Generation 4 x4 PCIe SSDs are generally faster than Generation 3 x4 and stand out from SATA III and external SSDs. Overall, the Rocket 4 Plus SSD is the fastest SSD for loading the games we benchmarked.
When PC game developers start to target SSDs for game storage, only then may we see SSDs achieve the super-fast game loading performance they are capable of. Until then, PlayStation 5 gamers may take full advantage of the Rocket 4 Plus and other PCIe 4.0 fast SSD loading speeds.
Non-Gaming Summary Charts
Here are all of the summary charts presented again in one place.
 A gamer who wishes to have the very fastest PC will choose an internal PCIe 4.0 Gen 4 x4 NVMe SSD, and three SSDs stand out as the fastest drives – the Sabrent Rocket 4 Plus and both CARDEA Ceramic A440 SSDs. All three are faster than the CARDEA C440 and CARDEA ZERO Z440 SSDs. The CARDEA IOPS Gen 4 x3 fits in next well ahead of the TeamGroup MP33 or M200 Portable SSDs, and finally the Delta MAX SATA III SSD is almost always in last place.
For gaming and for regular tasks on current Intel platforms, any SSD will provide decent game and level loading performance well above that of mechanical hard drives or even hybrid (SSHD)drives, but a PCIe 4.0 NVMe Gen 4 x4 will provide the highest performance.
Let’s head for our conclusion.
The Conclusion & Verdict
We believe that 1TB is currently the minimum storage capacity for a gamer that includes the operating system since PC games have grown very large and 2TB is probably ideal. It is not yet mandatory to use a SSD for gaming if you have a ton of patience.
Games do not usually perform significantly better on SSDs since most PC developers still target HDDs for game performance. However, games generally take a lot longer to load from a HDD or SSHD than they do from any internal SATA III drive or even from an external USB 3.0 SSD. If a gamer wants to get right back into the game, any SSD will improve immersion and decrease frustration compared with using a HDD or SSHD.
Windows 10/11 have become painful to use when installed on a mechanical or even on a hybrid solid state/hard disk drive. Indexing, Search, or anti-malware Windows programs may saturate the bandwidth of a mechanical drive, and even downloading or updating Steam games will slow your PC to an irritating crawl. This will not happen using a SSD. And for maximum performance with the least frustration, using a PCIe NVMe SSD is the only way to fly.
Let’s recap PCIe 4.0 Gen 4 x4 pricing. The Sabrent Rocket 4 Plus (7,000/6850 MBps) is available from Sabrent for $299 but at the time of writing it’s offered with a 15% off promotion at Newegg for $254.99. The T-FORCE CARDEA A440 Pro Special Series SSD (7400/7000MBps) is priced at Newegg at $359.99 for the 2TB version. The vanilla T-FORCE CARDEA A440 SSD (7,000/6,900MBps) is at Amazon for $249.99 for 2TB and it comes with two heatsinks, the 2TB CARDEA Ceramic C440 (5,000/4,400MBps) is priced at $229.99, and the 2TB T-FORCE CARDEA ZERO Z440 SSD (5,000/4,400MBps) is available at Amazon at $227.99 for the 2TB version.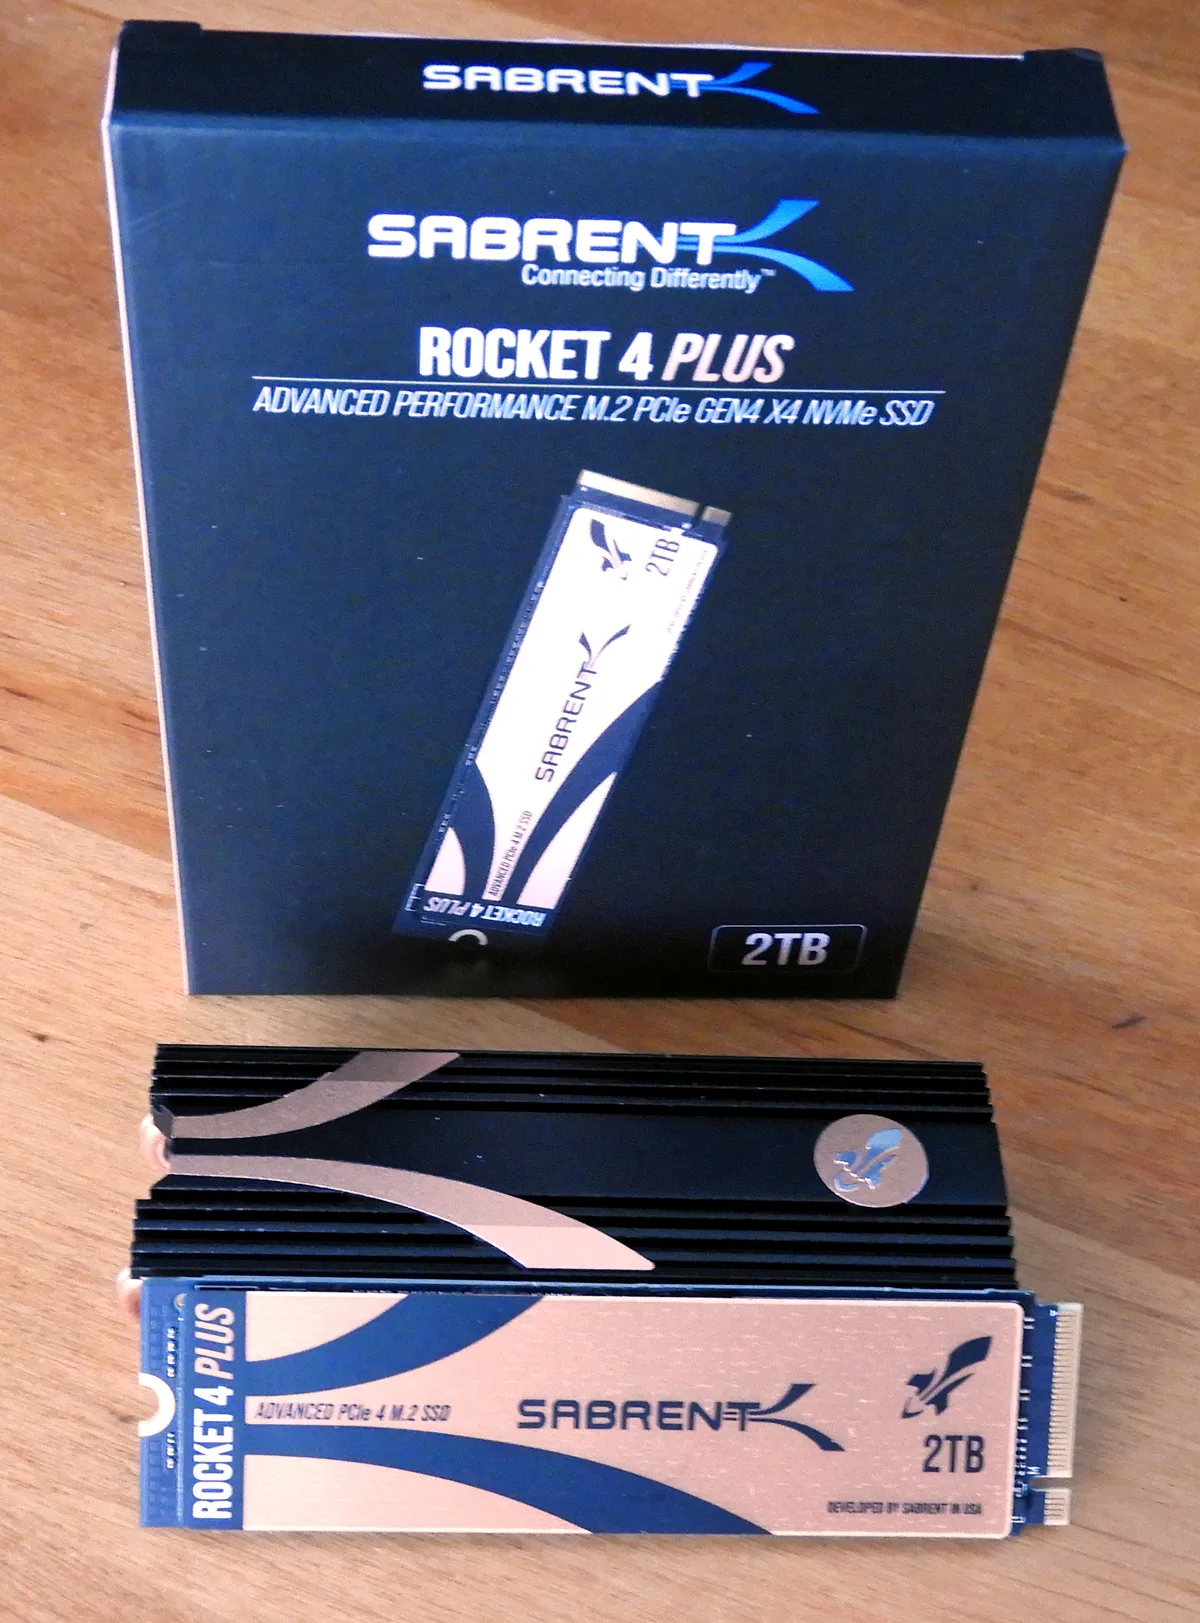
We believe that spending the extra money is worth it for a fast 2TB NVMe Gen 4 x4 SSD over Gen 3 x4 as long as your motherboard supports PCIe 4.0, and the Sabrent Rocket 4 Plus is a great choice especially at the Newegg sale price of $254.99. If you have an integrated NVMe motherboard heatsink, the Rocket 4 Plus is an especially great choice as the fastest game loading SSD we have tested so far.
Of course, gamers on a budget should also look for sales. Because of today’s close pricing and competition, choosing an SSD is easier than ever. Based on performance and price, we recommend the Sabrent Rocket 4 Plus as a competitively-priced blazing-fast SSD. A five year warranty backed by Sabrent insures that a player will enjoy fast performance for years to come as long as you register the product.
Pros
- 5-year warranty (if registered) backed by Sabrent support
- Fastest game/level loading speeds and very fast large file copy speeds
- Fast Write and Read speeds
- The Sabrent Rocket 4 Plus is priced competitively at $299 and an awesome buy for $259 with the Newegg promotion
- Thin foil heatsink fits under integrated motherboard NVMe heatsinks
- Sabrent Acronis True Image cloning software for Sabrent included
Cons
- The included graphene heatsink is inadequate to prevent throttling under heavy load. Use an aftermarket or integrated MB heatsink
- You have to register the product to get the full 5 year warranty; if not, you get 1 year
![]()
Next up, a VR review of the RX 6650 XT and Rodrigo is working on a GeForce driver performance analysis. Stay tuned.
Happy Gaming!