This RX Vega 56 versus GTX 1070 overclocking showdown is part of our RX Vega “Unleashed” series. Today, we have optimized our overclocks with all performance options set to their highest limits to get the most performance from each card.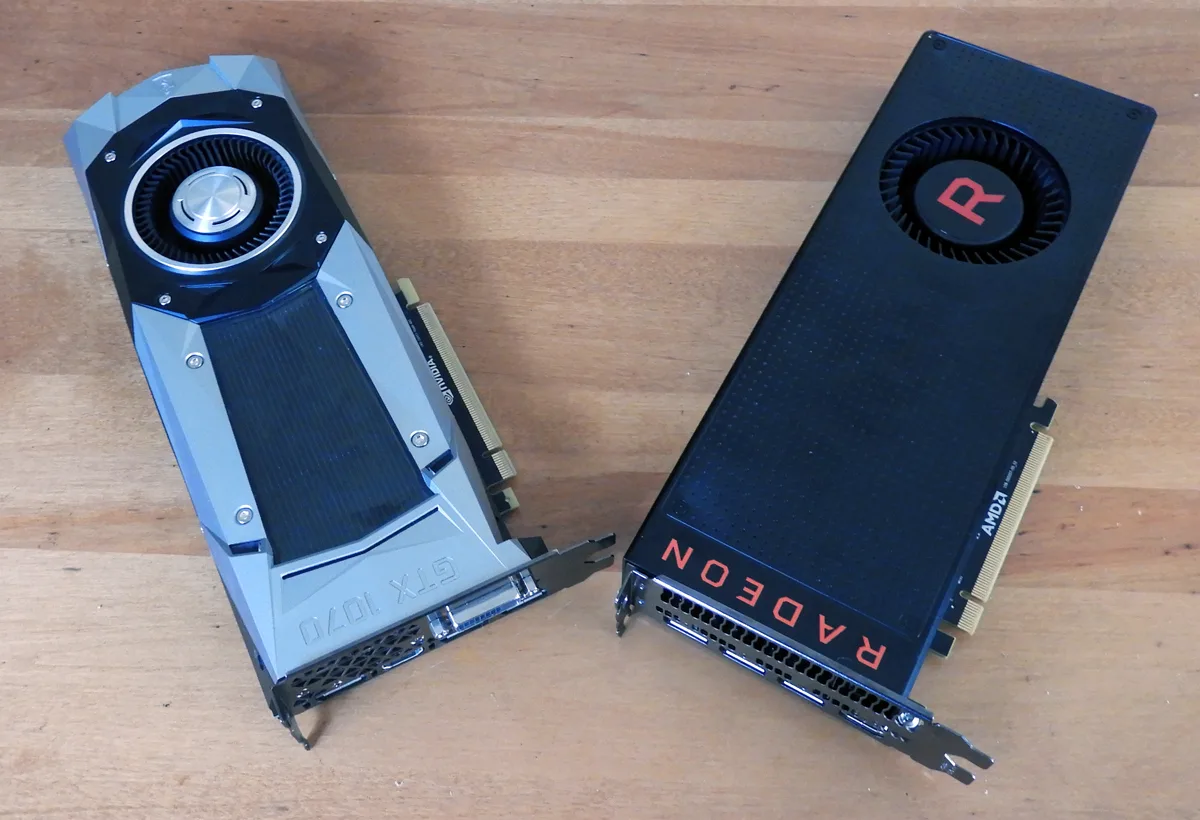
Previously, we found that the stock-clocked $399 reference version of the RX Vega 56 is about 8-9% faster than the $399 stock-clocked reference GTX 1070 FE using 28 PC games. This time, we will test 20 PC games, and overclock the GTX 1070 FE and the RX Vega 56 each as far as they will go to see where they stand in relation to each other fully overclocked.
Undervolting & Overclocking the RX Vega 56
Overclocking the sample of the reference RX Vega 56 that we borrowed from Tech of Tomorrow benefited from undervolting unlike our RX Vega 64 Liquid Cooled Edition which did not. The goal with undervolting is to maximize Vega’s overall overclock by concentrating on overclocking the HBM 2 as far as possible using the maximum 1200mV that WattMan allows.
Since it is not possible to supply enough voltage to the core and to the memory simultaneously to get the highest possible overclock without putting either the power usage through the roof or accepting uneven clocks, we have to drop voltage to the core while still trying to keep the highest overclock we can manage. And of course, we supplied the maximum +50% Power Limit, turned the temperatures to their maximum limits, and set the fan to 100% to try and approximate what aftermarket RX Vega 56 cards may achieve with better cooling and power delivery.
First we decided on the maximum core overclock on stock voltage that made the most sense with regard to energy draw and performance bang-for-buck which for this RX Vega 56 sample is 2.5%. Then we found the maximum memory overclock that was attainable on this GPU (985MHz) with the maximum sustained memory voltage allowed partly by underclocking the core voltage. Here is the final stable overclock that we were able to maintain with the reference version of Vega 56 for 20 games.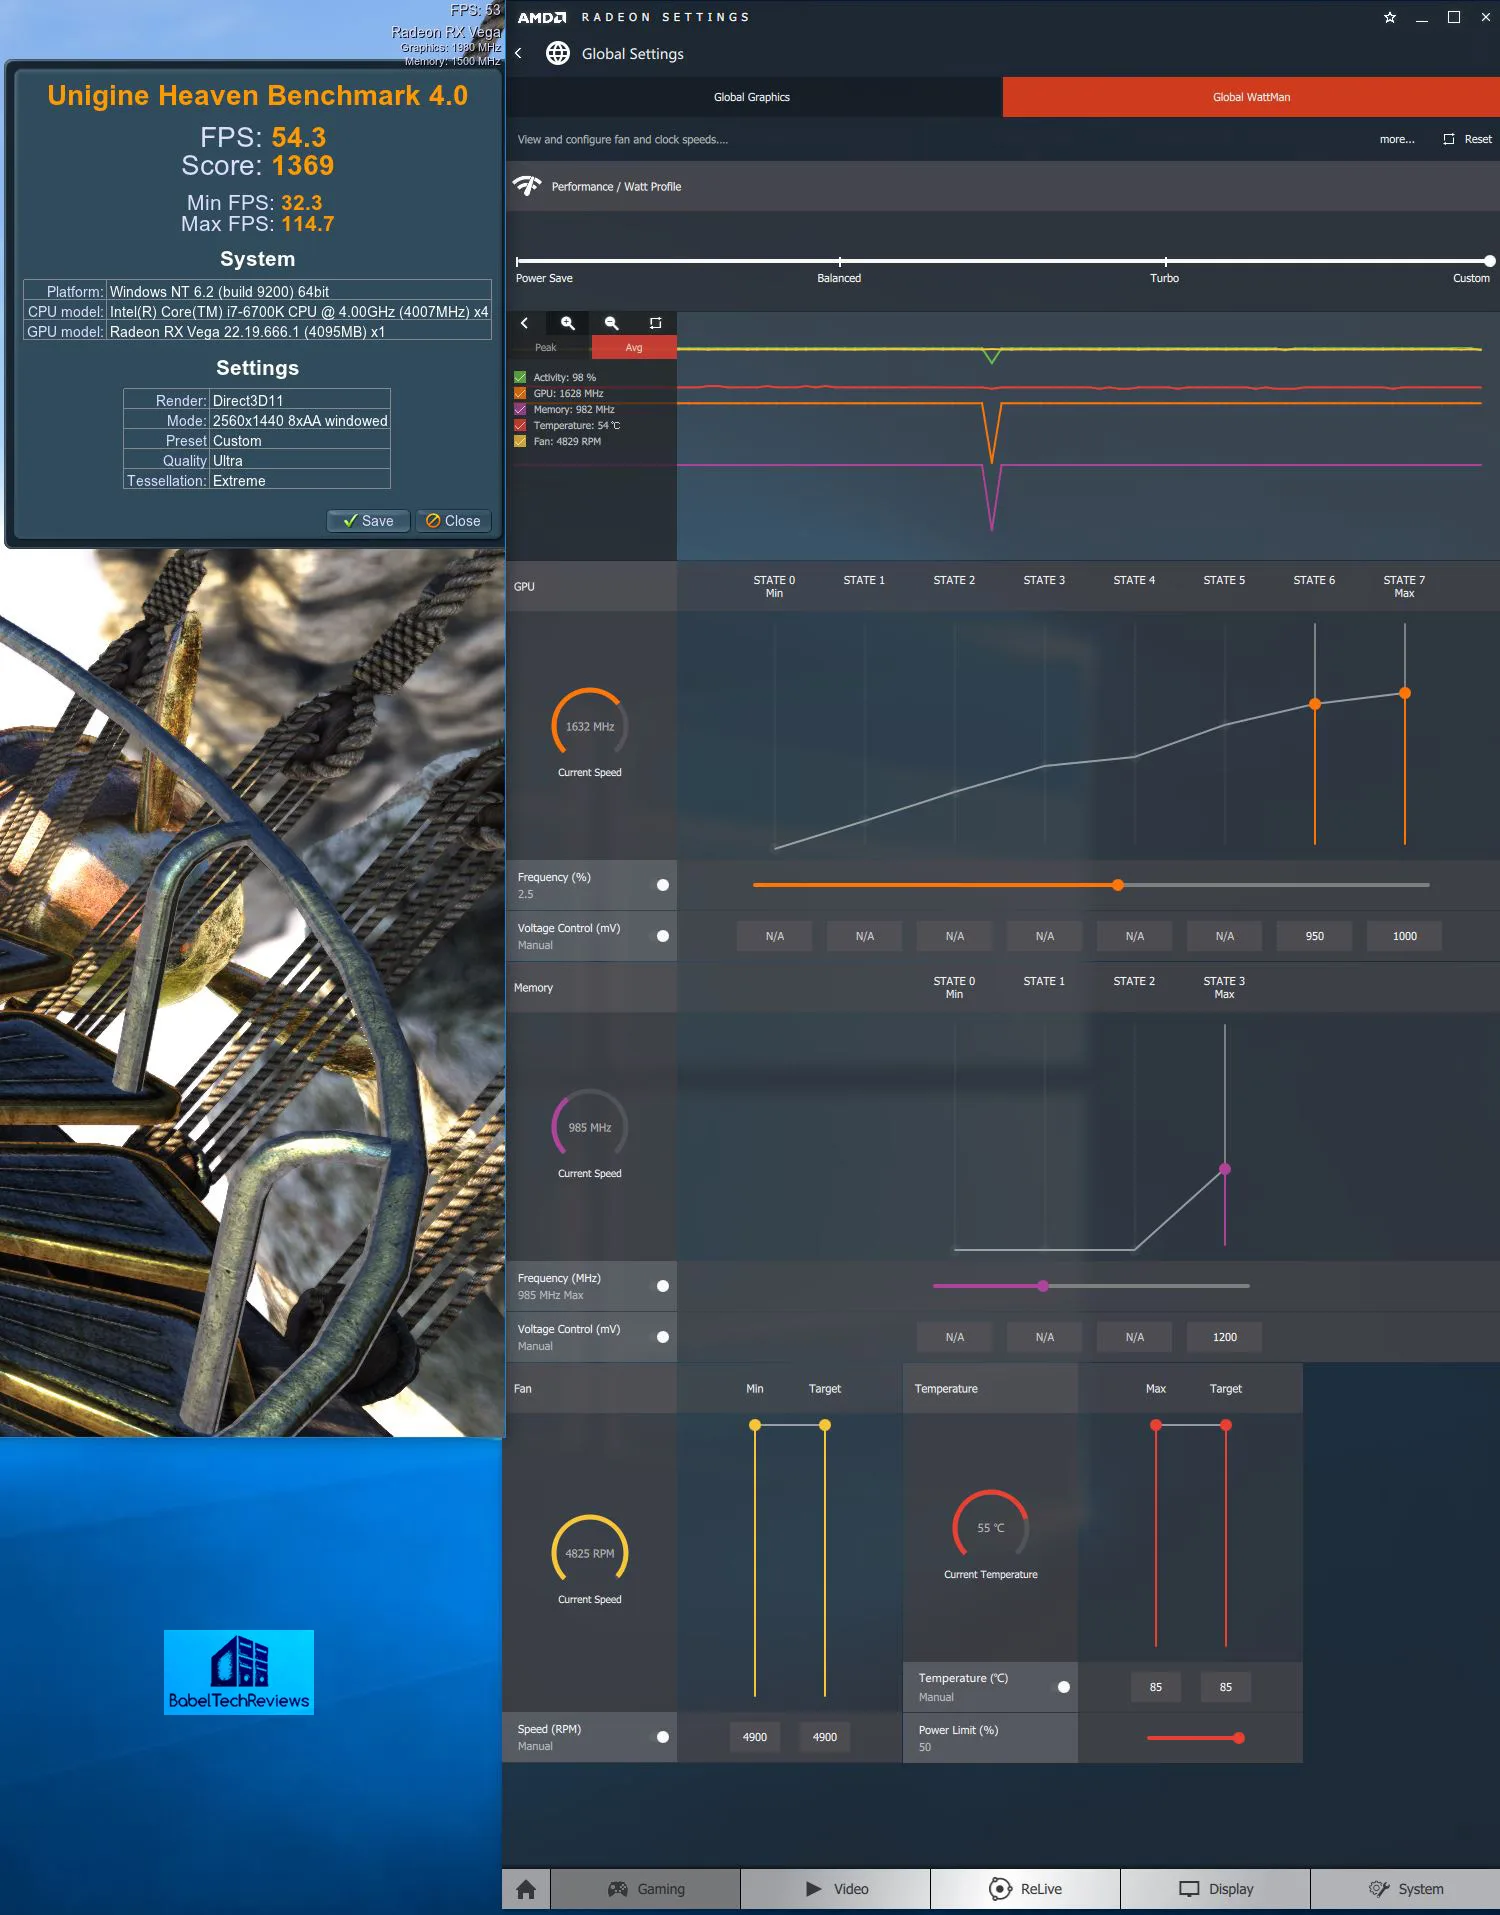
Issues with the RX Vega 56 Overclock
First of all, we had to revert to AMD Crimson ReLive drivers 17.8.2 from 17.9.1 to get any overclock at all. Evidently 17.9.1 is a bug fix driver, but it does not allow overclocks to be set.
The easiest way to tell if an overclock is really successful or not is to reset WattMan’s reporting tool under Avg before running a benchmark, and afterward check to make sure the memory clock is a straight (purple) line. After running 20 games we began to notice that the memory clocks no longer held steady at 985MHz as previously. We continued to decrease the core overclock and the core voltage but these temporary measures to keep the voltage up to the memory eventually failed and the HBM2 clocks finally became erratic as below.
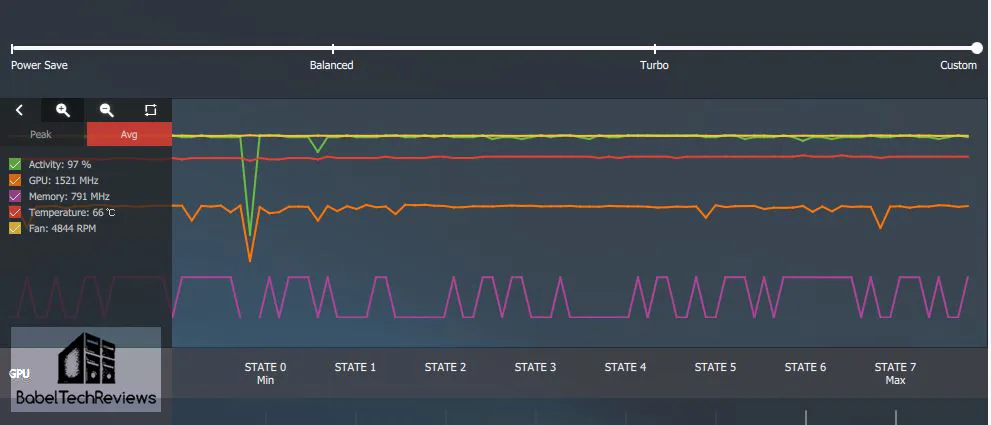
Of course with the memory clocks dropping and rising, the performance tanked. We tried reinstalling the drivers, and even moved the card to a different drive, but our reference RX Vega 56 would no longer hold any overclock on its HBM 2 and we called an end to our testing at 20 games instead of our usual 28. We did not flash to a Vega 64 Liquid BIOS to attempt to gain an additional 50mV but we used WattMan’s tool to supply the maximum 1200mV allowed by it. Fortunately, the card still runs OK at stock settings but it will not hold any memory overclock now.
For our 20 overclocked games, we settled on a 2.5% overclock to the core and the memory clocks were overclocked from the reference 800MHz to 985MHz with the fan allowed to ramp to 100%. Temperatures never reached even close to 80 C, but at 100%, the fan is quite annoying. We found that higher Vega 56 memory clocks gained significant performance in games, much more so than from overclocking the core. However, it appears that the reference RX Vega 56 edition is already running very close to its maximum core clocks.
Overclocking the Founders Edition of the GTX 1070
We devoted a separate evaluation to overclocking the GTX 1080 Founders Edition which you can read here, and the methodology is very similar to overclocking the GTX 1070 FE. We settled on a final stable overclock of adding 140 MHz to the core which settled in around 2012MHz with GPU Boost, and we added 520MHz to achieve a 4519MHz final stable memory clock. 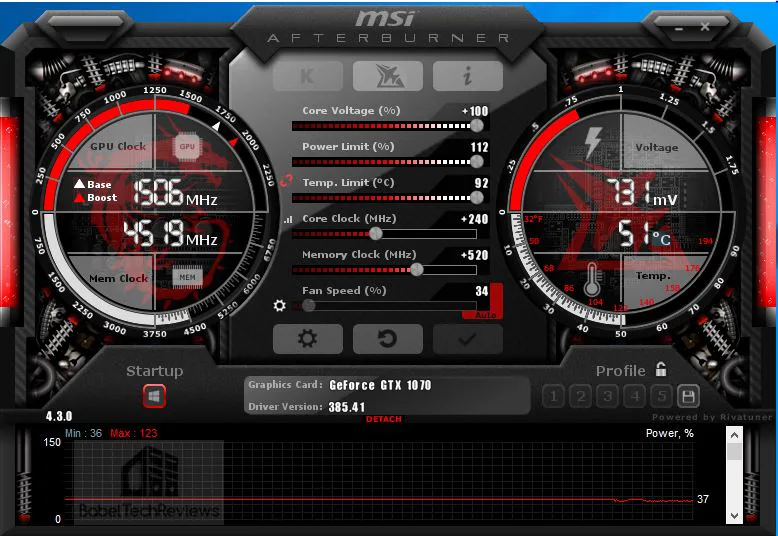
We did not need to adjust the fan profile, but left it on automatic. The GTX 1070 memory overclock greatly contributed to the increased performance. The fan never became obtrusive as we were able to leave it at stock and the GPU remained relatively cool in the mid-70s C.
Testing Platform
Our testing platform is Windows 10 Home 64-bit, using an Intel Core i7-6700K at 4.00GHz which turbos to 4.6GHz for all cores as set in the ASRock Z170 motherboard’s BIOS, and 16GB of HyperX DDR4 at 3333MHz. The settings and hardware are identical except for the two cards being tested.
We normally feature 28 games but were only able to test 20 games before the RX Vega 56 memory overclock became unstable. We also test VR with Futuremark’s Orange and Blue Room benchmarks and will compare the performance at 1920×1080, 2560×1440, and at 3840×2160 resolutions with maximum settings.
Before we run benchmarks, let’s check out the test configuration.
Test Configuration – Hardware
- Intel Core i7-6700K (reference 4.0GHz, HyperThreading and Turbo boost is on to 4.6GHz; DX11 CPU graphics).
- ASRock Z170M OC Formula motherboard (Intel Z170 chipset, latest BIOS, PCIe 3.0/3.1 specification, CrossFire/SLI 8x+8x)
- HyperX 16GB DDR4 (2x8GB, dual channel at 3333MHz), supplied by HyperX/Kingston
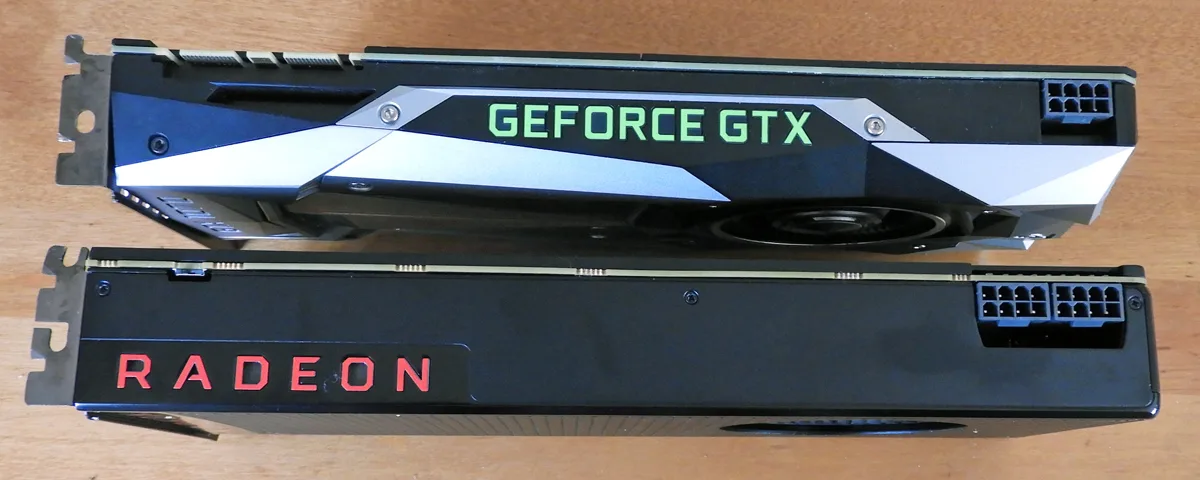
- Gigabyte RX Vega 56 Reference Edition, 8GB, stock clocks and overclocked, on loan from ToT.
- GTX 1070 8GB, Founders Edition, reference clocks and overclocked, supplied by NVIDIA
- Gigabyte RX Vega 64 Liquid Cooled Edition, 8GB, reference clocks.
- GTX 1080 8GB, Founders Edition, reference clocks, supplied by NVIDIA
- GTX 1080 Ti 11GB, Founders Edition, reference clocks, supplied by NVIDIA
- Two 2TB Seagate 7200 rpm SSHDs for each platform
- EVGA 1000G 1000W power supply unit (for both platforms)
- EVGA CLC280, 280mm CPU watercooler, supplied by EVGA
- Onboard Realtek Audio
- Genius SP-D150 speakers, supplied by Genius
- Thermaltake Overseer RX-I full tower case, supplied by Thermaltake
- ASUS 12X Blu-ray writer
- Monoprice Crystal Pro 4K
- ACER Predator X34 GSYNC display, supplied by ACER/NVIDIA
Test Configuration – Software
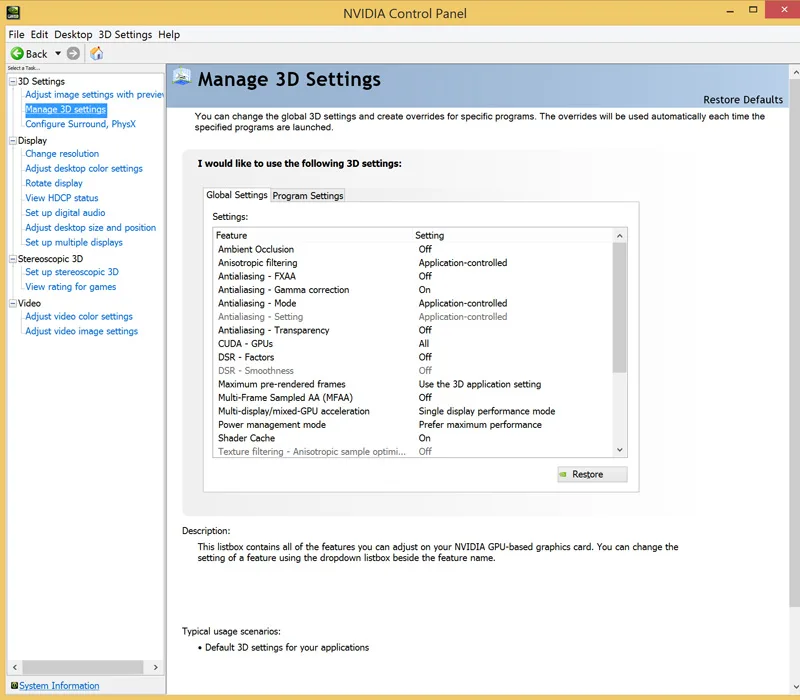
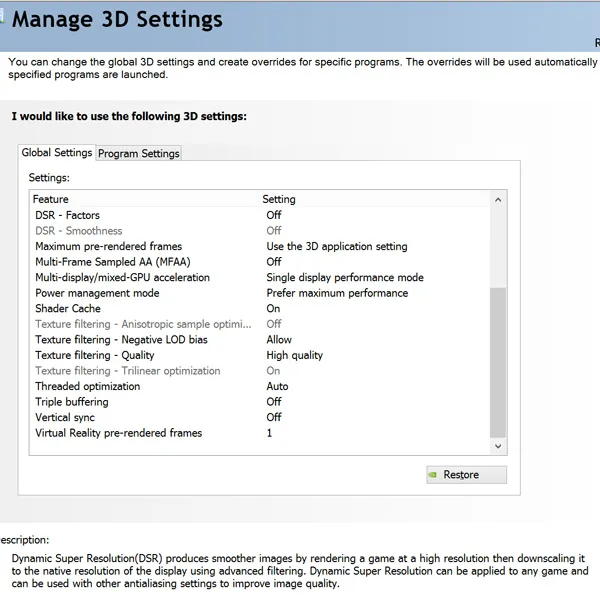
- GeForce WHQL 385.41 used for the GTX 1070 FE. WHQL 384.94 was used for the GTX 1080. WHQL 385.28 was used for the GTX 1080 Ti. High Quality, prefer maximum performance, single display. See control panel images below.
- AMD ReLive Software 17.9.1 drivers were used for the benching the Vega 56 at stock clocks and 17.8.2 was used for the overclocked results. See control panel image below. 17.30.1051-b6 (Public Launch drivers) used for the Vega 64 Liquid edition.
- VSync is off in the control panel.
- AA enabled as noted in games; all in-game settings are specified with 16xAF always applied
- All results show average frame rates including minimum frame rates shown in italics on the chart next to the averages in smaller font. Percentage increases are calculated between the average frame rates of the RX Vega 64 at stock and at overclocked settings, and also of the GTX 1080 between stock and overclocked settings.
- Highest quality sound (stereo) used in all games.
- Windows 10 64-bit Home edition, all DX11 titles were run under DX11 render paths. Our four DX12 titles are run under the DX12 render path. Latest DirectX
- All games are patched to their latest versions at time of publication.
- WattMan
- MSI Afterburner.
- OCAT
- Fraps
The 28 PC Game benchmark suite & 4 synthetic tests
Synthetic
- Firestrike – Ultra & Extreme
- Time Spy DX12
- VRMark Orange Room
- VRMark Blue Room
DX11 Games
- Crysis 3
- Metro: Last Light Redux (2014)
- Grand Theft Auto V
- The Witcher 3
- Rainbow Six Siege
- DiRT Rally
- Far Cry Primal
- Call of Duty Infinite Warfare
- Battlefield 1
- Resident Evil 7
- For Honor
- Ghost Recon Wildlands
- Mass Effect: Andromeda
DX12 Games
- Tom Clancy’s The Division
- Ashes of the Singularity
- Hitman
- Rise of the Tomb Raider
- Total War: Warhammer
- Deus Ex Mankind Divided
- Gears of War 4
Nvidia Control Panel settings
We used MSI’s Afterburner to set the power and temp limits to their maximums.
AMD Radeon Global Settings:
Here are the global game settings in AMD’s ReLive control panel that we use. We used WattMan to set the Power and temp limits to their maximums.
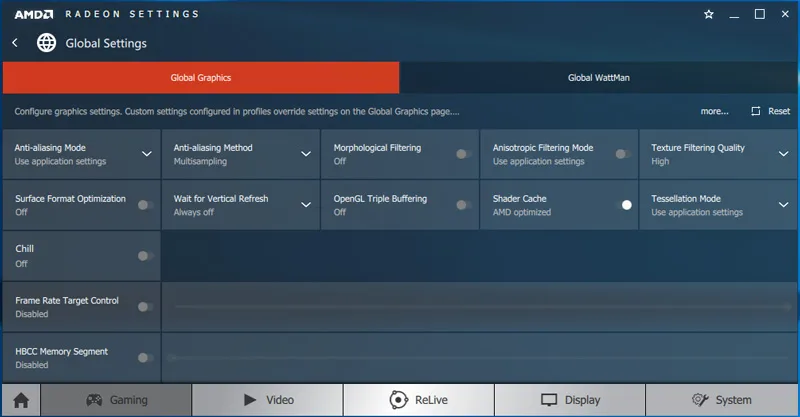
Using WattMan for our regular non-overclocked settings, the Power Limit is set to +50%, the temperature is allowed to reach the maximum 70C, and the fan is also allowed to spin up to its maximum, but the core and memory clocks are unchanged. WattMan is also used to set maximum RX Vega 56 overclocks.
Even with the latest Crimson 17.9.1 drivers, WattMan does not always hold its settings between reboots, so it’s important to check and reset your overclock as needed. And we had to revert to 17.8.2 for our overclocked benchmarking.
Calculating Percentages
There are two methods of calculating percentages. In a recent evaluation we used “Performance Differences” to compare the GTX 1080 and the GTX 1080 Ti versus the RX Vega 64 LC. This time we are now using “Percentage Changes” which are usually used to show improvements in average frame rates (FPS) between stock and overclocked results.
For the percentage changes, we mean the increase in frame rates between the stock and the overclocked RX Vega 64 (and stock and overclocked GTX 1080), divided by the absolute value of the original stock frame rate in FPS, multiplied by 100. Percentage change may be expressed by the algebraic formula where “V” is Value: ( ΔV / |V1| ) * 100 = ((V2 – V1) / |V1|) * 100
.
Let’s head to the performance charts to see how the overclocked-to-the-max GTX 1070 FE compares with the overclocked-to-the-max RX Vega 56.
Performance summary charts
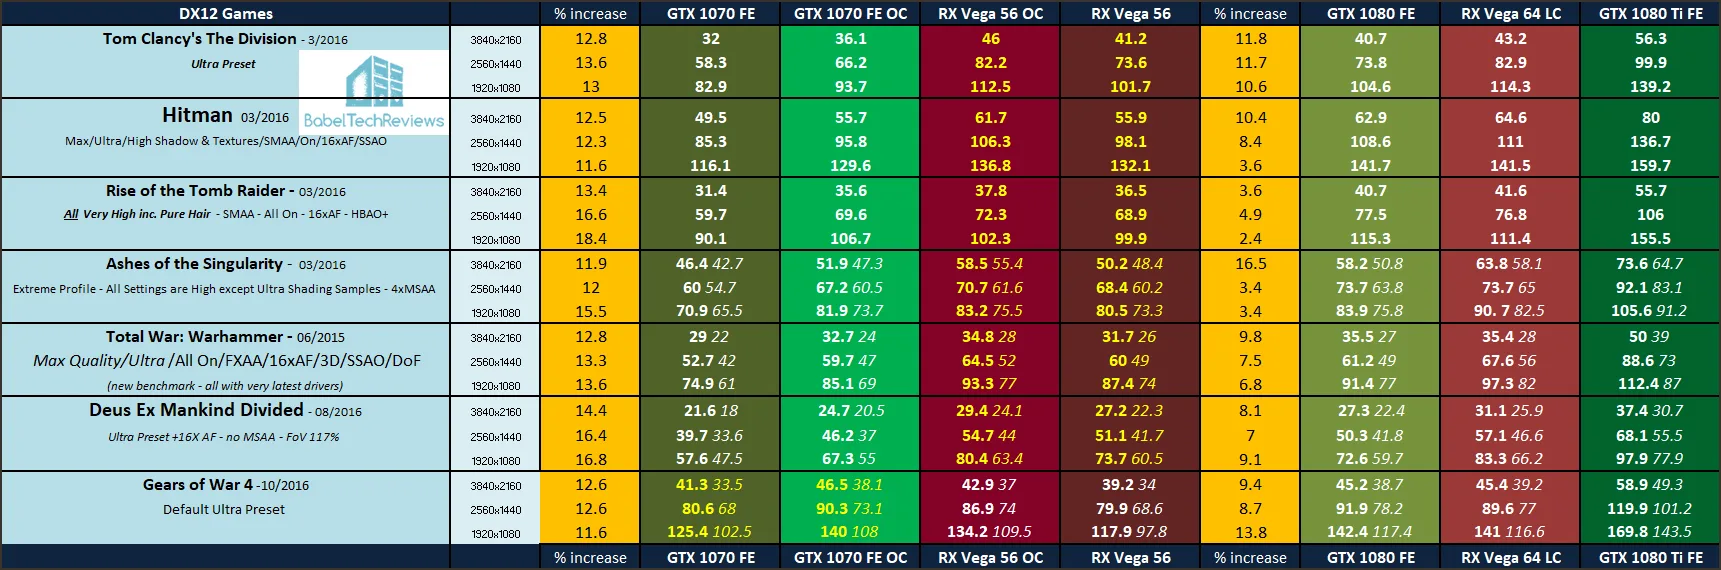
Below are the summary charts of 20 games and 4 synthetic tests. The highest settings are always chosen and DX12 is picked above DX11 where available. Specific game settings are listed on the charts and the benches were run at 1920×1080, 2560×1440, and at 3840×2160. All results, except for the synthetic benchmarks show average frame rates and higher is always better. Minimum frame rates are shown when they are available, next to the averages but they are in italics and in a slightly smaller font.
The GTX 1070 FE stock results are presented in the first (dark green) performance results column next to the second (lighter green) GTX 1070 overclocked results; the overclocked RX Vega 56 results are in the first (lighter red) column, and the next (darker red) column represents the stock RX Vega 56 results. The first yellow column represents the percentage performance increases of the overclocked GTX 1070 over stock, and the last yellow column represents the performance percentage increase of the overclocked RX Vega 56 over its stock-clocked results. Finally the stock GTX 1080, the stock RX Vega 64 Liquid edition, and the stock GTX 1080 Ti are shown in the last three columns for comparison. Yellow numbers show “wins” between the GTX 1070 and the RX Vega 56.
The following 3 charts may be easier to read when opened in separate tabs or windows.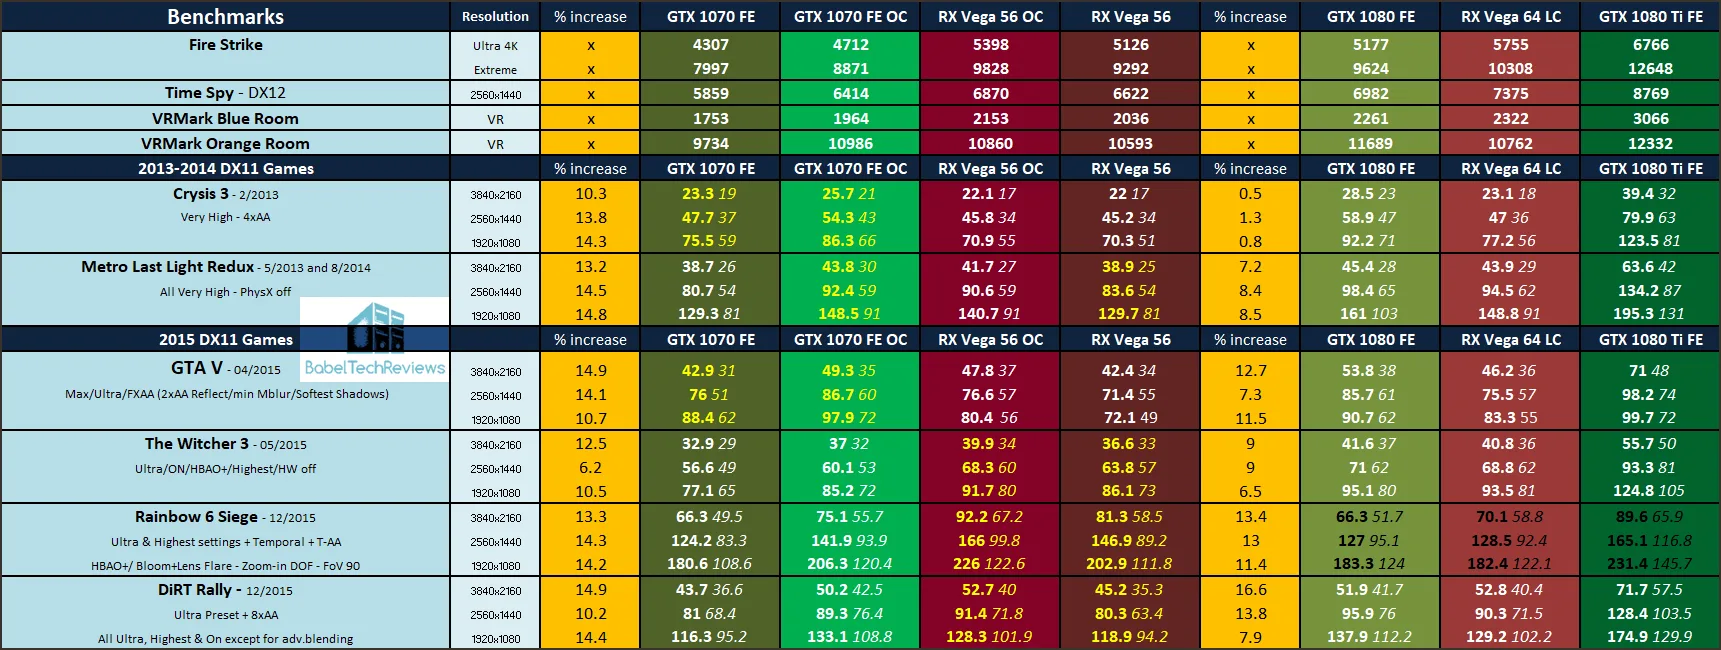
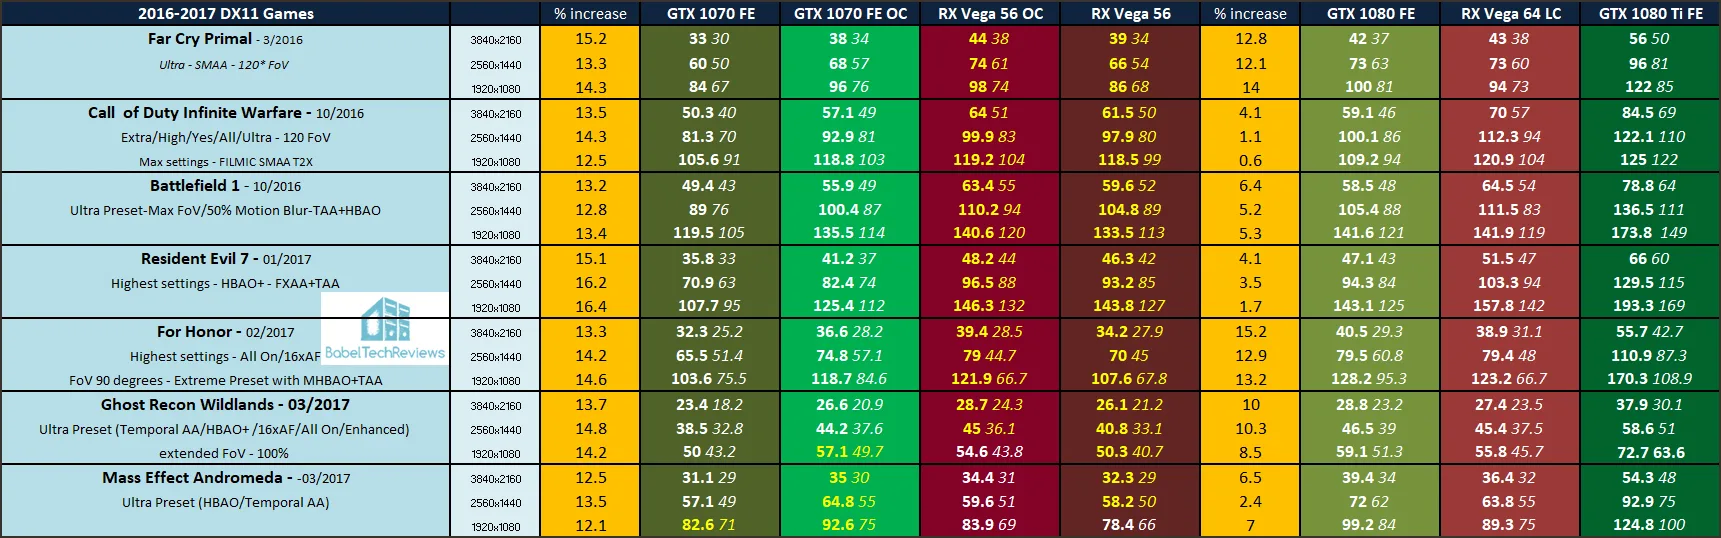
 Rainbox Six: Siege got a new major update and performance has increased with the new patch. The GTX 1080/Ti and Vega 64 were benchmarked before the update and should not be compared with GTX 1070/RX Vega 56 results.
The $399 stock-clocked GTX 1070 FE wins 10 individual game benchmarks to the $399 RX Vega 56’s 50 games. And even though both cards overclock decently, the overclocked RX Vega 56 loses a little ground winning 44 game benchmarks, while losing to the overclocked GTX 1070 FE’s 16 wins.
Let’s head to our conclusion.
Conclusion
This has been quite an interesting exploration for us evaluating the overclocked $399 RX Vega 56 reference edition versus the overclocked $399 GTX 1070 FE. The RX Vega 56 is a faster card than the GTX 1070 FE. Both cards overclock decently, with the RX Vega 56 gaining a very nice memory overclock which greatly increased its performance over stock. However, the GTX 1070 FE is a stronger overclocker percentage-wise, and it gained more consistent performance overall from overclocking than its Vega 56 competitor did.
Both cards appear to scale well with overclocking although the GTX 1070 FE overclocks further and uses significantly less power doing so than the RX Vega 56. We could not recommend the RX Vega 64 over the GTX 1080 except perhaps in specific situations where the gamer already has a FreeSync display, but the real star of AMD’s Vega constellation appears to be the RX Vega 56 if it can maintain its $399 pricing versus the GTX 1070.
The main issue that we can see is that the Vega 56 reference version runs hot and throttles unless its fan is set very high, and we would recommend waiting for AMD partner versions. We also don’t feel that one should be required to undervolt the core just to get a decent memory overclock, and we look forward to seeing AMD partner Vega designs and possibly improved power delivery.
Next up, we are putting together our new automatic adjustable Standing Desk, the VertDest v3, that we are setting up now for review as we build our Ryzen 7 platform. Stay tuned.
Happy Gaming!
Comments are closed.