Since BabelTechReviews purchased an Oculus Rift last December, we have been playing 27 VR games using six top NVIDIA and AMD video cards, and we have completed performance benchmarking for Showdown, Alice VR, Batman Arkham VR, Chronos, DiRT Rally, Robo Recall, and Serious Sam: The Last Hope. We posted our original evaluation a few months ago and since then, we have been exploring ways to accurately benchmark VR games. PC benchmarking methods such as using Fraps do not accurately convey the performance that the user actually experiences in the HMD (Head Mounted Display), and until recently, there were no logging tools available for the Oculus Rift as there are for the HTC Vive.
Fortunately, NVIDIA has recently released FCAT VR as an accurate VR benching tool that we will compare with our own video benchmarking which uses a camera to capture images directly from a Rift HMD lens. For each of our six test video cards, we will use Showdown to compare NVIDIA’s FCAT-generated frametime graphs and performance results directly with the Oculus Performance DeBug tool overlay running in real time in our videos. We will also benchmark 5 other games using the GTX 1080 Ti FE, the GTX 1080 FE, the GTX 1070 FE, a EVGA GTX 1060 SC, the Fury X, and a Gigabyte G1-RX 480 at RX 580 clocks with our Core i7-6700K at 4.0GHz where all 4 cores turbo to 4.6GHz, an ASRock Z7170 motherboard and 16GB of Kingston HyperX DDR4 at 3333MHz.
In part 1 of our evaluation, we gave an overview of Virtual Reality (VR) and looked at the complexities of Oculus Rift VR benching. We used the few synthetic benchmarking tools then available to roughly compare video card performance of nine AMD and NVIDIA video cards.
In this part 2, we will go into more depth as we attempt to perform accurate video VR benchmarking, and by using NVIDIA’s FCAT VR, we believe that we will be able to convey to BTR’s readers an accurate sense of what is actually happening in the HMD while VR benchmarks are being run. And the FCAT generated charts will be clearly able to show the performance difference between competing video cards.
Until NVIDIA released FCAT VR in March, there was no universally acknowledged way to accurately benchmark the Oculus Rift as there are no SDK logging tools available. To compound the difficulties of benchmarking the Rift, there are additional complexities because of the way it uses a type of frame reprojection called asynchronous space warp (ASW) to keep framerates steady at either 90 FPS or at 45 FPS.
Both NVIDIA and AMD agree that Fraps benchmarking only provides a slight correlation between what the user actually experiences and what is displayed by the Windows desktop. Fraps only measures the framerate of the desktop window, not what appears in the HMD so the performance that a user sees in the desktop window is not a valid proxy for the experience in the HMD. OCAT, Performance Mon, Afterburner, and other PC benching software do not accurately report nor measure what the user experiences in the HMD. And it is important to be aware of VR performance since poorly delivered frames will actually make a VR experience quite unpleasant and the user can even become VR sick.
VR sickness is similar to motion sickness with a sick sensation in ones stomach or with a headache or both. Common symptoms are general discomfort, headache, stomach upset, nausea, fatigue, drowsiness, and disorientation. If a player gets VR sick, they may have to quit playing in VR for the rest of the day, or it may take less time to recover depending on the person. Taking a nap often helps but extreme sickness can even lead to vomiting.
Let’s take a close look at NVIDIA’s VRWorks as well as at AMD’s LiquidVR, and then at our own video benching before we look at our 6-pack of video cards performance with six VR games plus Showdown using FCAT VR and video benchmarking.
NVIDIA vs. AMD – the SDK War to minimize latency & deliver a Premium VR experience
Please read Oculus Rift VR Benching, Part 1 as it gives a good introduction to VR. It details the difficulty of providing high-quality VR at 90 FPS as the average VR game is about seven times more demanding than a PC game at 1920×1080. The following images by NVIDIA shows this clearly.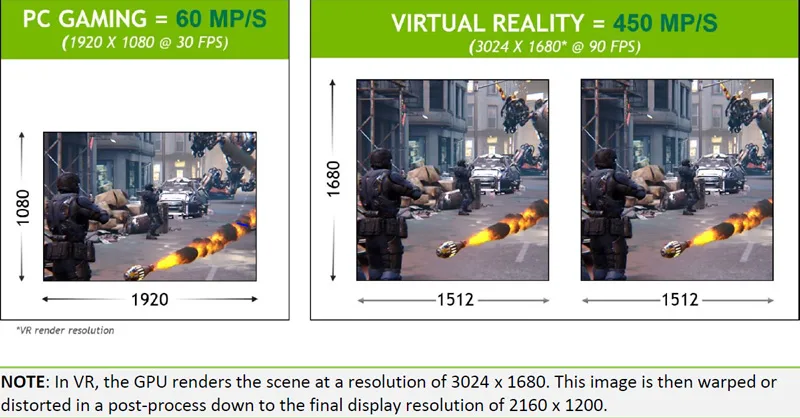
In addition to rendering at a high frame rate and high resolution, the GPU also needs to maintain low latency between head motion and display updates. This low latency is important so that when you move your head, everything stays in sync with what your eyes see in the HMD. If the display updates too slowly, the user may experience serious discomfort. To put it into a nutshell, keeping frame rates high and consistent and latency low is crucial to delivering a high-quality VR experience, otherwise the VR gamer might actually get ill.
VR Research has shown that the motion-to-photon latency should be below 20 milliseconds to ensure that the experience is comfortable for users which means that the GPU pipeline becomes even more critical. Input has to first be processed and a new frame submitted from the CPU, then the image has to be rendered by the GPU, and finally scanned out to the display. Each of these steps adds latency and new techniques were developed to reduce VR latency below PC gaming levels.
Just as in the PC gaming space, AMD and NVIDIA are both heavily involved with VR believing it to be the “next big thing” in gaming. Polaris was touted by AMD as an inexpensive way to bring VR to the masses, and both companies have Software Development Kits (SDK) to help game developers create the best VR experience for their games. NVIDIA has VRWorks and AMD’s SDK is LiquidVR, plus there are also SDKs for the Oculus Rift and for the HTC Vive which work together with AMD and NVIDIA platforms.
NVIDIA VRWorks
To overcome the challenges of delivering VR smoothly, NVIDIA has created a VR graphics platform that increases performance, reduces latency, and provides a seamless out-of-box VR experience for GeForce users. The components of this graphics platform that is named VRWorks are comprised of NVIDIA GeForce GTX GPUs, GeForce Experience, and the VRWorks SDK.
We are going to test the latest gaming NVIDIA Pascal-based GeForce GTX GPUs (the GTX 1060, GTX 1070, GTX 1080, and GTX 1080 Ti) which are optimized to deliver the raw frame rates and high resolution required for demanding VR experiences. With full support for the DirectX 12 graphics API, and a Pascal Simultaneous Multi-Projection (SMP) architecture that enables new rendering techniques for VR, the GTX 1060 is a very good video card in our experience for entry-level VR that still provides an excellent experience with reduced in-game VR settings. At almost one-third faster, the GTX 1070 provides a higher level of detail than the GTX 1060, while the GTX 1080 can provide mostly a maxed-out VR experience. For the ultimate VR experience, a GTX 1080 Ti or a TITAN XP usually provides enough performance headroom to increase the pixel density further, providing an even more immersive experience.
The GeForce Experience is the second part of the VRWorks experience which when installed will automatically deliver the very latest drivers to the end user. It is crucial to use drivers that have been optimized for VR games as we discovered with Star Trek: Bridge Crew.
Here is VRWorks for headset developers from NVIDIA’s website: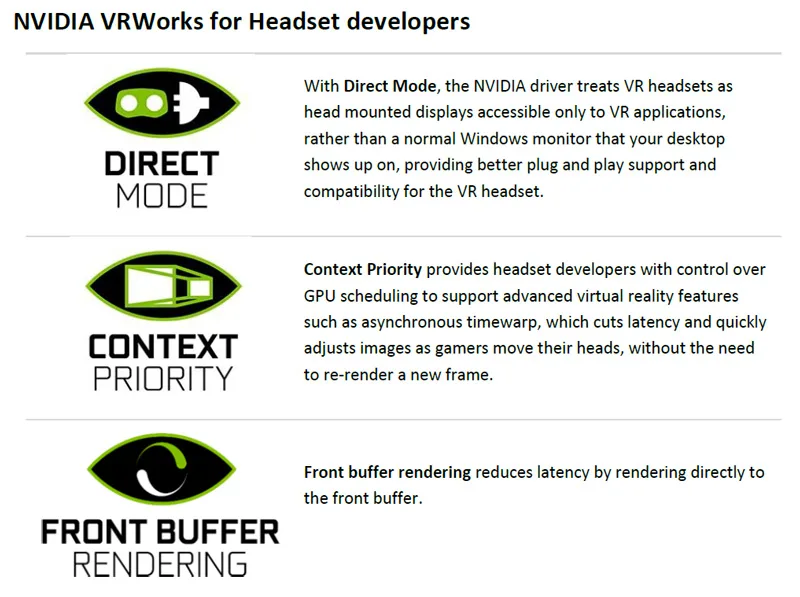
Direct Mode hides the display from the OS, preventing the desktop from extending onto the VR headset although VR apps however can still see the desktop and render to it. Front buffer rendering enable direct access to the front buffer. Context Priority allows for two priority levels for work – the normal priority that handles all the usual rendering, and a high-priority context that can be used for asynchronous time warp (ATW) . ATW is basically a synthetic frame reprojection “safety net” similar to Oculus’ asynchronous space warp (ASW) when the goal of rendering at or above 90 fps can not be met.
Here is VRWorks for app developers:
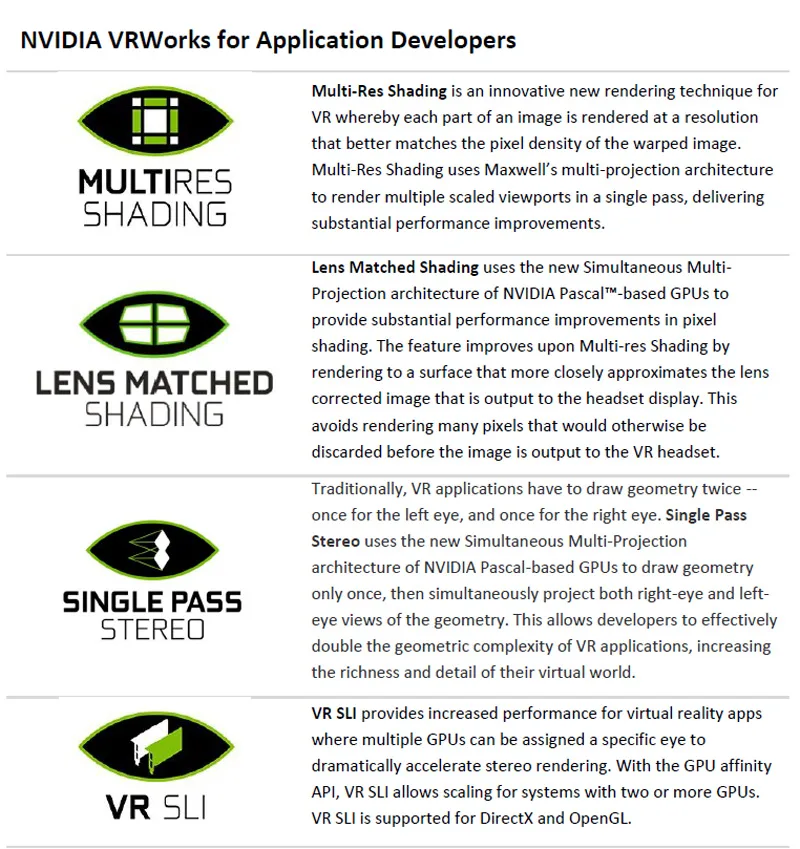
VR SLI isn’t particularly well-supported by developers yet as only a few games have it available. In a follow-up to this evaluation, we will measure the performance of VR SLI with Serious Sam: The Last Hope which supports VR SLI. VR has two views to render and devoting one GPU to each eye will nearly double performance, without the latency associated with AFR. Although the system generates a single command stream, affinity masking decides which states apply to each GPU in VR SLI. For VR SLI to work, it needs to be part of the game engine, and it’s up to the developer to implement it. Unity and Unreal engines both support VR SLI. Although work duplication including rendering shadow maps and physics will reduce performance down from doubling one GPU, VR SLI can still give a major boost
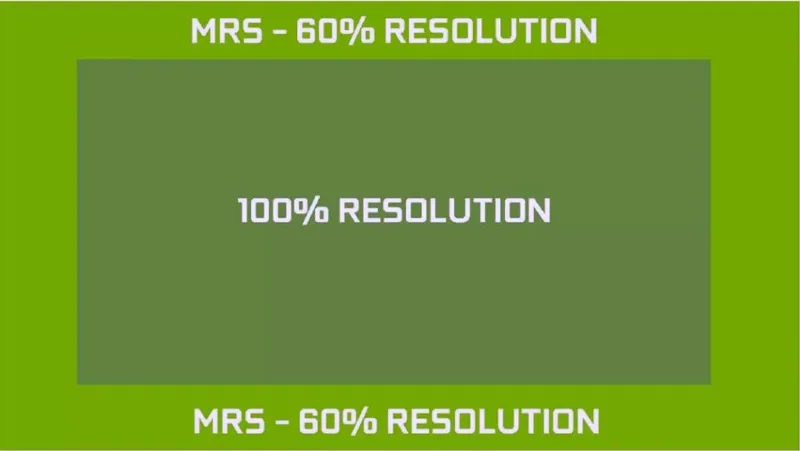
NVIDIA also uses Multi-Resolution Shading (MRS), a Pascal feature that AMD doesn’t have. MRS features viewport multicasting, or multi-projection acceleration which was also implemented in the PC version of Shadow Warrior 2. Multi-Res Shading (MRS) refers to a multiple resolution shading technology which was created by NVIDIA. MRS works to increase a game’s overall performance by rendering the outer edges of the screen at a lower percentage of the basic screen resolution.
MRS causes the center of the screen to retain full image quality, and it works particularly well with action PC games and also with VR as players are mostly focused on the center of the display. NVIDIA’s image below illustrates what MRS does when it is enabled at 60% of the in-game resolution. There are often a couple of levels of MRS available as options – one is more aggressive than the other with the outer area rendered at about 40% of the full resolution, but it also delivers more performance.
Multi-Res Shading helps reduce rendering cost and it improves performance without impacting perceived image quality by using Pascal’s (and Maxwell’s) hardware-based multi-projection feature. The screen is divided into multiple viewports, and, the entire scene geometry is broadcast to each viewport simultaneously while extraneous geometry is culled. This has to be done because the lenses of the Oculus Rift HMD distort the image presented on a virtual reality headset which has to be warped to counteract the optical effects of the lenses. Instead of being square, the images appear curved and distorted until viewed through appropriate lenses.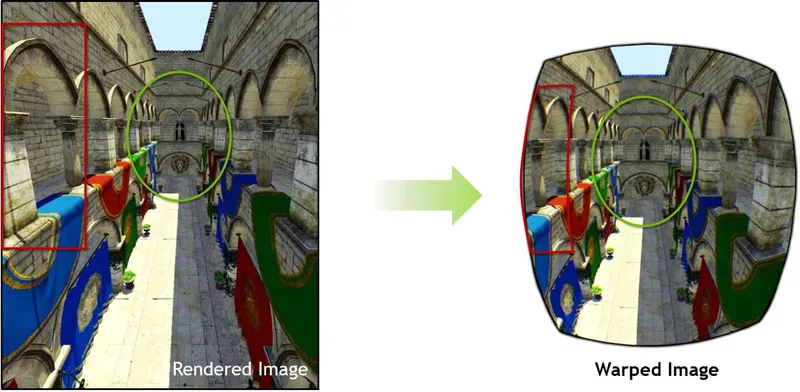
Current VR platforms use a two-step process that first renders a normal image (above left) and afterward uses a post-processing pass that warps the image to the view (above right, above from NVIDIA’s example). This solution is considered inefficient by NVIDIA because there is oversampling at the edges and many rendered pixels are wastefully discarded. Their solution is to divide the viewport into nine divisions as below:
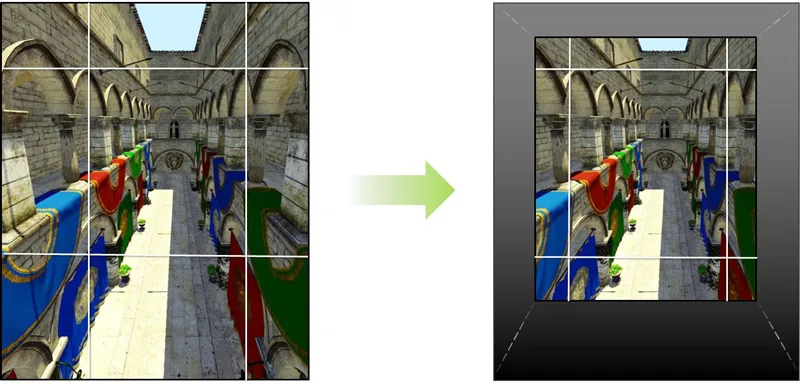
Each of the divided viewports are then warped so that the maximum sampling resolution needed within each portion of the image is now closer to what is finally displayed. The center viewport is also warped and it stays nearly the same but without overshading. Since fewer pixels are shaded, the rendering is quicker with savings translating into a 1.3x to 2x pixel shading speedup according to NVIDIA depending on the MRS level setting.
Since MRS reduces the rendering cost of VR games, the in-game VR quality settings can be increased. Make sure to check out the performance testing that we carried out in Batman Arkham VR which compares the performance of using MRS without using MRS and also versus “Fix Foviated” which is the Warner Brothers VR dev’s solution to improving performance without impacting image quality too negatively.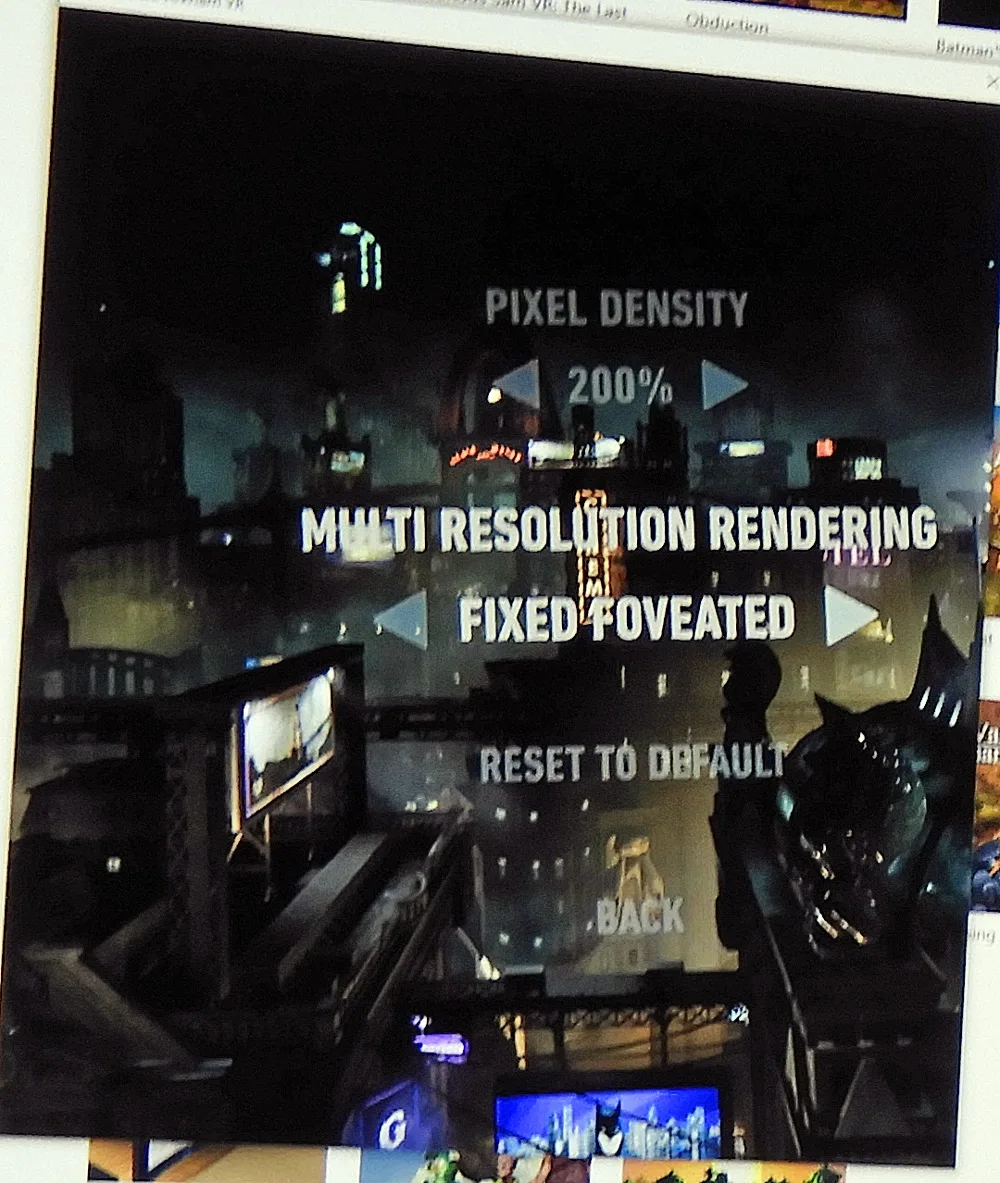
This same Simultaneous Multi-Projection architecture of NVIDIA Pascal-based GPUs that uses MRS also created two major new techniques for tackling the unique performance challenges VR creates: Lens Matched Shading and Single Pass Stereo.
Lens Matched Shading improves pixel shading performance by rendering better to the unique requirements of VR display output. This avoids rendering many pixels that would otherwise be discarded before the image is output to the VR headset. Because VR displays have a lens between the viewer and the display which bends and distorts the image, it has to be rendered with a special projection that inverts the distortion of the lens to look natural to the viewer because the two distortions cancel each other out. Producing a correct final image with pre-Maxwell GPUs requires two steps—first, the GPU must render with a standard projection, generating more pixels than needed. Second, for each pixel location in the output display surface, look up a pixel value from the rendered result from the first step to apply to the display surface.
With Lens Matched Shading, the SMP engine subdivides the display region into four quadrants, with each quadrant applying its own projection plane. The parameters can be adjusted to approximate the shape of the lens distortion as closely as possible with a significant reduction in shading rate that translates to a 50% increase in throughput available for pixel shading according to NVIDIA. And developers have the option to use settings that use a higher resolution in the center and are undersampled in the outer edges, to maximize frame rate without degrading the image quality significantly.
Single Pass Stereo increases geometry performance by allowing the HMD’s left and right displays to share a single geometry pass. Traditionally, VR applications have to draw geometry twice,once for each eye. Since Single Pass Stereo uses SMP to draw geometry only once, and then simultaneously project both views of the geometry, it allows developers to nearly double the geometric complexity of VR games using it.
There is much more to NVIDIA’s VRWorks including a physics-based audio solution. Both Oculus and Vive are working closely with NVIDIA, and Unreal Engine 4 and Unity Engine 5 already have integrated VRWorks support and quite a few of the latest VR games make use of these engines and VRWorks.
LiquidVR Overview
Just like with NVIDIA’s SDK, LiquidVR aims to reduce latency to deliver a consistent frame rate. AMD’s VR technology delivers several key benefits that make this possible:
All of these technologies are supported via AMD’s GPUOpen initiative and developers may modify the code as they wish. They basically accomplish the same thing as NVIDIA’s VRWorks SDK (with the exception of multi-projection like MRS) – to deliver frames smoothly and efficiently to the VR gamer. For AMD, the biggest difference is their Asynchronous Compute Engine (ACE), or use of async shaders which provide flexibility to command scheduling with the ability to run both compute and graphics work simultaneously.
AMD’s use of async shaders make it easier and more efficient to do certain VR tasks including implementing ATW to reduce latency. VR needs to sustain a fixed framerate target locked to 90 FPS. And if a PC can’t meet that target, the frame rate is halved to 45 FPS to make sure that there is no judder causing motion sickness. 90Hz/90 FPS is the premium experience standard for the Rift and the Vive. A game cannot exceed 90 FPS otherwise the player will see tearing in the HMD and feel sick. And a game cannot drop below or vary from a locked framerate or the player will get VR sick. So it is crucial that framerates are locked to either 45 FPS or to 90 FPS.
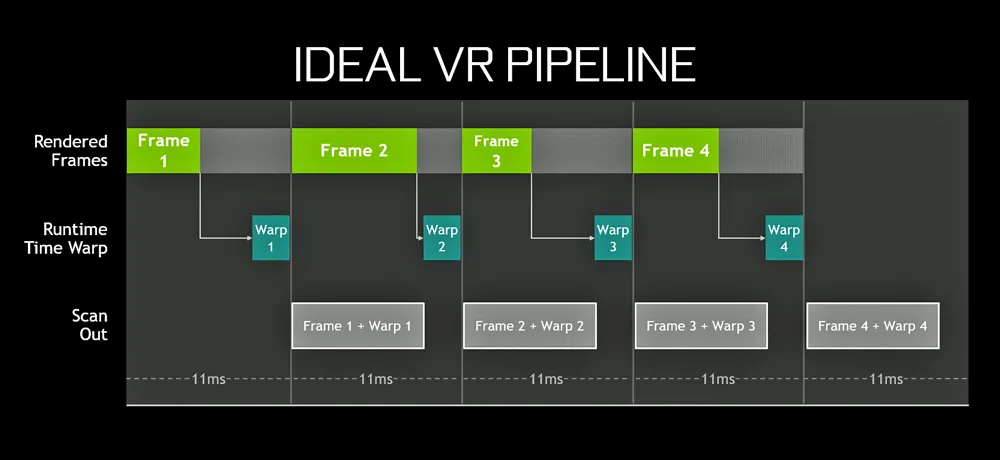
Although the next 4 images are from NVIDIA they represent the way the VR pipeline works and what happens when timing goes off. The first image below represents an ideal VR pipeline for a premium experience where no frames need to be synthesized at 90 FPS.
If a frame gets missed, this is what the pipeline looks like. Whenever a frame arrives too late to be displayed, a Frame Drop occurs and causes the game to stutter. An occasional drop is meaningless, but if there are several, the user will notice. And if there are a lot of dropped frames, the VR experienced will be ruined and the viewer may get VR sick.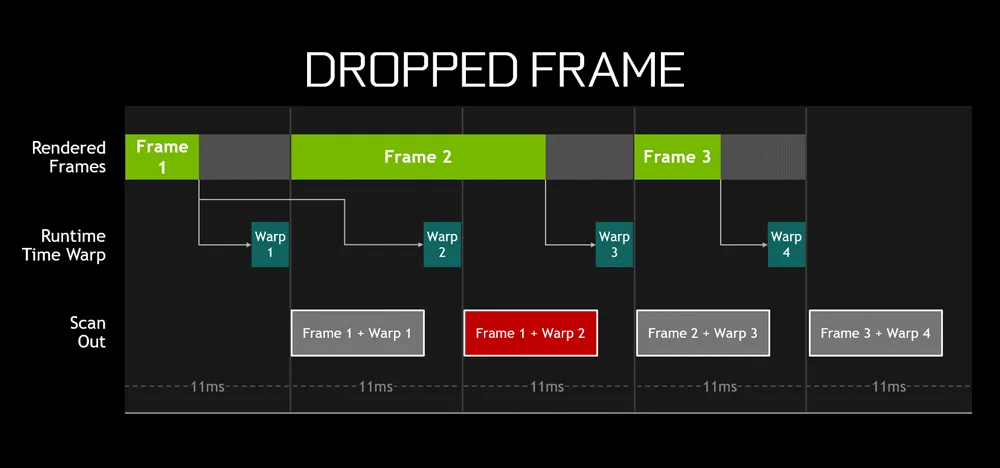
When playing a game in the Oculus Rift, if you see performance locked at 45 FPS, you are no doubt running with Asynchronous Space Warp (ASW). In the Oculus runtime, ASW does motion prediction by inserting a synthetic frame, every other frame. With ASW the cadence looks something like this:
Frame 0: Frame created by the GPU
Frame 1: Frame synthesized by ASW
Frame 2: Frame created by the GPU
Frame 3: Frame synthesized by ASW
Frame 4: Frame created by the GPU … and so on.
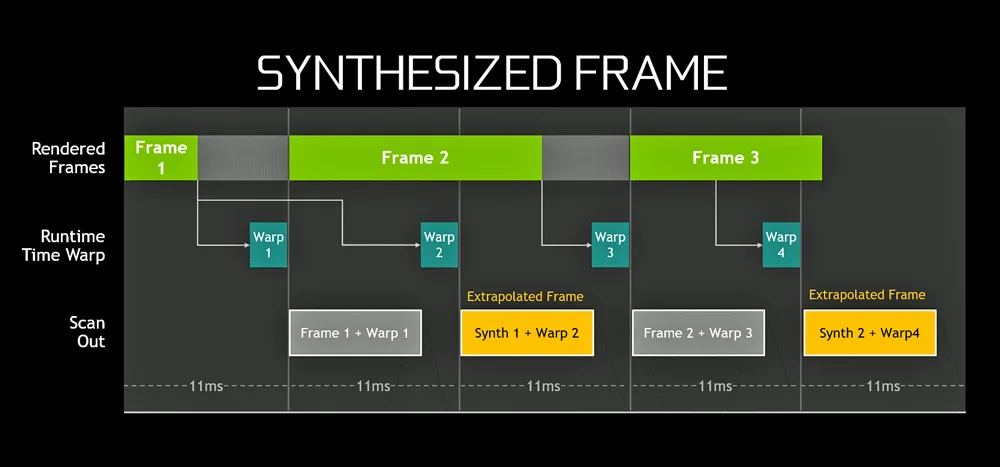
ASW and ATW use a type of reprojection which uses the most recent head sensor location information to adjust the old frame to match the current head position. It won’t improve the animation of a frame which will still have a lower frame rate and some judder, but reprojection provides a more stable visual experience that tracks better with a gamer’s head motion.
Even though there is a downgraded visual experience with 45 FPS compared with 90 FPS, it is better to have ASW than not to have it. If the framerates cannot be locked at 90 FPS and did not drop to a locked on 45 FPS, then frames will be dropped and the resulting judder will result in unease and/or VR sickness. ASW will lock you into 45 FPS if your frame rate is anywhere between 45 and 90 FPS. The lower frame rate is in exchange for a smoother frame delivery.
If you want more details, take a look at the Oculus developer’s blog on ASW as well as Asynchronous Time Warp (ATW). These compromises work together to help improve smoothness, but ASW comes at a cost of reduced image quality due to synthesized and extrapolated frames which are also sometimes called “reprojection”.
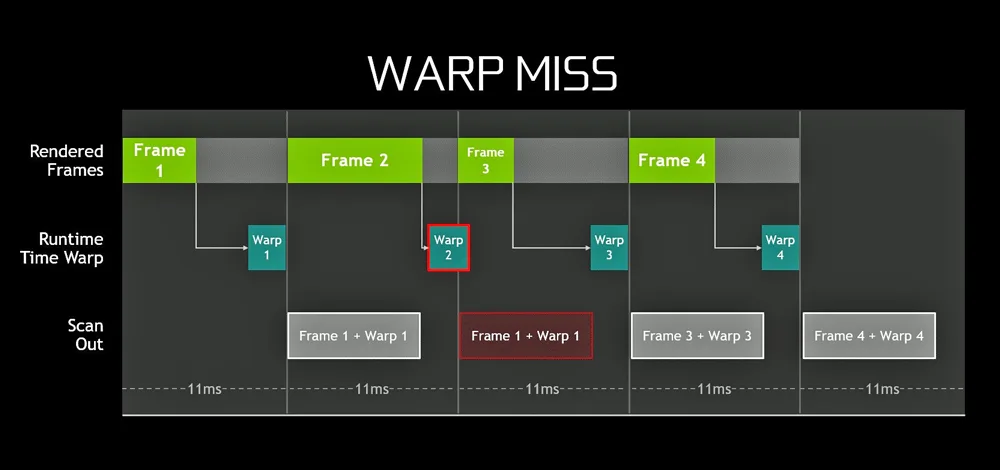
The worst thing that can happen is a warp miss. A warp miss occurs when the runtime fails to produce a new or a reprojected frame in time. In the following image by NVIDIA, an earlier warped frame is repeated by the GPU. The VR user will notice this repeated frame as an immersion-breaking stutter and if there are many of them, he may get ill.
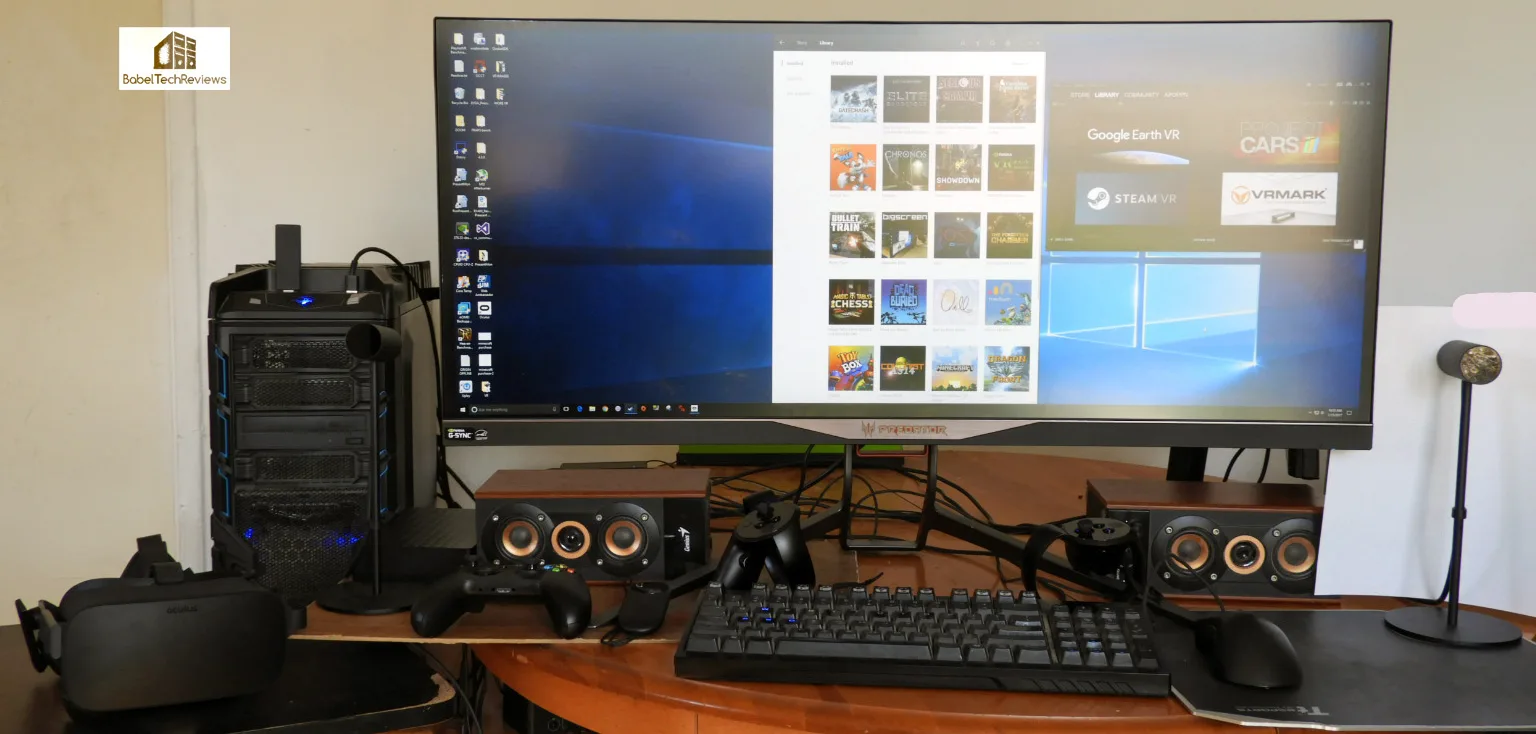
Test Configuration – Hardware
- Intel Core i7-6700K (reference 4.0GHz, HyperThreading and Turbo boost is on to 4.6GHz; DX11 CPU graphics)
- ASRock Z170M OC Formula motherboard (Intel Z170 chipset, latest BIOS, PCIe 3.0/3.1 specification, CrossFire/SLI 8x+8x)
- HyperX 16GB DDR4 (2x8GB, dual channel at 3333MHz), supplied by Kingston
- Oculus Rift including Touch Controllers.
- GTX 1080 Ti, reference clocks, supplied by NVIDIA
- GTX 1080, 8GB, Founders Edition, reference clocks, supplied by NVIDIA
- GTX 1070, 8GB, Founders Edition, reference clocks, supplied by NVIDIA
- EVGA GeForce GTX 1060 SC 6GB, at EVGA clocks, supplied by EVGA
- Fury X, 4GB, reference clocks
- MSI G1 Gaming RX 480, 8GB, at RX 580 reference clocks.
- Two 2TB Toshiba 7200 rpm HDDs for each platform
- EVGA 1000G 1000W power supply unit
- Corsair H60 Watercooler
- Onboard Realtek Audio
- Genius SP-D150 speakers, supplied by Genius
- Thermaltake Overseer RX-I full tower case, supplied by Thermaltake
- ASUS 12X Blu-ray writer
- Monoprice Crystal Pro 4K display
- ACER Predator X34, GSYNC display, supplied by NVIDIA/ACER
- Nikon B700 digital camera
Test Configuration – Software
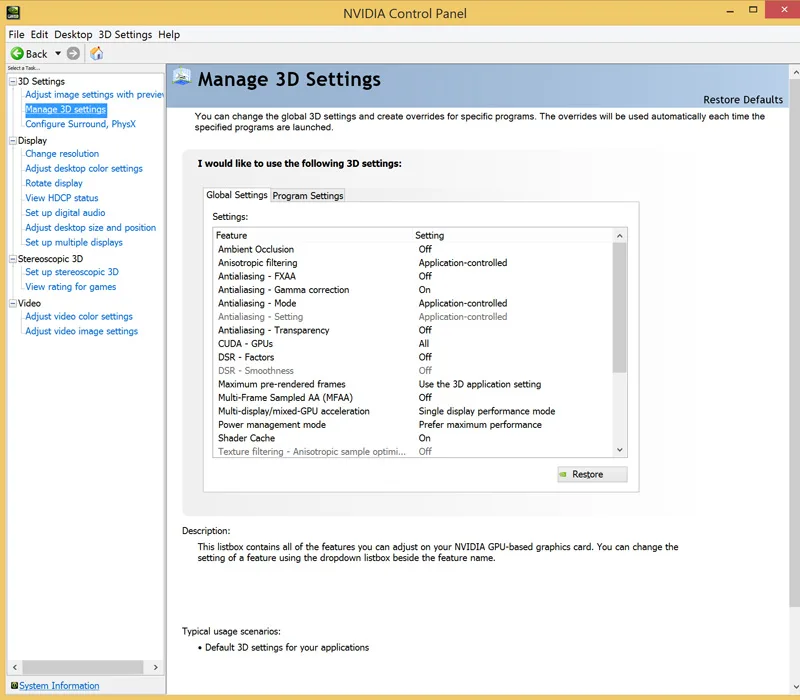
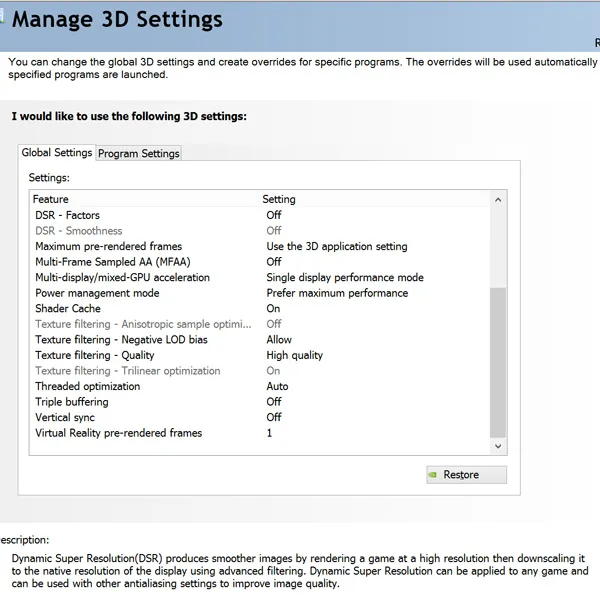
- NVIDIA’s GeForce WHQL 382.33. High Quality, prefer maximum performance, single display.
- AMD Crimson Software ReLive 15.5.3 hotfix
- VSync/GSYNC are off in the control panel.
- FCAT VR benchmarking tools
- Oculus Rift Diagnostic tools
- Highest quality sound (stereo) used in all games.
- Windows 10 64-bit Home edition, all VR hardware was run under Oculus Rift software. Latest DirectX
- All applications are patched to their latest versions at time of publication.
- Sapphire TriXX was used for AMD cards.
- MSI’s Afterburner, latest beta, was used for NVIDIA cards.
Synthetic VR Benches
- VRMark
- SteamVR
VR Games & Apps
- Showdown
- Alice VR
- Batman Arkham VR
- Chronos
- DiRT: Rally
- Robo Recall
- Serious Sam: The Last Hope VR
NVIDIA Control Panel settings
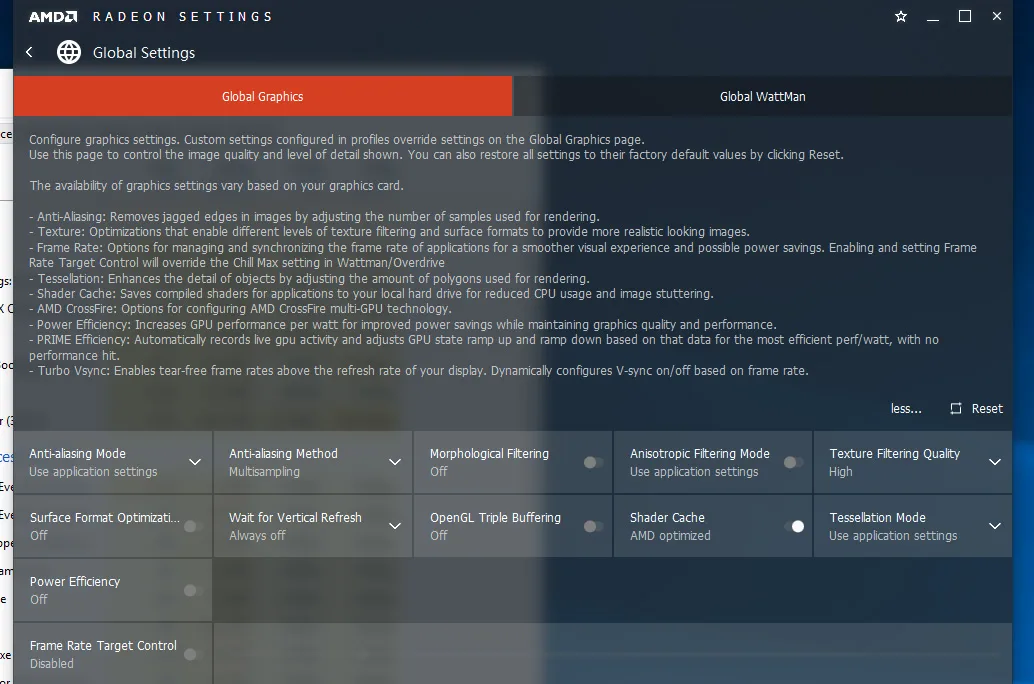
AMD ReLive Radeon Settings
Power Limit/Temperature targets are set to maximum by Afterburner.
Let’s see how we will use FCAT VR together with video benchmarking to measure VR game performance across competing video cards.
Benchmarking Oculus Rift games
As we have seen, benchmarking VR is quite complex and Fraps won’t do at all. Even more complicated is the fact that VR needs to sustain a fixed framerate target locked to 90 FPS. And if a PC can’t meet that target, the frame rate is halved to 45 FPS to make sure that there is no judder or stutter causing motion sickness. Since there is a lack of logging ability in the Oculus toolset, once cannot log or keep a record of the framerates at any given point with the Oculus SDK and this is why up until now, most VR performance reviews are subjective.
Fortunately, the latest Oculus software now includes an overlay originally in the SDK for developers which any user can enable to see framerates in the HMD as an overlay while the application or the game is playing. To use the OculusDebugTool, go to the diagnostics tools in the Oculus files. C:>Program Files>Oculus>Support>oculus-diagnostics
Open OculusDebugTool.exe and next to “Visible HUD” select Performance to see the overlay inside of your HMD. You’ll see a graph and a framerate that are reported by the Oculus Rift runtime. This is the tool that the devs use when developing applications for the Rift and it is now something that any enthusiast can use to see the performance of any VR application or game that they are playing without downloading the Oculus SDK or any other files.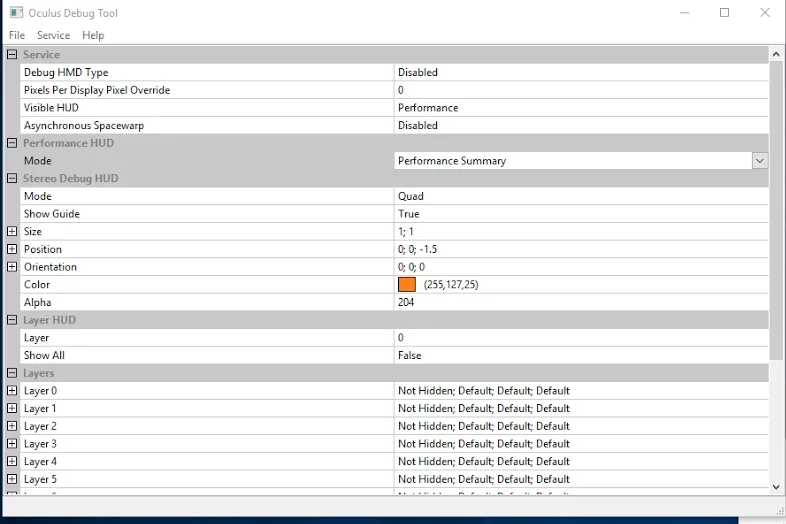
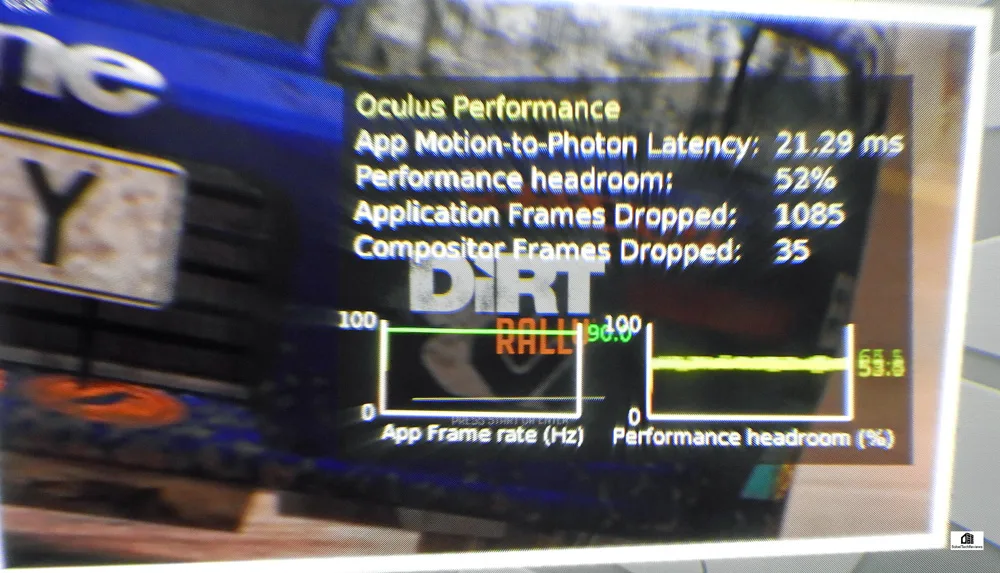
The OculusDebugTool also has Pixel Override which is similar to SuperSampling in a regular PC game. By increasing the Pixels Per Display Pixel Override, one can increase the clarity of the visuals, but at a high cost to performance and it is generally only used for non demanding games or for those with the fastest graphics card. Basically, the lower the latency, the higher the performance headroom, and the less frames dropped the better. So it is easy to compare one video card’s performance with another by viewing the Oculus Performance DeBug tool overlay inside the HUD.
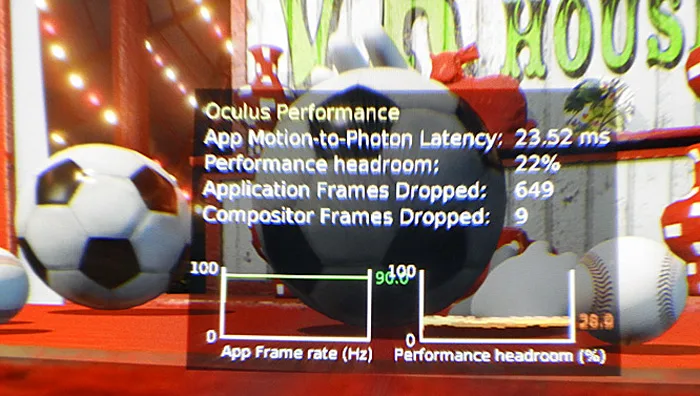
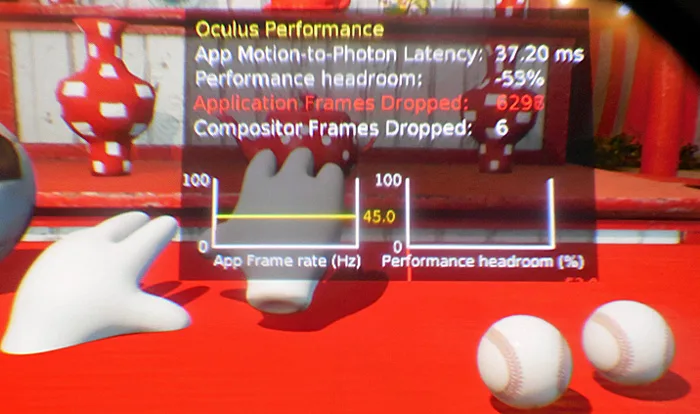
We see an App Motion-to-Photon latency at 23.53 ms which allows the App Frame rate to green-line at the ideal 90 FPS. But below is a similar scene with a GTX 1060 running it at the same settings but with a negative performance headroom at 37.2 ms, and it can barely manage 45 FPS that shows up as a yellow-line.
Unfortunately, Oculus does not include a way to log these framerates like the Vive does. And an issue that often arises between scenes, the Debug performance HUD starts to report performance drops that do not match what is actually seen in the HUD. For example, the Compositor Frames that are dropped with the TITAN XP (2016) happened during the cutscenes. However, when the application or game is actually running, the performance figures are accurate and trustworthy. This is why we set up a digital camera with a super-macro lens to capture video directly from the left lens of the HMD, and one can make note of the settings and dropped frames when the application actually starts and compare with the end results.
In their own labs, NVIDIA uses a HDMI capture card, the Datapath VisionSC-HD4+, that will record VR video, but it evidently requires a lot of setup, a specific HDMI splitter, and a dedicated PCIe SSD to capture video. The capture card runs over $1200 and it comes with a lot of reported setup headaches. This is why we were quite pleased when NVIDIA announced the FCAT VR benching tool in March.
Using a video camera and the Rift’s SDK debugging HUD to support FCAT VR
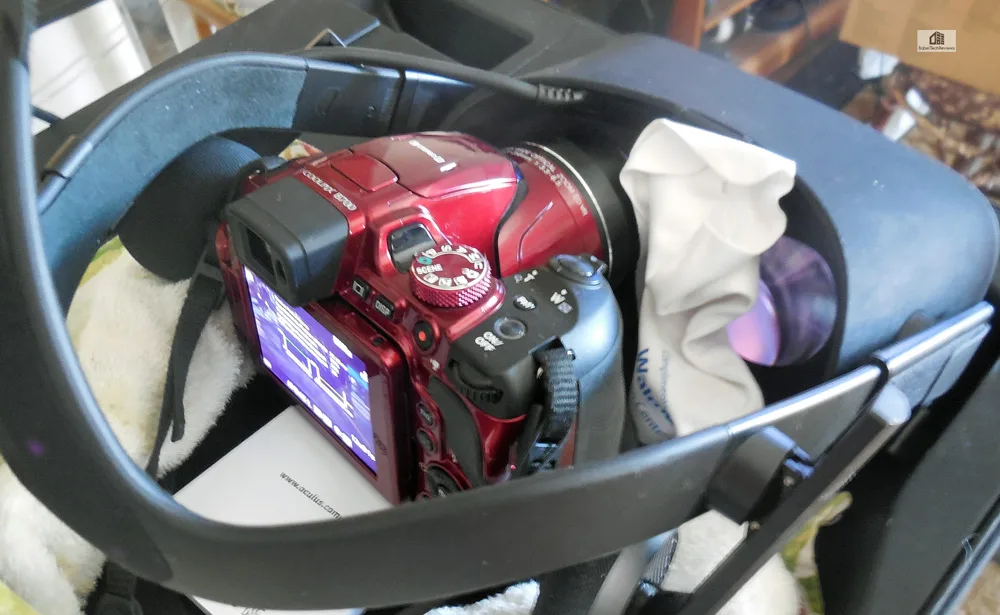
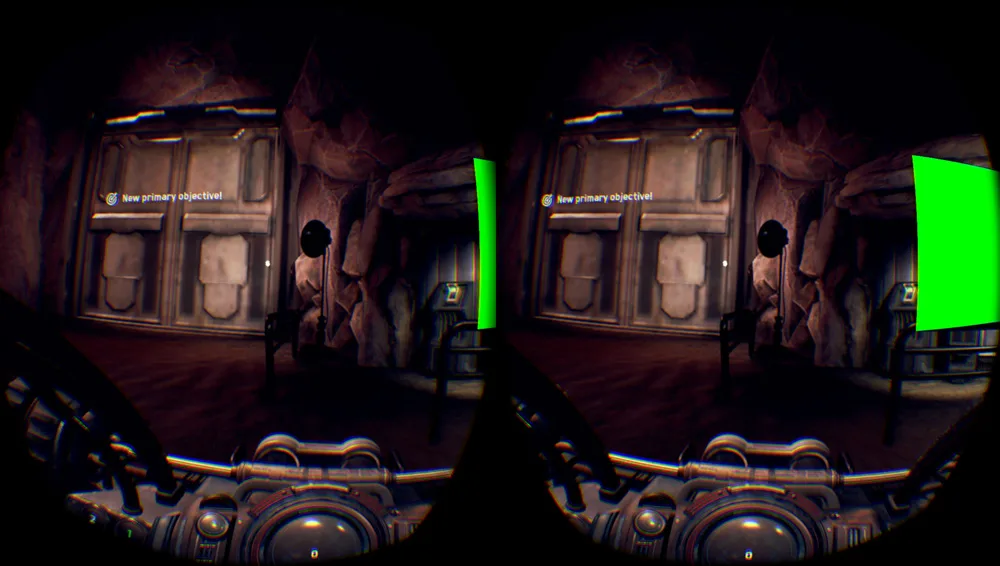
It is possible to use a camera but it must be able to focus close up to a Rift’s lens. To see exactly what the user sees in the HMD one would need a very special wide-angle stereoscopic camera that can focus closely on both lenses simultaneously. Fortunately, for benchmarking purposes, to see the Oculus Performance DeBug Tool overlay, it is only necessary to capture video from the left lens’ HUD overlay as the right lens is a nearly identical experience, just slightly offset for the VR imaging.
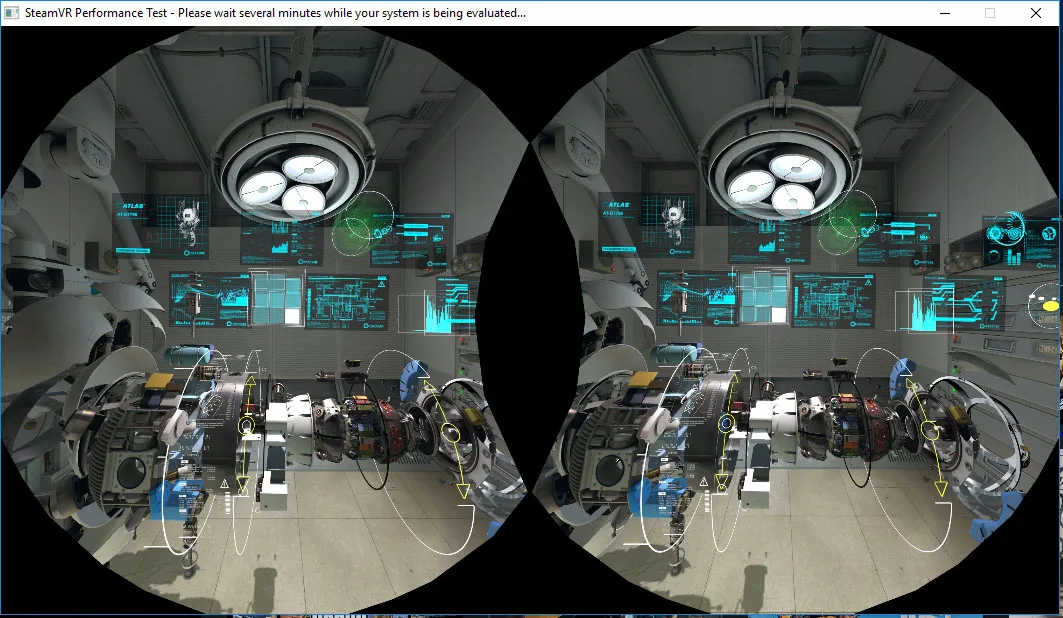
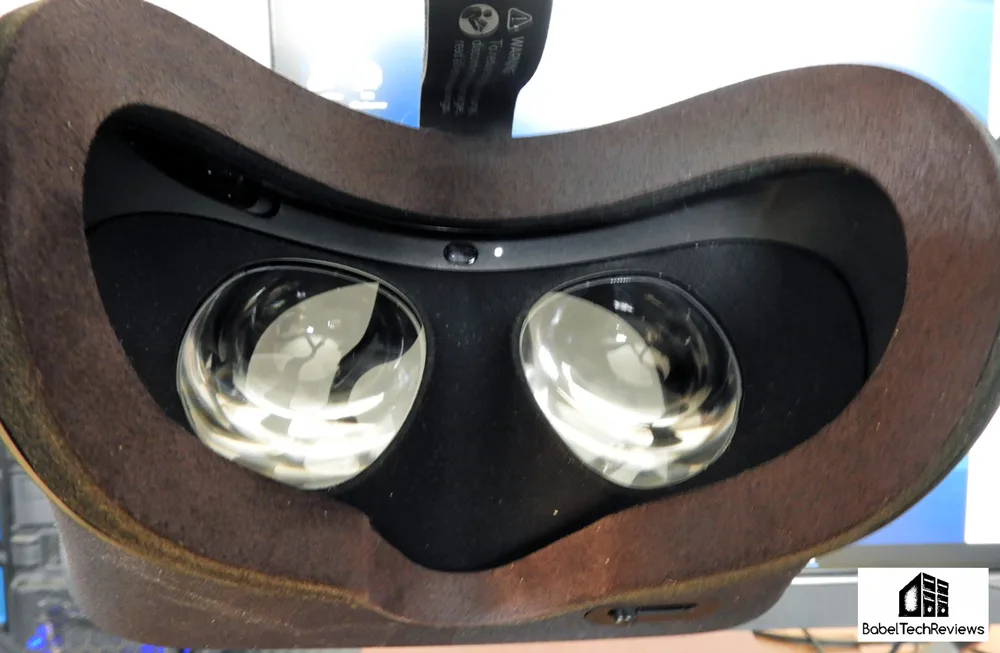 We then recently purchased a Nikon CoolPix B700 that could not only focus to within 1 cm of the Rift’s lens, but it can capture video at 1920×1080 at 60 FPS. Since the Rift refreshes at 90Hz/90 FPS, there are a few issues with tearing in the camera not seen in the HMD, but our main objective is to focus on the Performance DeBug Tool. The camera can capture still images from the eyepiece also as in this capture of Showdown.
 Compare with a screenshot taken from the capture tool built into Obduction.
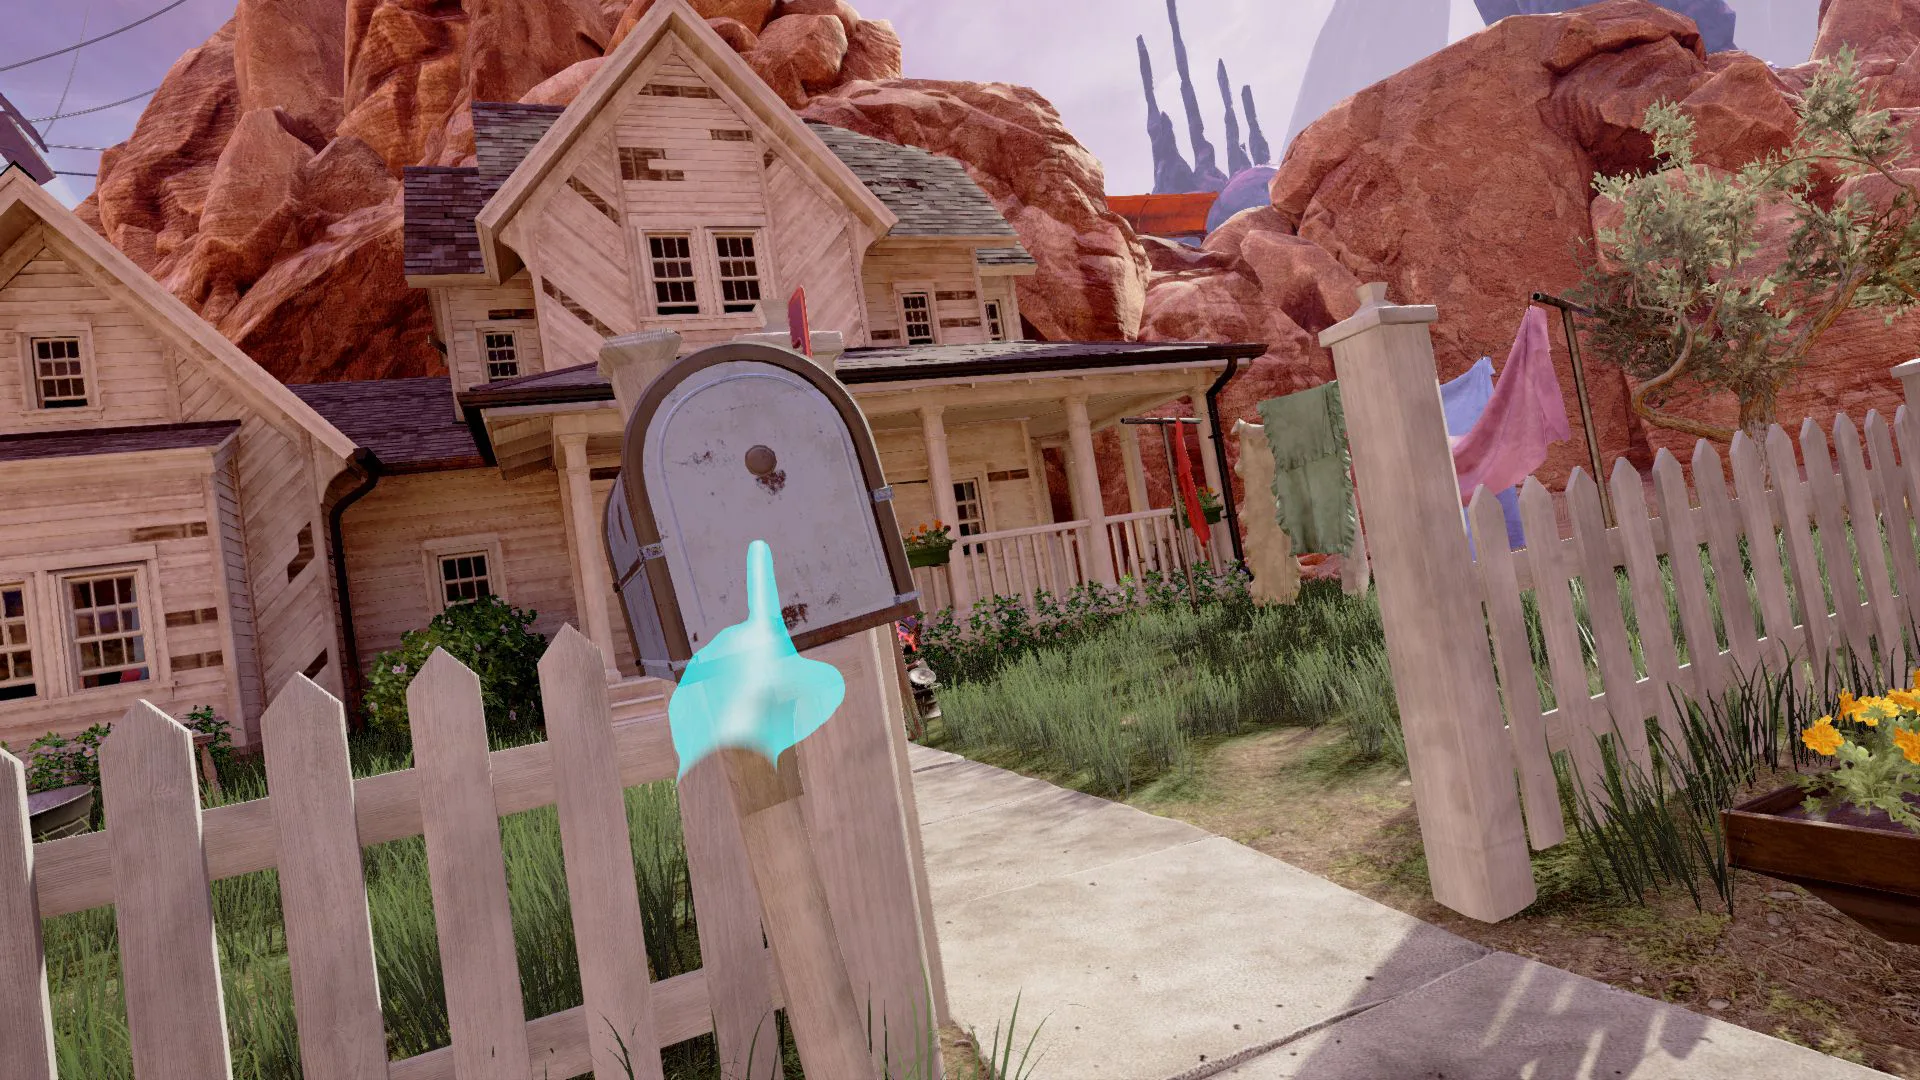 Of course, there is no comparison. However, our captured video and screenshots are good enough to show the benchmark with the Performance DeBug Tool overlay information clearly visible.
 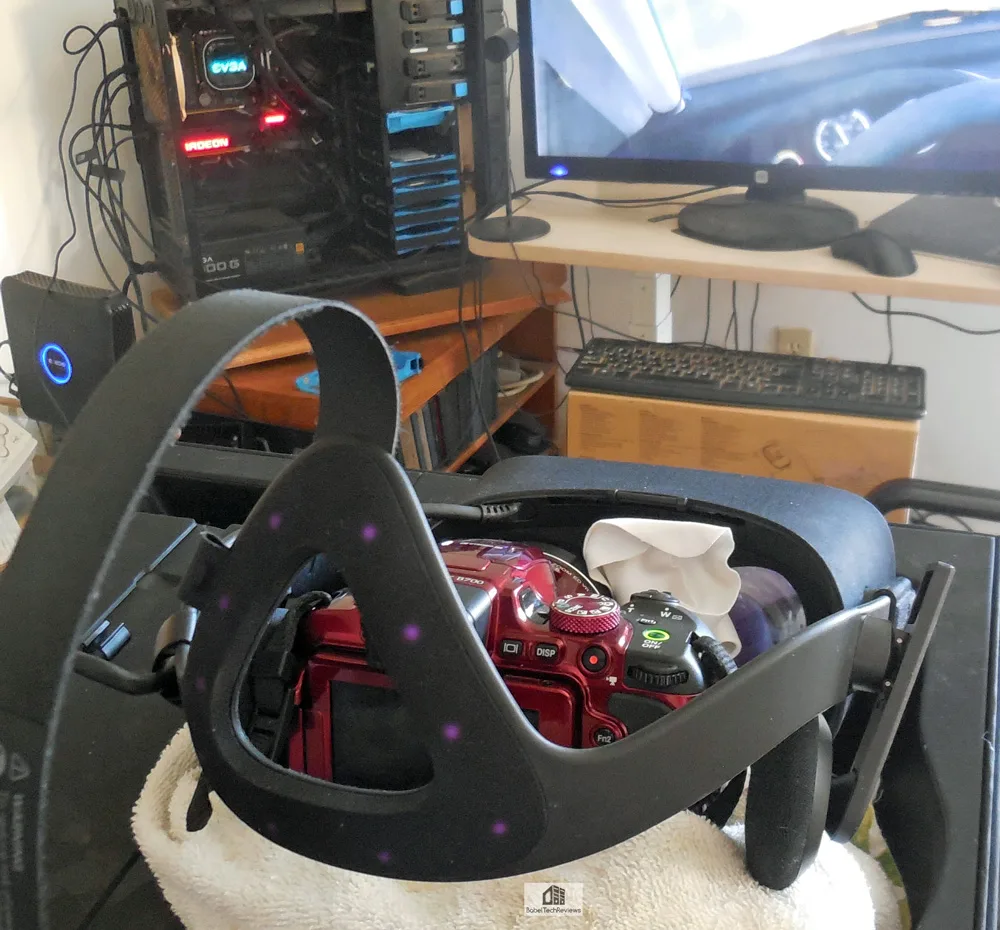 We use a box that holds the Rift and the camera at exactly the right angle and distance from each other at the same height and position that we hold our head to normally game at, and we plan to show video benchmarks in this evaluation so that you can actually see the performance HUD over the game benchmarks as they are running in Showdown to support the charts and graphs that FCAT VR’s Analysis Tool generates.
FCAT VR
The FCAT VR tool was developed by Nvidia to capture data from the HMD of either the Oculus Rift or from the Vive and it logs information directly from the VR runtime. For each frame, FCAT VR can read if a properly rendered frame is shown on the headset, if a frame is dropped, or if the frame is synthetically generated (via Asynchronous Spacewarp), and much more. NVIDIA claims this:
With FCAT VR, we read performance data from NVIDIA driver stats, Event Tracing for Windows (ETW) events for Oculus Rift, and SteamVR’s performance API data for HTC Vive to generate precise VR performance data on all GPUs.
Using this data FCAT VR users can create charts and analyze data for frametimes, dropped frames, runtime warp dropped frames, and Asynchronous Space Warp (ASW) synthesized frames, revealing stutters, interpolation, and the experience received when gaming on any GPU in the tested Virtual Reality game.
FCAT VR will allow us to actually chart the frametimes and compare rendering performance that would otherwise be hidden by Asynchronous SpaceWarp, and it is a lot more convenient than trying to read the data from the debug performance overlay tool as the game is played. Any VR enthusiast using the Oculus Rift or the HTC Vive can read the how-to guide and download this free FCAT VR evaluation tool from NVIDIA for use on any AMD or NVIDIA powered system and generate charts and graphs that show the performance of their system and see exactly how well frames are delivered to the HMD.
NVIDIA also claims:
FCAT VR Capture directly accesses performance information provided by the Oculus runtime logged to ETW. When the hotkey is pressed, FCAT VR Capture captures the required events on the fly, converts these events into readable timestamps, and then logs it to a CSV file.Since The following timestamps are generated today with Oculus:
- App Render Begin
- App Render Completion
- App Miss
- Warp Render Begin
- Warp Render Completion
- Warp Miss
FCAT VR provides detailed timing, it is also measures unconstrained FPS for any VR game. This is probably one of the best features of FCAT VR. By calculating how long it takes to render each frame, FCAT VR measures how quickly the system could have displayed that frame without the fixed 90 Hz refresh cadence. FCAT VR calculates the estimated performance headroom and in this way we can compare relative GPU performance in VR games.
It is probably best to think of VR benchmarking in terms of how often an experience meets or does not meet the 90 FPS standard for a premium VR experience. The more often performance drops below 90 FPS, the worse the experience becomes. Oculus’ invention of ASW (Asynchronous Space Warp – similar to ATW) helps to reduce potential motion sickness by dropping to 45 FPS, but it is a degraded visual experience. Since VR is so personal to each individual’s tolerances, it’s difficult to determine what is or what is not “acceptable”. When the framerates are downgraded to 45 there are some artifacting and ghosting especially of objects in motion because of ASW. This is why it is so important to be able to measure the actual performance of a VR game.
A Note About Benchmmarking
Benching VR is still in its infancy and it is more difficult to get identical benchmark runs than with regular PC gaming using Fraps. However, Repeatable is crucial for VR testing. Often we will see results that are not exactly the same workload. For example, if the benchmarker’s head is in a different position for multiple runs, there will be a slightly different workload on the GPU. This is why we use more runs than we do for PC gaming and it’s important to note that an isolated spike is not significant and is expected in a benchmark run to run variance. Basically, we capture a lot of runs, toss out the outliers, and present the most representative graph.
Here’s an example of a GTX 1080 Ti running Showdown two times – note the slight variation between runs.
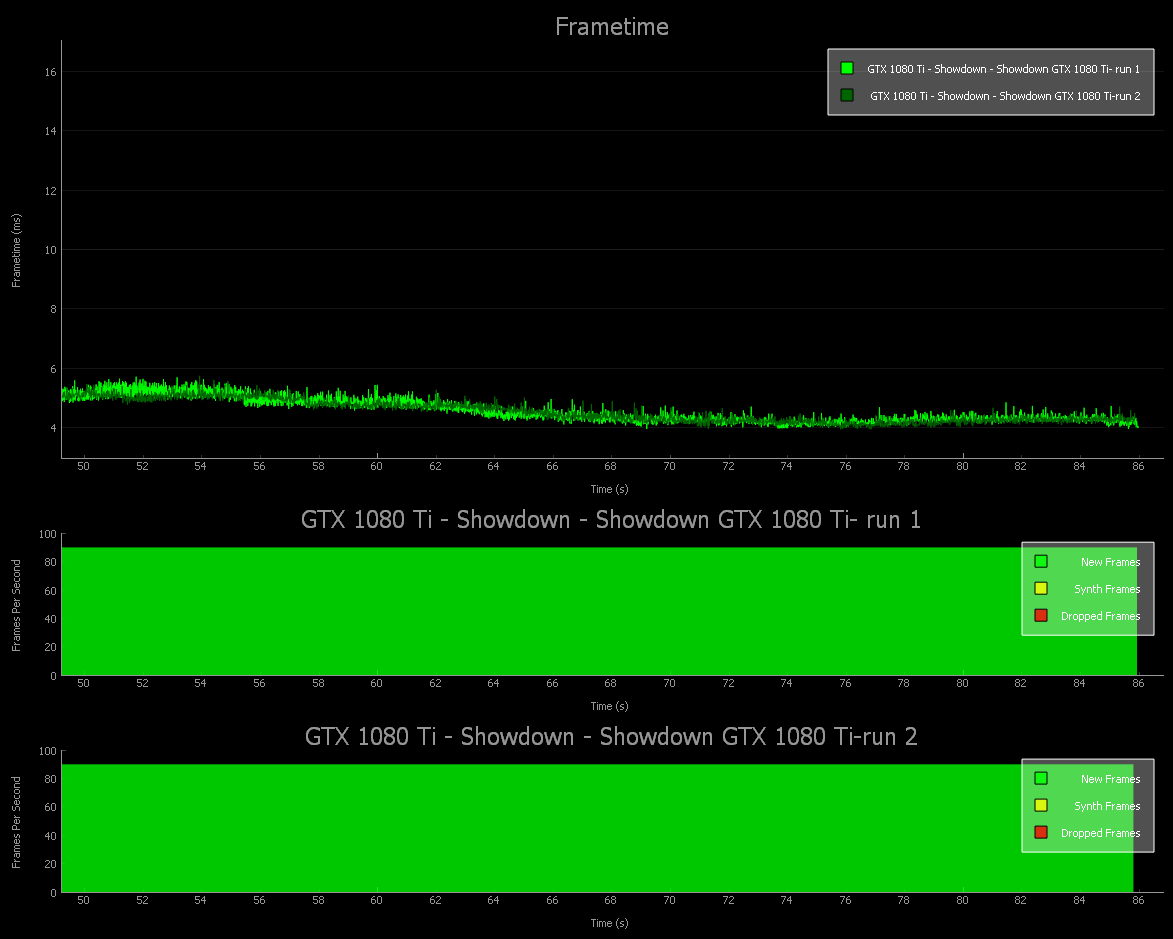
Of course, Showdown isn’t a very demanding benchmark as the unconstrained FPS averages well over 200 as the frametimes are delivered below 6ms.
Let’s compare FCAT VR graphs with the statistics delivered by the Oculus Performance DeBug Tool running in our video benching of Showdown, and then test 5 more VR games with 6 video cards – NVIDIA’s top 4 gaming cards, the GTX 1080 Ti/GTX 1080/GTX 1070/GTX 1060, and with AMD’s top cards, the Fury X and the RX 480 running at RX 580 clocks.
VR Games and Apps benching – synthetic performance
The Oculus Rift is compatible with all software which can be purchased from the Oculus Rift store, as well as Steam VR games that are also optimized for it. There have been reports of some games that show poor performance when running through Steam, but they work just fine if you use the versions available in the Oculus Store. Since Steam has a money back guarantee, there is little risk buying VR games for the Oculus Rift from the Steam Store. Of course, Oculus is ensuring that the builds on their own store work correctly for the Rift HMD and they are updated regularly and automatically by the Store app.
I was unable to determine how Steam VR games get updated/optimized for the Rift. However, all of the games that we have purchased from the Oculus Rift store as well as Steam VR games work very well with our Rift setup. The Vive appears to have more titles available for it than what is available for the Rift although recently there seems to have been an explosion of new VR titles. We currently have about 17 VR games, and we will continue to buy many more VR games for play, review, and for benching.
Synthetic Benches
Steam VR Performance Test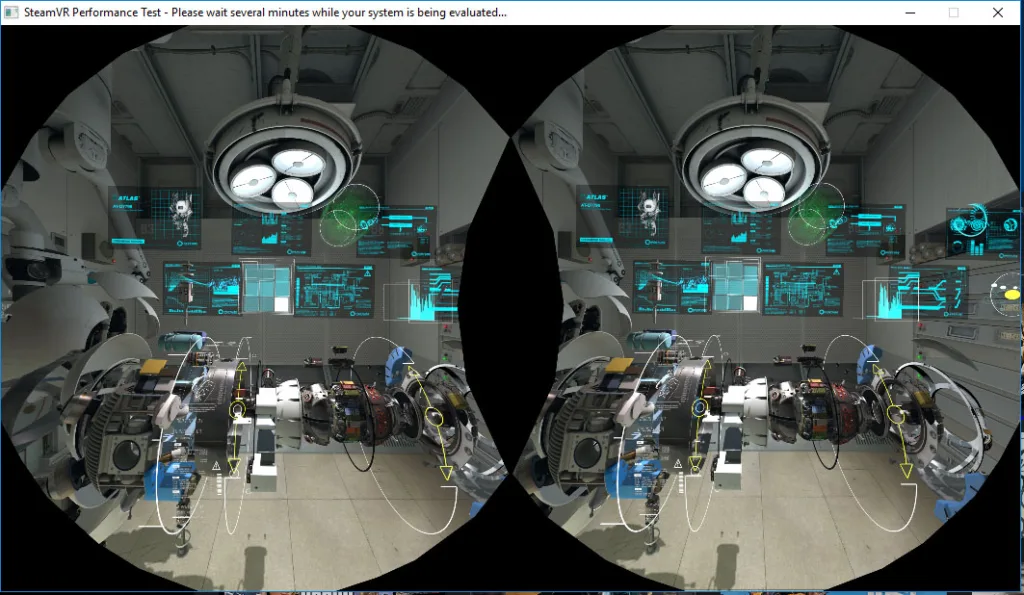
Fortunately there are two synthetic benchmarks that we currently use, and more are available including Superposition from Unigine. Unfortunately, although the Superposition demo runs, the benchmark doesn’t deliver results for us yet. VRScore (Basemark) has a repeatable benchmark that runs in the HMD that appears to be accurate. VRScore also includes an option to enable NVIDIA’s MRS/LMS and we will try to get this benchmark from Basemark for future testing.
Steam has a VR benchmark that tells you if your PC is suited for VR or not, and it gives a rough numerical ranking as it does for the GTX 1080 below.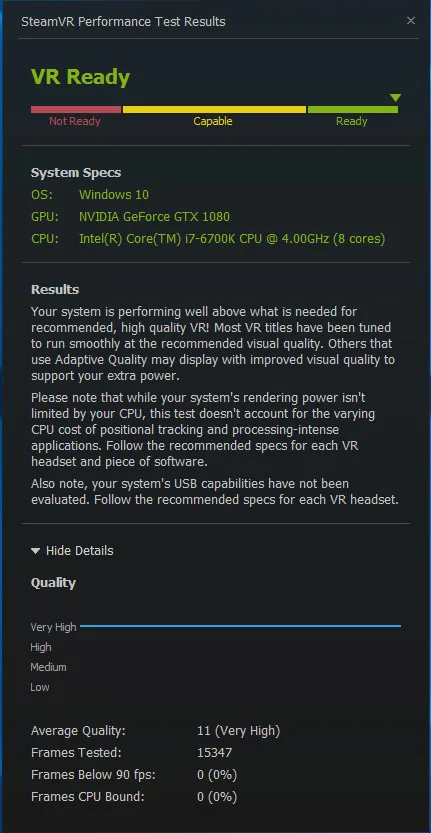
Futuremark’s VRMark
We purchased Futuremark’s VRMark for $7.99 as we wanted a score to compare VR hardware much as we do PC hardware. This is the only other currently available synthetic benchmark available and it gives more detail than Steam’s VR test.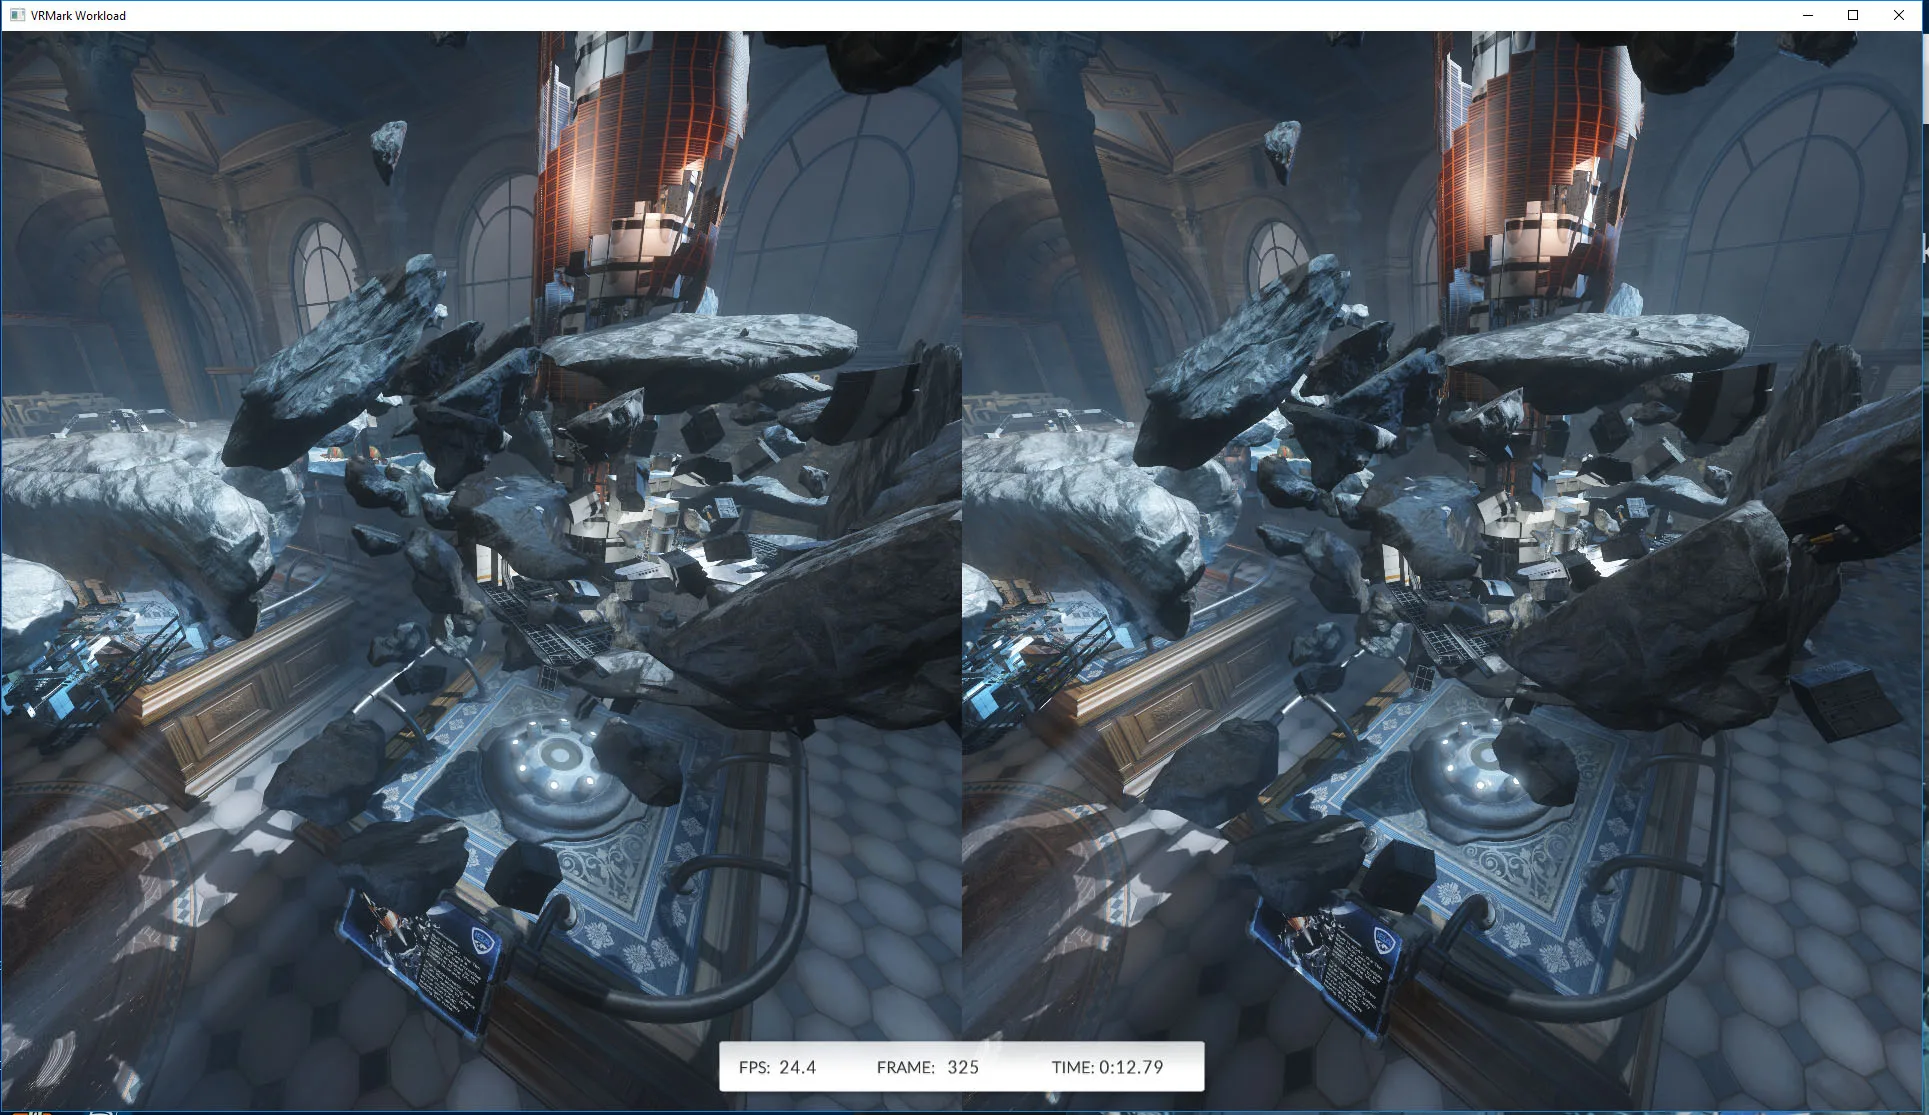
VRMark appears to be an accurate performance evaluation if you run it in the HMD. VRMark includes two benchmarks – the Orange room and the Blue Room. Like the Steam VR test, the Orange room is easy to render and it answers if your PC can run VR. In contrast, the Blue room is a very heavy VR workload and it is much more demanding than any VR game currently available. Both the Orange and the Blue room benchmarks will provide valid results, but the Blue room is intentionally intense and is more forward-looking.
Here is our chart of relative performance using Steam VR and VRMark to rank our tested cards. All of the cards are at reference speeds except for the EVGA GTX 1060 SC which is EVGA factory-overclocked, and we set our Gigabyte G1 RX 480 Gaming Edition clocks to reference RX 580 speeds (1340MHz).
The VR Synthetic Benchmark Chart

We can see that the video cards that we tested are approximately ranked similarly to how powerful they are in playing PC games. Of course, these are synthetic VR benchmarks and we want to see how these same cards perform using FCAT VR and our video benching.
Let’s individually look at the games that we benchmark starting with Showdown and then DiRT: Rally which are the most repeatable benchmarks of the 7 we are attempting.
Showdown
Showdown is not a game, but rather a 2014 Unreal Engine 4 demo by Epic that was the genesis for BulletTrain and finally Robo Recall, one of this editor’s favorite VR games. This demo was incredibly popular at trade shows and is still used for demonstrating what VR can do as there are a lot of effects and interactivity. However, this demo is no longer considered demanding as some of the particle effects appear to be 2D sprites instead of actual 3D geometries, and there are no shadow casting lights (i.e. lighting is “faked”) even though the anti-aliasing is at 4xMSAA.
Although Showdown may be trivial for even a GPU like GTX 1060 or an RX 580 now, it will still show differences in the amount of performance headroom that each GPU has. Here is the professionally captured demo of Showdown in VR as uploaded by Epic.
Of course, our own video capture is taken from the left lens of the HMD and it will not be as clear as Epic’s capture as the lenses provide their own distortion and it also cuts down the viewing area, and in the interest of repeatable benching, we look straight ahead during our benchmarked Showdown runs.
Here is our video Showdown benchmark run by the GTX 1080 Ti.
As you can see there is a lot of performance headroom. Now compare with the FCAT VR frametime graph.

No frames were dropped. 203.3 unconstrained FPS were averaged by the GTX 1080 TI.
Here is our video Showdown benchmark run by the GTX 1080.
As you can see there is a lot of performance headroom also with a GTX 1080. Now compare with the FCAT VR frametime graph.
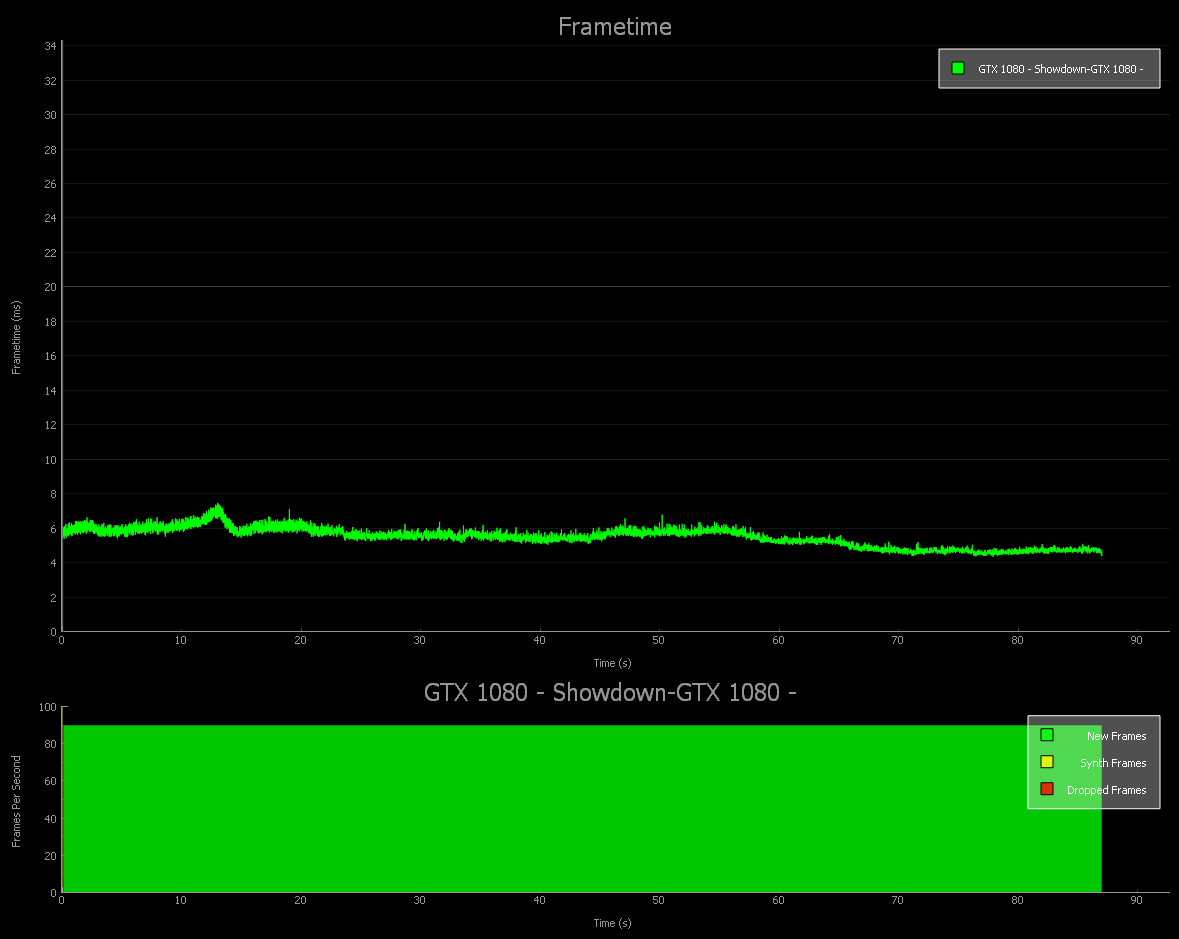
No frames were dropped as the GTX 1080 averaged 182.24 unconstrained FPS.
Here is our video Showdown benchmark run by the GTX 1070.
As you can see there is still decent performance headroom. Now compare with the FCAT VR frametime graph.
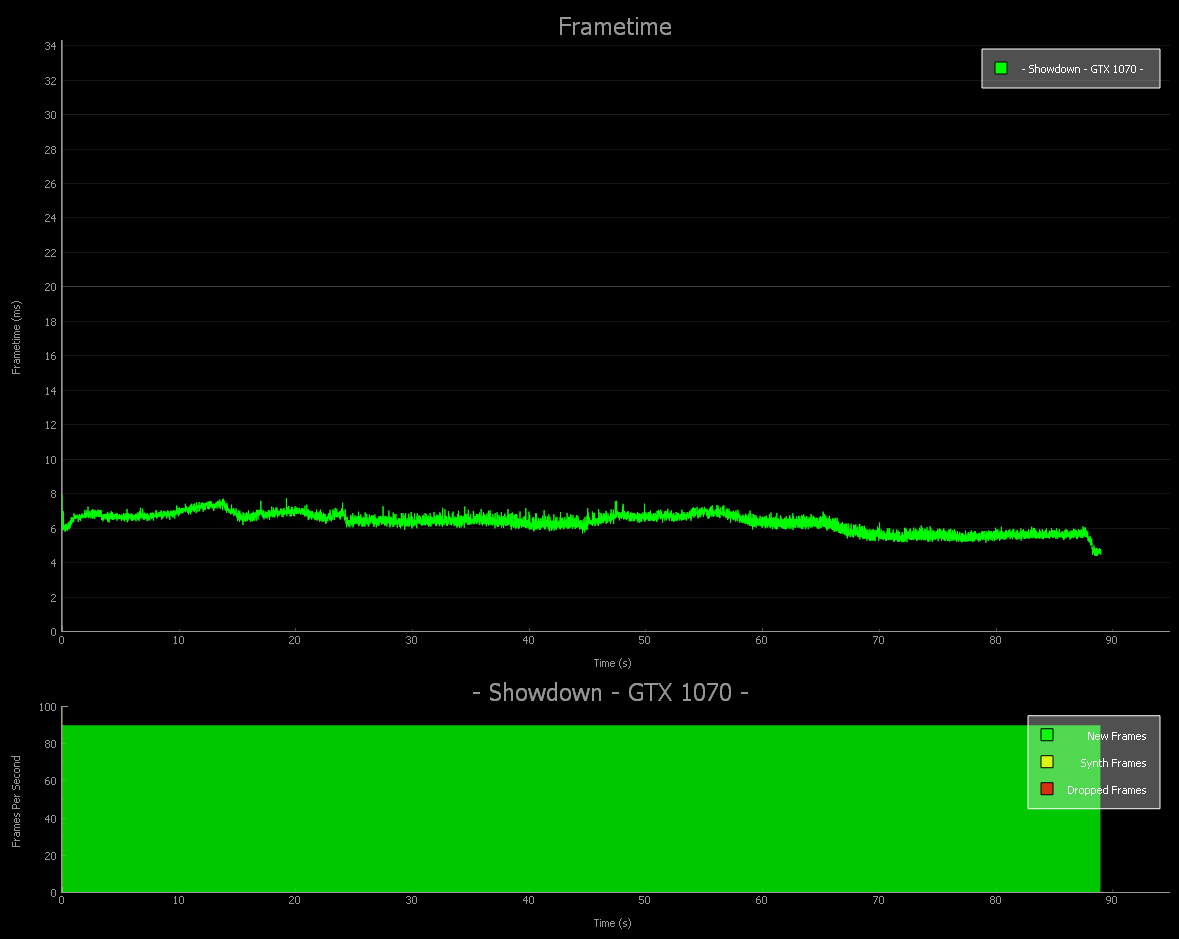
No frames were dropped and the GTX 1070 managed 159.2 unconstrained FPS.
Here is our video Showdown benchmark run by the EVGA GTX 1060 SC.
As you can see there is a lot of performance headroom. Now compare with the FCAT VR frametime graph.
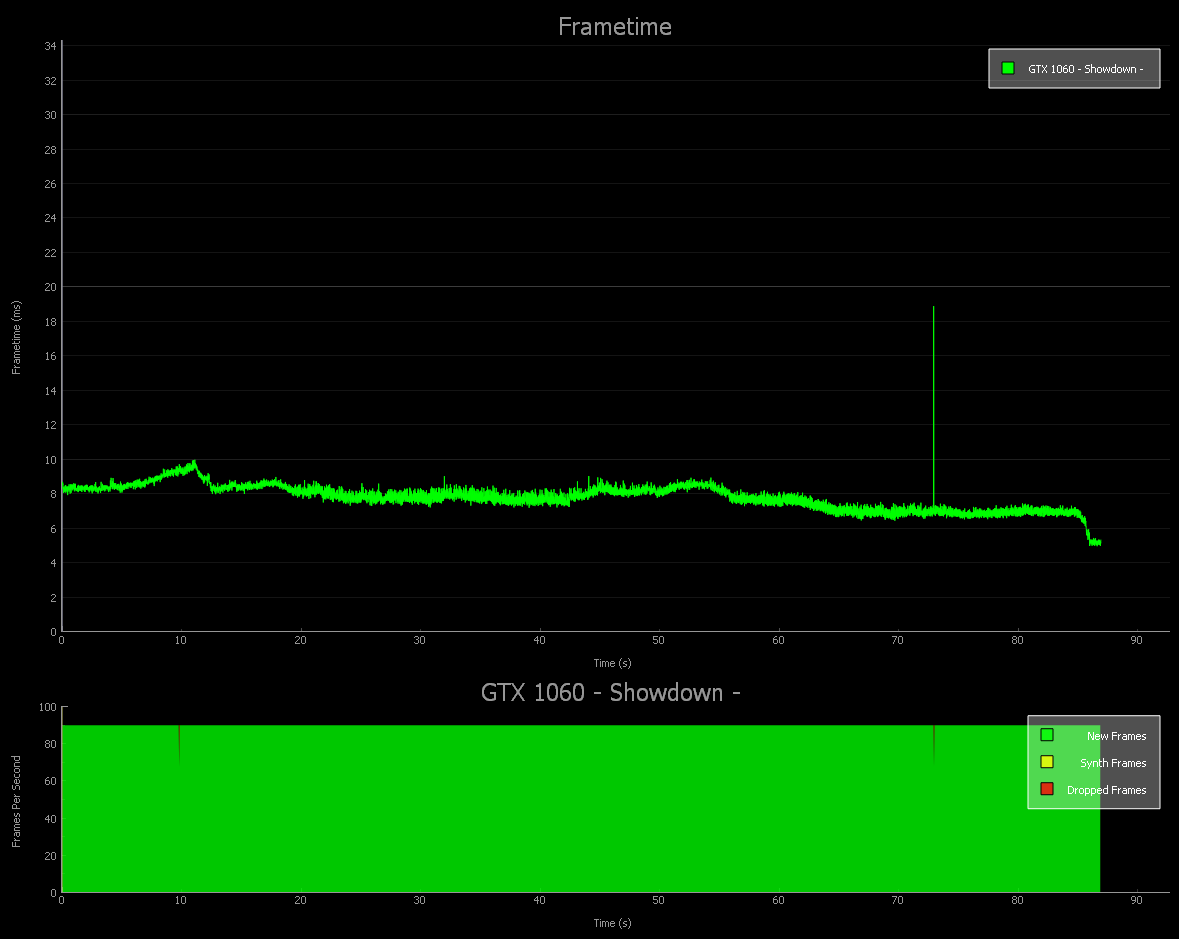
Although two frames were dropped, the GTX 1060 can manage 128.5 unconstrained fps
Here is our video Showdown benchmark run by the FURY X.
As you can see there is still some performance headroom. Now compare with the FCAT VR frametime graph.

Although 3 frames were dropped by Fury X, it manages 124.1 unconstrained FPS
Here is our video Showdown benchmark run by the RX 480 at RX 580 clocks.
As you can see there is a little performance headroom. Now compare with the FCAT VR frametime graph.
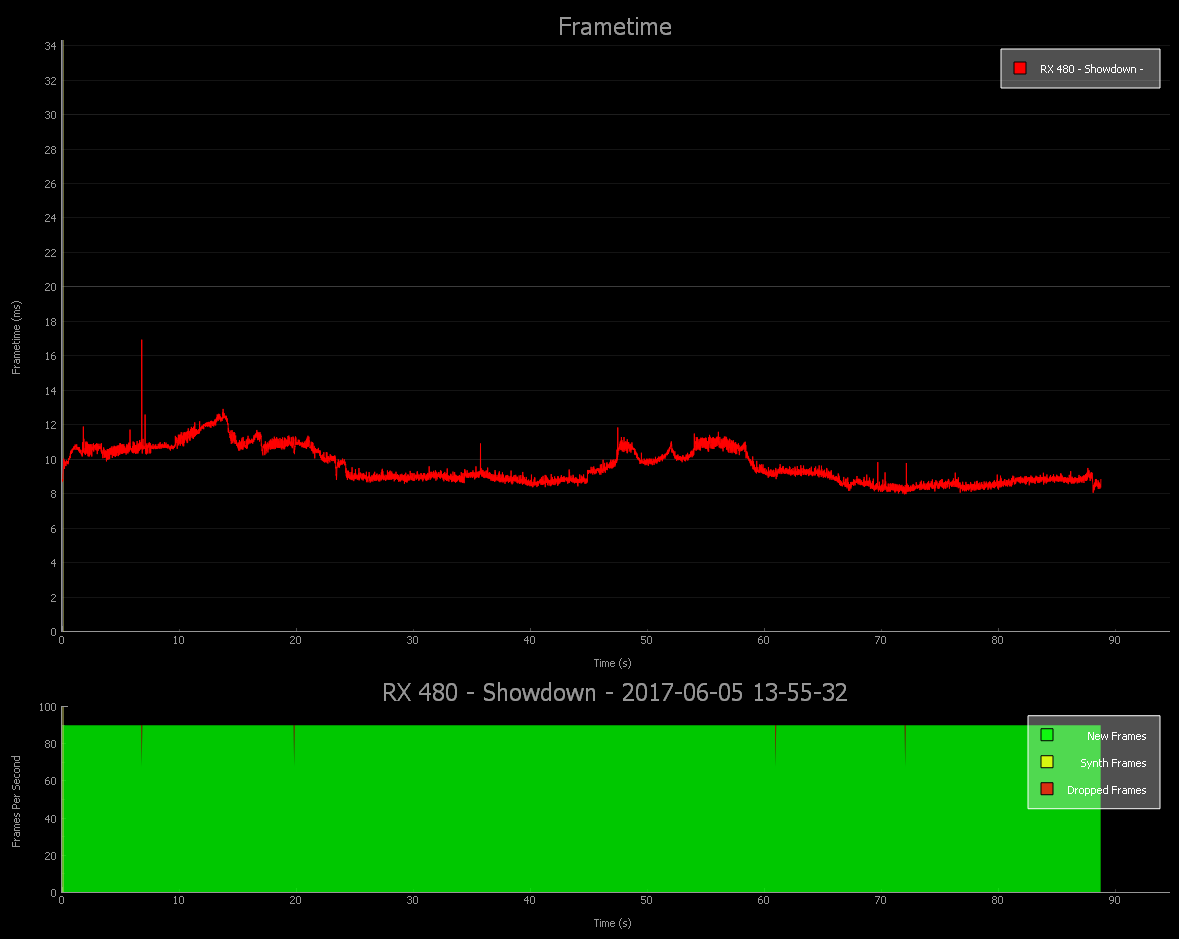
Although 5 frames were dropped, the RX 480@580 clocks averages 105.8 unconstrained FPS
Here is the FCAT VR charts of all 6 cards but without the interval plot bars. There is very little reason to show them as few frames were dropped.

As you can see from the videos and the FCAT VR graphs, Showdown is not demanding, yet we can clearly see the ranking of our video cards from top to bottom – or actually bottom to top, as lower latency is ideal. Make sure to read the chart noting that the frametimes that are lower on the chart are delivering frames more quickly than those higher up the chart.
Watching the Motion to Photon Latency as well as the Performance Headroom in the Overlay, we can accurately gauge performance. Every time the App Frame Rate (Hz) green line dips, the framerate drops to 45 FPS; and when it is a solid yellow line, and ASW is delivering a reprojected frame to maintain the illusion of 90 FPS and it works well to keep one from getting VR sick.
DiRT: Rally
DiRT Rally is special as it has a built-in benchmark that is 100% repeatable. This benchmark is quite accurate and it will relate to the FCAT VR graphs. Whenever a framerate drops below 90 FPS, the Test Summary of the built-in benchmark accurately shows the minimum as 45 FPS (with ASW reprojection). Unfortunately, it does not display unconstrained FPS.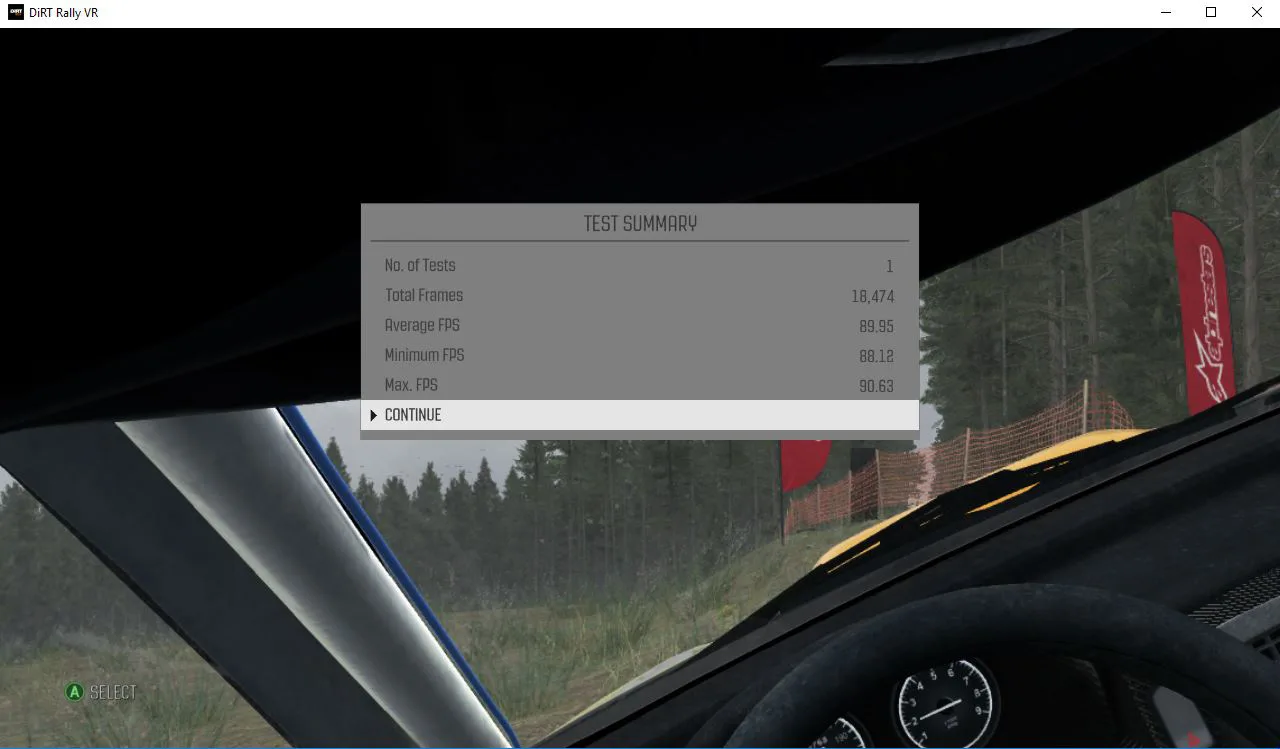 It’s also a very fun game for either PC gaming or for VR as a very demanding game that requires the player to really learn the challenging road conditions. Best of all, DiRT: Rally has a lot of settings that can be customized although we benchmarked only the “High” and the “Ultra” presets
Here is the DiRT: Rally benchmark run by the GTX 1080 Ti at Ultra settings.
As you can see that although there is a lot of performance headroom with 117.7 unconstrained FPS, some frames were dropped in this 3-1/2 minute in-game benchmark.
Here is our video DiRT: Rally benchmark run by the GTX 1080 at Ultra settings.

The GTX 1080 managed an average unconstrained fps 93.2 which mostly kept it out of reprojection.
Here is the DiRT: Rally benchmark run by the GTX 1070 at Ultra settings.
Ultra settings with GTX 1070 produced 76.7 unconstrained FPS which means a lot of ASW, but on the High preset it managed 97 unconstrained FPS with very few dropped frames.
Here is our DiRT: Rally benchmark run by the EVGA GTX 1060 SC on the High preset.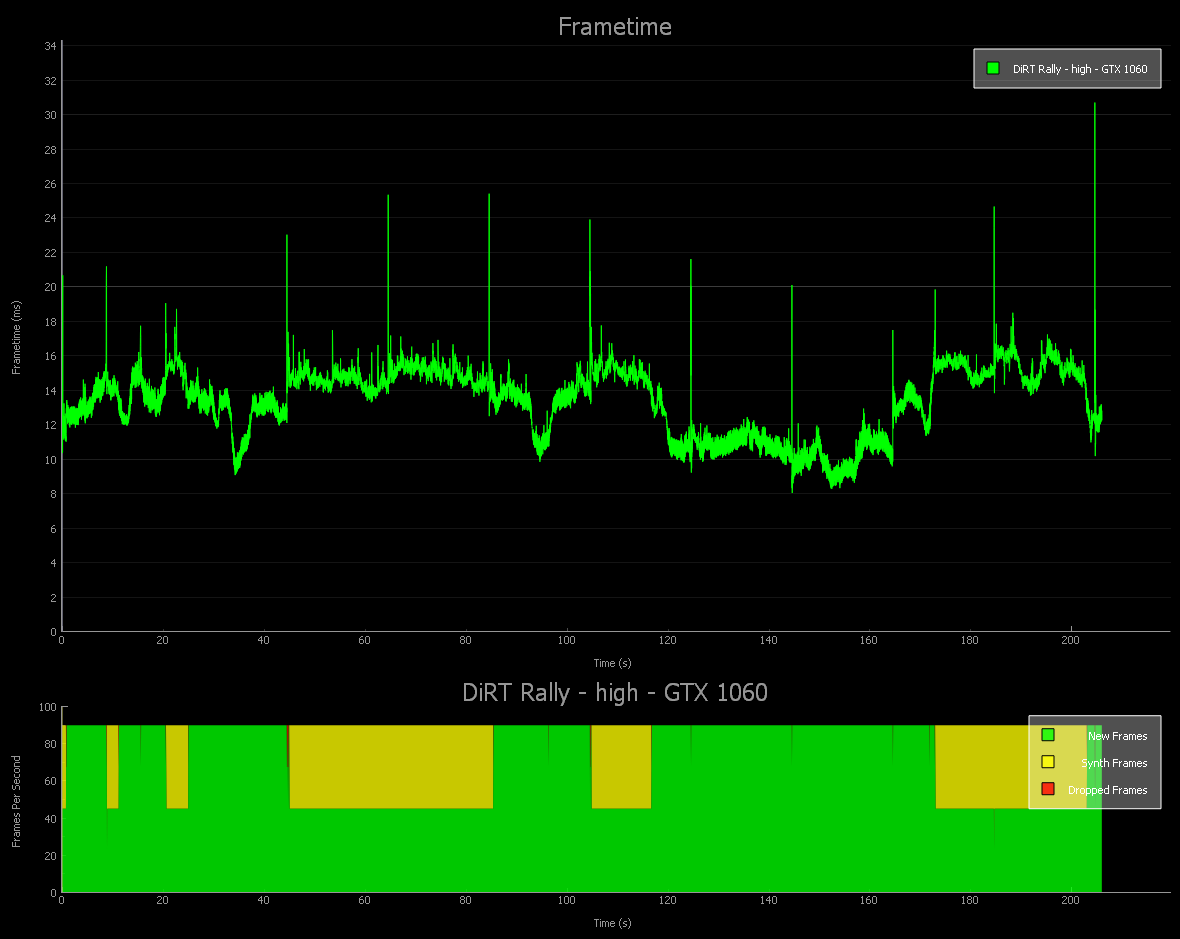
The GTX 1060 is a little too weak for High and we would recommend dropping some settings.
Here is our DiRT: Rally benchmark run by the FURY X.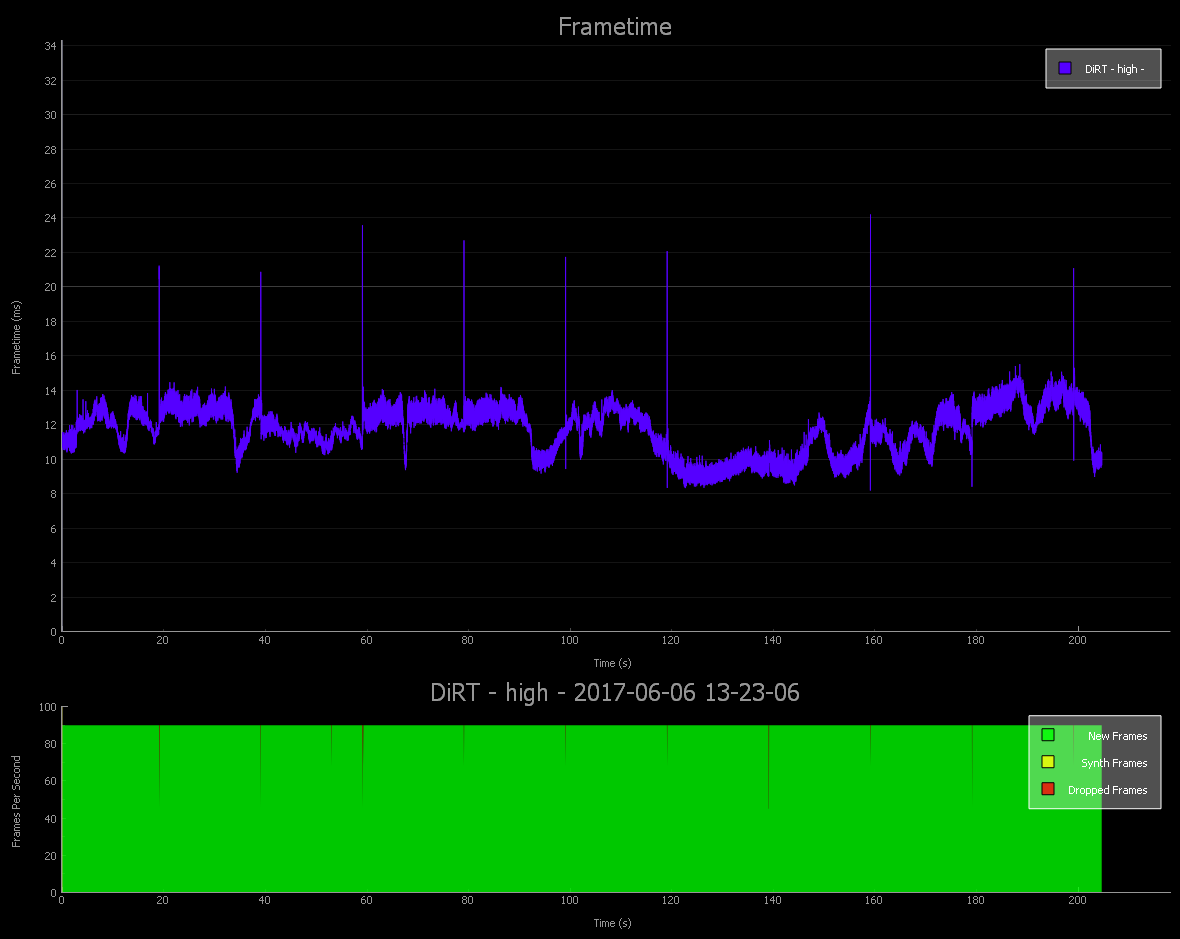
The Fury X managed 84.6 unconstrained framerates which allowed it to play at High.
Here is our video DiRT: Rally benchmark run by the RX 480 at RX 580 clocks.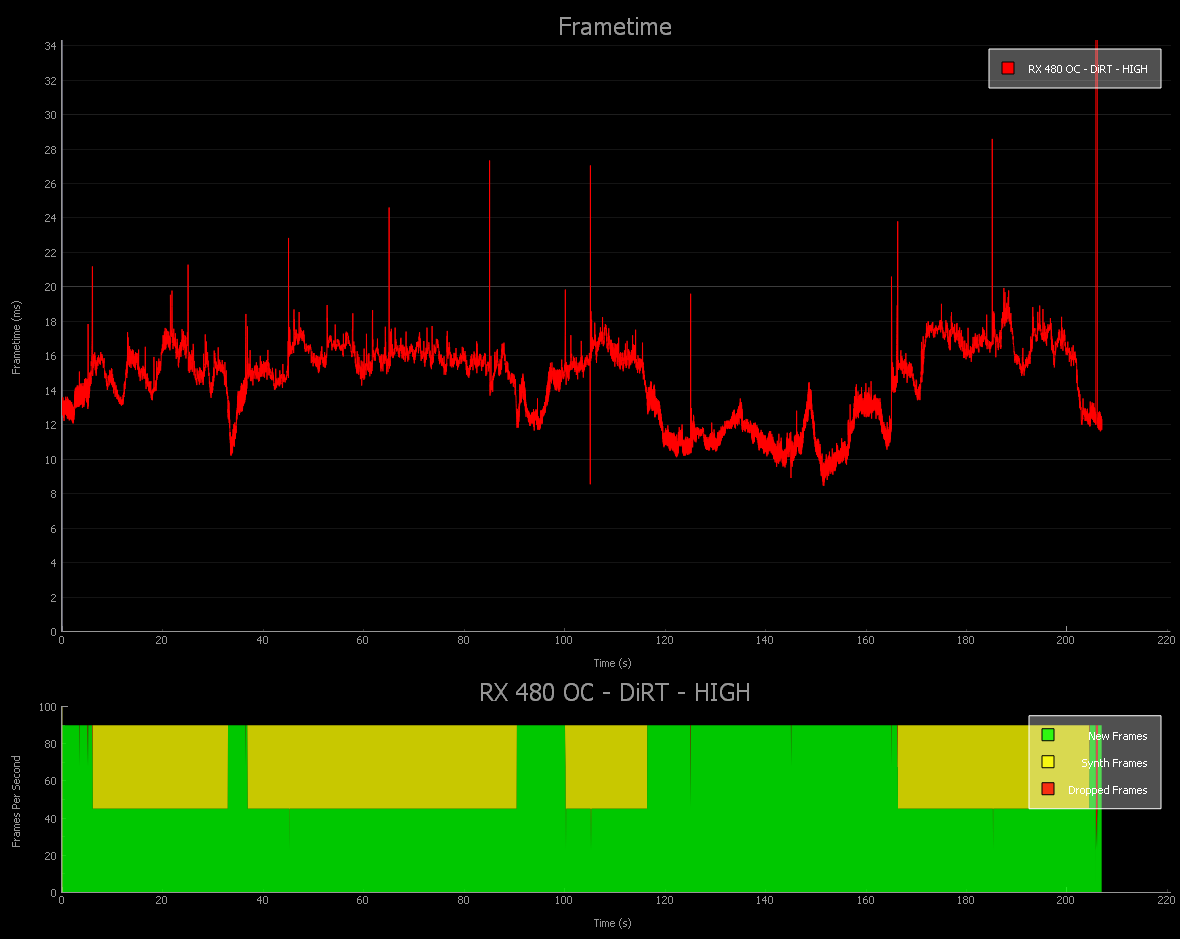
The RX 480@580 clocks only manages 71.8 unconstrained fps with a ton of ASW generated synthetic frames and a few dropped frames besides. Lowering settings is the best way to play.
Here is the FCAT VR chart of 3 cards with the intervals plotted using the Ultra preset.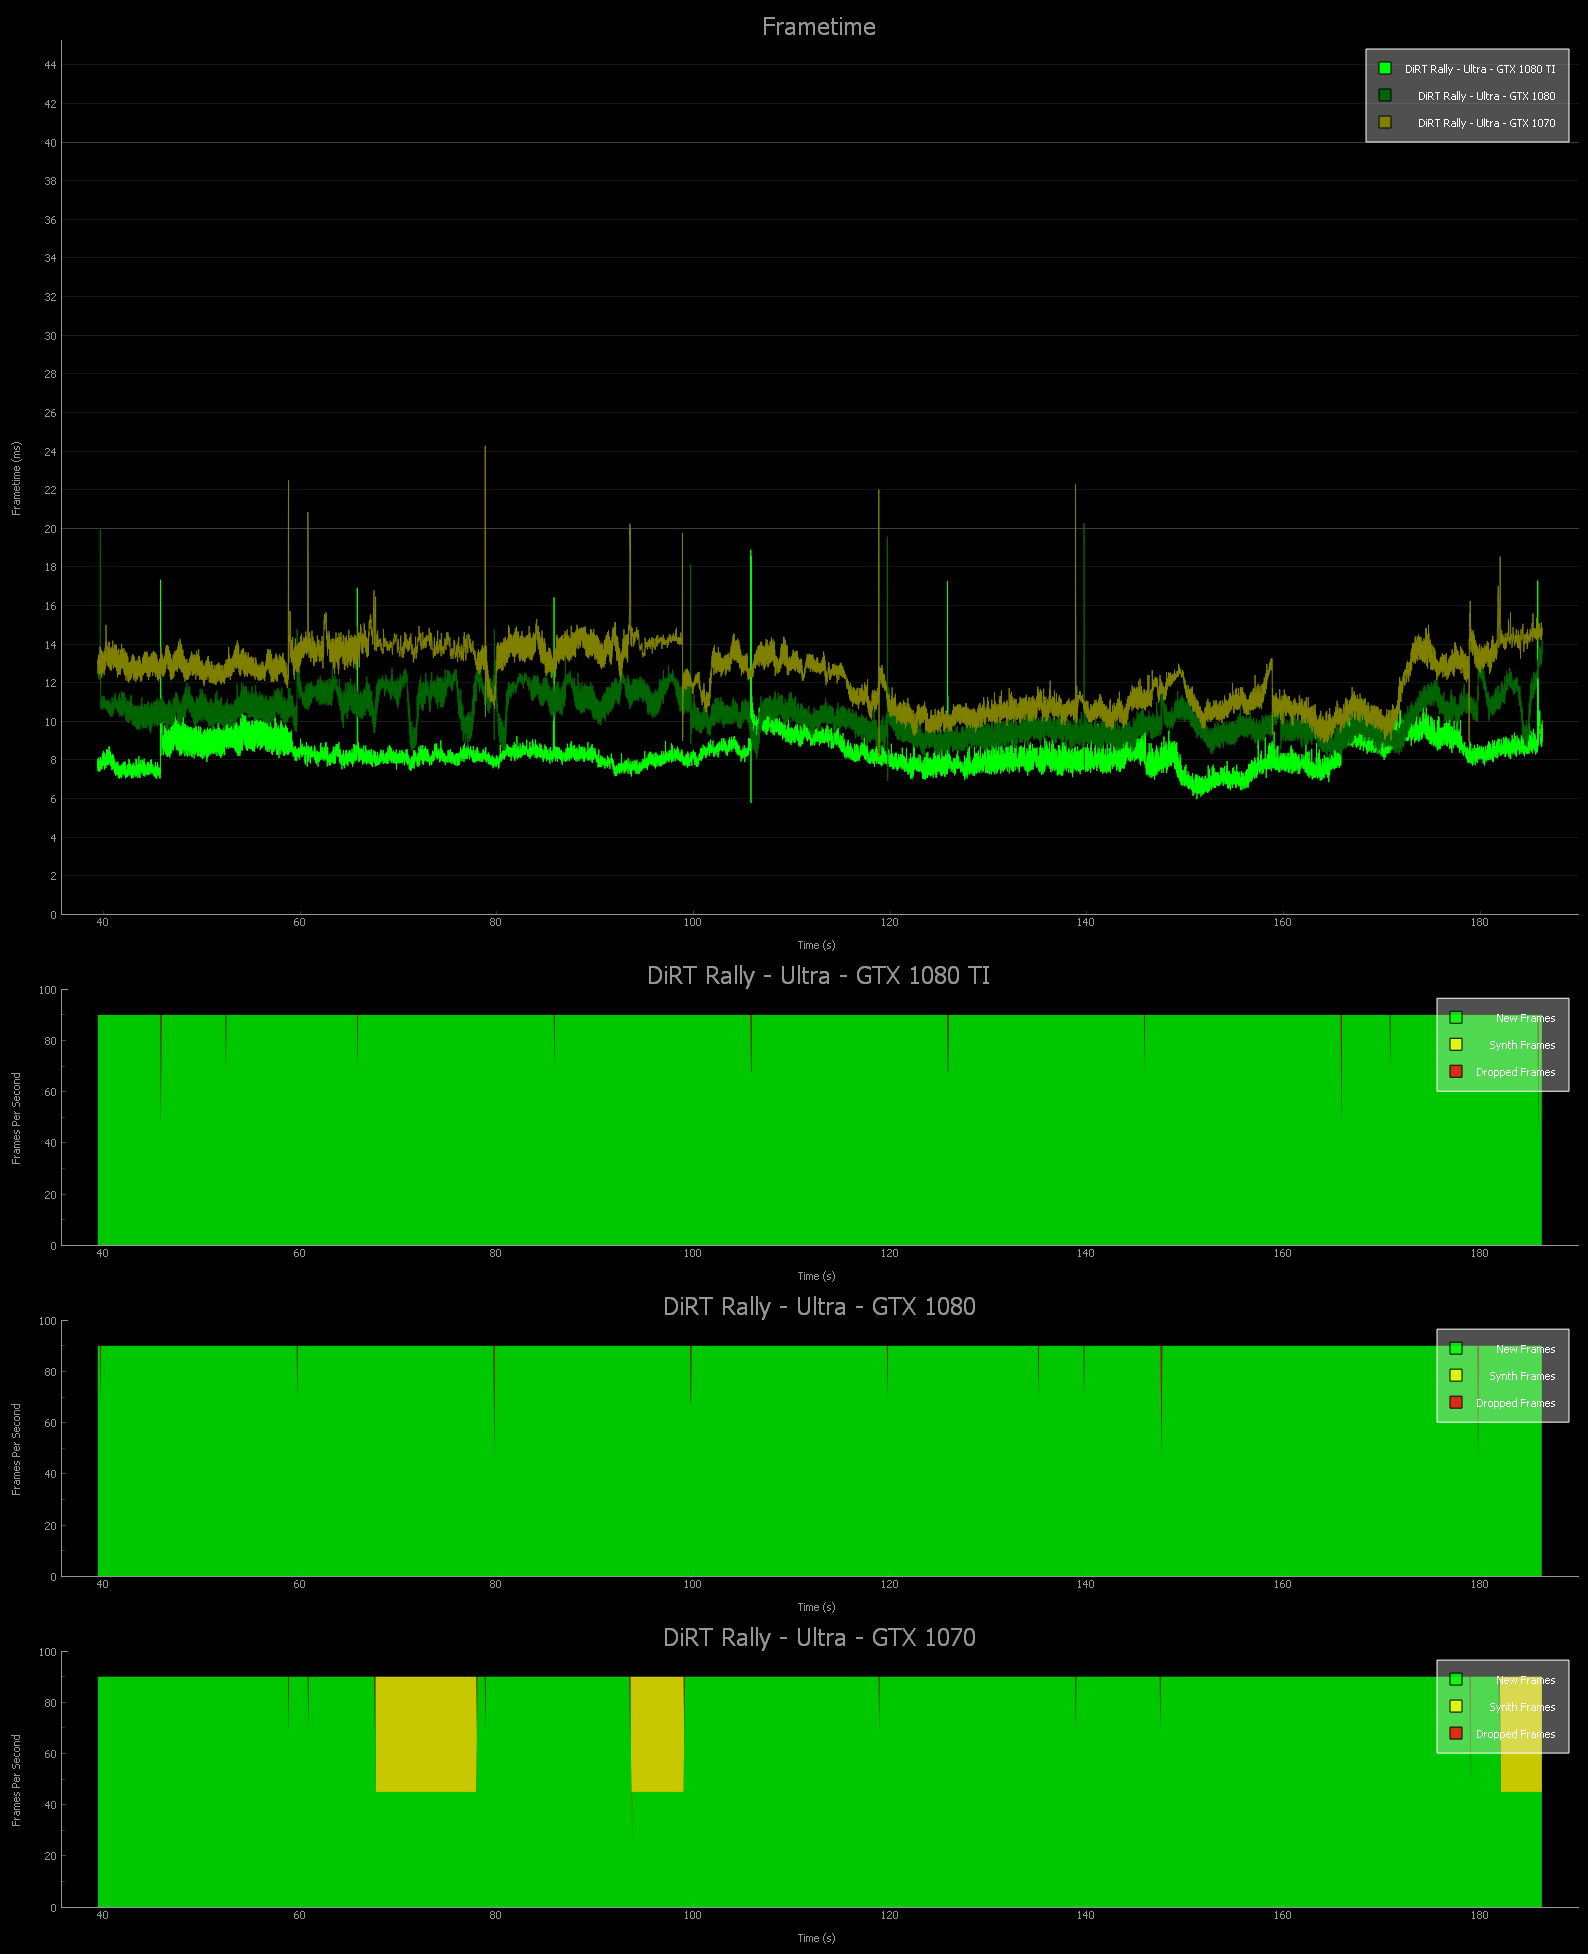
Now here is the High preset with 4 cards – we are repeating the GTX 1070 on High settings.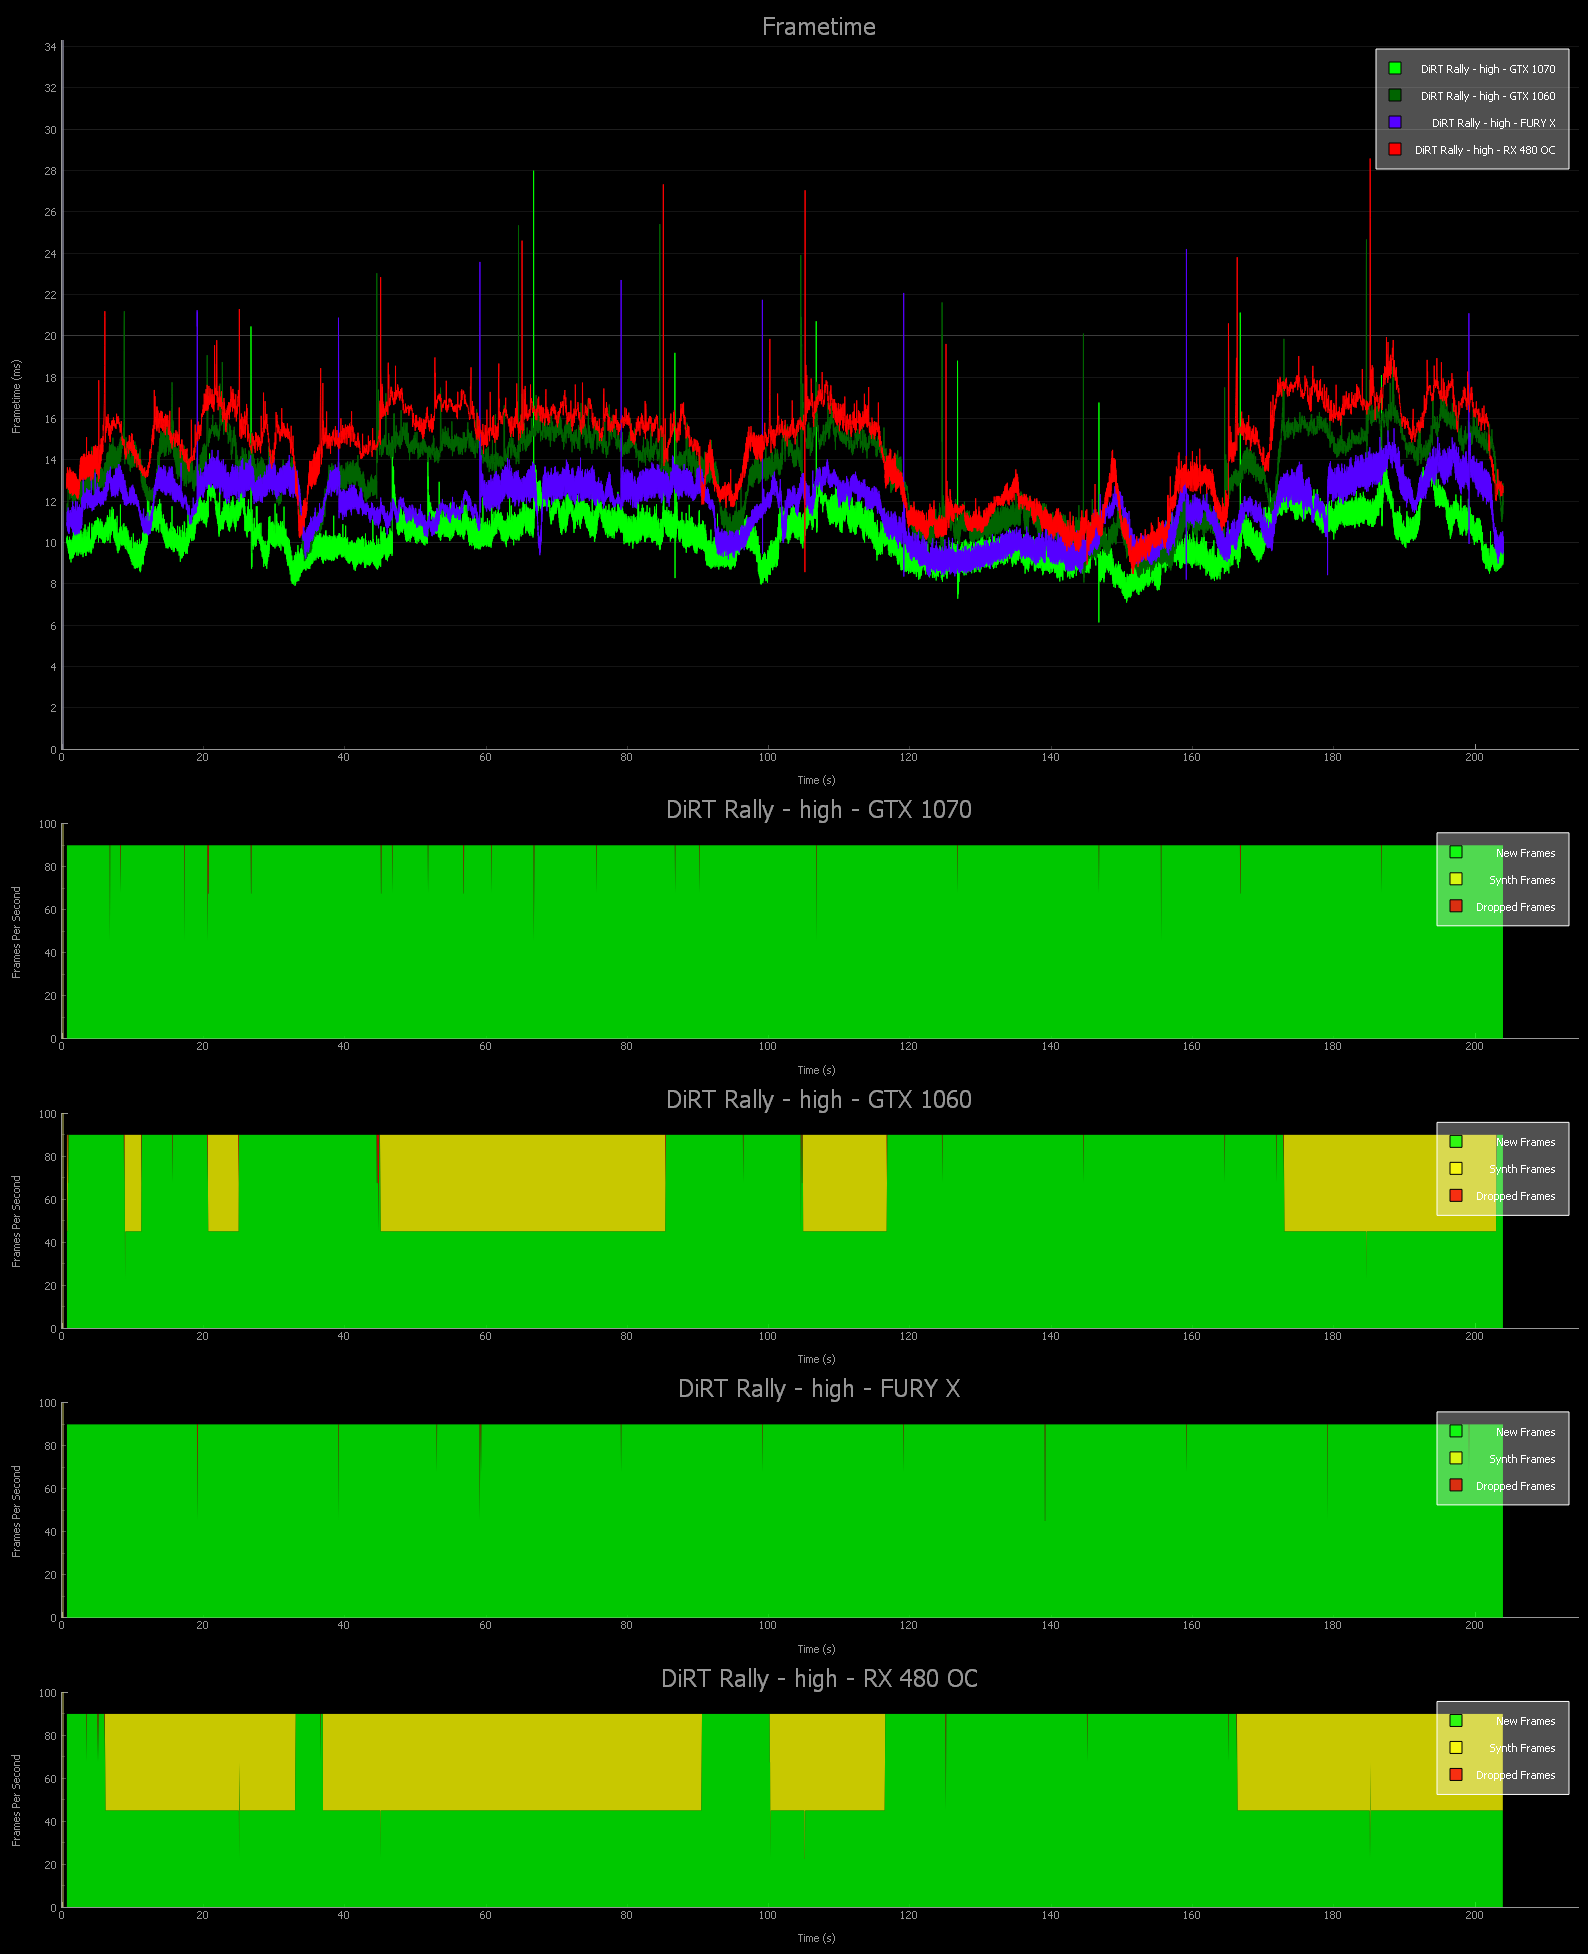
Only the GTX 1070 and the Fury X can handle high settings in the DiRT Rally benchmarks; lower setting to play with a GTX 1060 or with a RX 580.
Let’s look at Alice VR and Chronos next.
Alice VR
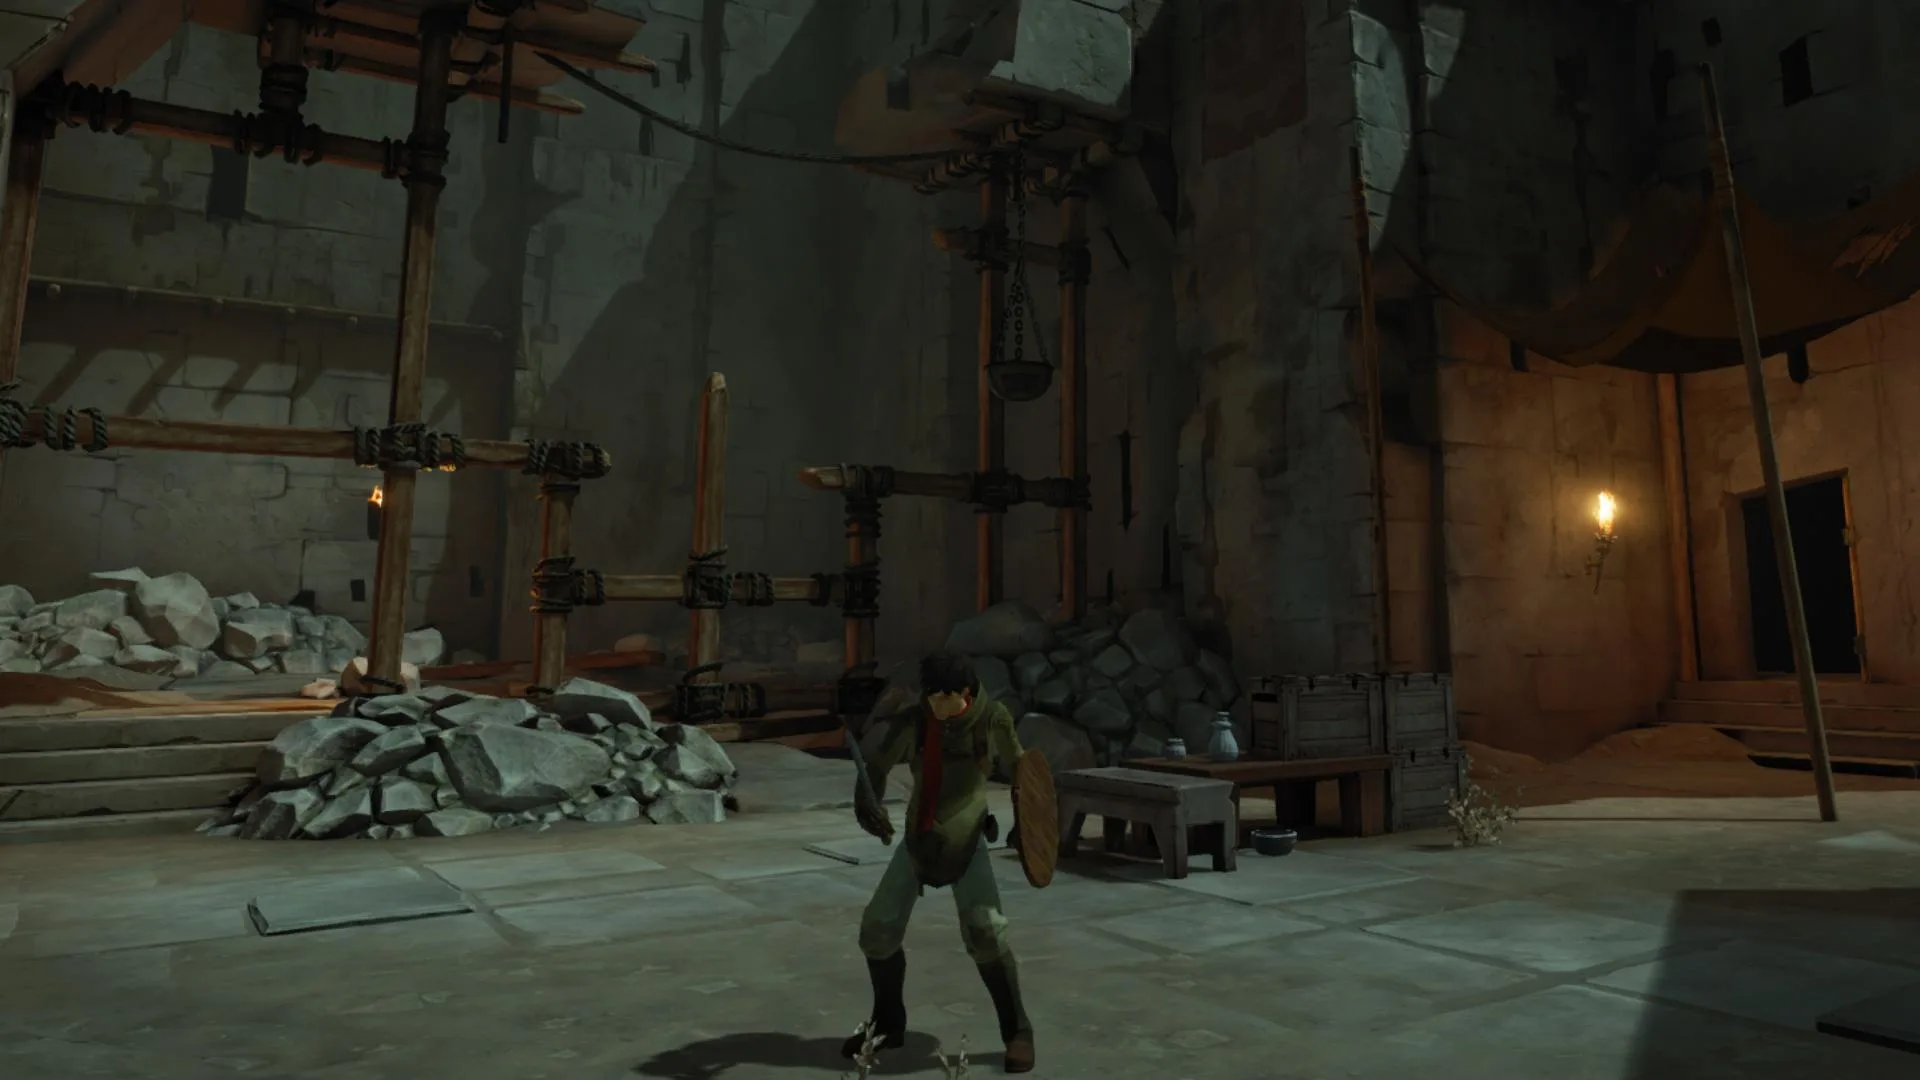
Alice VR is an science fiction space adventure game that is very loosely based on Lewis Carroll’s “Alice in Wonderland”. You are awakened from cryosleep and directed by your ship’s AI to fix some malfunctions that require going to a nearby planet’s surface to acquire supplies. It’s a short game of perhaps 5 or 6 hours.
It is a fair game that has simple puzzles and it might be worth playing except for the awful way that locomotion is implemented. You have a choice of “floating” along using the gamepad but when you turn, it becomes jarring and it is easy to get VR sick. Teleportation is an option, but it is poorly implemented unlike with Robo Recall, and the player has to make a lot of short teleports that can break immersion. The game would be a “6” if teleportation was implemented better and Alice VR is perhaps best reserved perhaps for buying from the bargain bin as it does have some redeeming features.
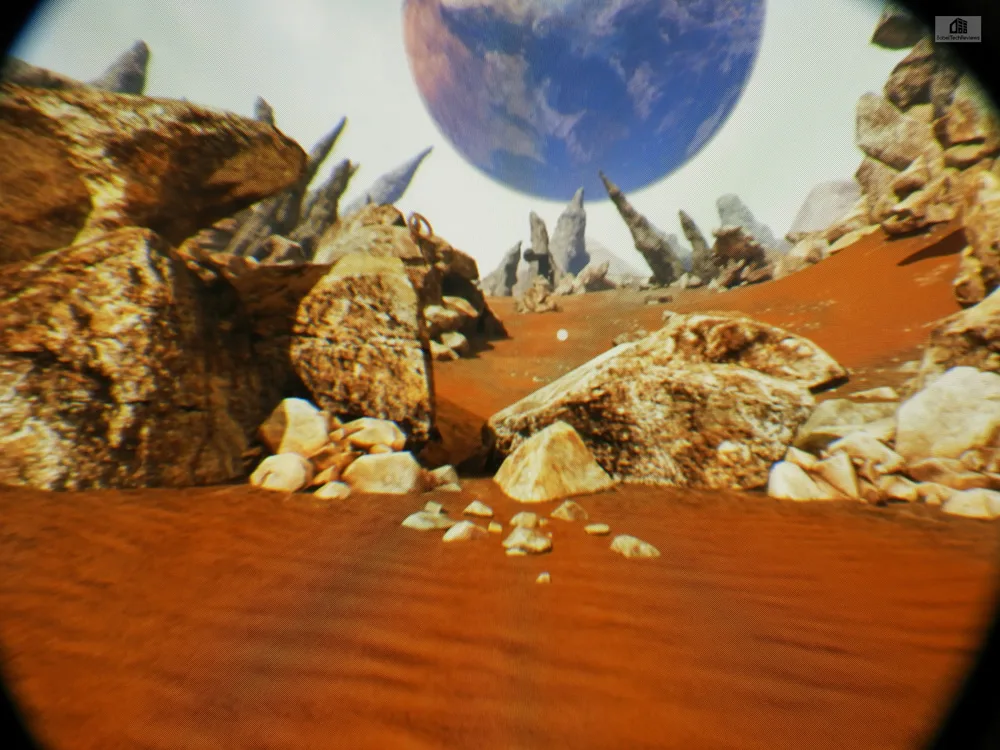
Although Alice VR uses the Unreal 4 engine, the outdoor graphics are weak and the interactivity is poor. Even when you get to drive a vehicle on a planet’s surface, the ground is mostly flat and the rocks you drive over only occasionally cause you to feel like you are really driving. The indoor environments are considerably better, but I would not recommend this game at full price.
Here is the FCAT generated chart for Alice VR with all graphics settings set to their highest.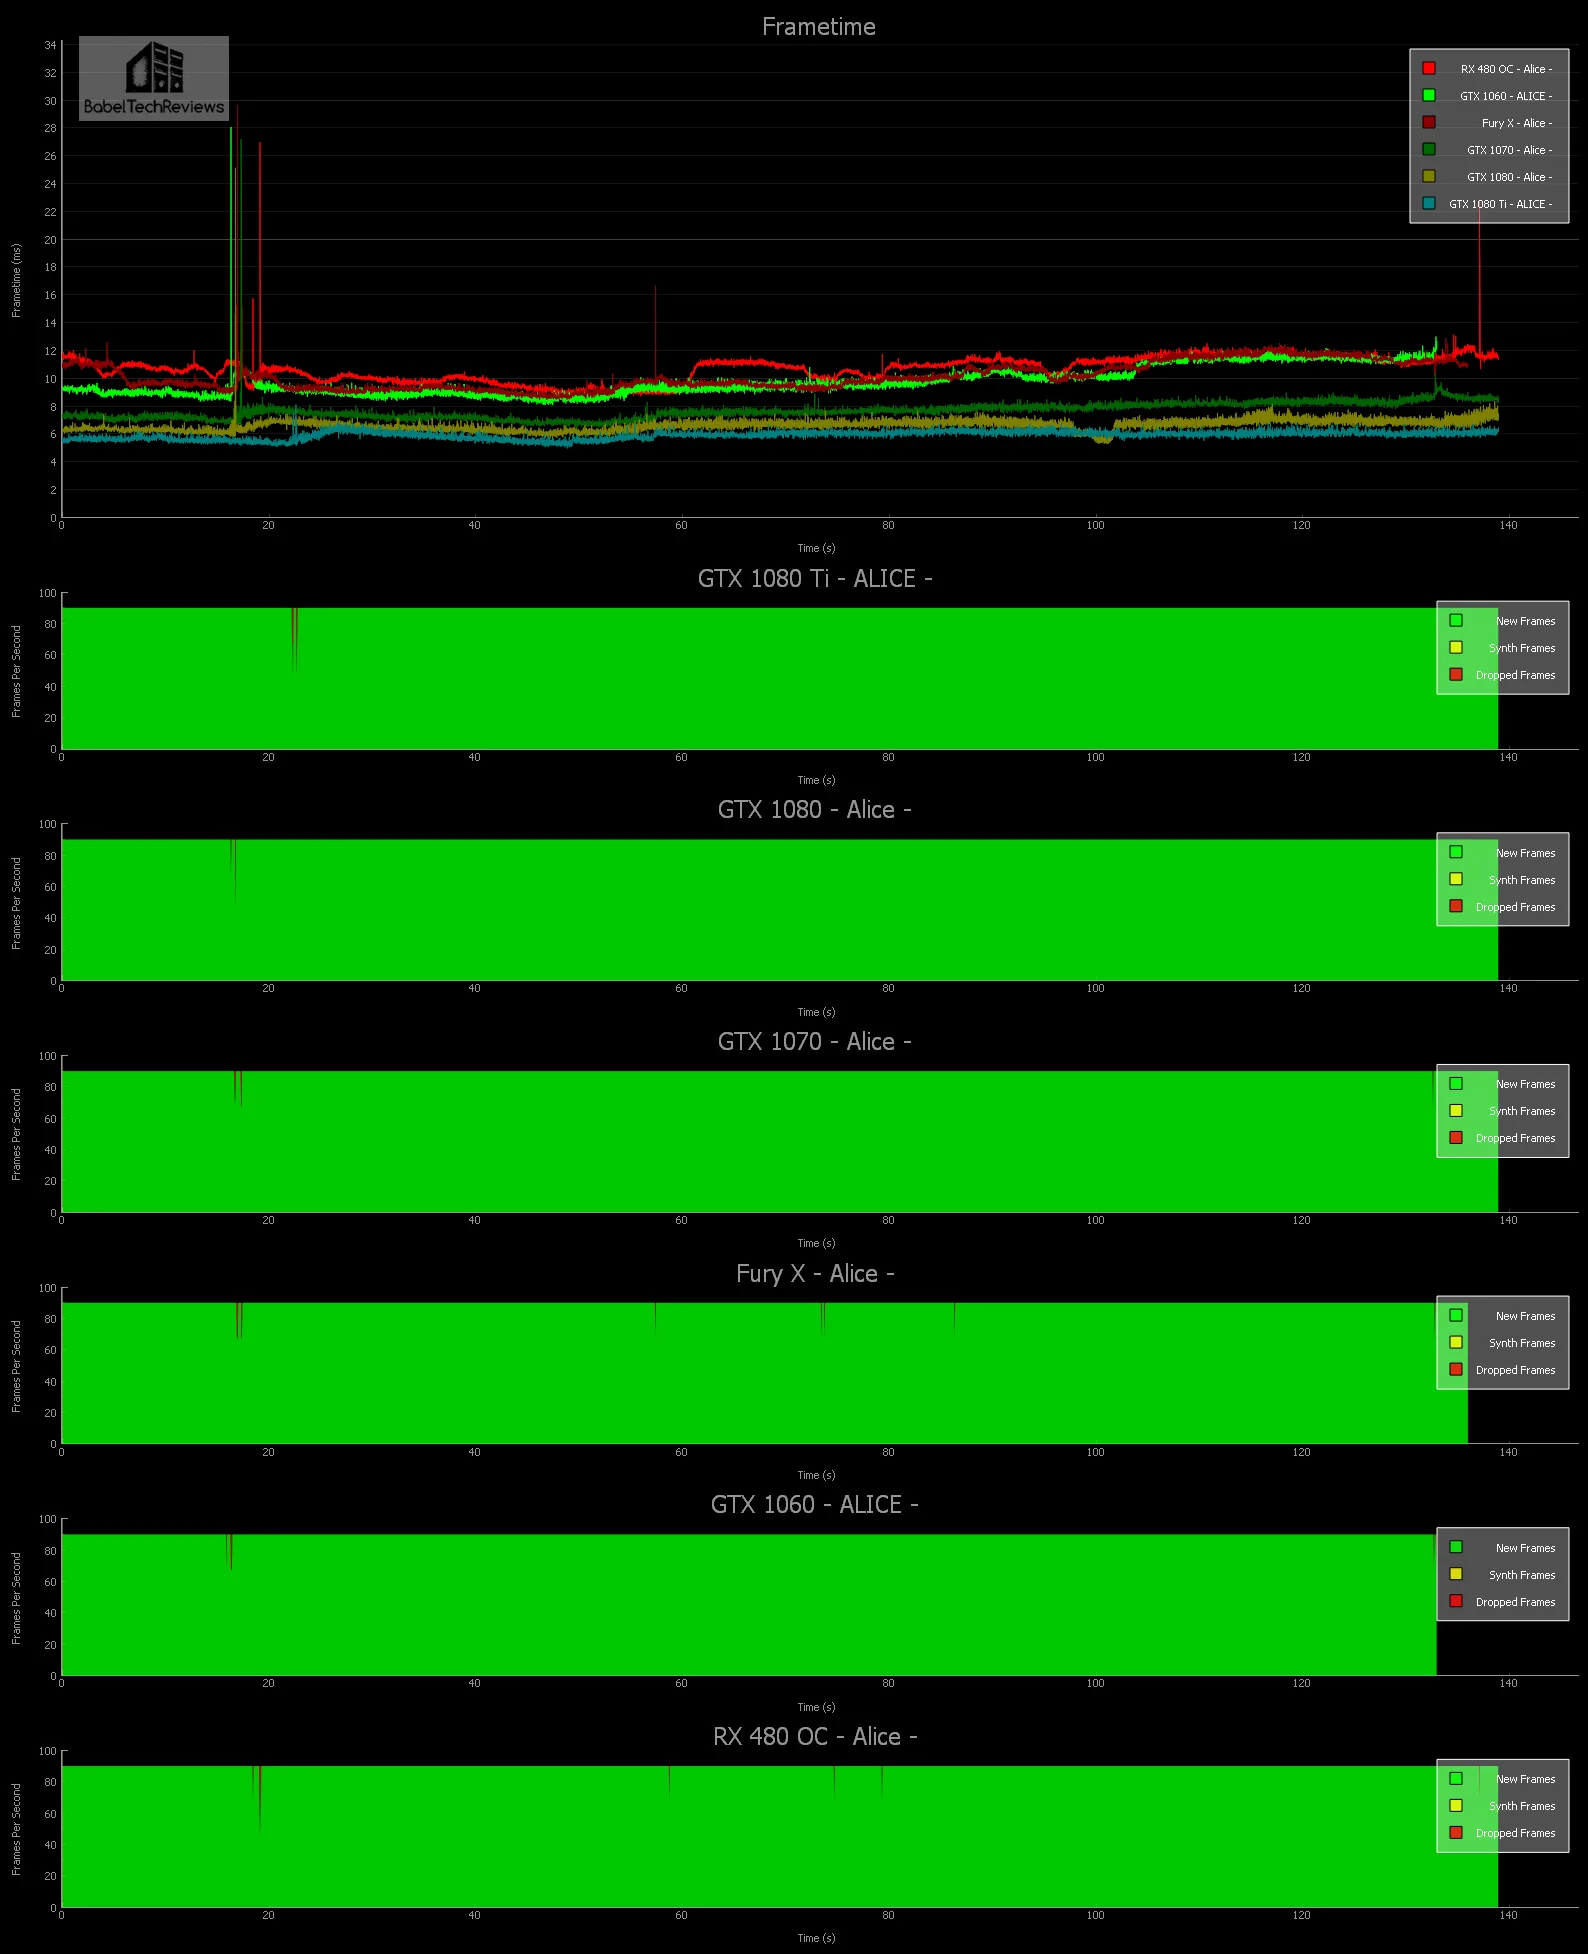

Here’s some additional stats:
The 1080 Ti dropped 4 frames with an average of 168 unconstrained FPS.
The GTX 1080 dropped 5 frames with an average of 150 unconstrained FPS
The GTX 1070 dropped 5rames with an average of 131 fps unconstrained FPS.
The 1060 dropped 6 frames with an average of 102 fps unconstrained FPS.
The Fury X dropped 10 frames with an average of 99 fps unconstrained FPS.
The RX 480 OC dropped 14 frames with an average of 94 unconstrained FPS.
It’s pretty clear that Alice VR is not demanding at all. All of the video cards that we tested are able to deliver at least 90 FPS with only occasionally dropping into an rare frame reprojection.
Chronos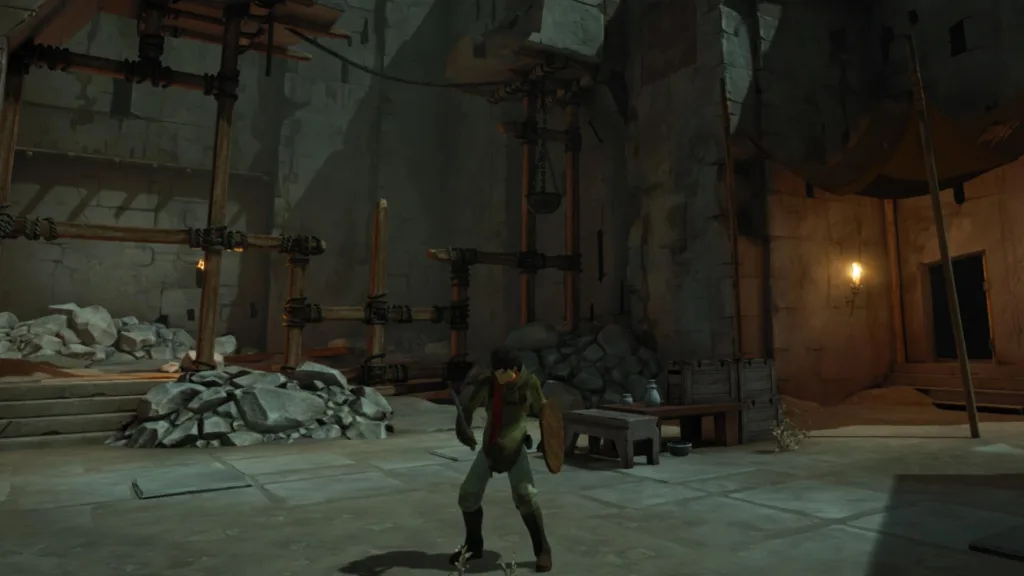
Chronos is an exclusive Rift launch title with graphics options that are good for GPU testing. It is an amazing RPG for the Rift and also very hard (think Dark Souls meets Zelda). It is about 15 hours long and has many puzzles to solve as well as requires you to be very good in combat especially with your defense and attack timing. It uses the Xbox One controller although the Touch controllers can be used, and since it has a 3rd person view like Lucky’s Tale. there is little chance of getting VR sick unless you really push the settings too high. Chronos is an excellent VR game and an 8.5 might do it justice. Recommended!
There are 4 settings – Low, Recommended, High, and Epic.

Here are the FCAT generated charts. First we look at Chronos with Epic settings: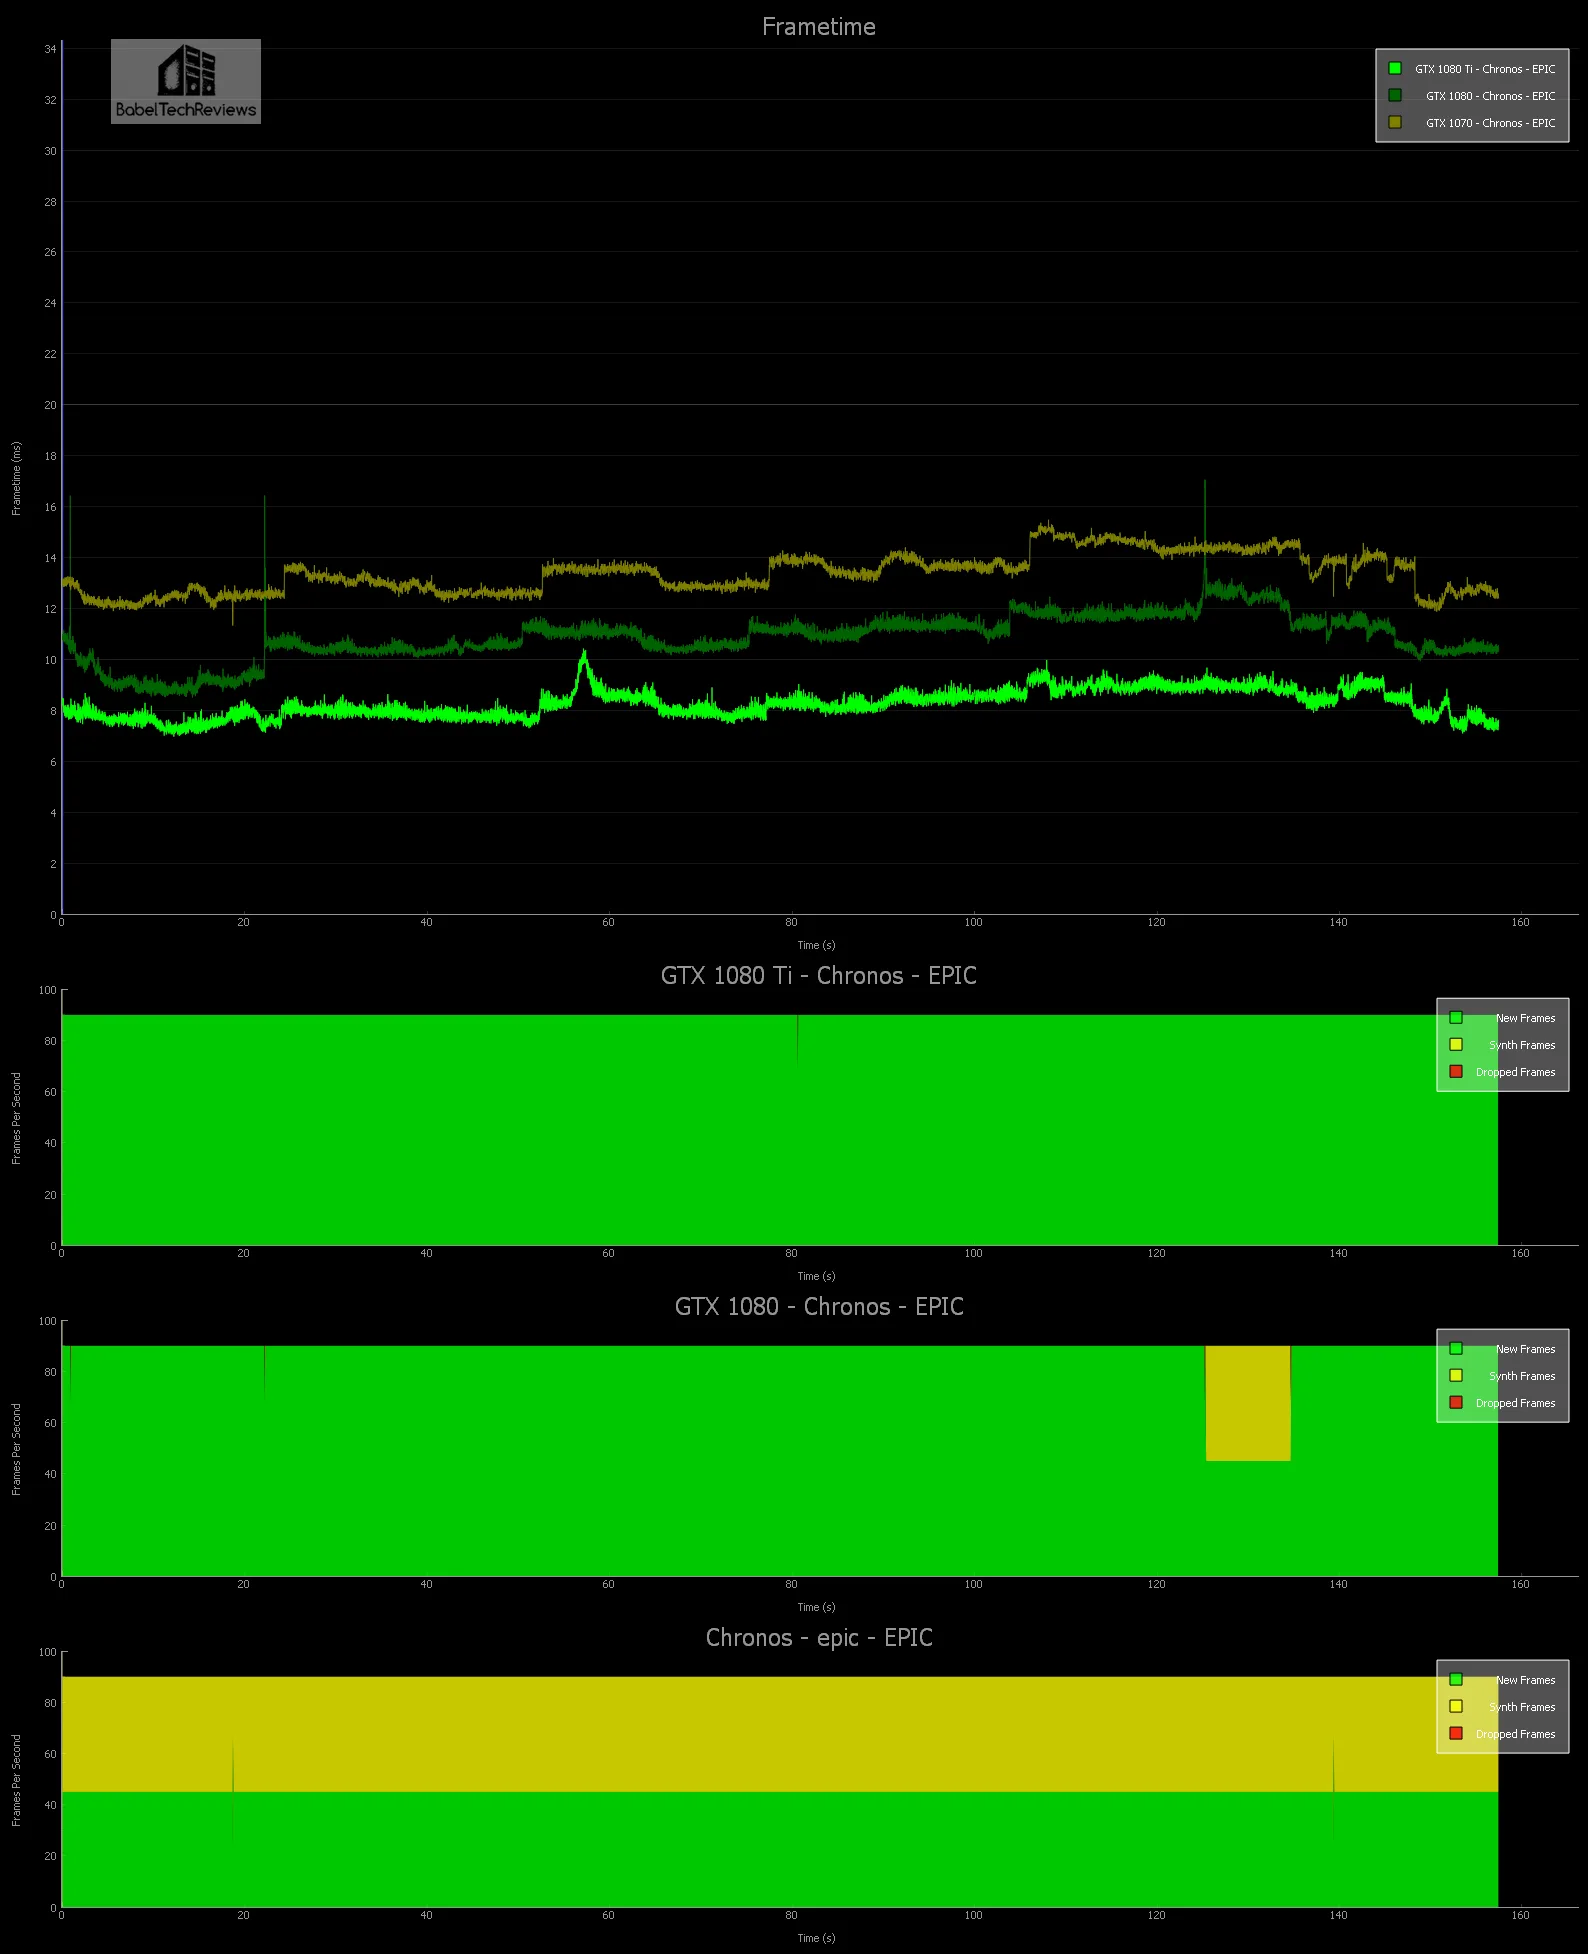
The GTX 1080 Ti is the only card tested that can play Chronos on Epic without needing to drop to 45 FPS with ASW reprojection. Even though the GTX 1080 drops to 45 FPS on demanding scenes, it can still manage Epic settings without making the player feel uncomfortable – largely because of the way the game is designed from a third person view. Yet, when you are fighting, you really want 90 FPS without any ASW or you may encounter some artifacting. However, the GTX 1070 cannot play on Epic very well for any length of time as most of the frames are ASW simulated. We’d recommend dropping settings to High for the GTX 1070 and for the lesser cards.
Here is Chronos on High settings: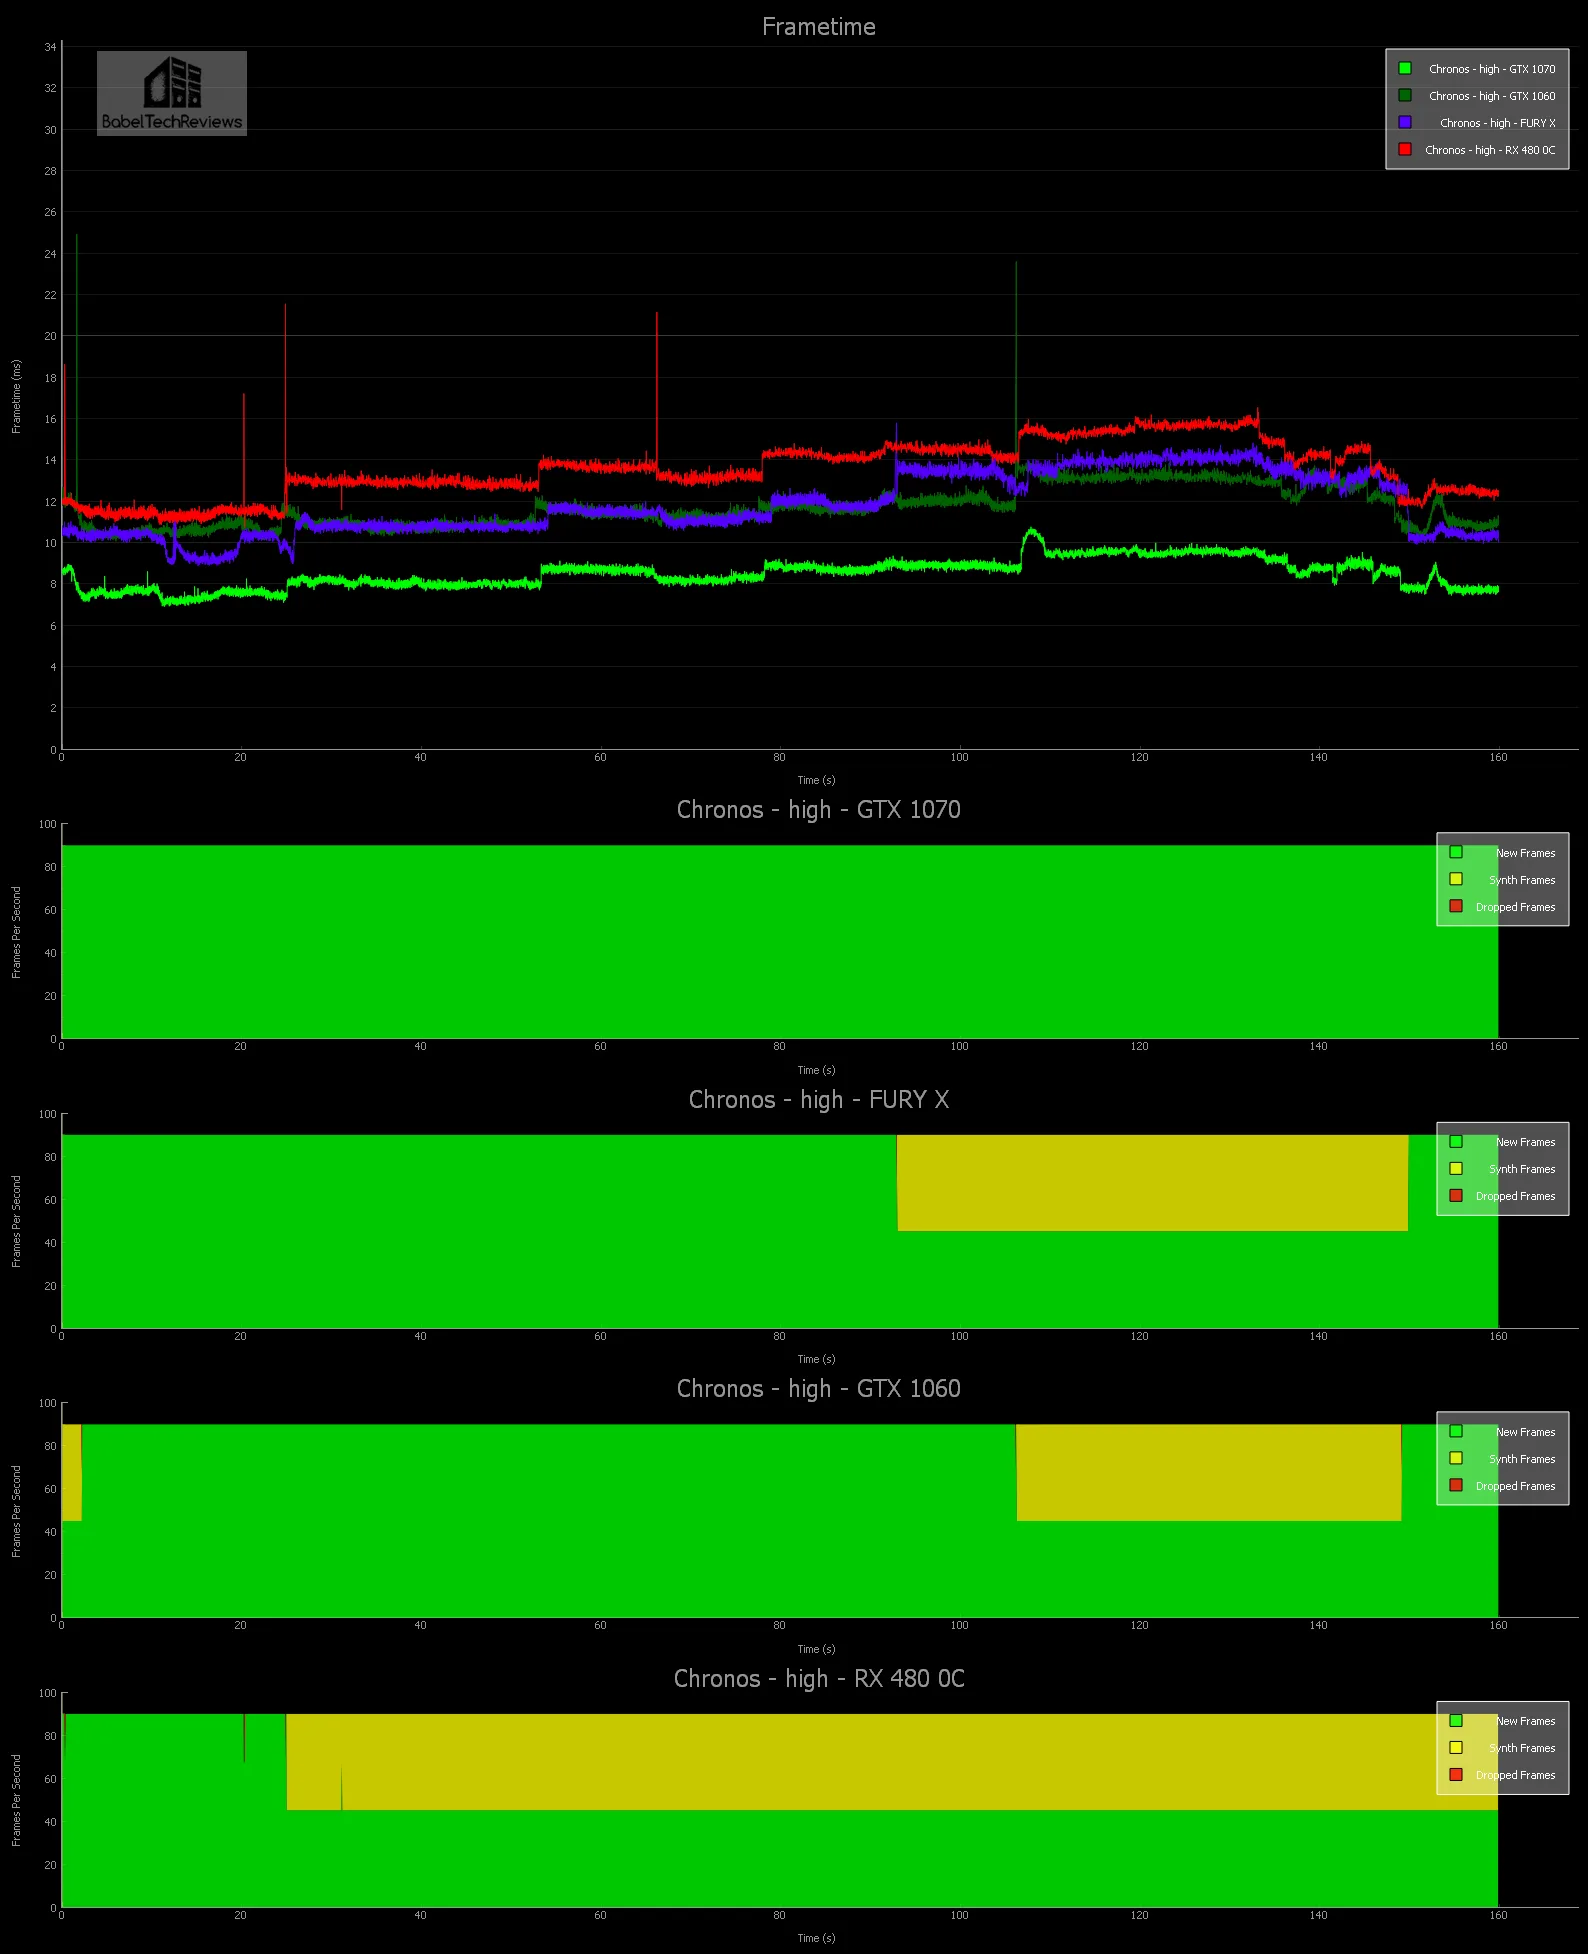
On high settings, the GTX 1070 now doesn’t need ASW as it did on Ultra but the GTX 1060 and the Fury X spend quite a bit of time below 90 FPS while the RX 480 OC should be played with lower recommended settings.
Let’s check out Batman Arkham VR and Serious Sam: The Last Hope next.
Batman Arkham VR – MRS vs. Fix Foviated and Pixel Density
Batman Arkham VR is an unusual game that immerses you into Batman’s world but doesn’t really involve fighting. It is a beautiful looking game with a lot of interactivity, and if you like “detective work” and puzzle solving, this may be the game for you. It’s short, but it really shows one what VR is capable of right now on the Unreal Engine.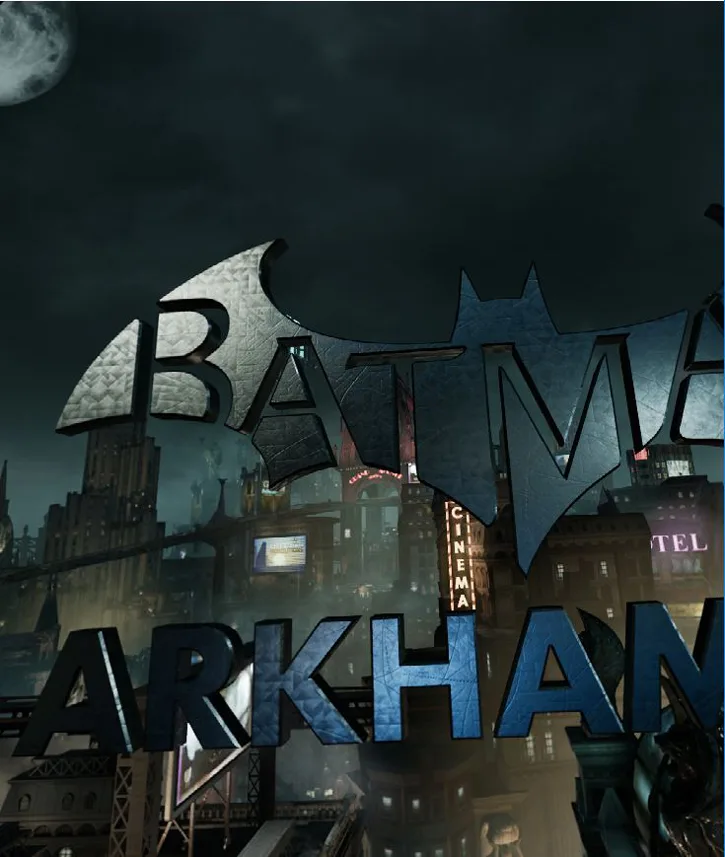
Batman Arkham VR has multiple settings and its the only game that we are benching that takes full advantage of NVIDIA’s MRS and even offers a Warner Brothers in-house multiple resolution for Radeon users that they call “Fix Foviated”. According to Warner Brother Batman Arkham VR devs:
In order to achieve the high resolutions needed for VR, we take advantage of part of the human eye’s physiology, the fovea. This part of the eye is responsible for the sharp central vision we see and so we can focus our pixel density in a fixed central area of the screen, allowing the rest of the screen to be rendered at a lower resolution. The fixed foveated option of multi-resolution rendering does this by dividing the screen into two parts: a central circular high resolution region, and an outer lower resolution region. By doing this, we can achieve 90fps at foveated ‘virtual resolutions’ above the native resolution of the headset’s LCD screen as described in Pixel Density section above.
First is the stock full resolution, 100% pixel density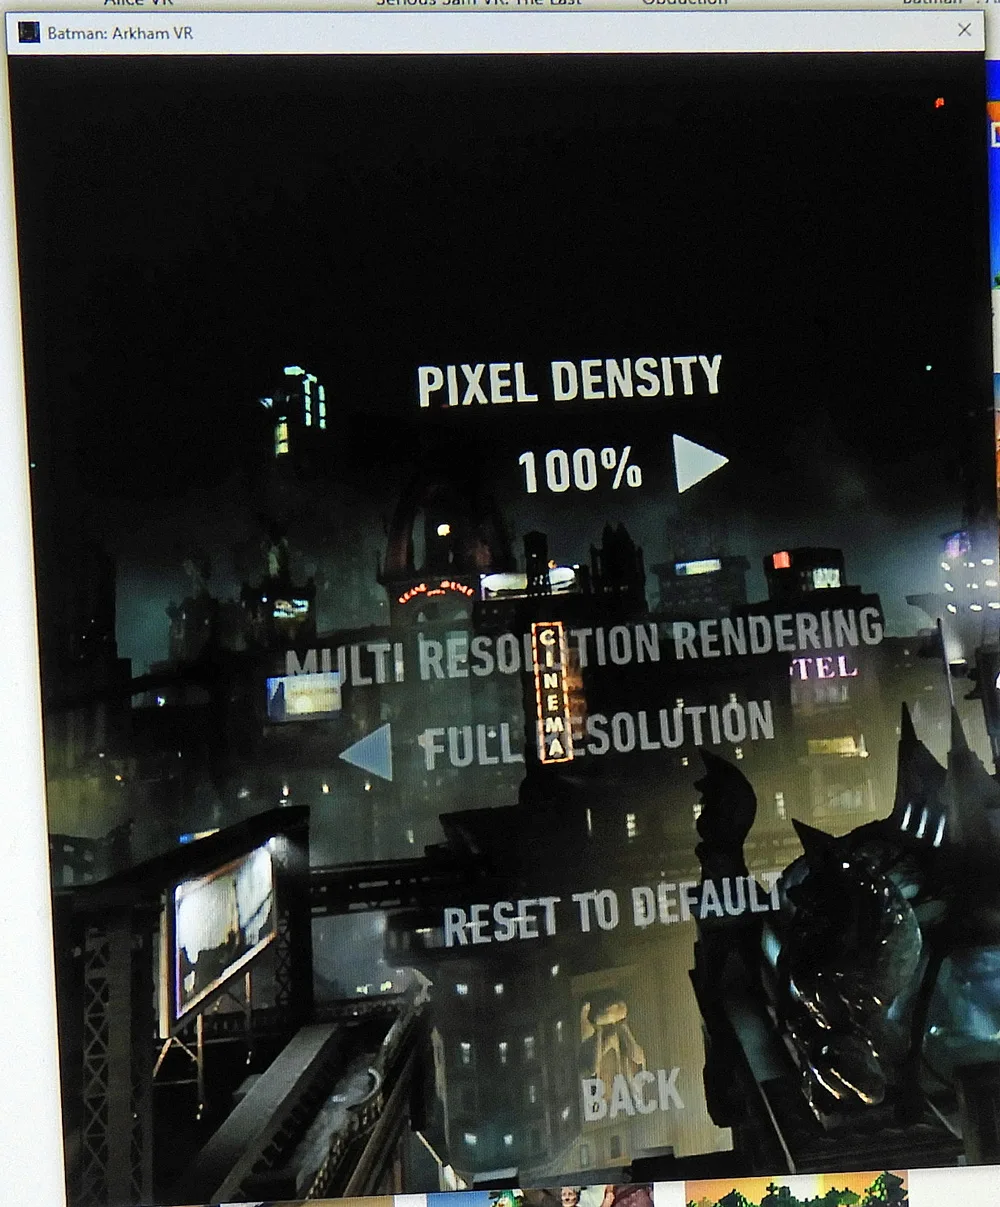
Here is the performance across six cards from the FCAT generated charts at 100% Pixel Density.
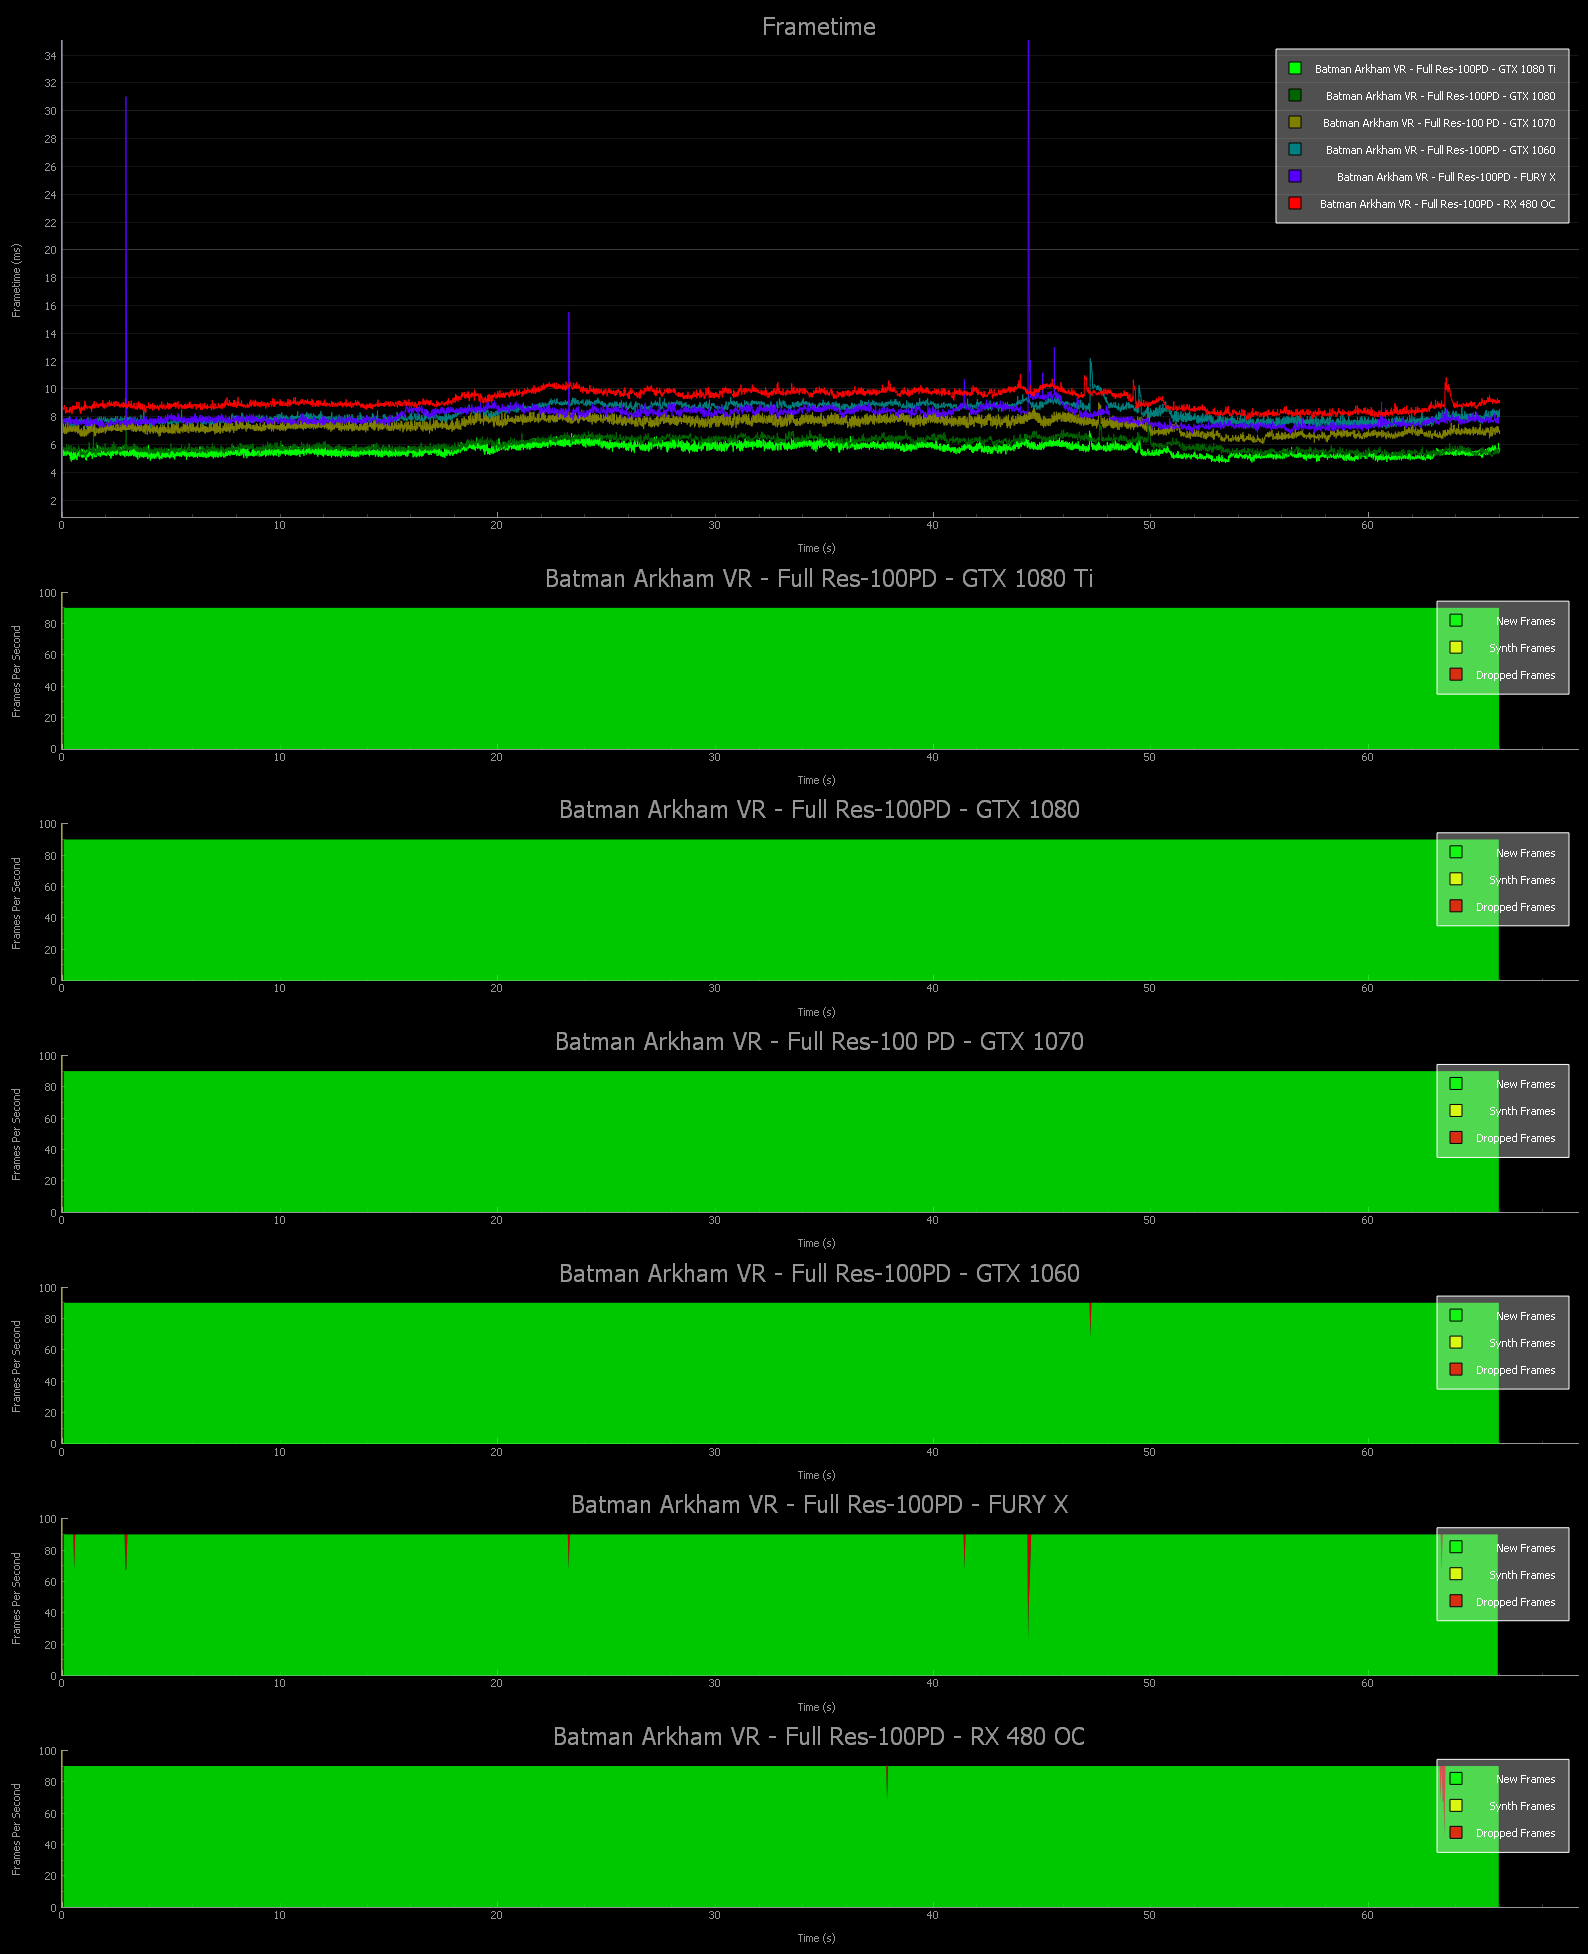
Let’s get a little closer look at the frametimes of the same graph.
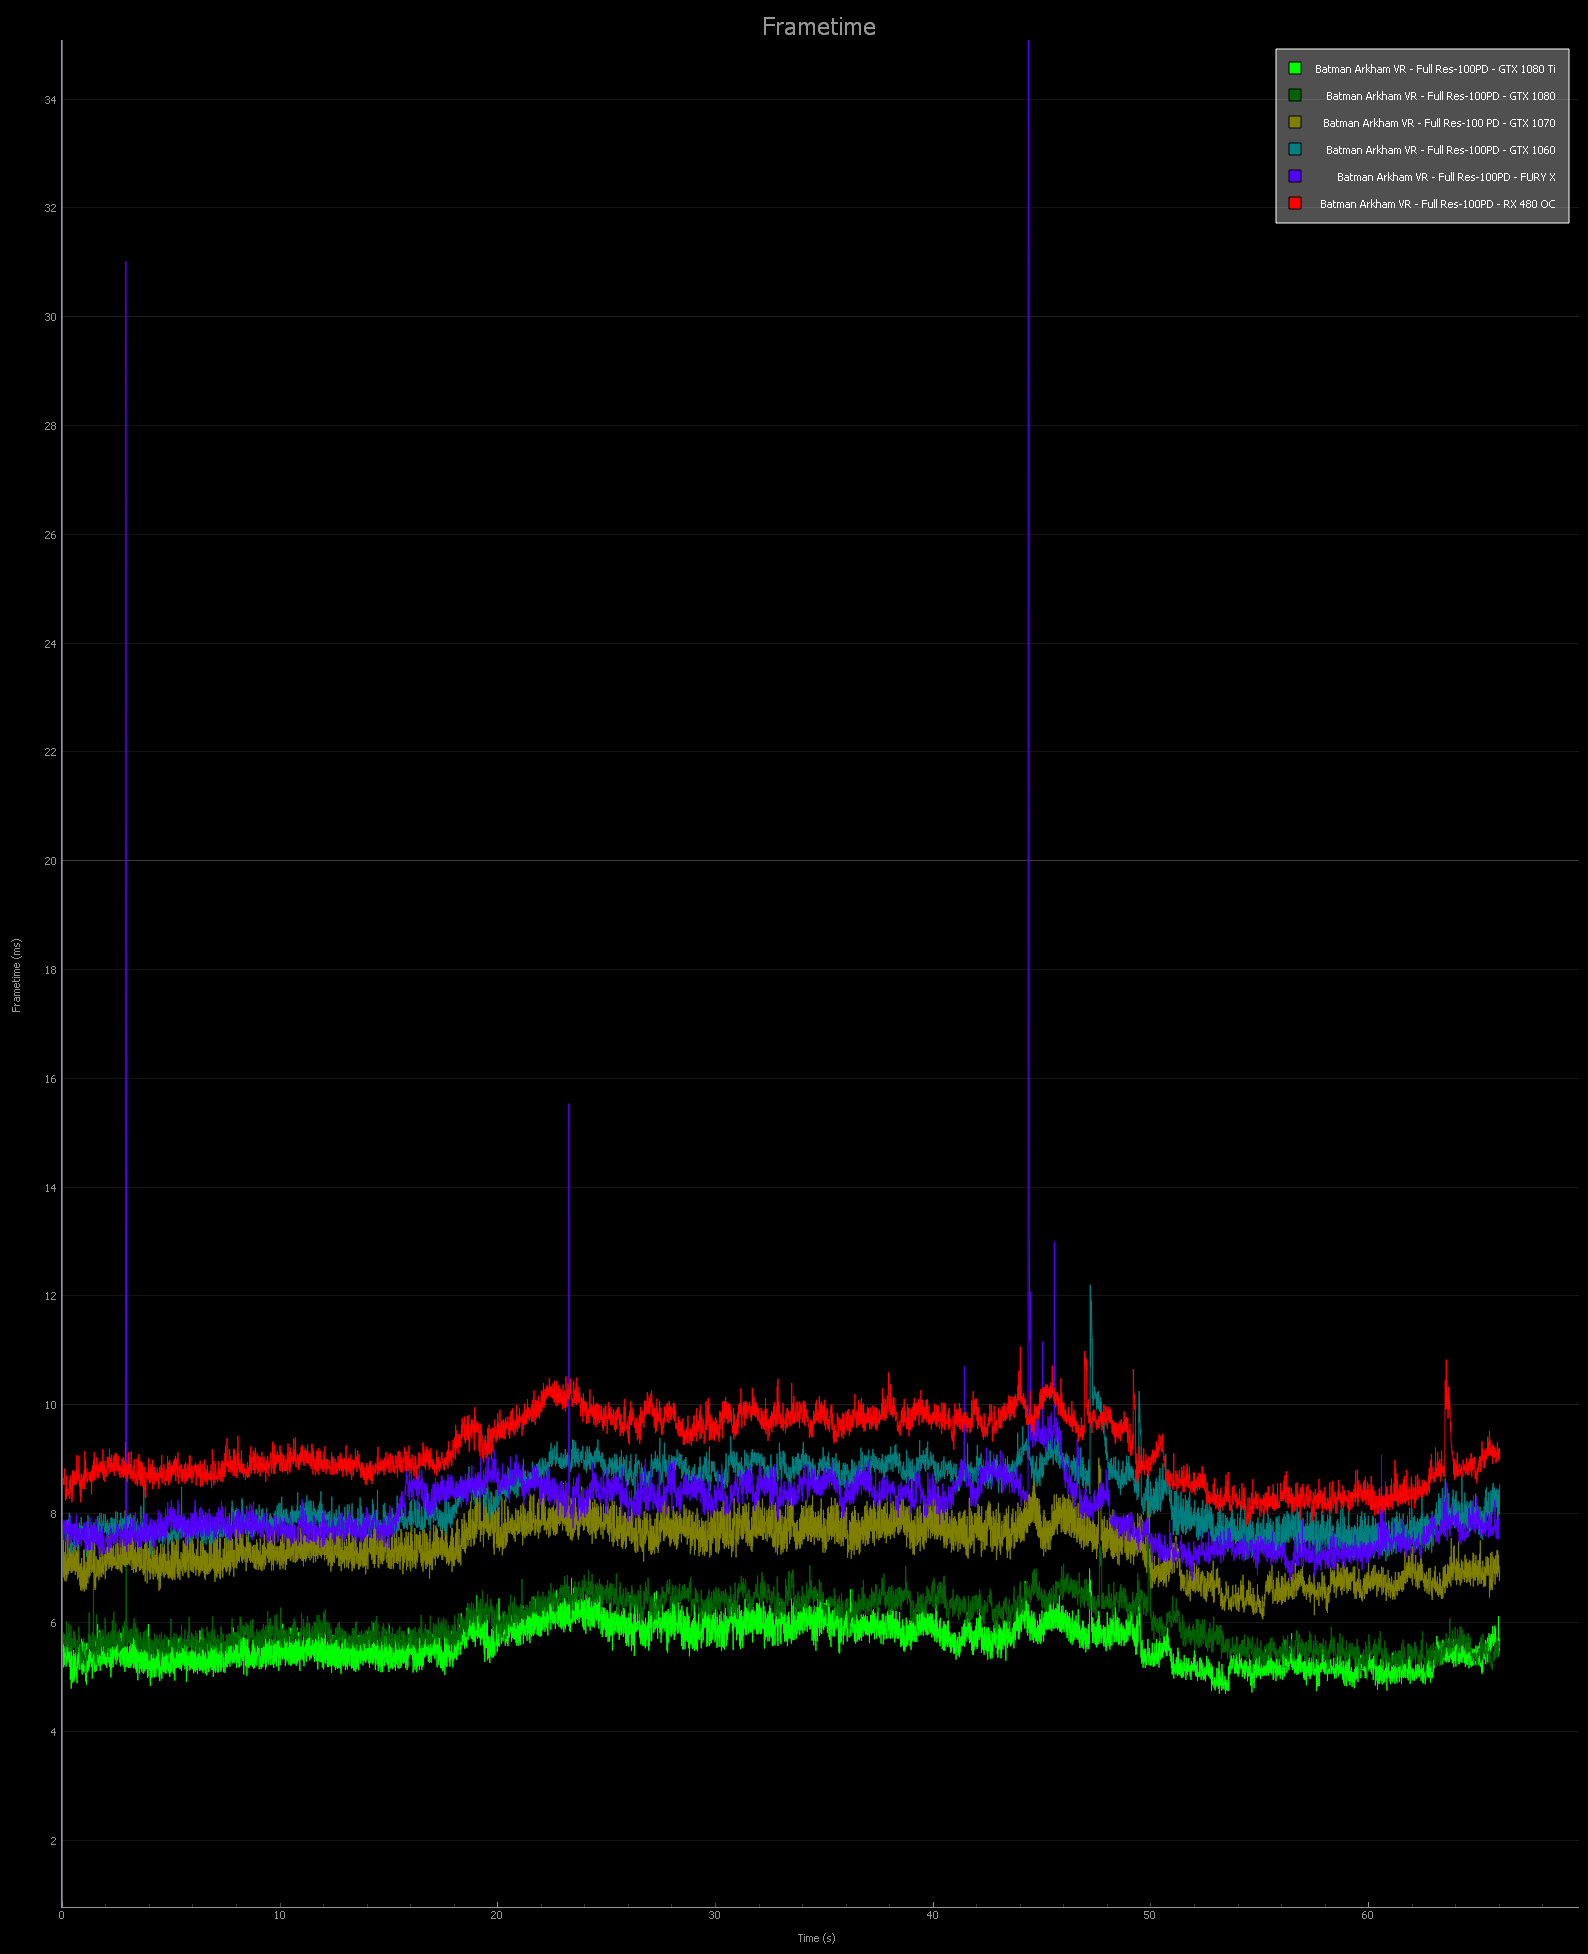
The frames are generally delivered well with the exception of a couple of stutters that do not repeat in the same place for repeated runs. All of our test cards can play at the highest settings, but even with 100% pixel density, the scenes are slightly blurred and there is a minor screendoor effect visible. The holy grail of VR image quality (IQ) would be to increase the Pixel Density significantly, and we arbitrarily picked 200% to really put a strain on our cards so that we could compare “Fix Foviated” versus “MRS” performance.
Here is 200% Pixel Density at the same settings: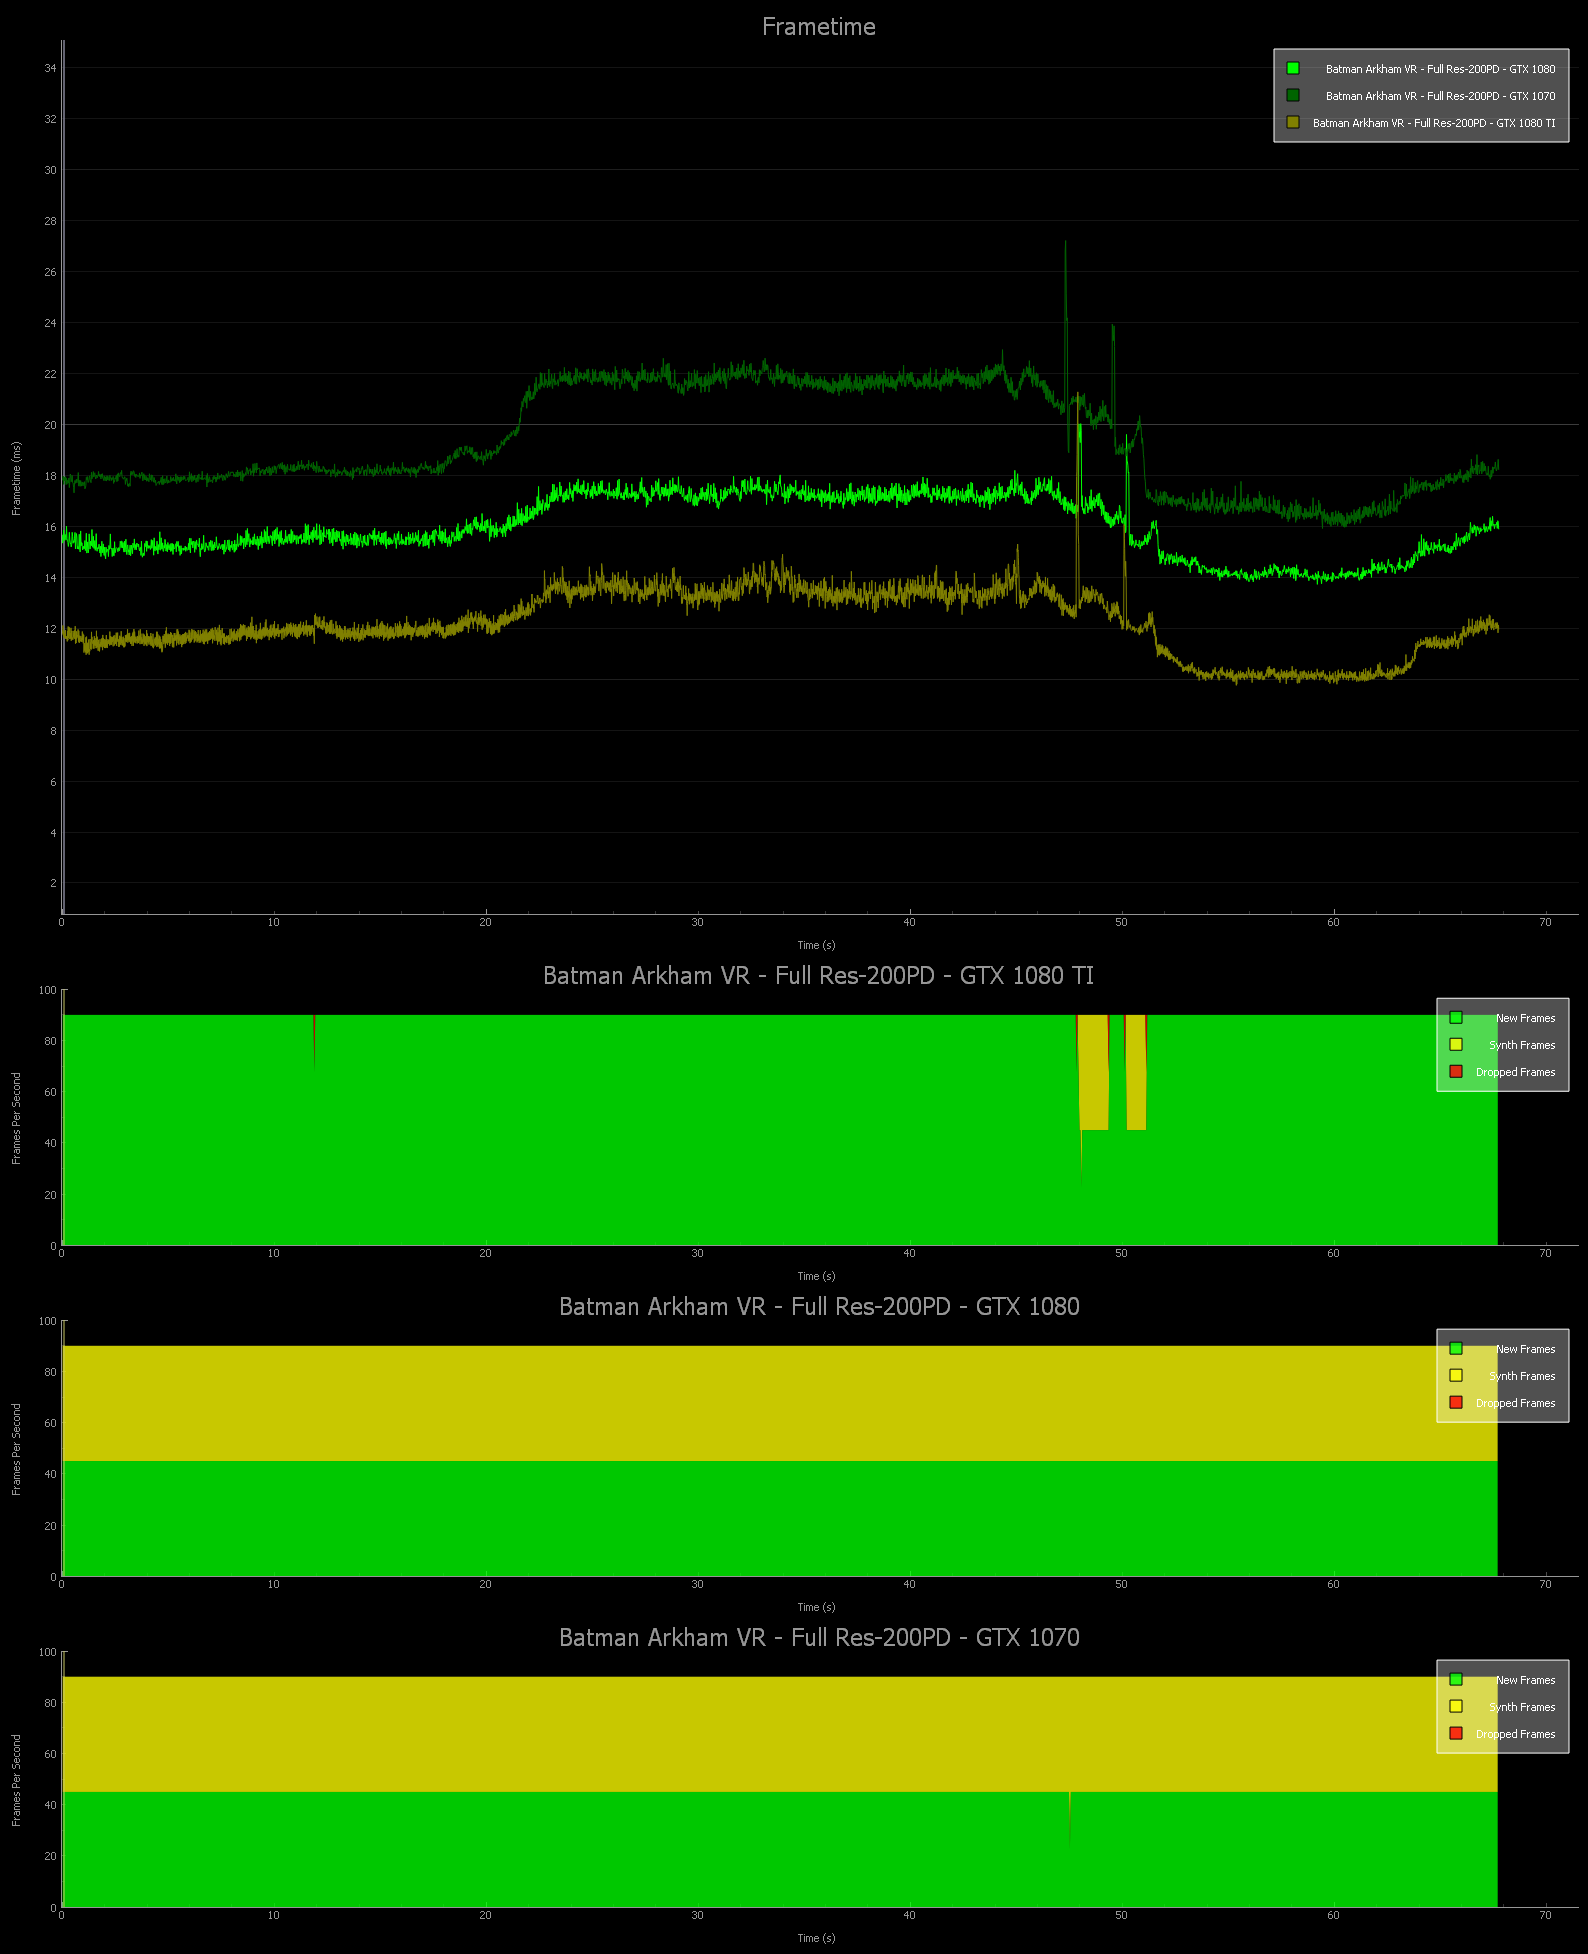
Oh my, even the mighty GTX 1080 Ti goes into reprojection on the most demanding scenes. Fortunately ASW takes care to maintain 90 FPS which is playable in this rather slow-paced game. The graphics at 200% Pixel Density look spectacular in comparison to 100%, however. It is similar to using SuperSampling in PC gaming, and everything appears a bit sharper and aliasing in motion appears to lessen a bit.
Lets see if using NVIDIA’s MRS will allow us to have better performance at the risk of lowered resolution at the periphery.
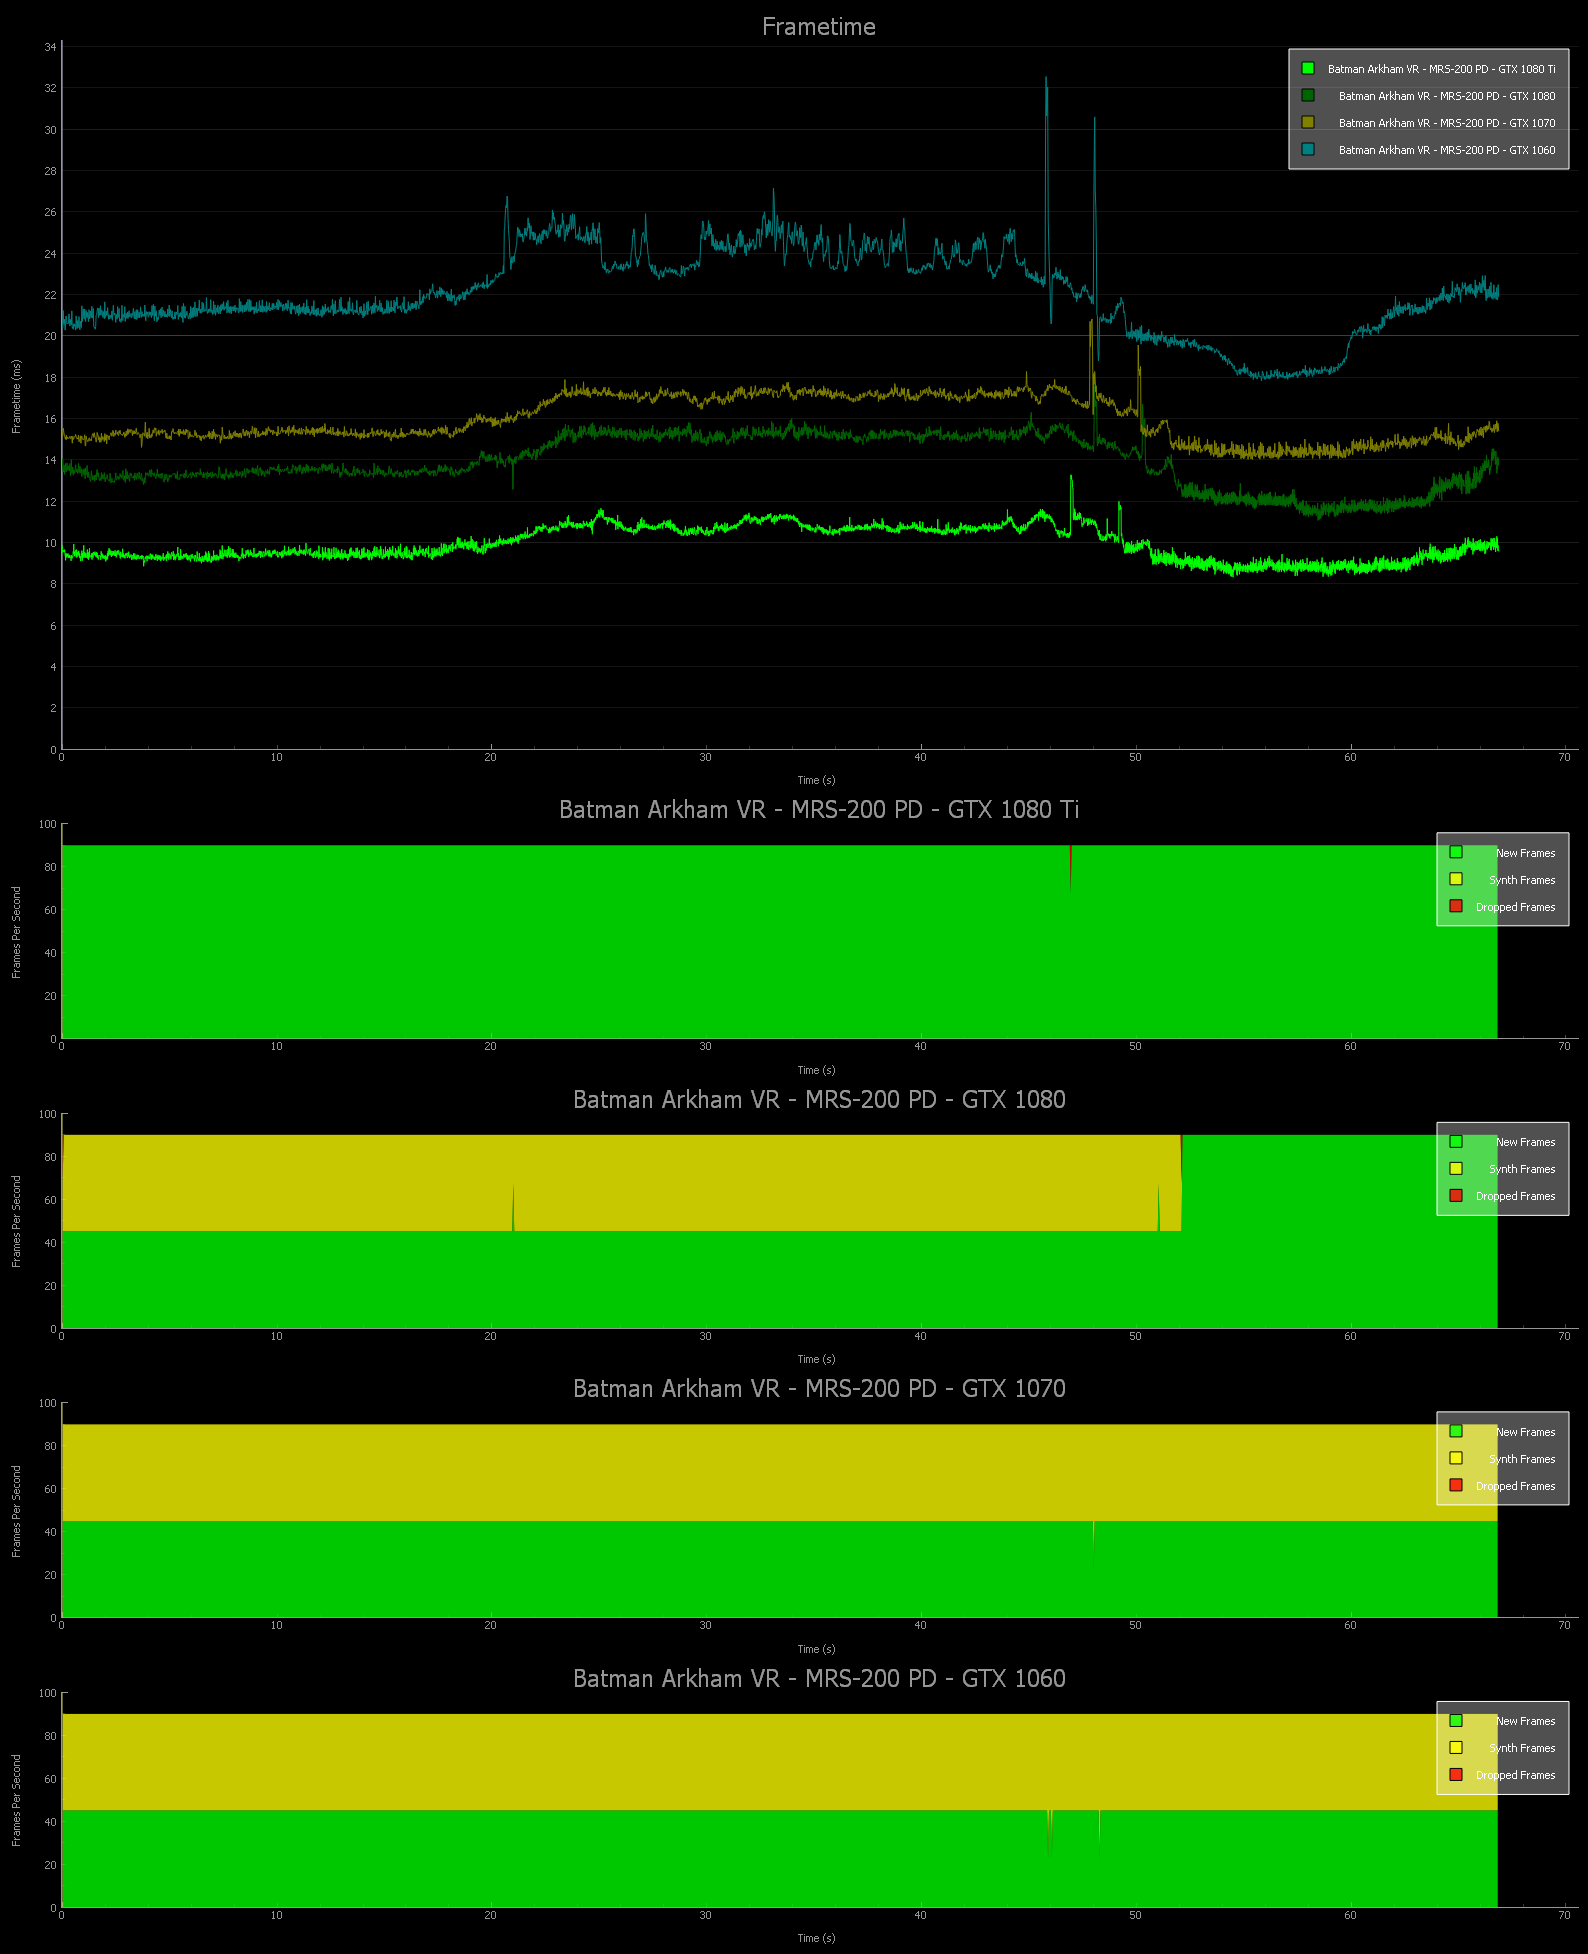
With MRS, the GTX 1080 Ti no longer goes into ASW although the rest of the cards still do. Image quality is still outstanding, and the center of the screen where the action is, does not suffer any image degradation although there is a minor visual impact at the periphery. This editor would prefer to play with MRS on rather than go into reprojection, but it is also easy to decrease the Pixel Density in increments to find a good balance of performance and image quality.

Now let’s compare with “Fix Foviated”.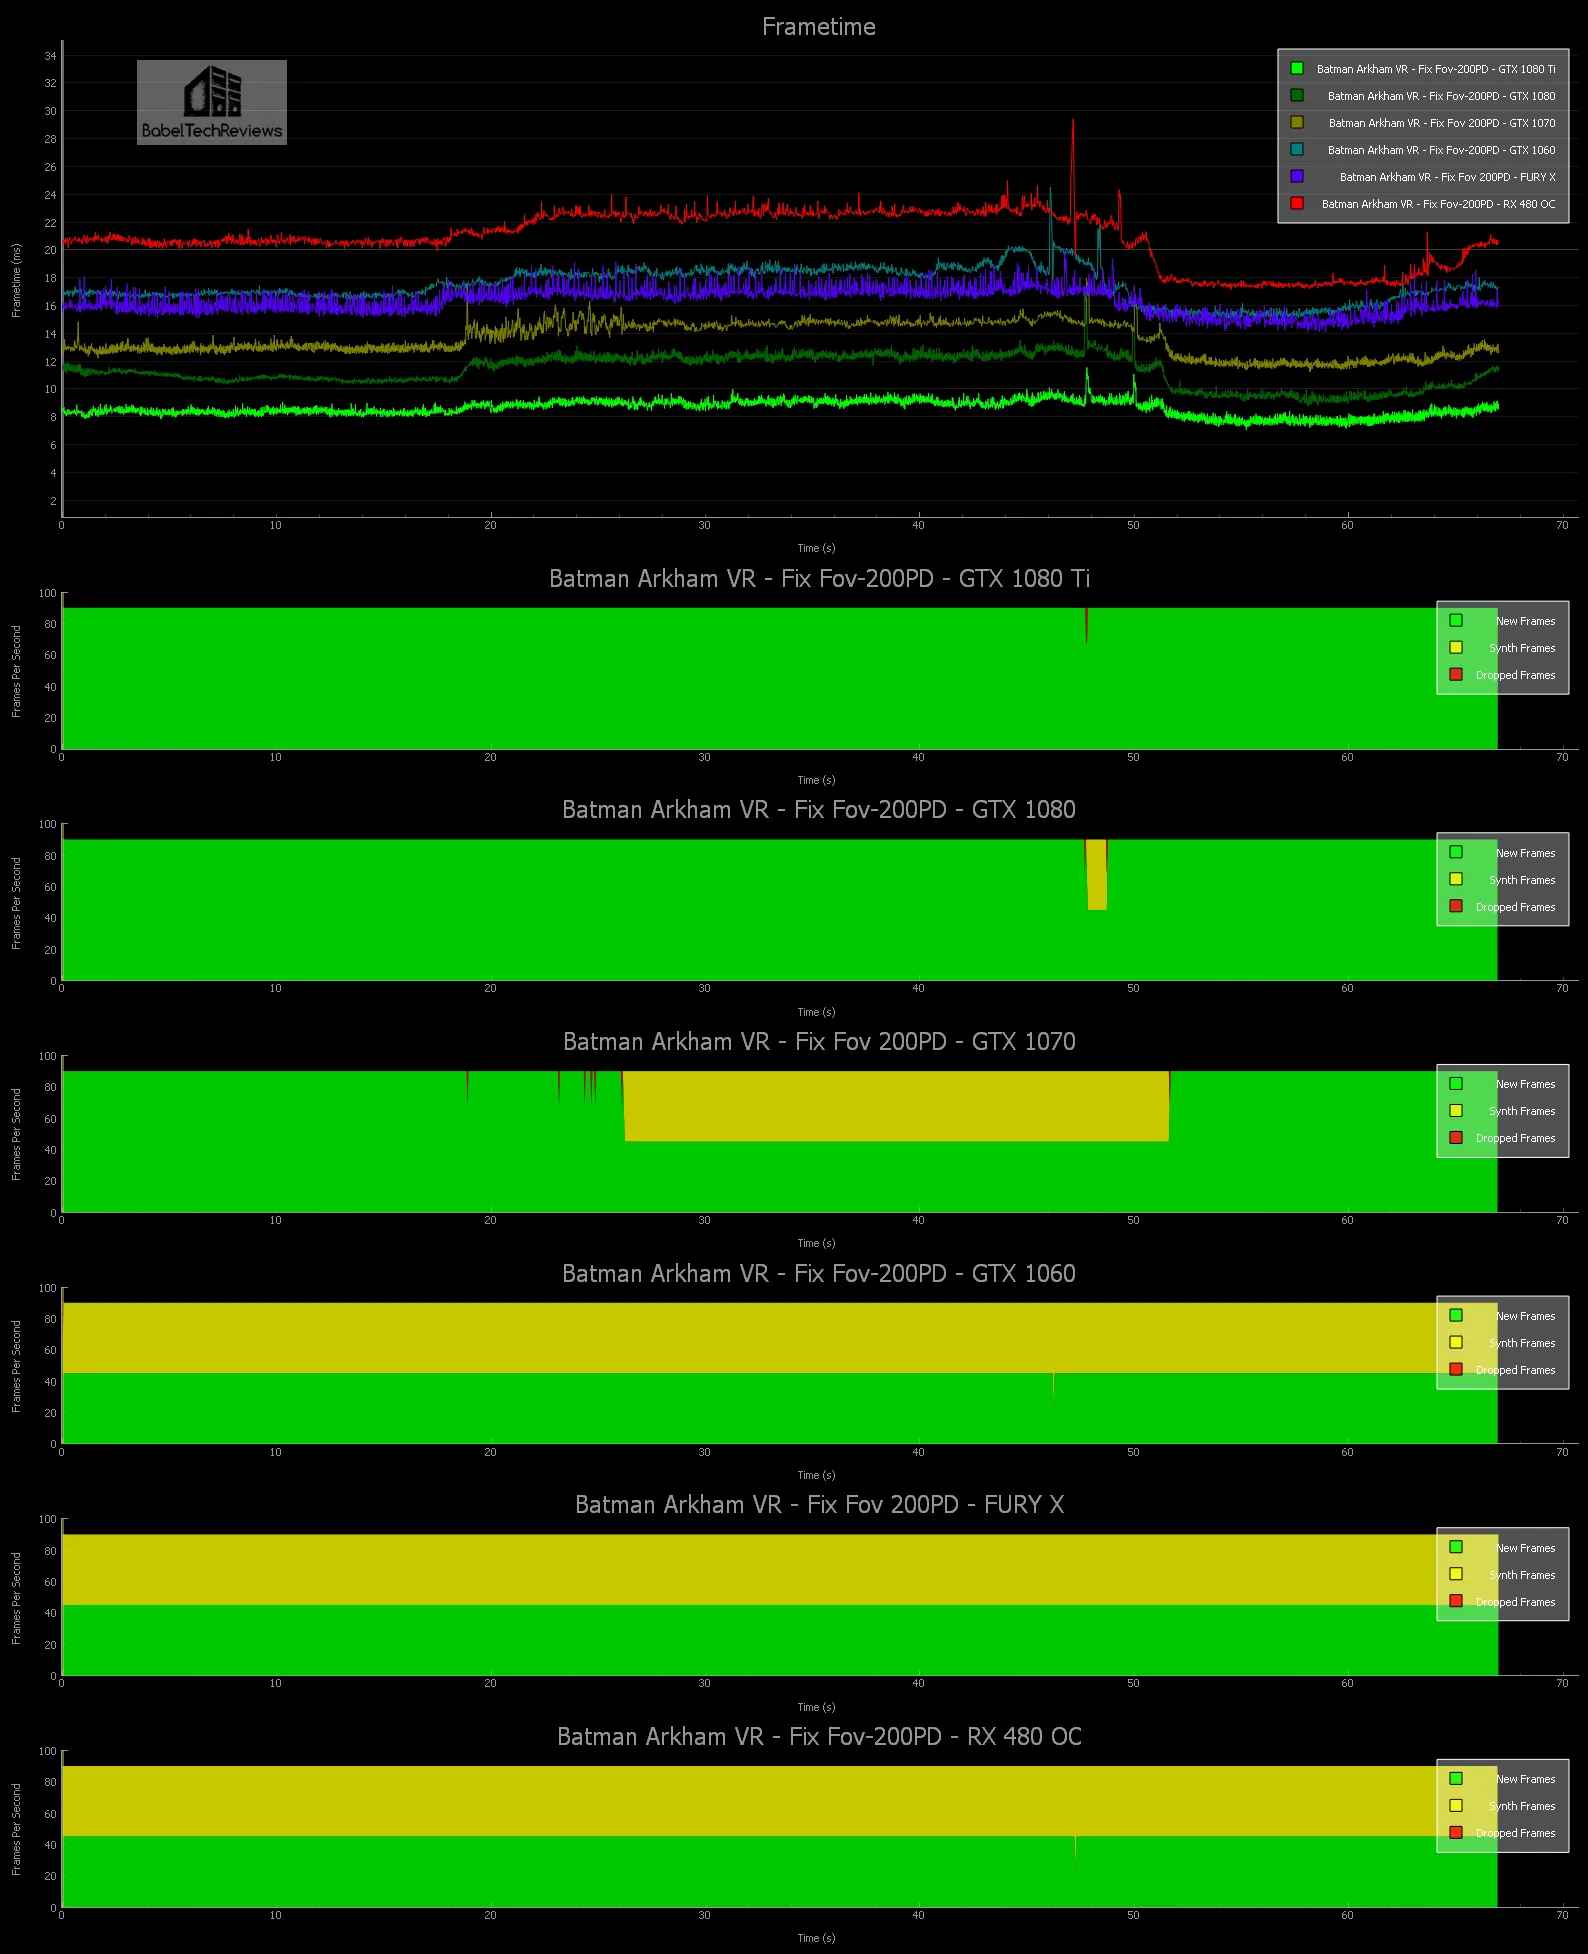
Let’s look at the frametimes more closely from the above graph: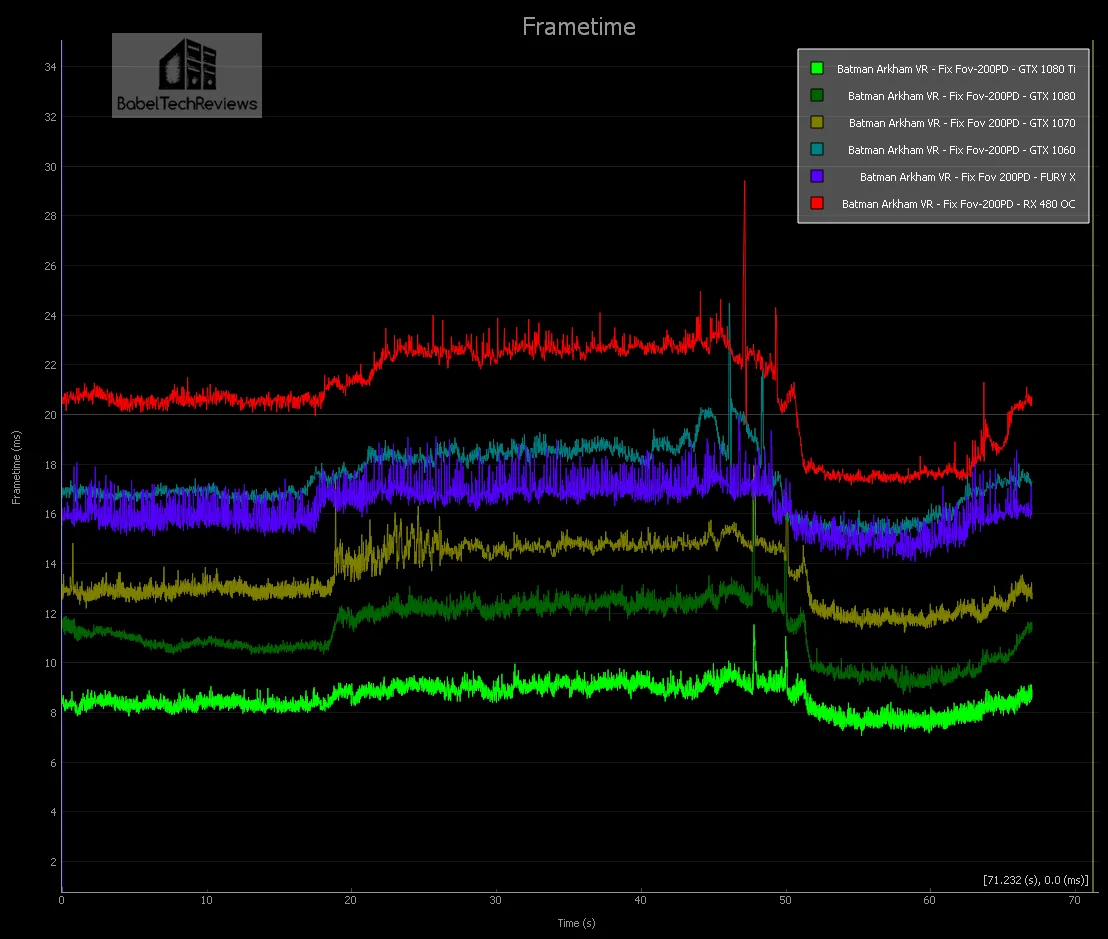
Fix Foviated provides a higher level of performance in Batman Arkham VR than MRS, but at a higher cost of noticeable image degradation. It’s a trade off that allows the GTX 1080 to now play at 200 PD. And both MRS for NVIDIA and Fix Foviated for all cards, provide a good set of options to the player that he might use to get the highest settings and Pixel Density, with the least amount of image degradation and minimal latency.
Let’s look at Robo Recall and Serious Sam: The Last Hope next.
Robo Recall
Robo Recall is a really fun game by Epic Games, the devs who brought us Showdown and Bullet Train. Showdown was the concept of battling robots in a city, while Bullet Train demo perfected teleportation as a good way to move about the VR world without breaking immersion or causing VR sickness. The game is a lot of fun, and we would be inclined to give it an “8.5”.
In this game you are given the task of “recalling” defective robots, and your method of dispatching them is varied and fun. You can reach for your holsters to get your handguns or you can reach over the shoulder for a shotgun. The Robot AI is poor, but the make up for it in numbers and with different patterns of attack. You also can swat enemy bullets back at the robots, and even tear them limb from limb and use their broken parts to beat other robots into parts.
Robo Recall is a well-crafted game and the audio is excellent, plus the comfort level is outstanding. The only issue is that it is rather short. You can play through all nine missions in a few hours and if you want to collect everything, you might put ten hours total into it.
Robo Recall has several important settings and we picked the highest at 100% Pixel Density. It seems to be sufficient for the high quality graphics whereas Batman Arkham VR seems to benefit a little more by increasing the Pixel Density. MSAA is really helpful to sharpen the image, and high quality is noticeably better than low. Unlike with Showdown where the shadows are faked, Indirect Shadows can be turned on as well as Planar Reflections which add to the immersion.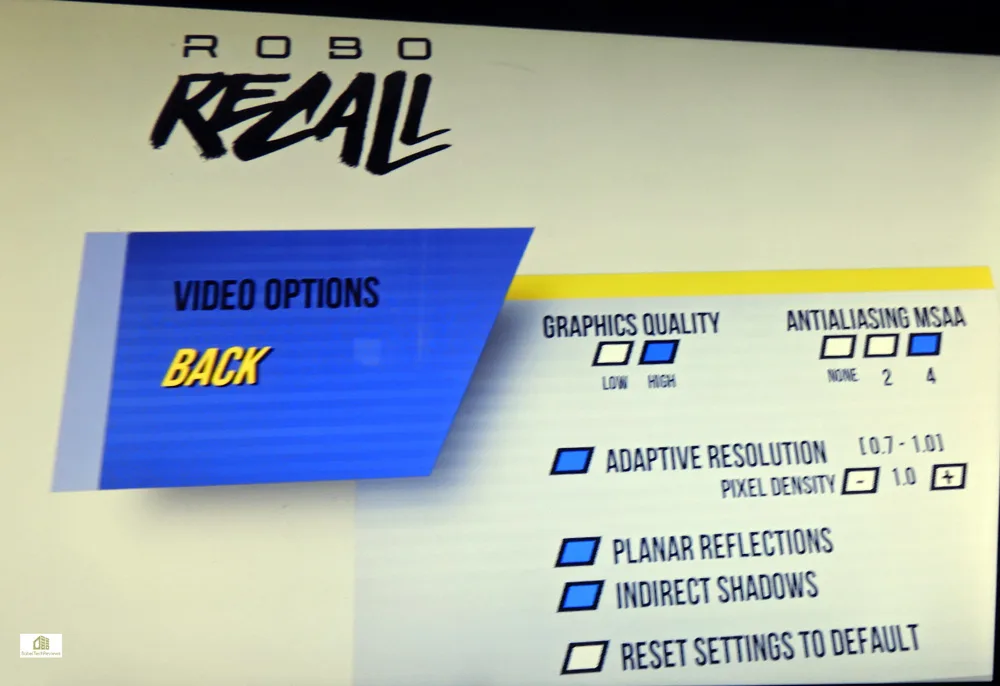
Here is the Robo Recall performance graph: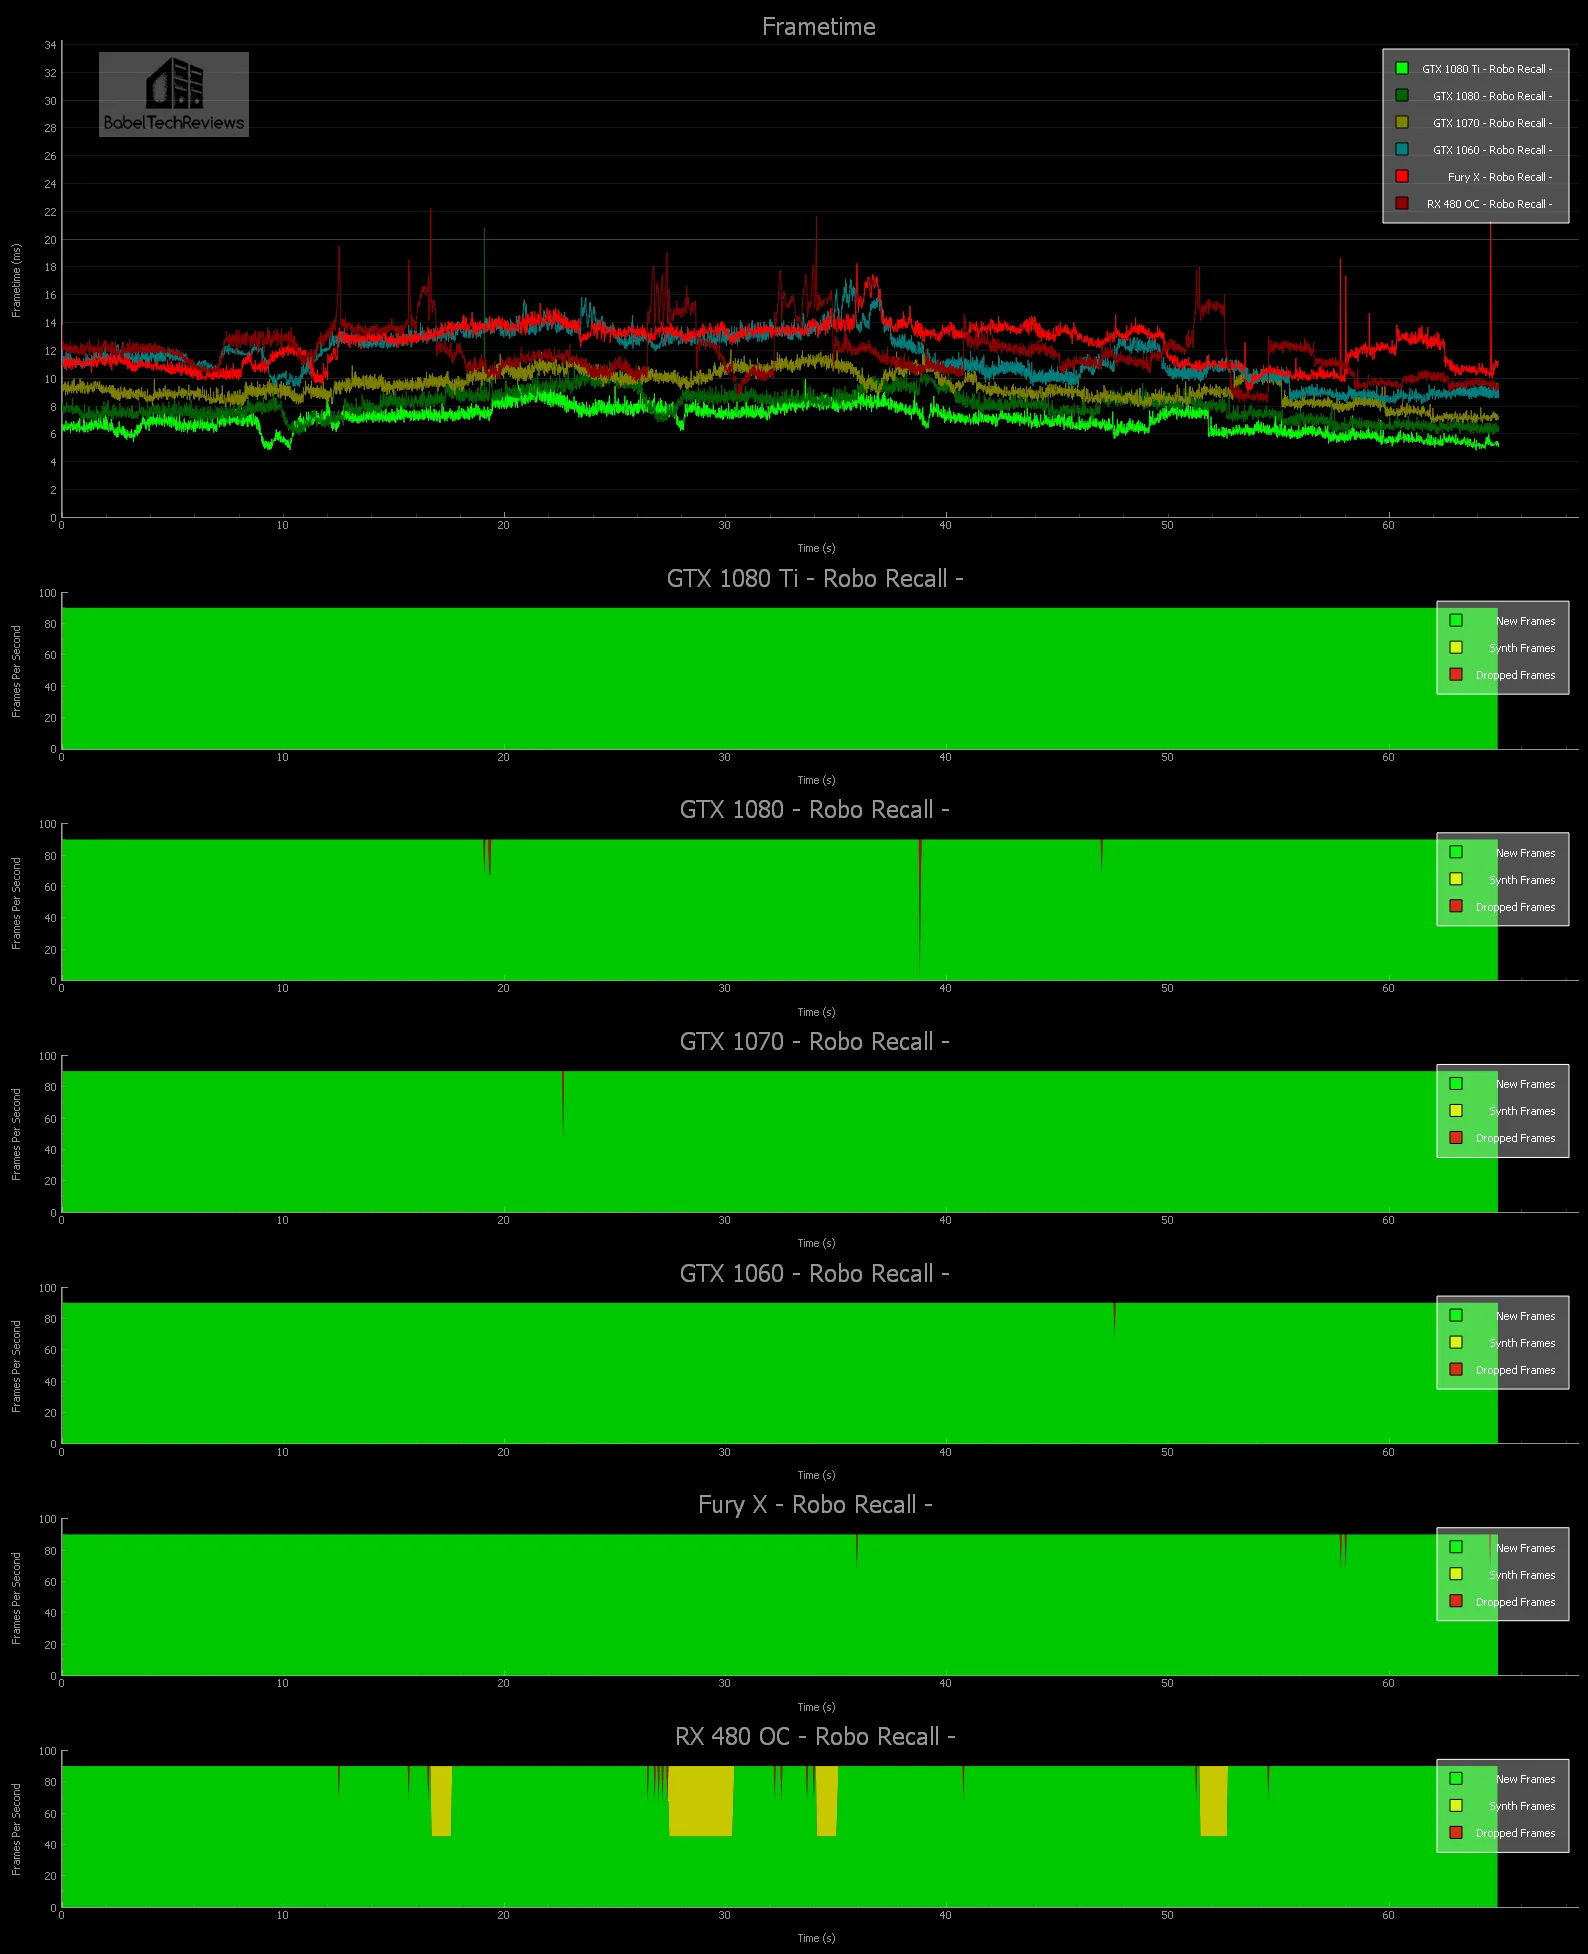
Now let’s look more closely at just the frametimes: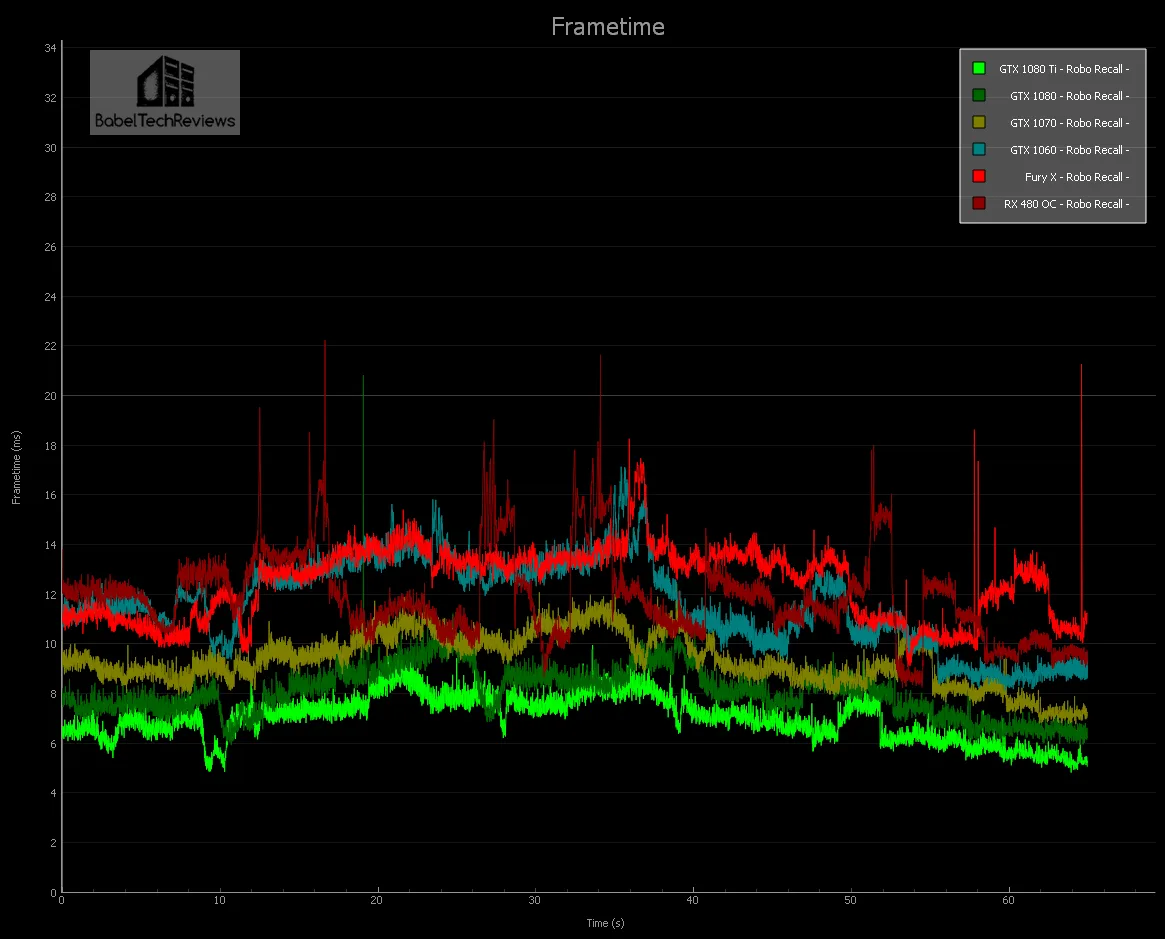
All of our cards do OK and the top 3 cards do not go into any reprojection at all – the GTX 1080 Ti manages 147 unconstrained FPS, the 1080 averages 125 while the GTX 1070 gets 110 FPS. The other three cards can also play Robo Recall at the highest settings at 100% Pixel Density although all of them deliver unconstrained FPS in the mid-80s. This game is recommended, and like the following game, Serious Sam: The Last Hope, there is a lot of dark humor.
Serious Sam: The Last Hope
Serious Sam The Last Hope is a lot of fun and is also very good for benching. There was a large patch released last week that completed the number of planets that were promised, and it appears to get more challenging as one continues to play.  Serious Sam: The Last Hope is a lot different from the Serious Sam PC games as you are in a theater-like setting facing forward in a mostly fixed position while you are rushed by many waves of enemies from the front, left and right sides. Unlike the PC version, you have real 2-handed gunplay and can use different strategies.
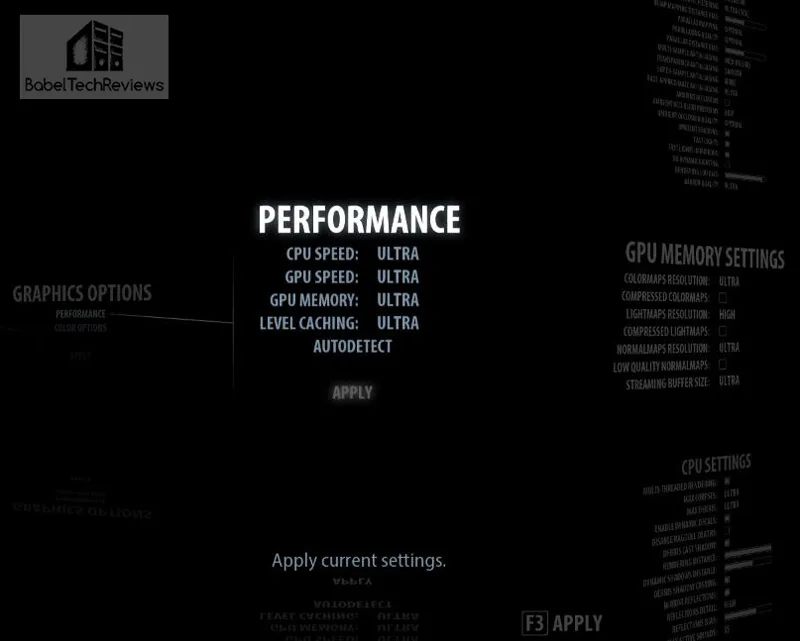
A player needs to check the settings each time they install a new GPU as it will autodetect and overwrite previous settings. Playing Serious Sam with the Touch controllers is an absolutely amazing experience. It reminds me of the first time I started playing Serious Sam and just fell in love with the series on PC. But playing in VR is far more intense! You start out easy with a couple of pistols and then enemies come at you, then more and more – just like with the PC version, but you are able to use each pistol much more independently of the other one and you naturally find yourself concentrating the fire of both pistols on harder enemies as you shoot up and down and from side to side. It is similar to playing in 3D, but this time, you feel that you are inside of the game.
The action happens in a 180 degree area in front of you and the enemies will sneak up on your left and right sides if you are not paying attention.
Extra ammo and health appear in the sky above you as targets, and shooting them gives you refills. As you clear sections and progress to the next level, you are awarded cash to buy health and more varied and more powerful weapons – and you will need them as the screen just fills with enemies. You can shoot down their energy beams or rockets or other projectiles that the NPCs fire at you. The headless suicide bombers are even more intense when they rush you in VR and I winced a few times when they exploded right near me.
Large guns actually “feel” like large guns and you even have the chainsaw. As you progress into higher levels, the platform you are standing or sitting on begins to rise and you feel that the floor you are on is actually moving and you are going up, giving it a completely new dimension. You can look down – way down – and way up, and get a real sensation of height. I found it to be a game that I could not put down, and I would score it close to a “9”.
There are more options that can be customized individually, but we picked default Ultra or default High, depending on the card’s capability.
Here are the graphs using all-Ultra settings: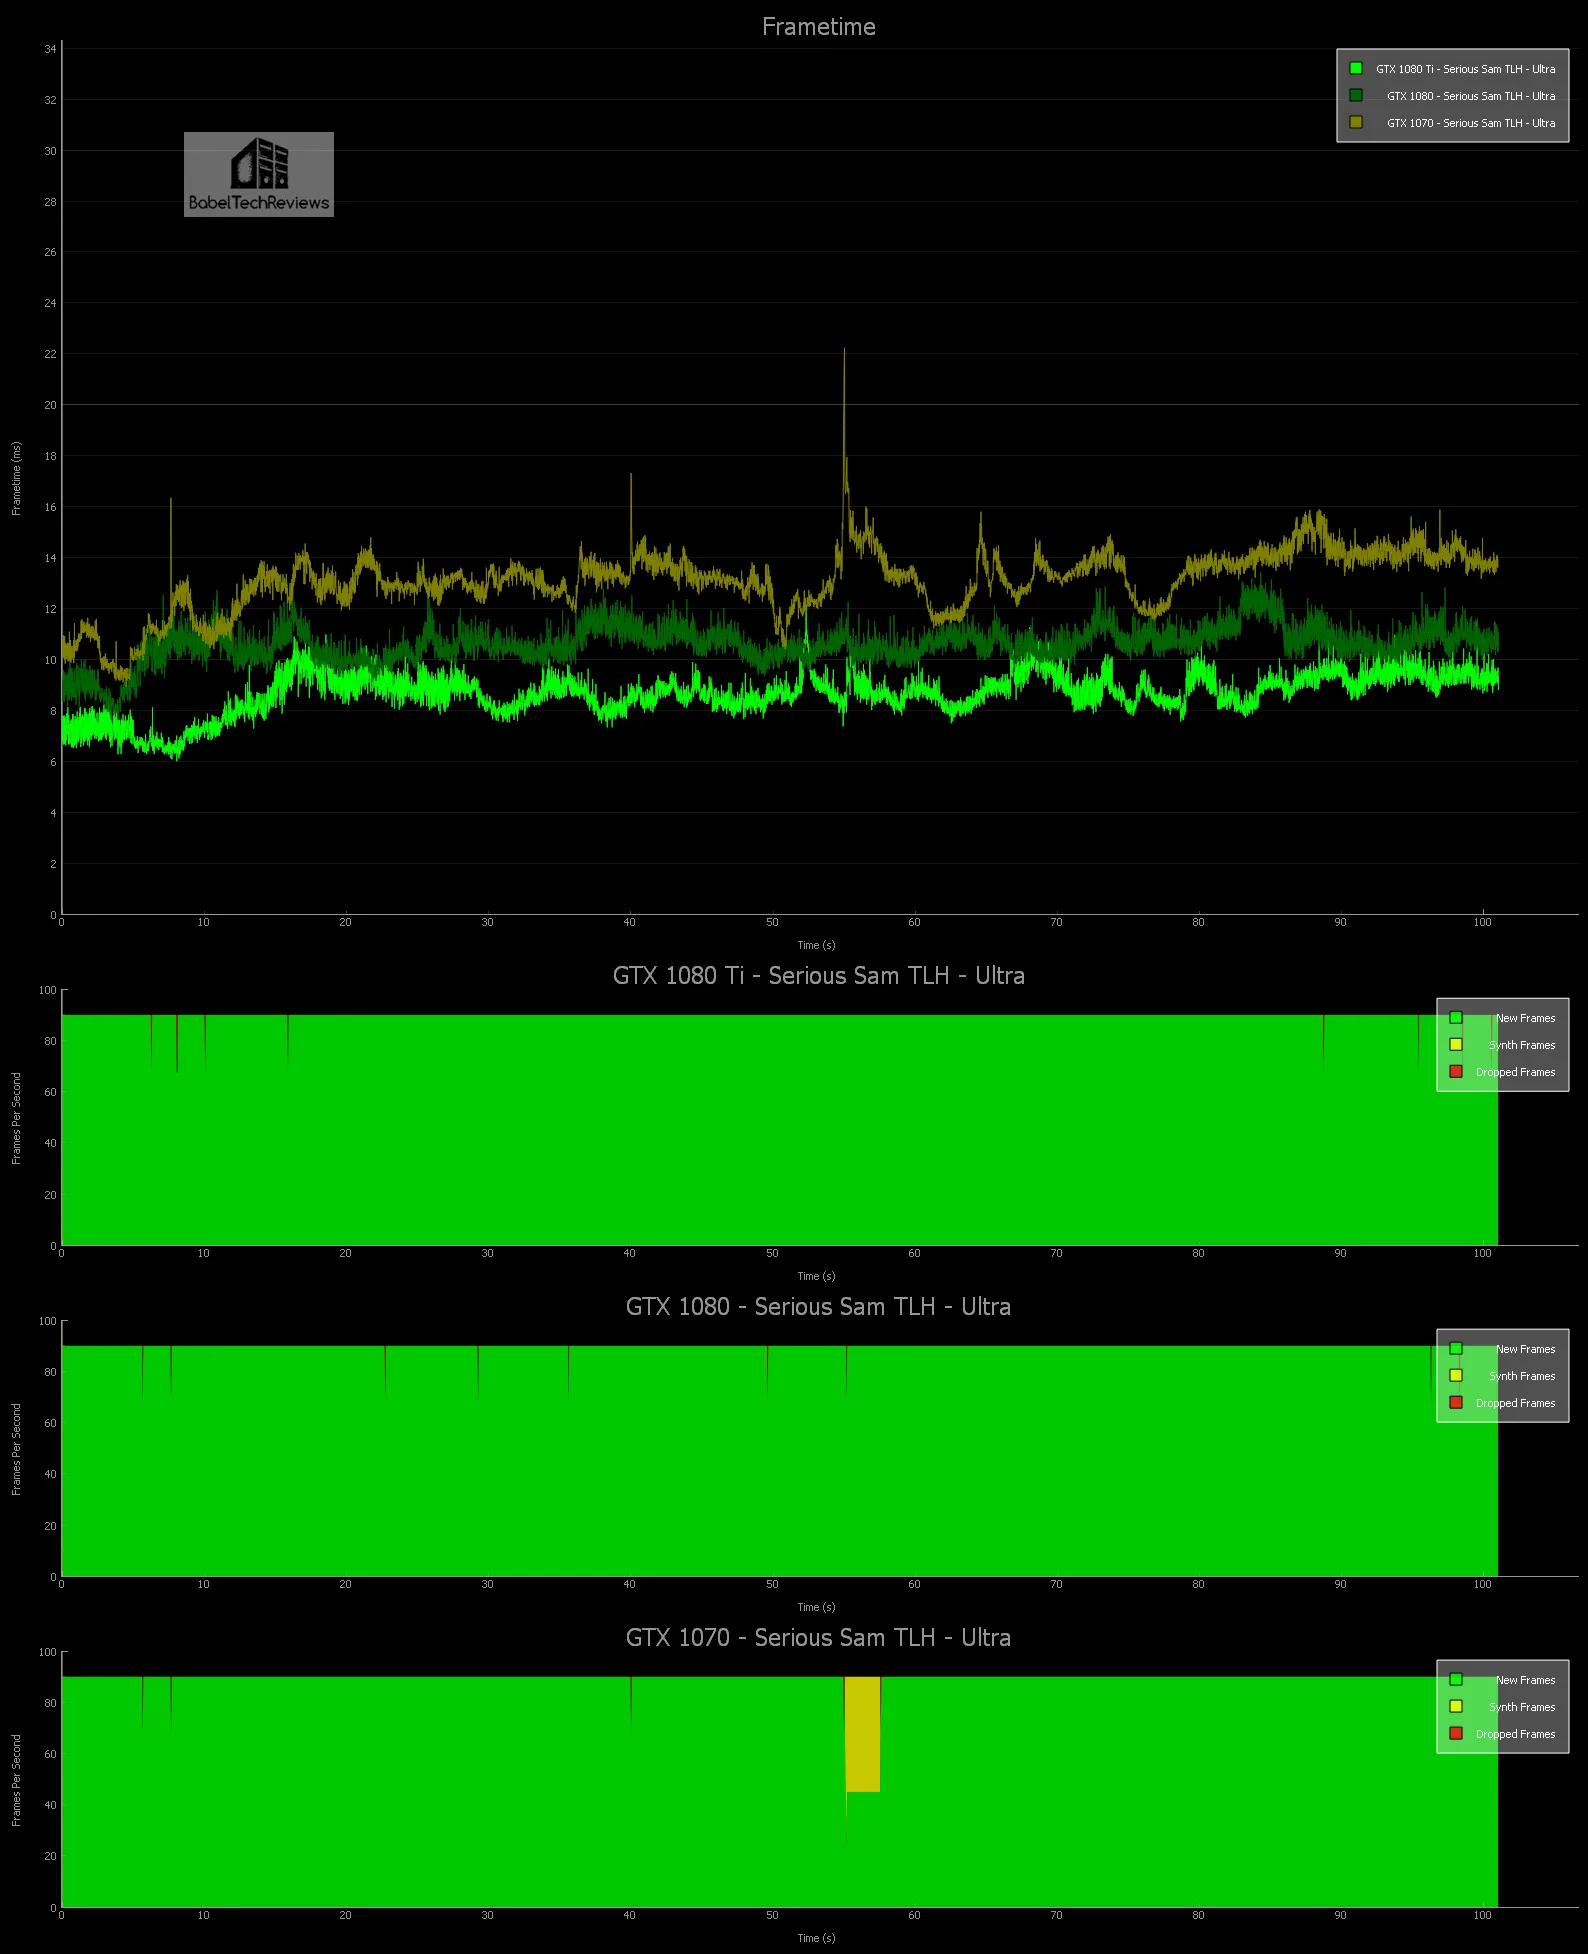
The GTX 1080 Ti with 115 unconstrained average FPS or the GTX 1080 with 94 FPS both show no need for reprojection although the GTX 1070 at 75 unconstrained FPS falls to 45 FPS with ASW when it gets really crowded with enemies mobbing the player.
Here are the High settings graphed:
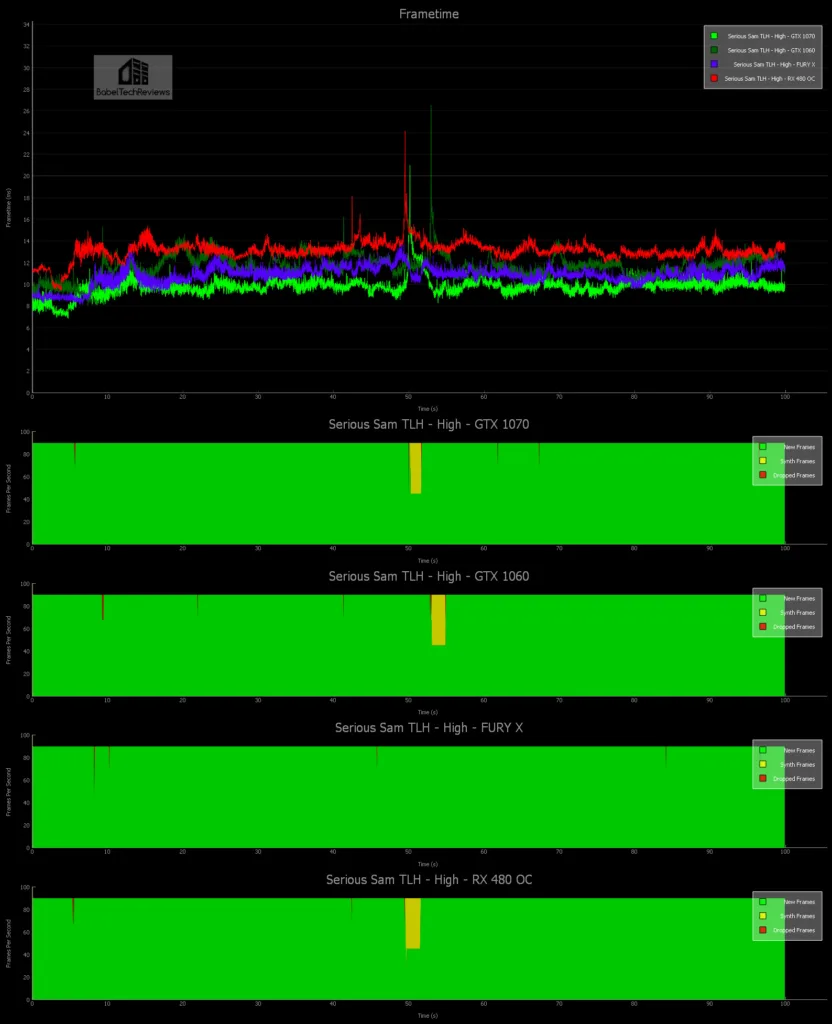
Surprisingly, only the Fury X with an unconstrained FPS of 92 average has no reprojection while the other 3 cards suffer with ASW for brief moments with the settings on High even though the GTX 1070 averages 102 unconstrained FPS. The GTX 1060 manages 86 unconstrained FPS while the RX 480 OC can only manage 76 FPS.
Unconstrained Framerate Chart
Unconstrained FPS are data produced by the FCAT VR which is just the 1000/average frametime that is good supporting evidence for the graphs that were presented above. In the graphs, it is important to realize that lower (latency) is better, while for unconstrained FPS, higher is better. Unconstrained FPS is based on the average frametime of each frame for the duration of the benchmark. Some frames may render quickly, others very slow. The very slow ones may throw off the average.
Delivered FPS is based on the number of new frames that are actually displayed in the HMD. If a frame takes too longer to render, it can still be dropped and thus Delivered FPS will never exceed 90 on the current HMDs although it’s possible for Delivered FPS to be higher than Unconstrained FPS.
Here are unconstrained FPS which allows us to see how quickly the system could have displayed the frames if not for the fixed 90 Hz refresh cadence.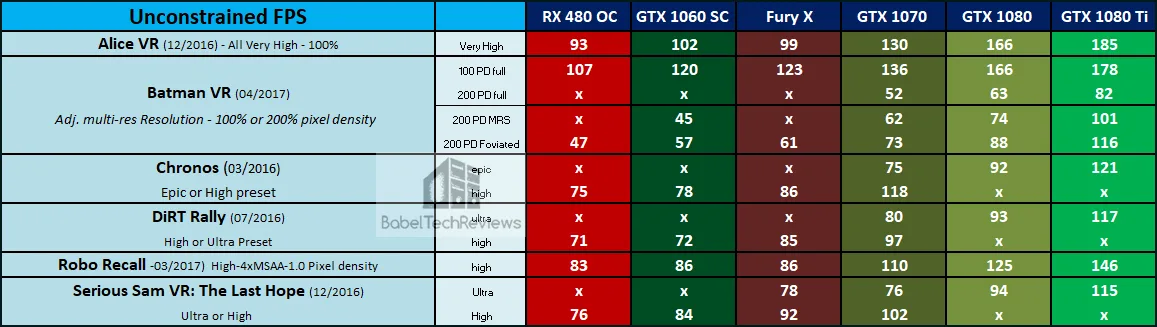
These FPS or Framerates are averaged over multiple benchmark runs and may not match up with each graph exactly although they are close. But as you can see, the cards are ranked in terms of performance using these six VR game benchmarks, from lowest to highest, from left to right.
Let’s head for our conclusion.
The VR “experience”
VR appears to be catching on, and as technological improvements bring smaller and lighter wireless HMDs together with higher resolution and more powerful PCs to power them at a lower price, we will probably see mass acceptance. At E3 we saw Doom VR and Fallout 4 being released for VR, and other AAA VR titles are on the way. We feel that it is important to understand and compare performance of VR games across competing video cards so as to make informed choices. It is important to get a judder-free VR experience as your health is literally at stake!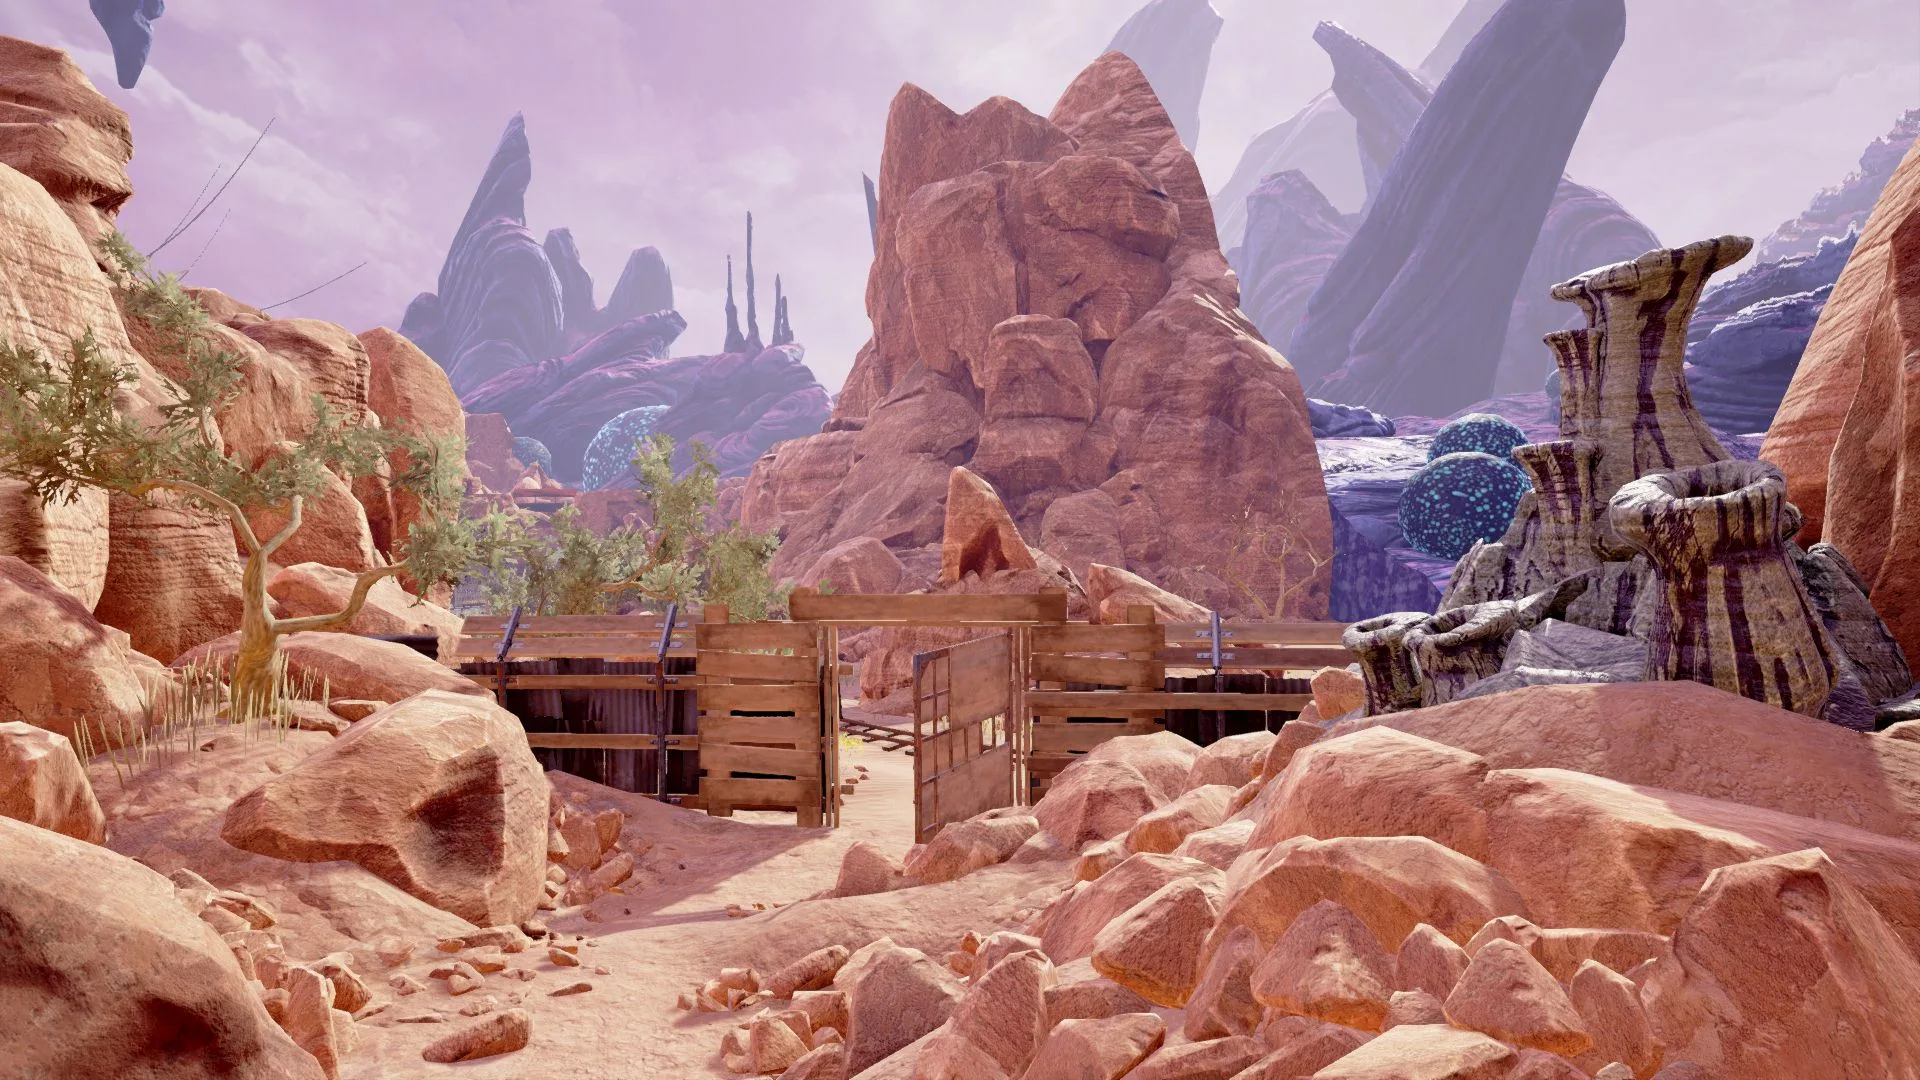
We also want to give a thank-you to NVIDIA for making FCAT VR available freely to everyone and for their assistance in helping us with benchmarking VR titles. BTR plans to stay at the forefront of this VR “revolution” and we will add VR benching to all of our video card reviews in addition to reviewing the latest PC games. In part 3 of Oculus Rift VR benching we will focus on the performance of four more video games for a total of ten games for our benching suite – Star Trek Bridge Crew, Battlezone, Obduction, and The Unspoken – and we plan to review new VR games as they are released. Plus we will update our 10-game VR benching suite just as we update our 25-game PC benching suite.
And our next update will be from E3 in Los Angeles this week where we will focus on PC and VR gaming.
Happy Gaming!
Comments are closed.