Has Nvidia neglected Kepler? This evaluation will revisit 13 games from our Kepler GTX 780 Ti launch evaluation which was originally published on November 7, 2013. We focused on its performance versus the then recently released R9 290X, and also versus the original $1000 Titan. We will use 13 of the same games that we benched then with the GTX 780 Ti launch drivers, and compare them with the very latest drivers available today using these very same three video cards. Also, we will also feature these cards in our very latest 25-game benchmark suite to compare them with the top cards of today for a much bigger picture.
The GTX 780 Ti was released in 2013, not long after AMD’s launch of the R9 290X at $550 which beat the $1,000 Titan. Nvidia wasted no time in releasing the 780 Ti as their flagship card at $699 which soundly beat the Titan and also beat the 290X. However, in the 2-1/2 years since then, Nvidia has refreshed their architecture completely with Maxwell, replacing the Kepler GTX 780 Ti with the faster and cheaper GTX 980, followed by the Titan X, and then by their even faster GTX 980 Ti gaming flagship. However, although AMD introduced new Fiji architecture with the Fury lineup, the Hawaii 290X was not refreshed, but rather rebranded into a Grenada 390X by increasing the reference vRAM capacity from 4GB to faster 8GB GDDR5 with tighter timings.
Although the Maxwell GTX 980 still trades blows with the Fury X at 1920×1080 and the GTX 980 Tis is faster than either card for most games and resolutions, the Kepler GTX 780 Ti appears to have gotten slower compared with the 290X in newer games. We want to see if the 3GB limitation of the vRAM is an issue by comparing it with the original Titan 6GB and with the 290X 4GB. Has Nvidia neglected Kepler in favor of the newer Maxwell architecture, or has AMD simply continued optimizing for Hawaii/Grenada as their Hawaii/Grenada architecture has not changed for more than 2 years?
When it launched in 2013, the GTX 780 Ti was solidly faster than the original Titan, and it also beat the 290X. However, that was 2-1/2 years ago, and PC games have become far more demanding. The newest generation of consoles and console ports to PC have placed new demands on lower-capacity vRAM-equipped video cards.
Below is the main performance chart from the GTX 980 Ti Launch Evaluation article published by AlienBabelTech in 2013.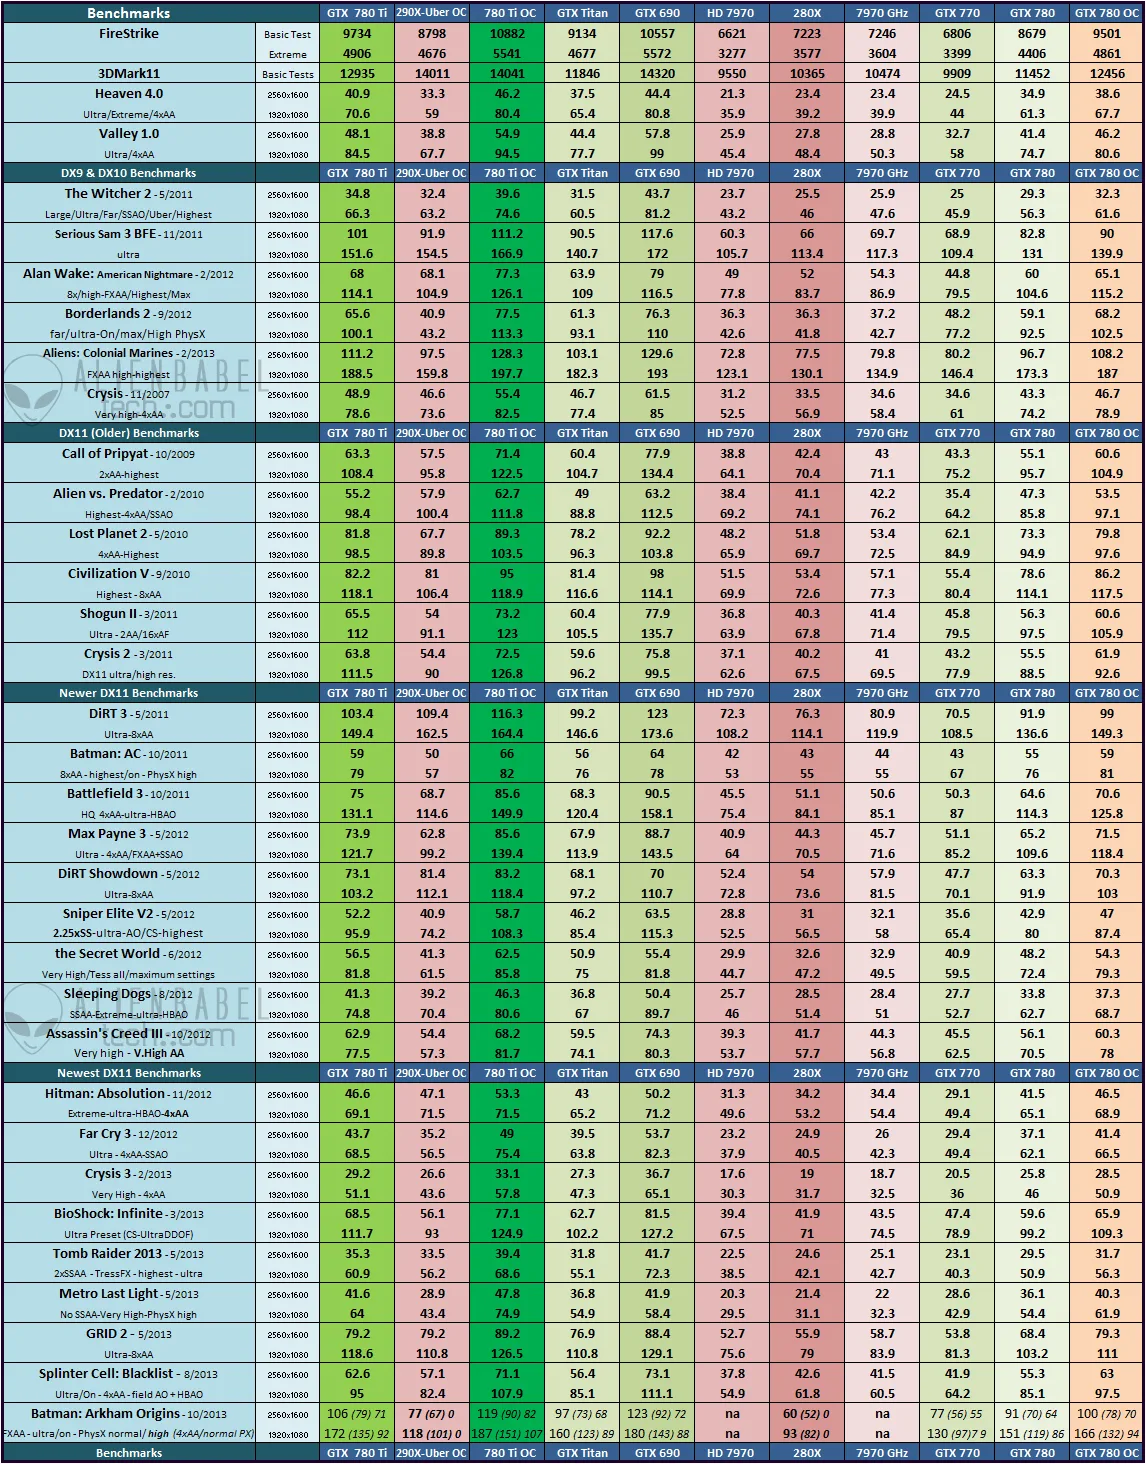
Our game benchmark suite has changed from 2013 as we always strive to update our tested games to include the latest and most popular titles at the time of writing. We have also added minimum frame rates in addition to averages, and we are now testing at resolutions up to 4K, with a strong emphasis on the very latest games. We now benchmark at 2560×1440 instead of at 2560×1600, but we have returned to benching 13 of these original games at that resolution to compare our current results with the above chart. We also want to see how these formerly flagship GPUs stand now in relation to each other by playing the latest games with updated drivers at demanding settings that we usually bench at as well as by replicating the test conditions of our 2013 GTX 780 Ti launch evaluation article as well as we can.
Over the past 2 years, Nvidia has reworked their Kepler architecture into the even more efficient Maxwell, and the 6GB vRAM-equipped GTX 980 Ti has replaced the Kepler 3GB GTX 780 Ti as a faster and more power-efficient GPU flagship by Nvidia in their line-up. We want to test how well our original R9 290X performs after also being degraded as AMD’s flagship, and after being replaced by the nearly identical 390X, and by the Fury X as the current flagship. We want to see how the 290X can perform now against our same reference GTX 780 Ti about 2-1/2 years after their respective launches. And we will also test the Titan to see if its 6GB of vRAM has made any practical difference over using 3GB or 4GB vRAM.
It will be interesting to see which of our three featured GPU turned out to be more “future proof”, and if the 3GB of vRAM that the GTX 780 Ti is equipped with has any current disadvantage. So let’s compare today’s performance of the GTX 780 Ti versus the R9 290X and versus the GTX Titan after we look over our test configurations on the next page.
Test Configuration – Today’s Hardware
- Intel Core i7-4790K (reference 4.0GHz, HyperThreading On, and Turbo Boost for all 4 cores is locked to 4.4GHz by the MB BIOS; DX11 CPU graphics), supplied by Intel.
- ASUS Z97-E motherboard (Intel Z97 chipset, latest BIOS, PCIe 3.0 specification, CrossFire/SLI 8x+8x)
- Kingston 16 GB HyperX Beast DDR3 RAM (2×8 GB, dual-channel at 2133MHz, supplied by Kingston)
- GTX 780 Ti, 3GB, reference clocks, supplied by Nvidia
- GTX Titan, 6GB, reference clocks, supplied by Nvidia
- PowerColor R9 290X PCS+ 4GB; original reference version factory clocked at 1030Mhz Uber clocks, and with the fan allowed to spin up to 100% to prevent throttling.
- GeForce GTX 680, 2GB, reference clocks, supplied by Nvidia
- PowerColor HD 7970, 3GB, reference clocks
- GeForce GTX 980 Ti, 6GB reference clocks, supplied by Nvidia
- EVGA GTX 980 Ti SC, 6GB, at reference clocks in SLI, supplied by EVGA
- GeForce GTX 980, 4GB, reference clocks, supplied by Nvidia
- GALAX GTX 970 EXOC 4GB, GALAX factory clocks (1164MHz/7010MHz with 1430MHz boost on this sample), supplied by GALAX
- PowerColor R9 Fury X 4GB, stock clocks.
- VisionTek R9 290X reference design 4GB, at stock Uber clocks in CrossFire with the fan allowed to spin up to 100% to prevent throttling.
- VisionTek R9 280X, Reference clocks. Supplied by VisionTek
- Two 2TB Toshiba 7200 rpm HDDs; 1 for AMD and 1 for Nvidia, identically configured otherwise.
- EVGA 1000G 1000W power supply unit
- Cooler Master 2.0 Seidon, supplied by Cooler Master
- Onboard Realtek Audio
- Genius SP-D150 speakers, supplied by Genius
- Thermaltake Overseer RX-I full tower case, supplied by Thermaltake
- ASUS 12X Blu-ray writer
- Monoprice Crystal Pro 4K
Test Configuration – Today’s Software
- Nvidia GeForce 364.51 WHQL vs. 331.70 Launch Drivers for the GTX 980 Ti, and for Titan. Other Nvidia cards tested in the Big Picture use drivers noted on the chart. High Quality, prefer maximum performance, single display.
- AMD Crimson Software 16.3.1 Beta vs. Catalyst 13.9.11 Beta 9.2 for the R9 290X. Other AMD cards tested in the Big Picture use drivers as noted on the chart. Use Application Settings for Tessellation; Morphological Filtering/Surface Optimizations, Off; Texture Filtering Quality, High.
- VSync is off in the control panel.
- AA enabled as noted in games; all in-game settings are specified with 16xAF always applied
- All results show average frame rates plus minimum frame rates (in slightly smaller font italics) as noted on the charts.
- Highest quality sound (stereo) used in all games.
- Windows 10 64-bit Home edition, all DX11 titles were run under DX11 render paths. Our only DX12 title is run under the DX12 render path. Latest DirectX
- All games are patched to their latest versions at time of publication.
- EVGA’s PrecisionX, latest version. Nvidia Control Panel. AMD Crimson Software Control Panel and Catalyst Control Panel.
The New (2016) 25 Game benchmarks & 1 synthetic test
- Synthetic
- Firestrike – Basic & Extreme
-
DX11* Games
- ARMA III
- Crysis 3
- Metro: Last Light Redux (2014)
- Thief
- Sniper Elite 3
- GRID: Autosport
- Middle Earth: Shadows of Mordor
- Alien Isolation
- Far Cry 4
- Dragon’s Age: Inquisition
- Dying Light
- Total War: Attila
- Wolfenstein: The Old Blood* (*OpenGL game)
- Grand Theft Auto V
- ProjectCARS
- the Witcher 3
- Batman: Arkham Origins
- Mad Max
- Fallout 4
- Star Wars: Battlefront
- Assassin’s Creed Syndicate
- Just Cause 3
- Rainbow Six Siege
- DiRT Rally
- DX12 Game
- Ashes of the Singularity – Beta Demo benchmark
The OLD (2013) 13 Game benchmarks & 2 synthetic tests retested for 2016
- Synthetic
- Firestrike – Extreme
- Heaven 2.0
-
DX11 Games
- Call of Pripyat
- Sid Meier’s Civilization V
- DiRT 3
- DiRT Showdown
- Sniper Elite V2
- the Secret World
- Sleeping Dogs
- Hitman Absolution
- Crysis 3
- BioShock Infinite
- Tomb Raider 2013
- Metro: Last Light Redux (2014)
- Batman: Arkham Origins
Test Configuration – Hardware – GTX 780 Ti Launch, 2013
- Intel Core i7 3770K (overclocked to 4.5GHz); Turbo is on. Supplied by Intel.
- EVGA Z77 FTW motherboard (Intel Z77 chipset, latest beta 03-12-13 BIOS, PCIe 3.0 specification; CrossFire/SLI 16x+16x using Plex chip), supplied by EVGA.
- 16GB Kingston DDR3 Kingston RAM (8x2GB, dual-channel at 2133MHz; supplied by Kingston)
- Noctua NH-DH14 CPU cooler plus 7 case fans, supplied by Noctua.
- GTX 780 Ti 3GB at reference speeds and also overclocked, supplied by Nvidia
- EVGA GTX 780 3GB, reference speeds; on loan from EVGA
- GTX Titan 6GB at reference speeds, supplied by Nvidia
- GTX 690 4GB at reference speeds, supplied by Nvidia
- Nvidia GeForce 770, 2GB, reference clocks, supplied by Nvidia
- PowerColor R9 290X 4GB at PowerColor’s +30MHz overclock speeds in Uber mode (1030MHz); fan set to 100%
- VisionTek R9 280X 3GB, reference speeds; supplied by VisionTek
- VisionTek HD 7970 3GB at reference speeds; on loan from VisionTek
- PowerColor HD 7970 3GB at GHz Edition Boost speeds
- Onboard Realtek Audio
- Genius SP-D150 speakers
- Two identical 500 GB Seagate Barracuda 7200.10 hard drives configured and set up identically from drive image; one partition for Nvidia GeForce drivers and one for ATI Catalyst drivers
- Two Kingston 240GB HyperX SSDs configured and set up identically from drive image; one partition for Nvidia GeForce drivers and one for ATI Catalyst drivers; supplied by Kingston
- Cooler Master Platinum Pro 1000W PSU, supplied by Cooler Master
- Thermaltake Overseer RX-I full tower case, supplied by Thermaltake
- Philips DVD SATA writer
- HP LP3065 2560×1600 thirty inch LCD
Test Configuration – Software – GTX 780 Ti Launch
- WHQL Catalyst 13.11 Beta 9 for R9 290X; application controlled, Surface optimizations off, High Quality, Vsync off
- Nvidia GeForce WHQL 331.70 for the GTX 980 Ti and Titan; High Quality; Single-display Performance mode; Prefer Maximum Performance, Vsync off
- Windows 7 64-bit; very latest updates
- Latest DirectX
- All games are patched to their latest versions.
- Vsync is forced off in the control panels.
- Varying AA enabled as noted in games; all in-game settings are specified with 16xAF always applied; 16xAF forced in control panel for Crysis.
- All results show average frame rates
- Highest quality sound (stereo) used in all games.
- Windows 7 64, all DX9 titles were run under DX9 render paths, DX10 titles were run under DX10 render paths and DX11 titles under DX11 render paths.
Testing Differences between 2013 and now
Although we tested the same games at the same settings, our testing platform has changed from Windows 7 to Windows 10 which should make for only potentially slight differences in performance which can fall under “benching noise”, or margin of error; and we are using a slightly faster CPU now as we have upgraded from Ivy Bridge’s i7-3770K at 4.5GHz to the Devil’s Canyon i7-4790K at 4.4GHz which will only slightly affect CPU-dependent benchmarks. And of course, game patches and updates will also make for larger potential performances differences which reflect playing the game then versus now. However, the relative performance of our 3 featured video cards will be similar, and our results should be very close.
AMD’s Driver Settings
The Crimson drivers come with a new interface that may take users time to get used to. We feel the new interface is a big improvement over the older one, but there are still some issues – especially with changing resolutions and refresh rates that still need to be adjusted in Windows.
Here are the settings that we always use in AMD’s Crimson Control Center for our default benching. They are identical settings to what we used in the older Catalyst Control Center in 2013.
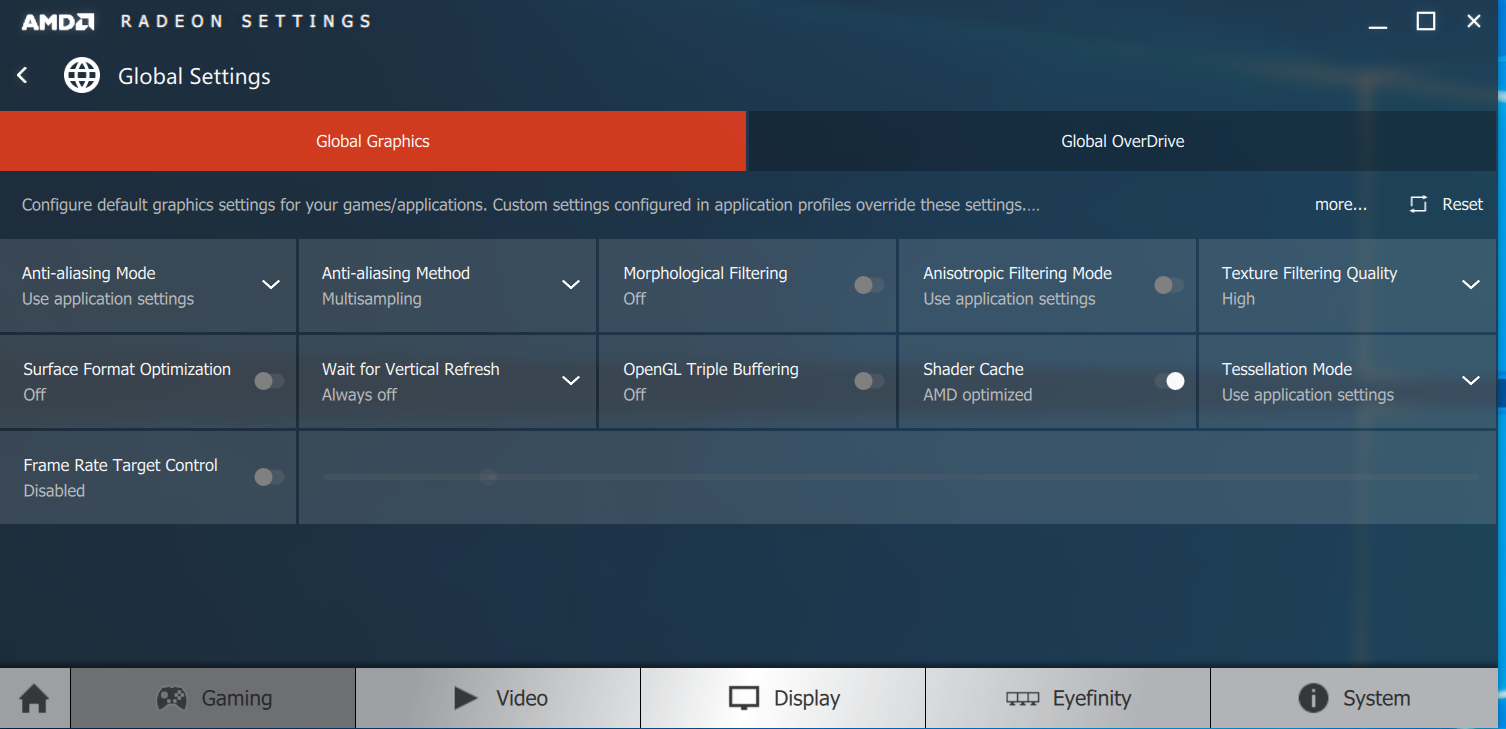
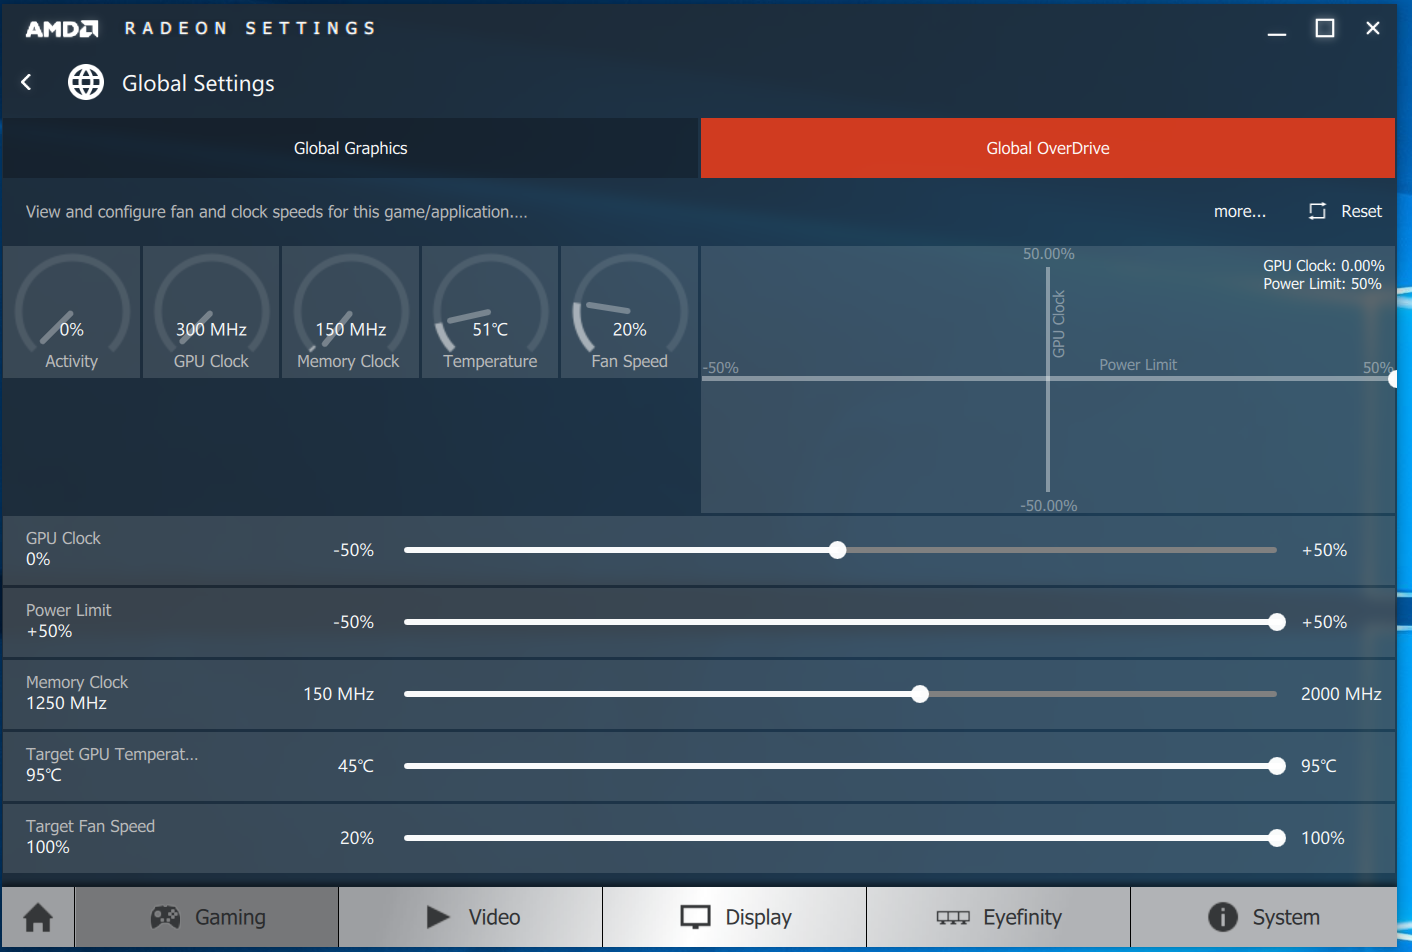 Notice that we always bench our 290X with the fan set to allow it to spin up to 100%. It never throttles under our benching conditions.
Nvidia’s Control Panel Settings
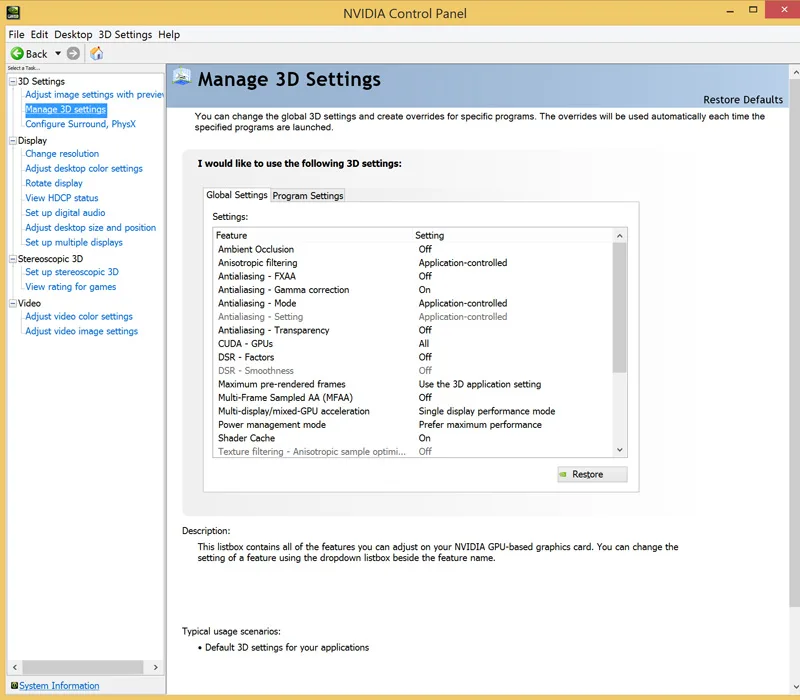
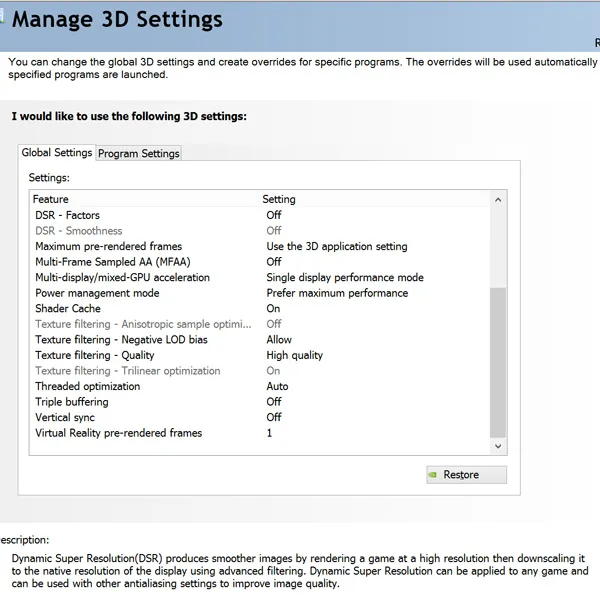
Let’s head to the performance charts to see how the GTX 780 Ti compares with R9 290X and also versus the Titan by benching today’s most demanding PC games, and also by looking back to 13 older games that we benchmarked 2-1/2 years ago when the Kepler GTX 780 Ti first launched.
The Performance summary charts
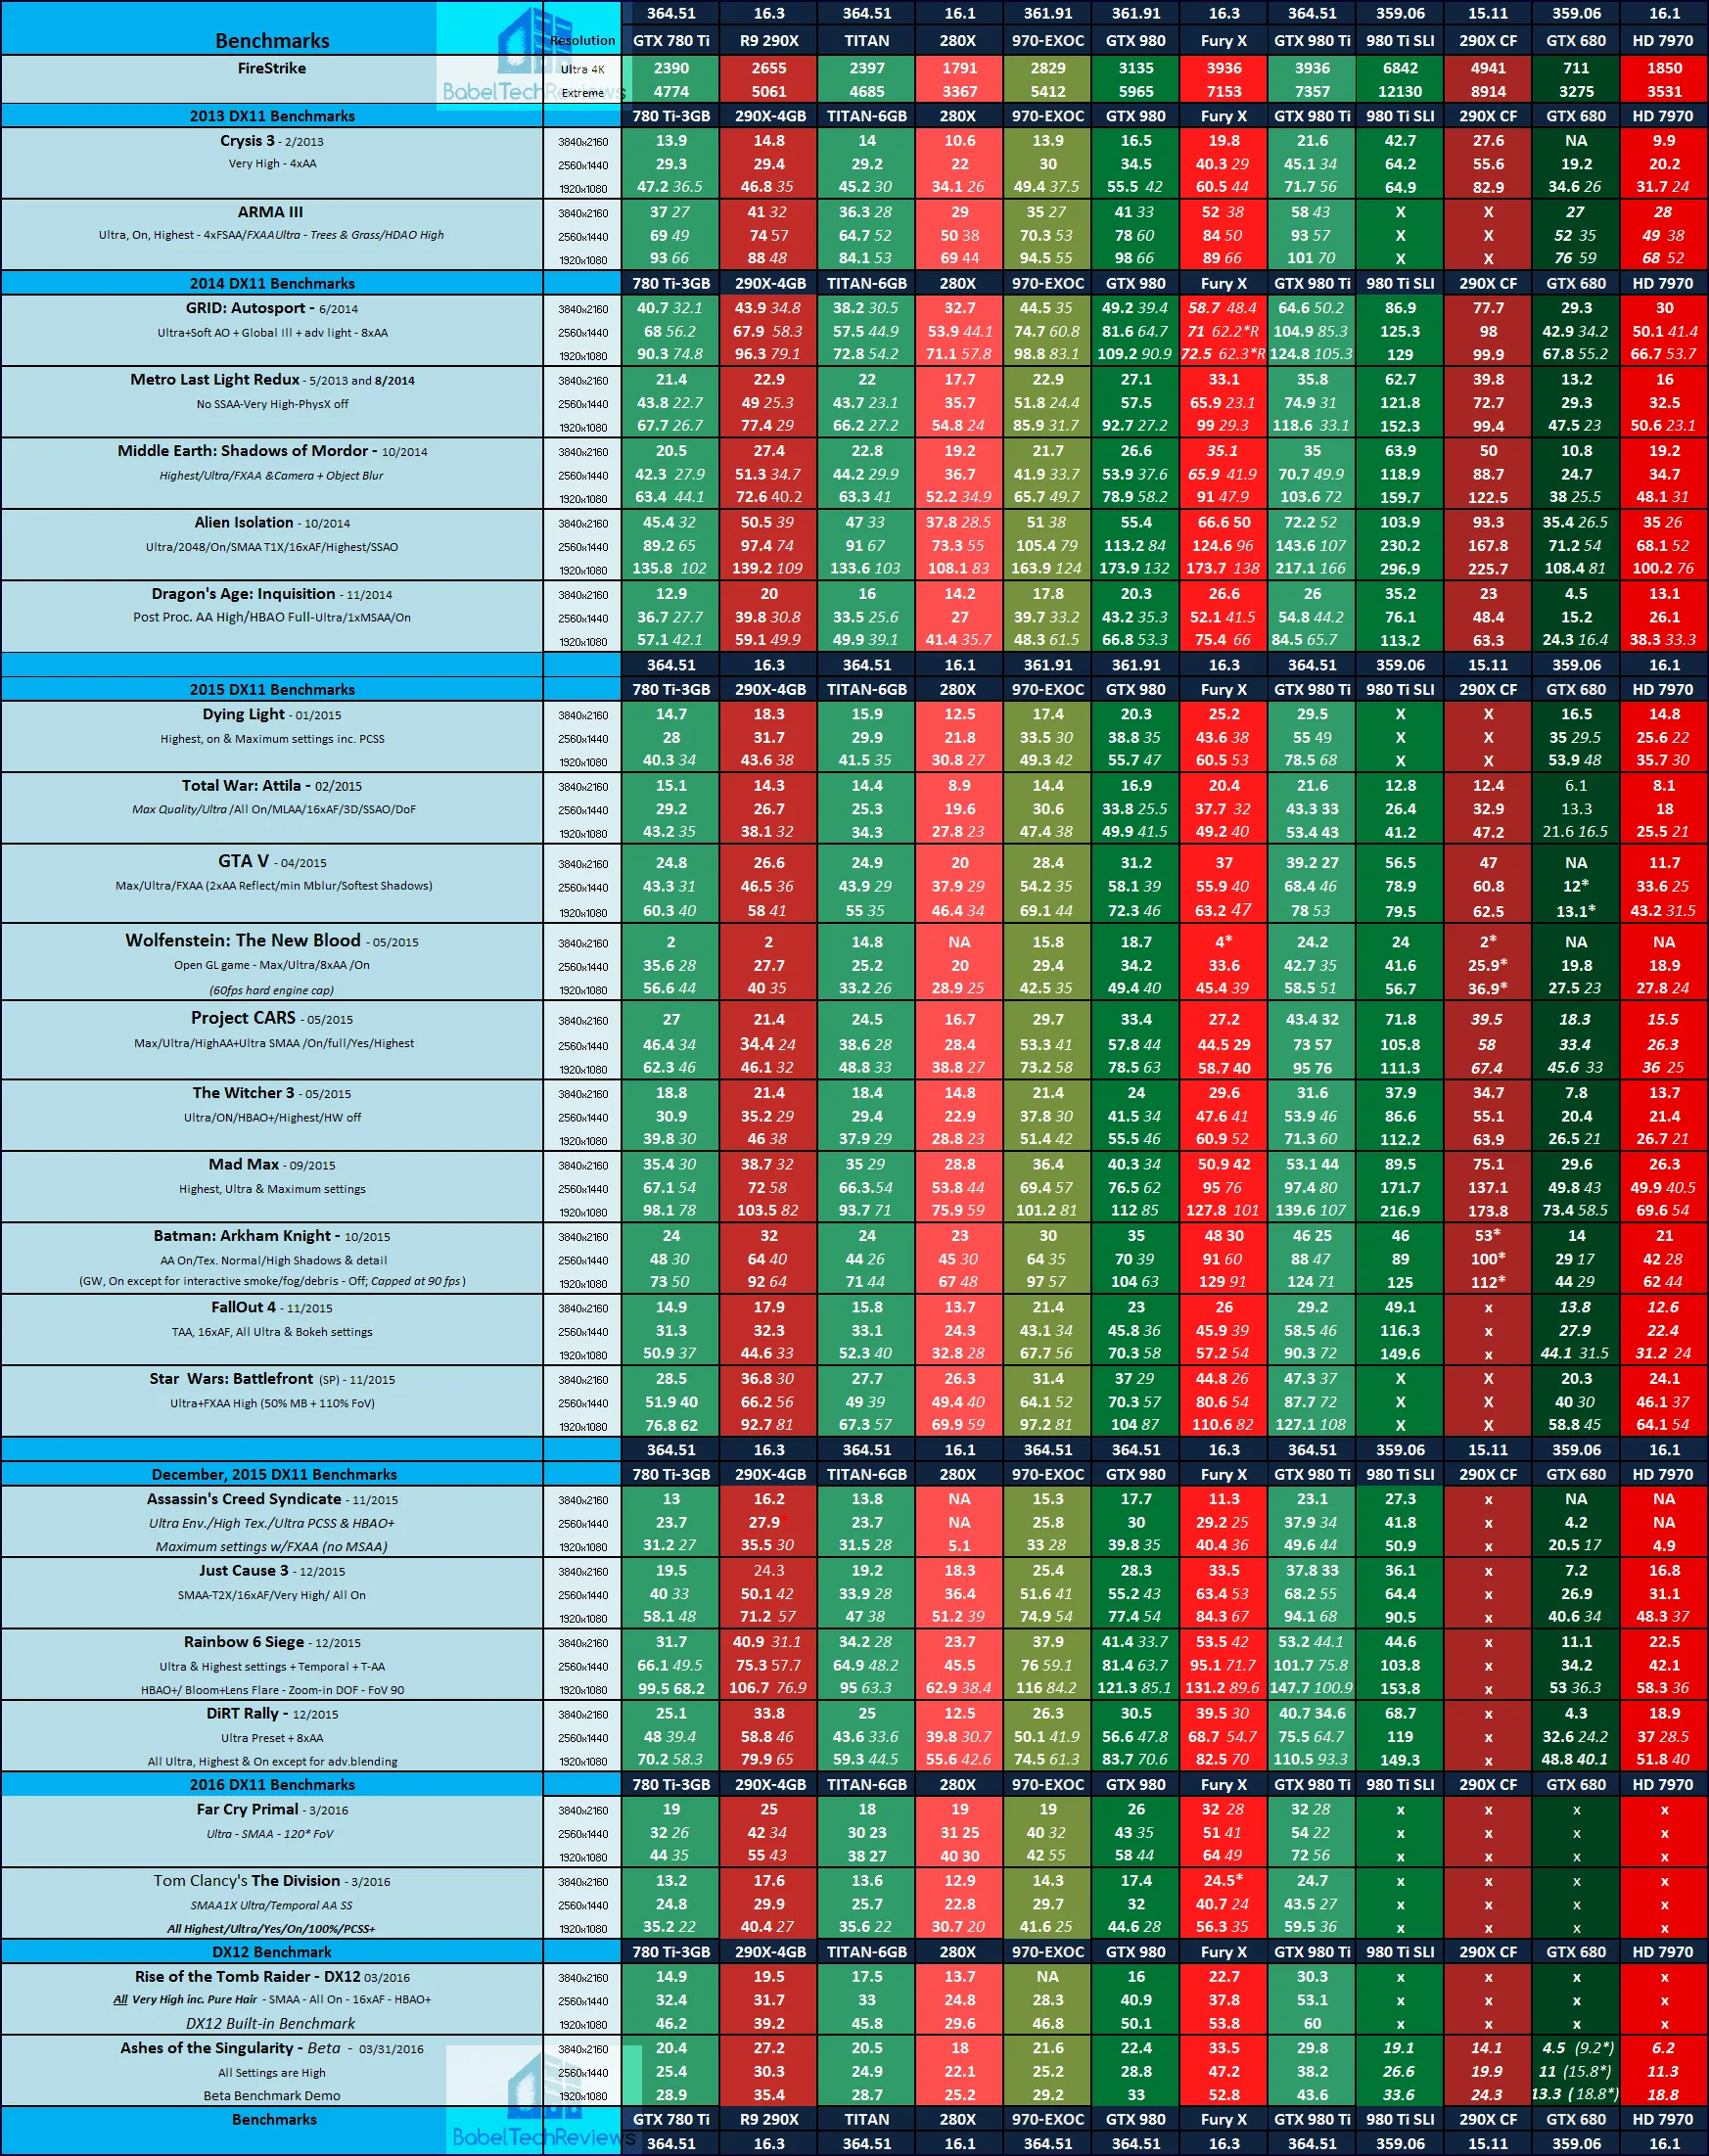
Here is the summary chart of 25 games and 1 synthetic test of our latest benchmarking suite using the latest drivers with the GTX 780 Ti in the first column, the 290X in the second, and the GTX Titan in the third. The highest settings are always chosen and it is DX11 or DX12 with the settings at ultra or maxed and they are identically high or ultra across all platforms.
The benches are run at 1920×1080, 2560×1440, and at 3840×2160. All results, except for Firestrike, show average framerates and higher is always better. W e also show minimum frame rates where they make sense on the same line as the averages, but using slightly smaller regular unbolded italicized font to differentiate them.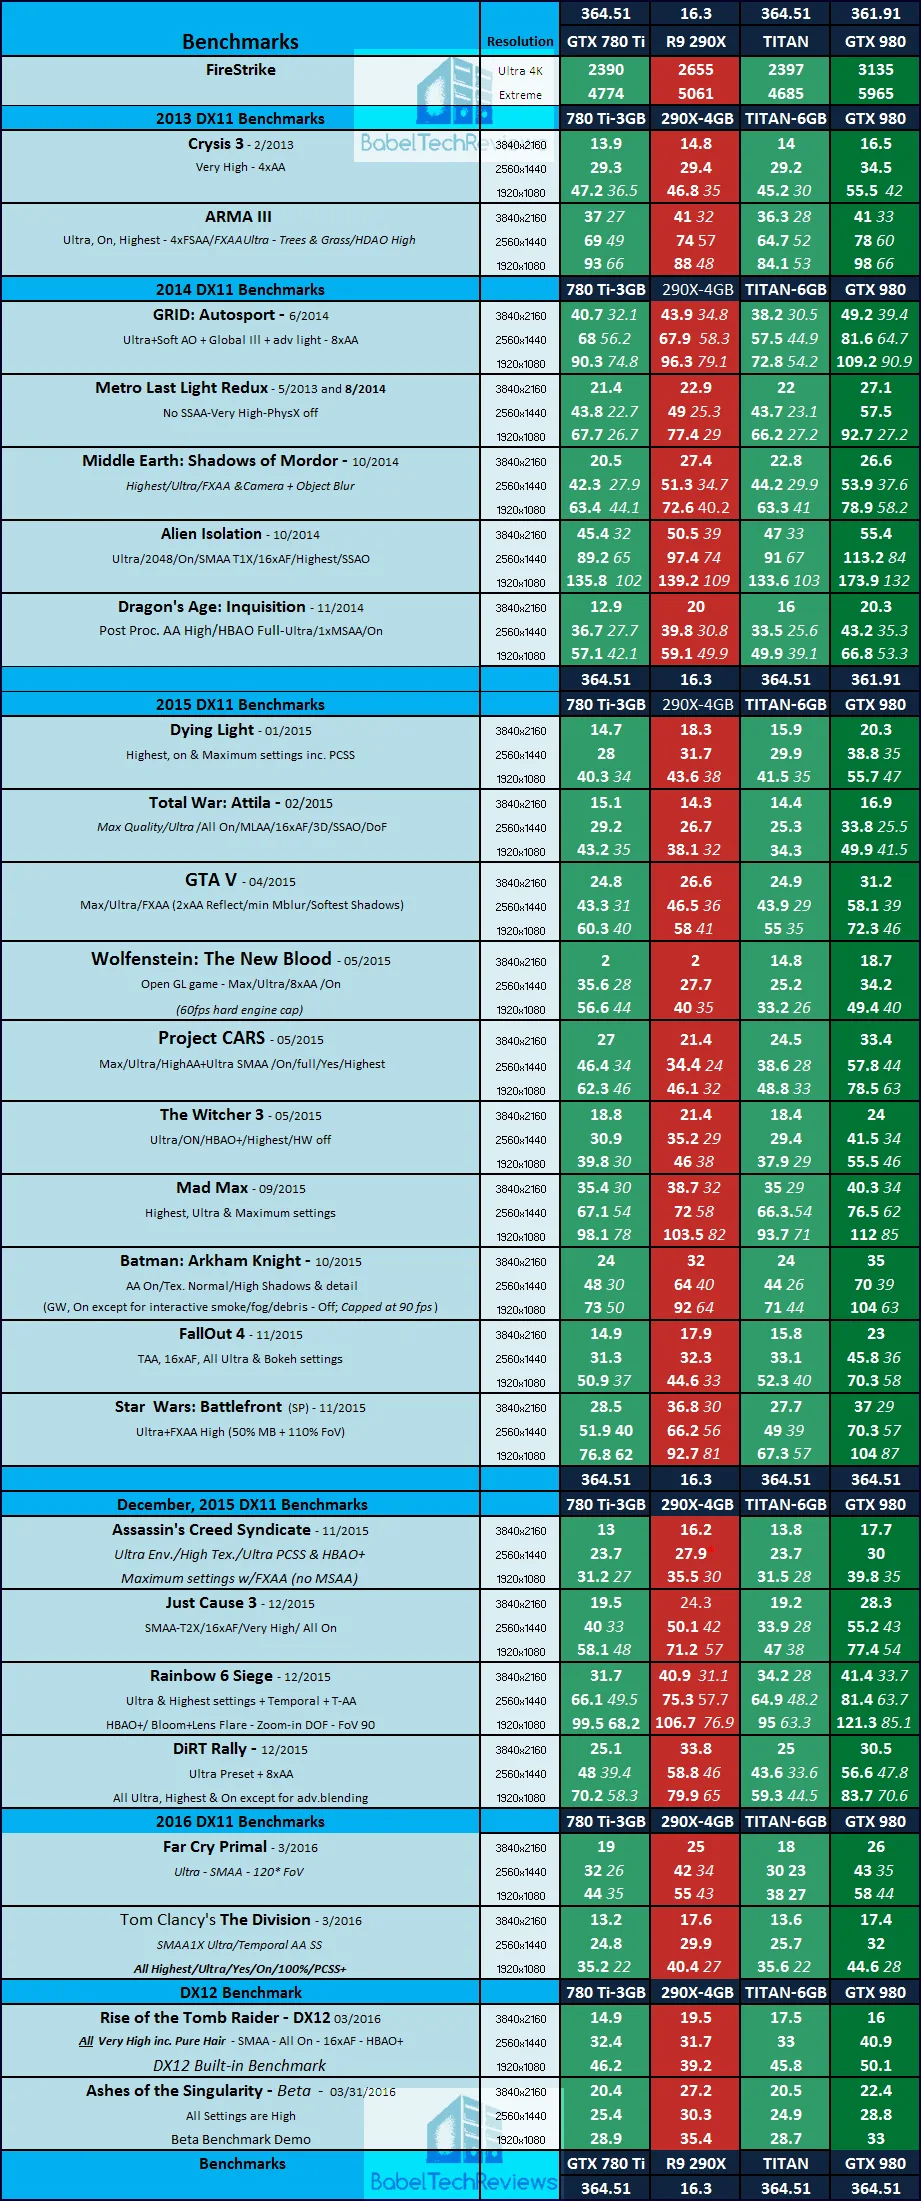 We can see the performance of the GTX 780 Ti is a bit lower than the 290X for many of the newer games, although they do trade blows in some games, and in a few, the GTX 780 Ti is faster. We also note the Titan lags well behind except for a few situations where the 6GB of vRAM makes a difference at higher resolutions.
Now we go back in time and highlight our 2013 original benchmarks for the launch of the GTX 780 Ti.
2013 benchmarks – GTX 780 Ti/3GB vs. 290X/4GB vs. the Titan/6GB
Here are the benches from our original ABT GTX 780 Ti Launch evaluation chart that was published on November 7, 2013. In this chart, the stock GTX 780 Ti results are shown in the first column, the 290X Uber OC (1030MHz) is in the second, the overclocked 780 Ti is shown in the 3rd benchmark column, and the GTX Titan performance results are shown in the last column.
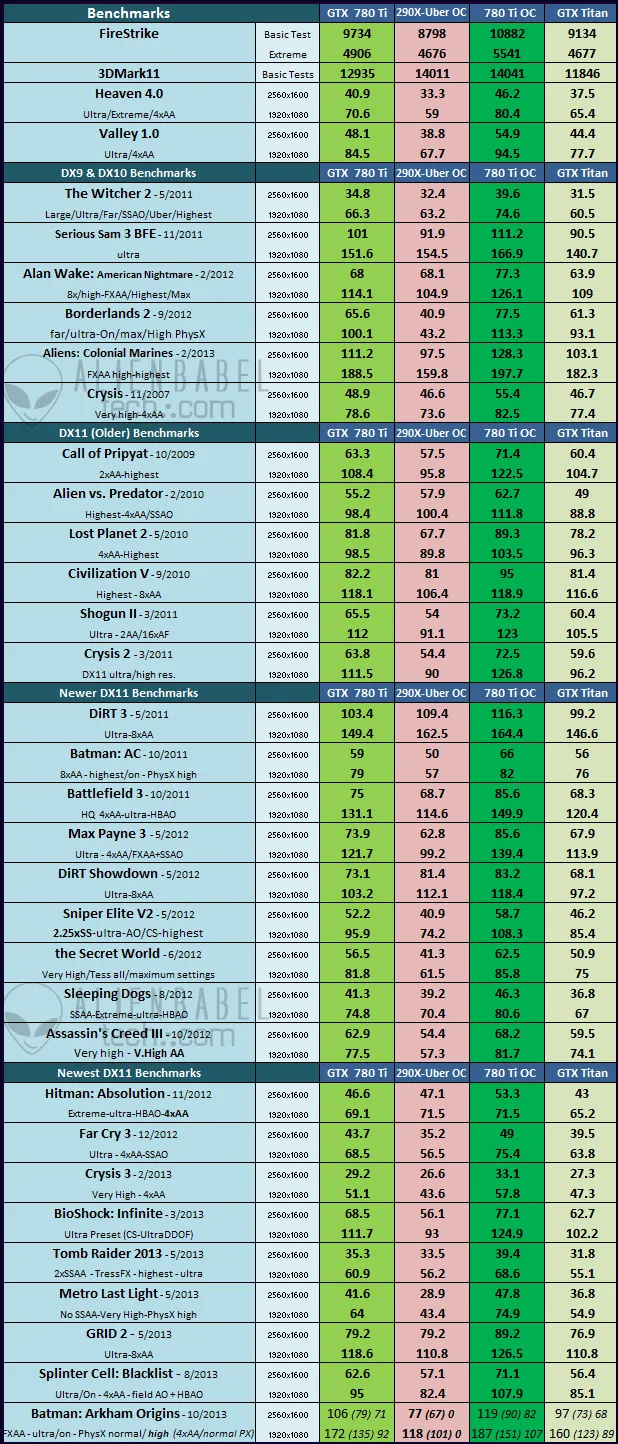
The newly released GTX 780 Ti was generally faster than the brand new R9 290X, and significantly faster than the Titan.
2013 vs. 2016 benchmarks – GTX 780 Ti/3GB vs. 290X/4GB vs. the Titan/6GB
Now we test 13 of the above games with the same 3 cards using the latest drivers compared with the 2013 drivers as in the original launch chart above.
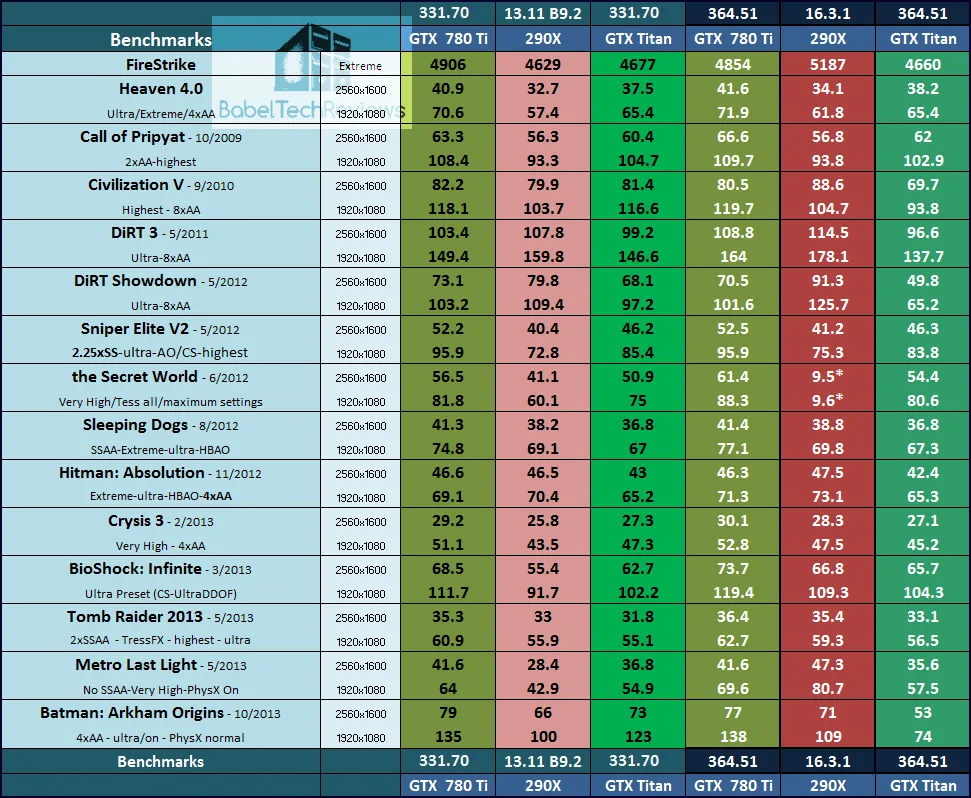 Here is another way to look at the same chart – comparing the same 3 cards at the same clockspeeds and settings using 2013 drivers as on the launch chart directly against the 2016 drivers:
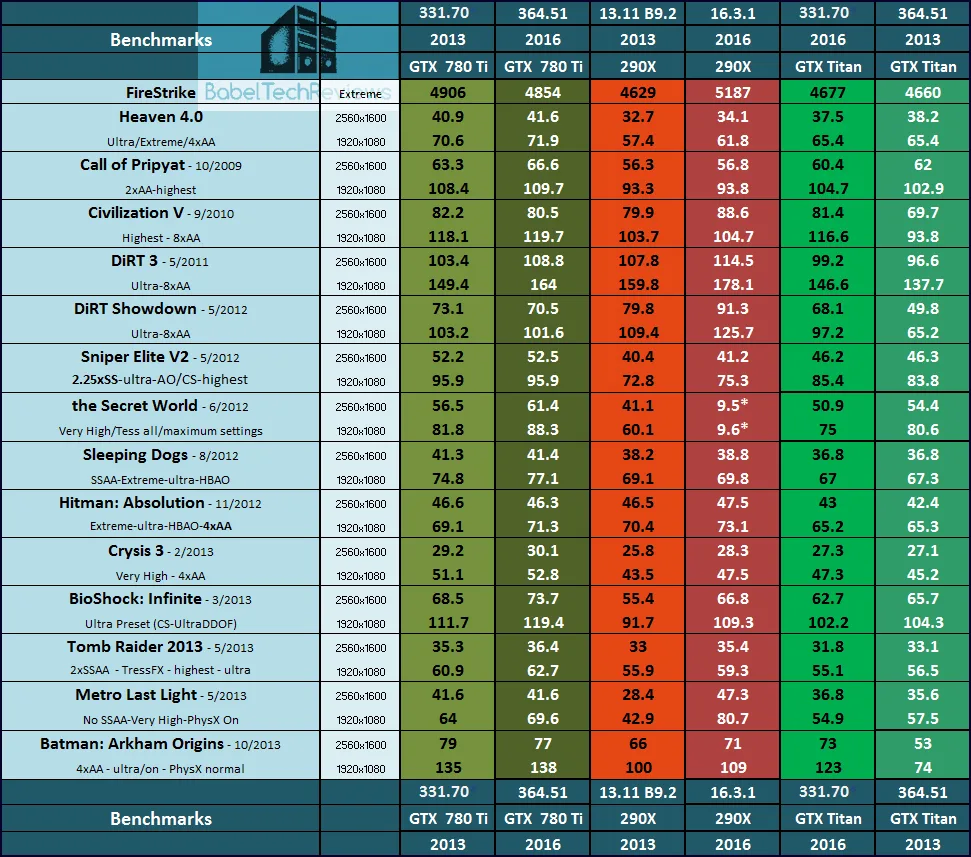
Even though we are comparing 2013 with 2016 using a slightly upgraded platform, we generally see small improvements in 2016 over 2013 for the GTX 780 Ti. What is surprising is that the Titan may appear neglected, but not the GTX 780 Ti. Titan’s performance has regressed in a few games. We also generally see larger performance improvements for the 290X than the GTXes, with a big improvement for the 290X in Metro Last Light. Unfortunately for this game, it just means that AMD has optimized for the benchmark. We used to test it with PhysX On, but now there is no performance difference between On or Off in the benchmark. In actually playing the game, the 290X still runs at about 35fps at 2560×1600 as it always has, and PhysX cannot be set in-game or the framerates would still tank completely. We also see that a recent driver or patch broke 290X performance in the Secret World.
However, generally, both the 780 Ti and the R9 290X have had improvements since 2013, even for the old games. What we have seen is that AMD has continued to optimize for newer games for the 290X as it reuses the same architecture for the 390X.
There is no doubt that the R9 290X with its 4GB of vRAM, is a generally faster GPU for today’s games than the 3GB vRAM-equipped GTX 780 Ti although they are still competing in the same class. There are only a few of the games that run poorly on the GTX 780 Ti because of its 3GB of vRAM compared with either 4GB or 6GB, and this is only at the highest resolution. In these cases, tweaking a few settings downward generally make the newest games run decently.
The Big Picture 2016
Here is the Big Picture for 2016:
Let’s head for our conclusion.
The Conclusion
This was an interesting evaluation for us in revisiting a 2013 evaluation. We have seen that the 290X is still being optimized by AMD as its architecture is unchanged with the current 390X. Partly by being 2-1/2 year old architecture, and partly by having more vRAM, the 290X has turned out to be generally more “future proof” for playing today’s latest modern PC games. However, we can clearly see that the Kepler GTX 780 Ti still is in the same class as the 290X and it runs 2013 games just as fast or faster in 2016, although it has fallen further behind the Maxwell 980 series with the very latest games. It also appears that 3GB of vRAM is sufficient for its target resolutions of 1920×1080 and 2560×1600 or 2560×1440. None of today’s single GPUs are well-suited for 4K resolutions with maximum details, and we await Nvidia’s new Pascal architecture and AMD’s Polaris.
It is clear that the latest generation of DX11/12 games are far more demanding on video cards, but especially regarding vRAM usage. The GTX 780 Ti is rarely limited by its 3GB of vRAM, and when it happens, the frame rates will often improve dramatically by lowering a few settings. It is clear that Nvidia has not neglected Kepler, but they are clearly more focused on Maxwell performance as it is their current architecture.
Stay tuned, there is a lot coming from us at BTR. We are making preparations to report live from Nvidia’s GTC next Monday.
Happy Gaming!
Mark Poppin
BTR Editor-in-Chief