Windows 11 vs. Windows 10 Performance Analysis including HAGS – 40 games & Workstation Benchmarks with i7-12700KF/RTX 3080
This Windows 11 versus Windows 10 performance analysis is a follow-up to this week’s review of PC Gamerz Hawaii premium Blue Elite 12700KF/RTX 3080/DDR4 prebuild. They are still using Windows 10 Pro so we performed all of our detailed benching on that operating system and then did a clean install of Windows 11 Pro using the same settings. We will see if there are any performance advantages or disadvantages for Intel 12th Gen gamers or creators still on Windows 10 who are considering an upgrade.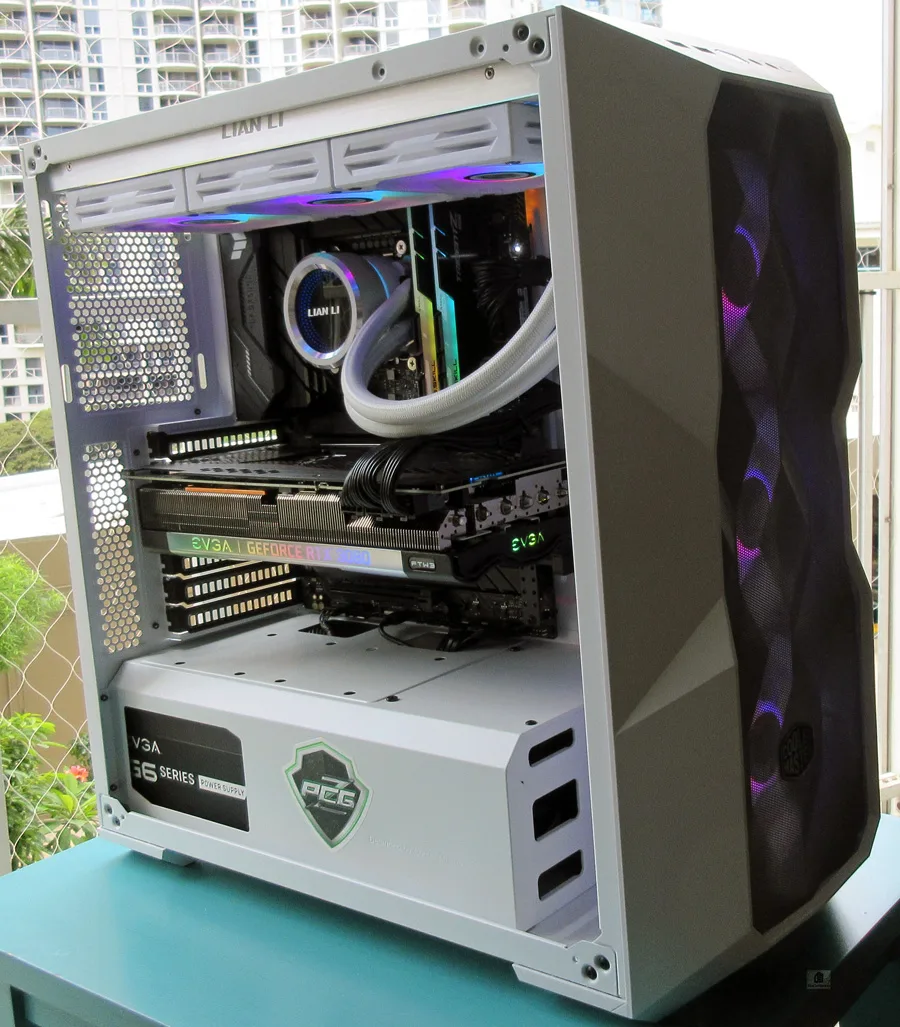
We benchmarked 20 games with HAGS (Hardware Accelerated GPU Scheduling) off between Windows 10 and 11 and then turned on HAGS for all 40 Windows 11 games. Before we head to the performance chart featuring 40 games plus creative, workstation, and professional benchmarks, it’s important to detail the hardware and software configuration used for our for our benchmarking as well as our testing methodology.
Test Configuration – Hardware
PC Gamerz Hawaii Blue Elixir
- Intel Core i7-12700KF (HyperThreading/Turbo boost On) (All listed Blue Elixir hardware except the portable SSD supplied by PC GamerZ Hawaii)
- ASUS TUF Gaming H670-PRO WIFI D4 (Intel H670 chipset, latest BIOS, PCIe 5.0/5.0/3.0/3.1/3.2 specification, CrossFire/SLI 8x+8x)
- G.SKILL Trident Z 16GB DDR4 (2x16GB, dual channel at 3600MHz)
- Crucial P2 1TB NVMe SSD PCIe 3.0 (2400MBps/1900MBps Read/Write) for C: drive
- The T-FORCE M200 4TB USB 3.2 Gen2x2 Type-C Portable SSD (supplied by Team Group for game storage)
- EVGA 850B5, 850W Bronze PSU
- ACER (LC27G75TQSNXZA) 27? 1920×1080/165Hz monitor
- Lian-Li Galahad 360 AIO Cooler
- CoolerMaster TD500 Mesh White
Test Configuration – Software
- GeForce 512.77
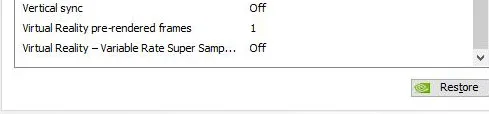
- High Quality, prefer maximum performance, single display, set in the NVIDIA control panel; Vsync off.
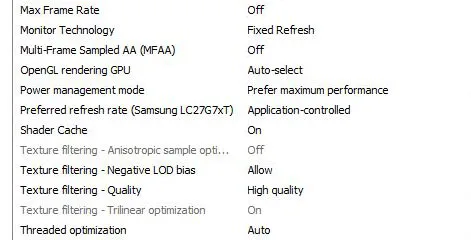
- Optimizations are off, Vsync is forced off, Texture filtering is set to High Quality, and Power management prefer maximum performance
- AA enabled as noted in games; all in-game settings are specified with 16xAF always applied
- Highest quality sound (stereo) used in all games
- All games have been patched to their latest versions
- Gaming results show average frame rates in bold including minimum frame rates (1% lows/99 percentiles) shown on the chart next to the averages in a smaller italics font where higher is better.
- Windows 11 Pro edition clean install and Windows 10 64-bit Pro edition; latest updates. DX11 titles are run under the DX11 render path. DX12 titles are generally run under DX12, and multiple games use the Vulkan API.
- Latest DirectX
Games
Vulkan
- DOOM Eternal
- Wolfenstein Youngblood
- Red Dead Redemption 2
- Ghost Recon: Breakpoint
- World War Z
- Strange Brigade
- Rainbow 6 Siege
DX12
- God of War
- Ghostwire: Tokyo
- Elden Ring
- Dying Light 2
- Forza Horizon 5
- Call of Duty: Vanguard
- Guardians of the Galaxy
- Far Cry 6
- Chernobylite
- Resident Evil Village
- Metro Exodus Enhanced Edition
- Hitman 3
- Godfall
- DiRT 5
- Assassin’s Creed: Valhalla
- Cyberpunk 2077
- Watch Dogs: Legion
- Horizon Zero Dawn
- Death Stranding
- F1 2021
- Borderlands 3
- Tom Clancy’s The Division 2
- Battlefield V
- Shadow of the Tomb Raider
- Civilization VI – Gathering Storm Expansion
- Shadow of the Tomb Raider
DX11
- Total War: Warhammer III
- Days Gone
- Crysis Remastered
- Destiny 2 Shadowkeep
- Total War: Three Kingdoms
- Overwatch
- Assetto Corsa: Competizione
- Grand Theft Auto V
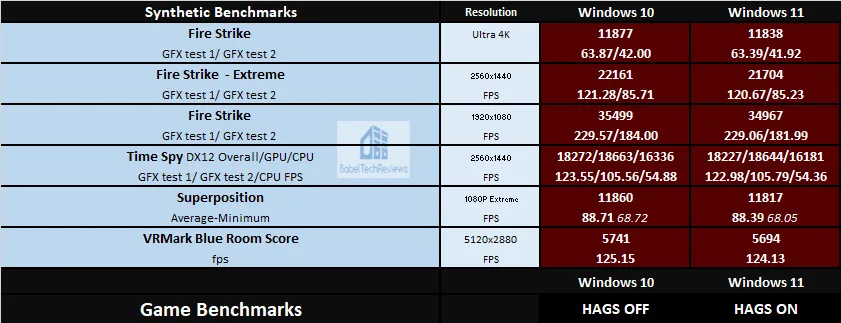
Synthetic
- TimeSpy (DX12)
- 3DMark FireStrike & Extreme
- Superposition
- VRMark Blue Room
- Cinebench
- GeekBench
- OctaneBench
- AIDA64 CPU, cache & memory, and GPGPU benchmarks
- Blender 3.01 benchmark
- Sandra 2021 CPU Benchmarks
- SPECviewperf 2020
- SPEC Workstation
NVIDIA Control Panel settings
Here are the NVIDIA Control Panel settings.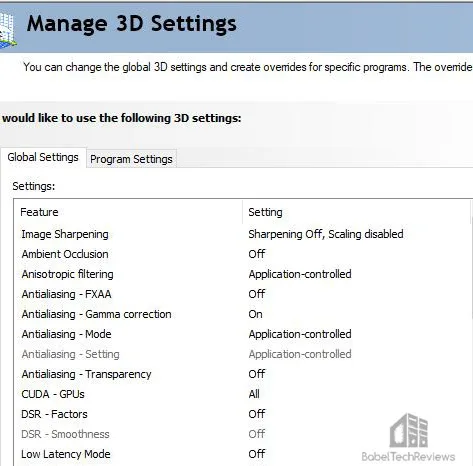
Let’s head to the performance charts.
Performance Summary Charts
Here are the performance results of 40 games and 5 synthetic tests comparing the performance of Windows 11 with Windows 10 using PCGz’ Blue Elixir. Click on each chart to open in a pop-up for best viewing.
All gaming results show average framerates in bold text, and higher is better. Minimum framerates (1% lows/99-percentiles) are next to the averages in italics and in a slightly smaller font. We picked the highest settings as shown on the charts. Wins (or ties) are show by yellow text.
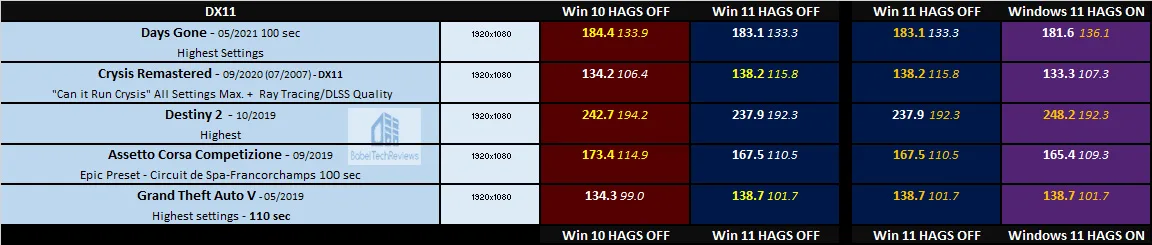
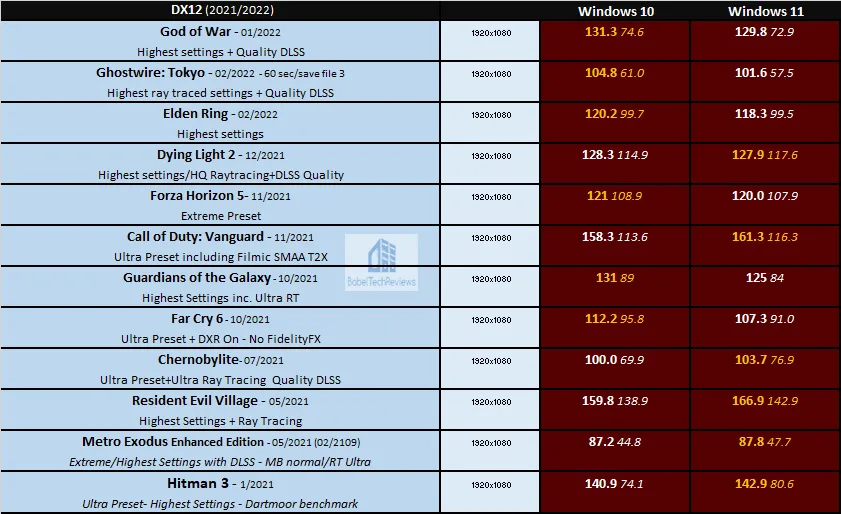
Windows 10 HAGS off vs. Windows 11 HAGS off vs. Windows 11 HAGS on
We first benchmarked 20 games with HAGS (Hardware Accelerated GPU Scheduling) off between Windows 10 and 11, and also using Windows 11 with HAGS on vs. off. We did not benchmark Windows 10 with HAGS on. Column 1 shows the Windows 10 results (HAGS off) versus Column 2 which shows Windows 11 results (HAGS off). Performance wins are in yellow text. Column 2 repeats Windows 11 results with HAGS off versus Column 3 with Windows 11 with HAGS on. We use a slightly darker yellow text to show Windows 11 performance wins between HAGS off versus on.
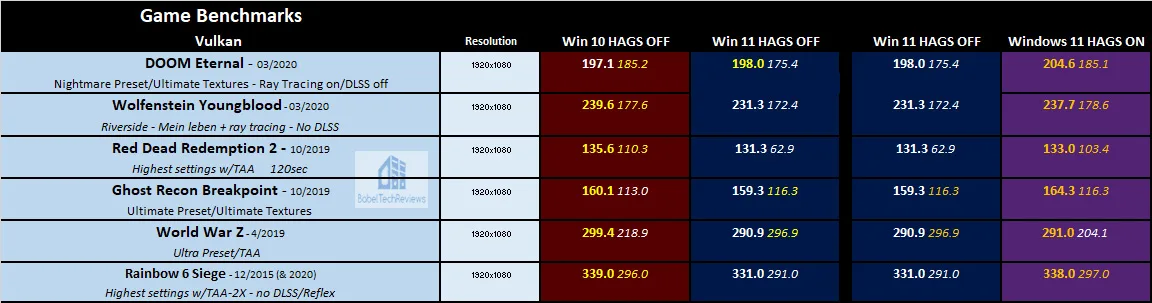
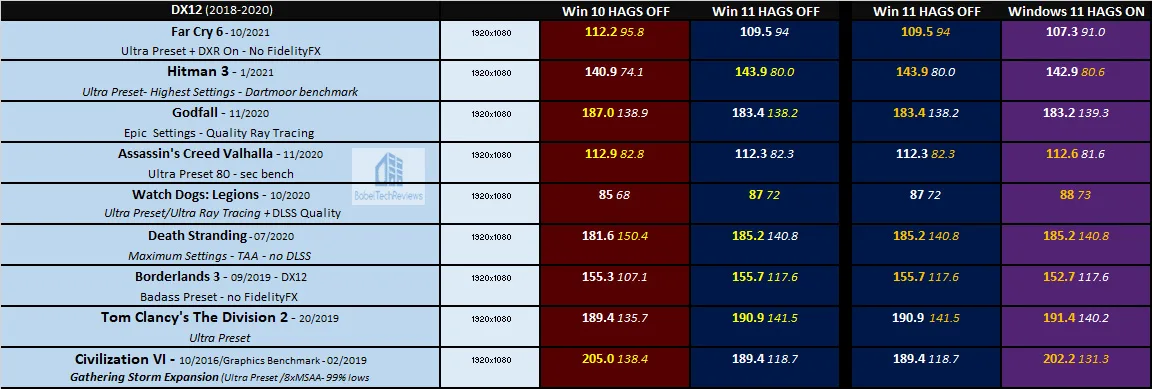
 Interestingly, nineteen of twenty average results between HAGS off Windows 10 and Windows 11 are approximately within what is considered the 3% margin of benchmarking error. Civilization VI, a CPU-heavy benchmark, is the only outlier that favors Windows 10. When HAGS is turned on for Windows 11, Civ’s performance normalizes between the OSes. HAGS on for Windows 11 doesn’t appear to give any significant performance disadvantages so we benchmarked all 40 games with HAGS on for Windows 11 in the following set of charts.
Windows 10 HAGS off vs. Windows 11 HAGS on
Column 1 shows the Windows 10 performance results (HAGS off) versus Column 2 which shows Windows 11 results (HAGS on). Performance wins are in yellow text.
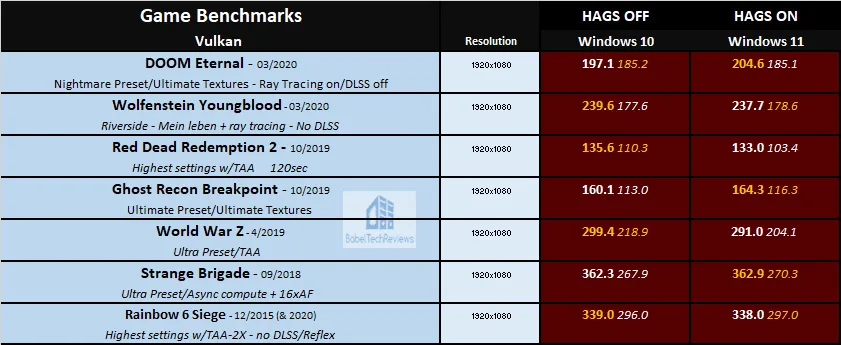
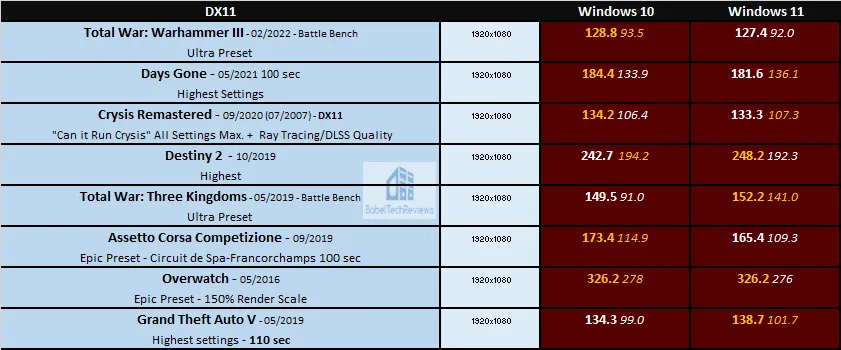
Again, most of the results fall within the benchmarking margin of error. For most of the games, the average performance is quite close. Notable outliers occur in several minimums and especially with the CPU-heavy benchmark, Total War: Three Kingdoms, where Windows 11 minimums are far higher than with Windows 10.
Let’s look at non-gaming applications next to see how Windows 11 compares to Windows 10 in creative/workstation/pro tasks starting with Blender benchmarks.
Blender 3.01 Benchmark
Blender is a very popular open source 3D content creation suite. It supports every aspect of 3D development with a complete range of tools for professional 3D creation.
We benchmarked all three Open Data Blender.org benchmarks which measures both CPU and GPU performance by measuring samples per second by render production files. 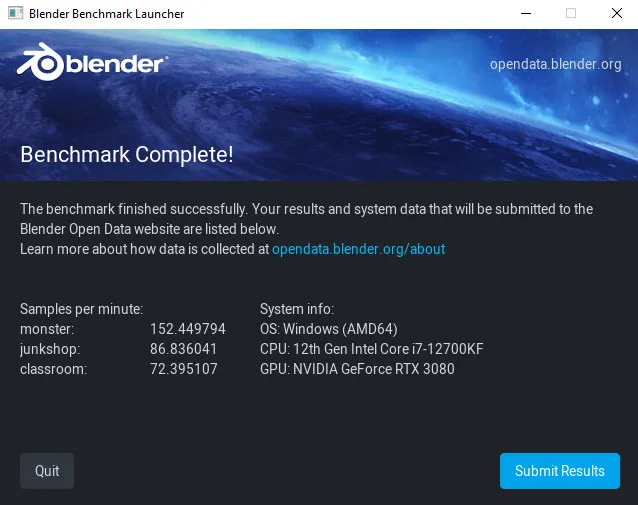
For the following chart, higher is better as the benchmark renders a scene multiple times and gives the results as samples per second.
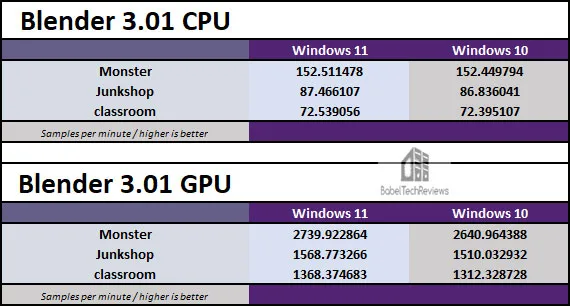
Windows 11 Blender benchmark results have a slight edge over Windows 10.
Next, we move on to AIDA64 CPU, Cache & Memory, and GPGPU benchmarks.
AIDA64 v6.70
AIDA64 is an important industry tool for benchmarkers. Its GPGPU benchmarks measure performance and give scores to compare against other popular video cards while it’s CPU benchmarks compare relative performance of processors.
AIDA64’s benchmark code methods are written in Assembly language, and they are well-optimized for every popular AMD, Intel, NVIDIA and VIA processor by utilizing the appropriate instruction set extensions. We use the Engineer’s full version of AIDA64 courtesy of FinalWire. AIDA64 is free to to try and use for 30 days.
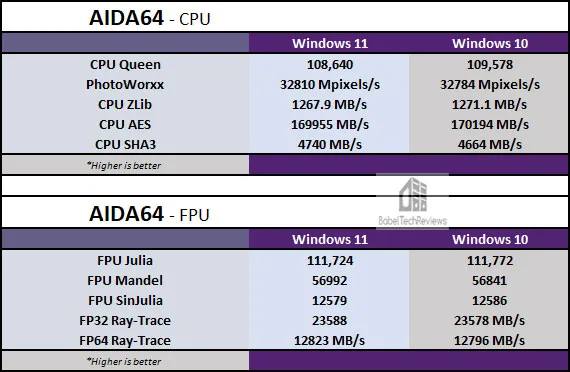
CPU/FPU Benchmark Results
AIDA64 CPU/FPU results are summarized below in two charts for comparison.
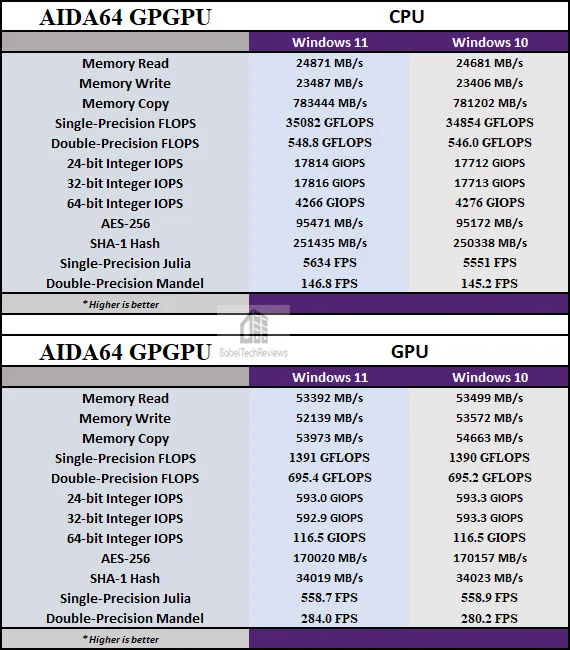
GPGPU Benchmark Summary
Here is the AIDA64 GPGPU comparison summarized between Windows 11 and Windows 10 below.
Cache & Memory Benchmarks
Here is the summary chart of the cache & memory benchmarks.
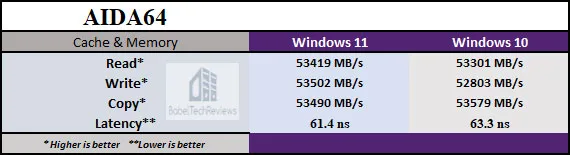
There are no real differences between AIDA64 Windows 11 and Windows 10 benchmark results. So let’s look at Sandra 2021 next.
SiSoft Sandra 2021
To see where the CPU, GPU, and motherboard performance results differ, there is no better tool than SiSoft’s Sandra 2021. SiSoftware SANDRA (the System ANalyser, Diagnostic and Reporting Assistant) is a excellent information & diagnostic utility in a complete package. It is able to provide all the information about your hardware, software, and other devices for diagnosis and for benchmarking. Sandra is derived from a Greek name that implies “defender” or “helper”.
There are several versions of Sandra, including a free version of Sandra Lite that anyone can download and use. Sandra 2021 is the latest version, and we are using the full engineer suite courtesy of SiSoft. Sandra 2021 features continuous multiple monthly incremental improvements over earlier versions of Sandra. It will benchmark and analyze all of the important PC subsystems and even rank your PC while giving recommendations for improvement.
We ran the latest version of Sandra’s intensive Processor benchmarks and summarize the overall results below.
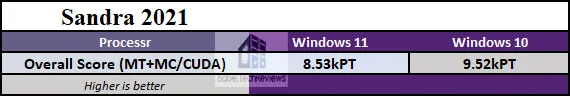
In Sandra’s synthetic CPU benchmarks, Windows 10 scores higher than Windows 11.
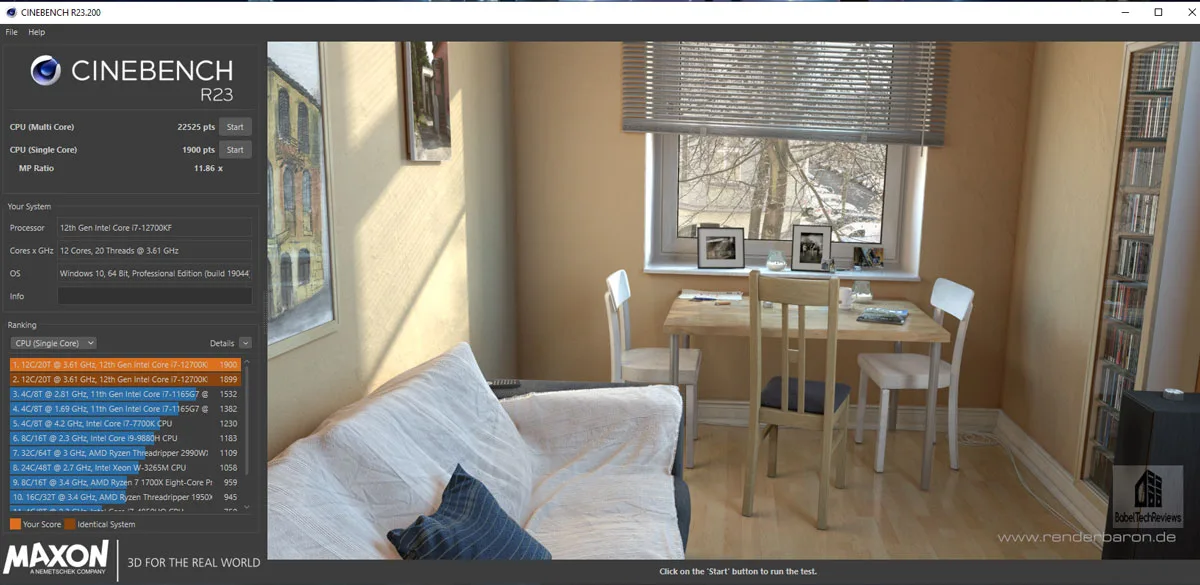
Cinebench
Cinebench is based on MAXON’s professional 3D content creation suite, Cinema 4D. This latest R23 version of Cinebench can test up to 64 processor threads accurately and automatically. It is an excellent tool to compare CPU/memory performance and higher is better.
Cinebench’s Multi-Core benchmark will stress a CPU reasonably well over its 10-minute run and will show any weaknesses in CPU cooling. This is the test where we discovered that the Blue Elixir’s 12700K hit nearly 100C on Core 5 and lead us to conclude that the wrong LGA 1200 backplate was used by the PCGz builders instead of LGA 1700.
Here is the summary chart.
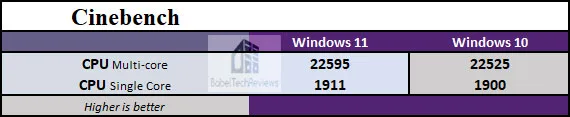
Windows 11 scores a bit higher than Windows 10 in Cinebench. Now we benchmark using GeekBench which measures CPU and GPU performance.
GeekBench
GeekBench is an excellent CPU/GPU benchmarking program which runs a series of tests and times how long the processor takes to complete its tasks. It focuses on the CPU Multi- and Single Core performance as well as GPU performance which tests OpenCL, CUDA, and Vulcan
The summary charts below show the comparative performance scores.
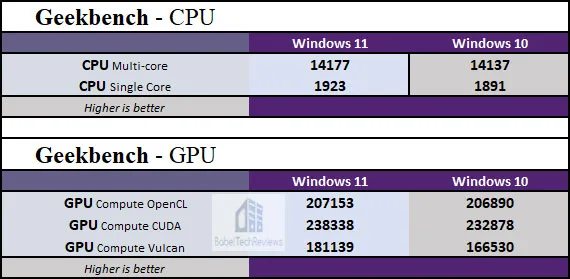
In Geekbench, Windows 11 tends to score higher than Windows 10.
Lets check out Octanebench, another GPU-heavy test
Octanebench
OctaneBench allows you to benchmark GPUs using OctaneRender. The hardware and software requirements to run OctaneBench are the same as for OctaneRender Standalone.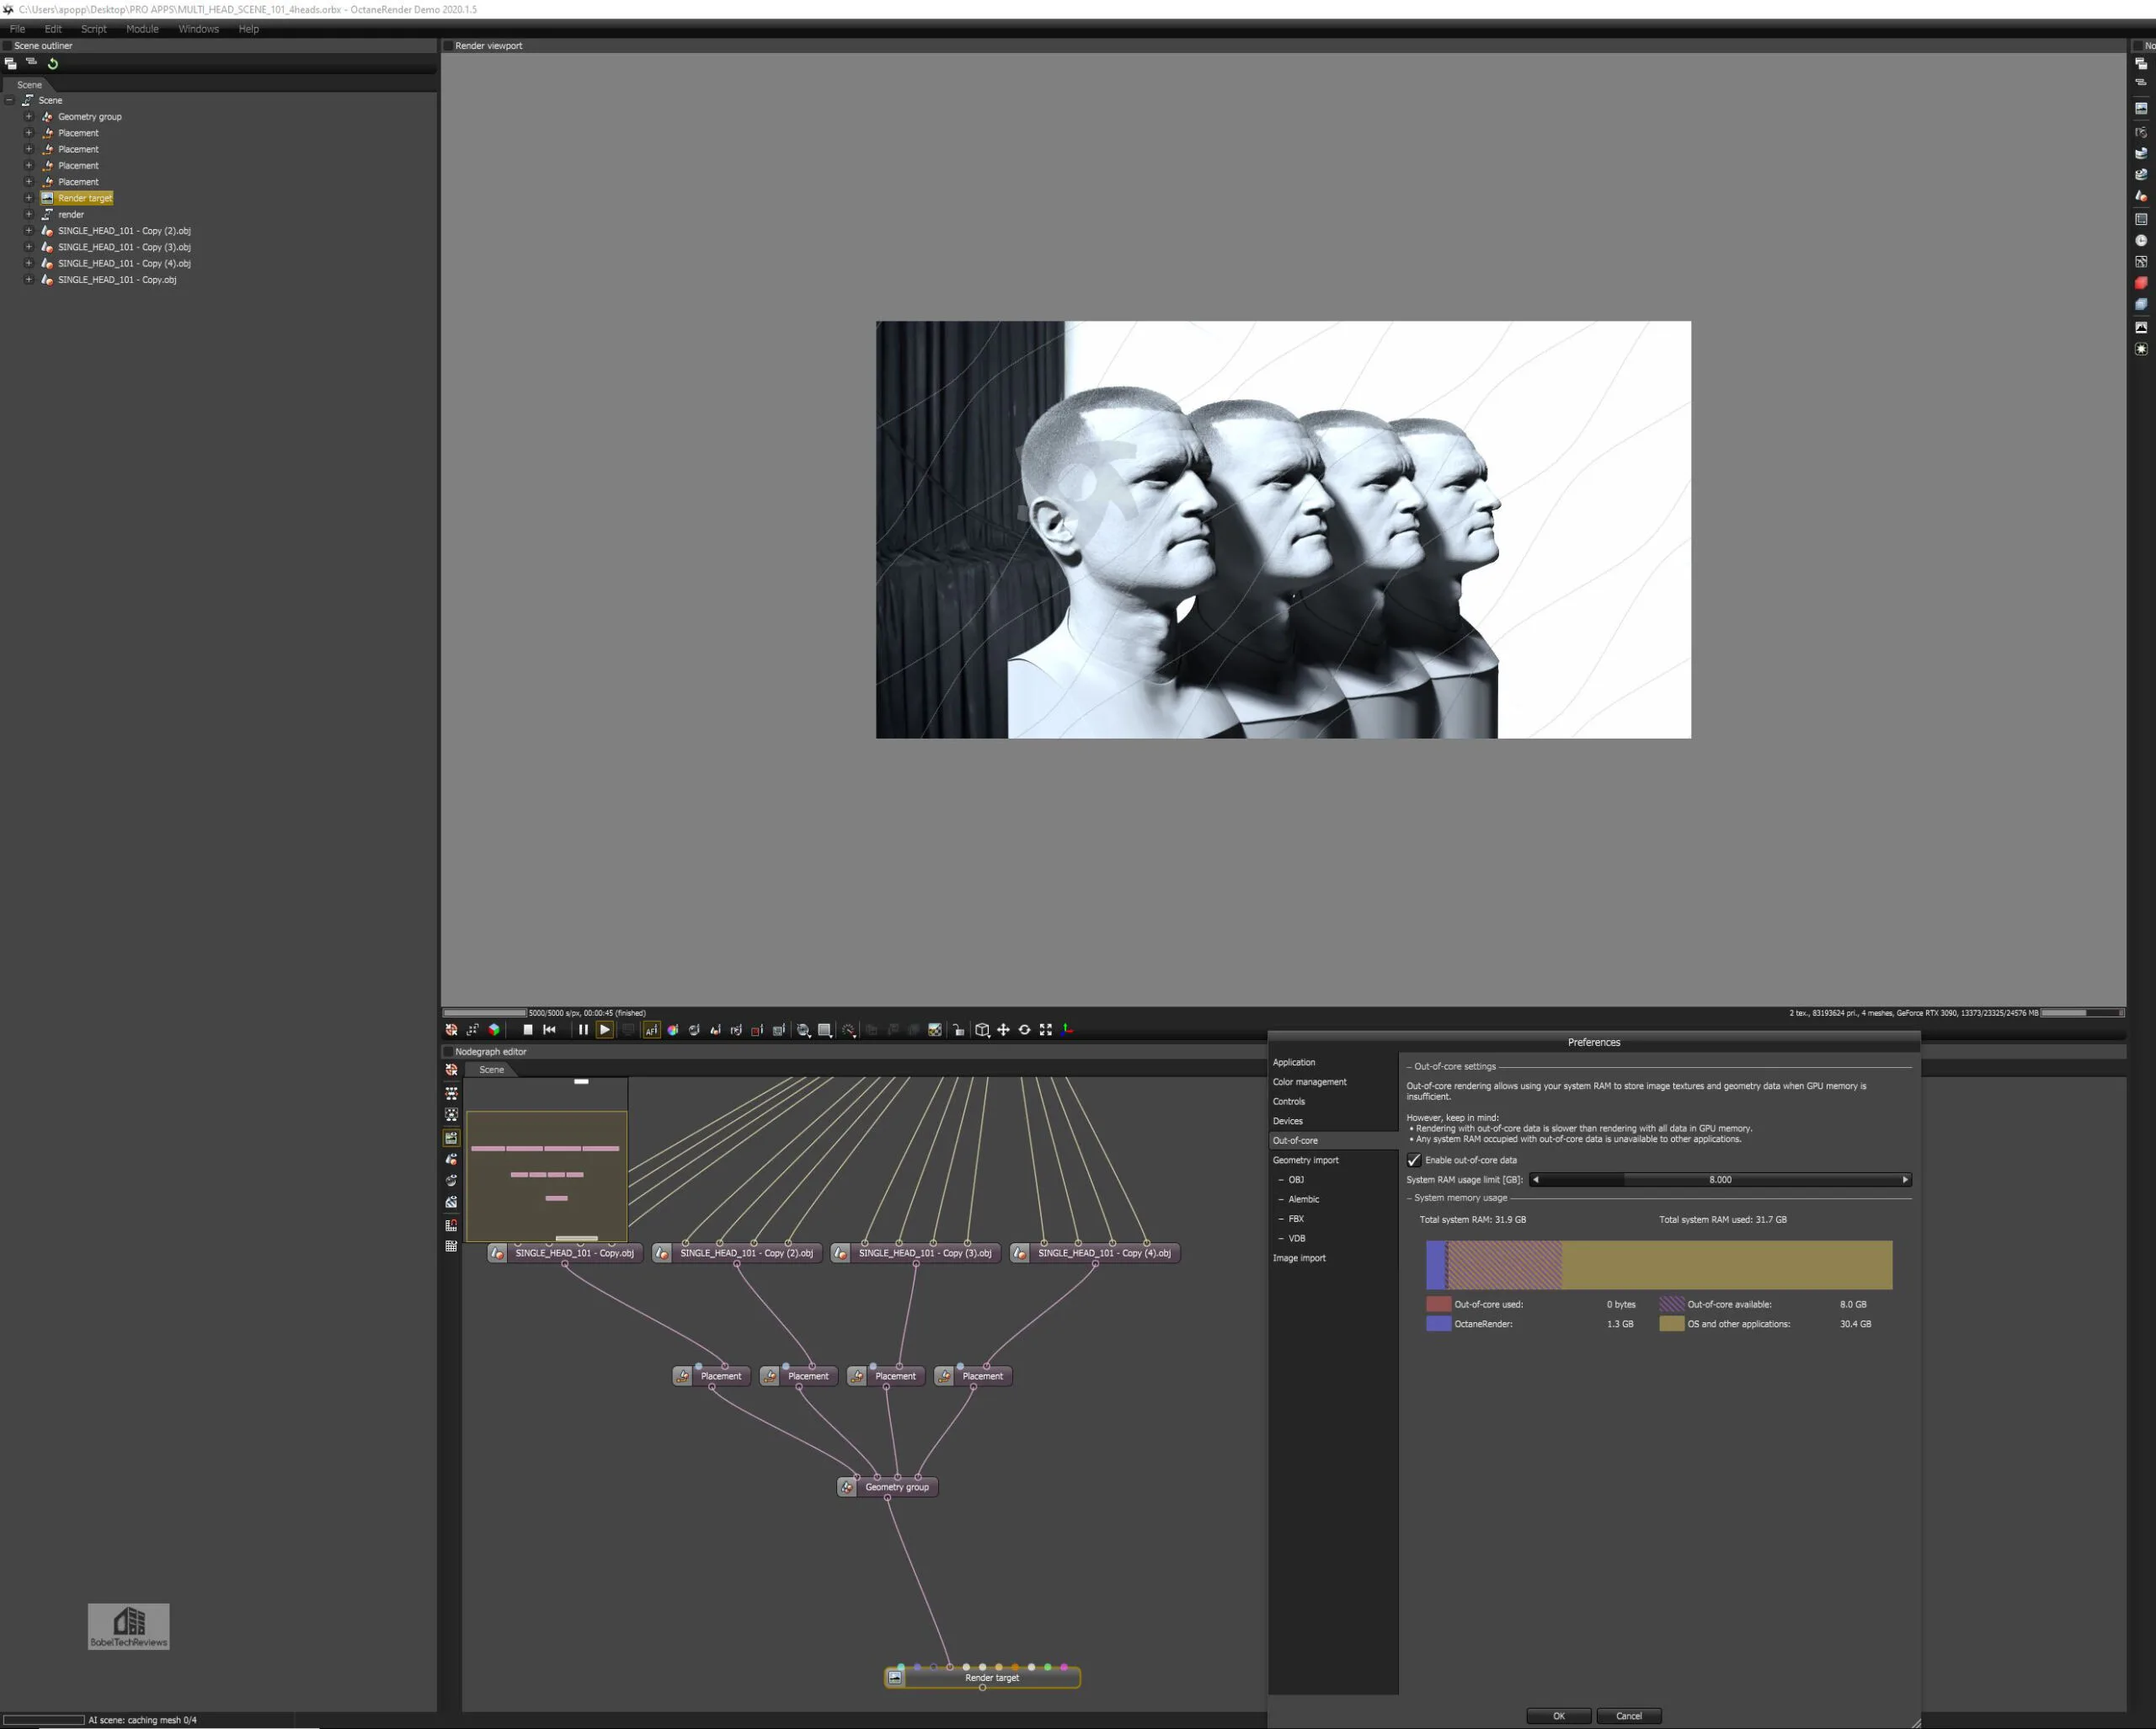
Here is the summary chart:
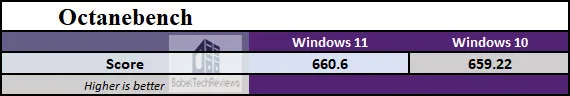
There is no meaningful difference between Octanebench benchmarks run on Windows 11 and Windows 10. Next up, SPECworkstation.
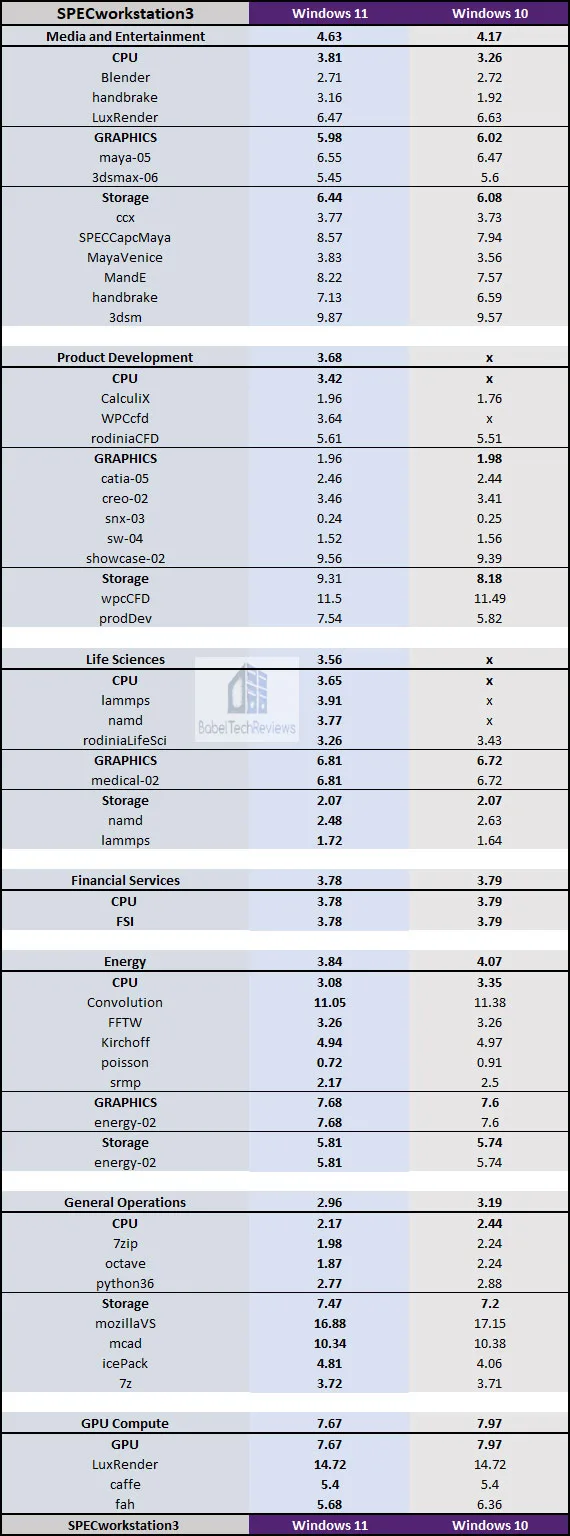
SPECworkstation3 (3.0.4) Benchmarks
All the SPECworkstation3 benchmarks are based on professional applications, most of which are in the CAD/CAM or media and entertainment fields. All of these benchmarks are free except to vendors of computer-related products and/or services. The most comprehensive workstation benchmark is SPECworkstation3. It’s a free-standing benchmark which does not require ancillary software. It measures GPU, CPU, storage and all other major aspects of workstation performance based on actual applications and representative workloads.
SPECviewperf 2020 GPU Benches
The SPEC Graphics Performance Characterization Group (SPECgpc) released a 2020 version of its SPECviewperf benchmark that features updated viewsets, new models, support for up to 4K display resolutions, and improved set-up and results management. We use 1900×1060 display resolution.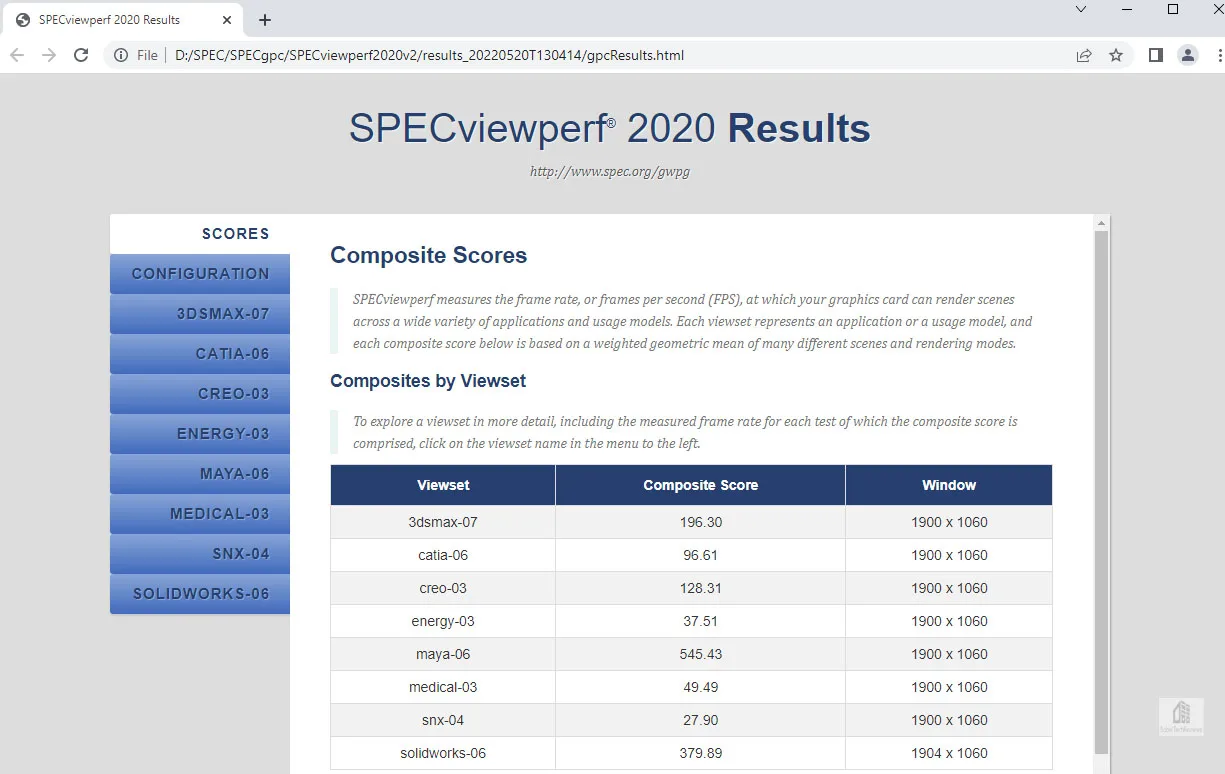 Here are SPECviewperf 2020 benchmarks summarized in the chart below.
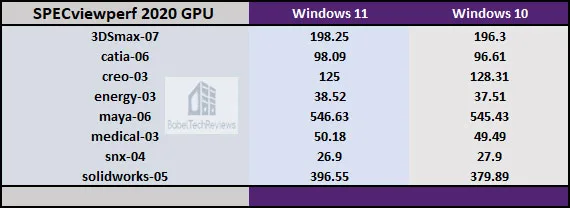
Again there is no clear winner between the OSes. Let’s head to our conclusion.
Final Thoughts
We can conclude from our benchmarking using the PCGz Hawaii Blue Elite i7-12700KF/DDR4/RTX 3080 FTW PC that there is very little performance difference between Windows 10 and Windows 11. There is no reason not to upgrade to Windows 11 although there appears to be no performance disadvantages to remaining on Windows 10.
As to enabling HAGS or not on Windows 11, we agree with Rodrigo who found some HAGS performance inconsistences but also concluded:
“Anyway, the HAGS feature is still quite promising and can improve performance in some cases, so we also recommend doing your testing to see how it works with your gaming rig and set of favorite games.”
Later this week, we will follow up with a T-FORCE NVMe SSD review and then with a VR review featuring the Hellhound RX 6650 XT versus the RX 6700 XT and versus the RTX 3060 Ti.
Happy Gaming!
Comments are closed.