The Turing RTX 2080 versus the Pascal GTX 1080 Ti Benchmarked with FCAT-VR
Less than two months ago, NVIDIA released its new Turing RTX 2080 which is a little faster than the Pascal GTX 1080 Ti in gaming performance. We naturally want to see how they each compare in Virtual Reality (VR), so we are following up with a five-game performance comparison measuring frametimes and unconstrained performance using FCAT VR.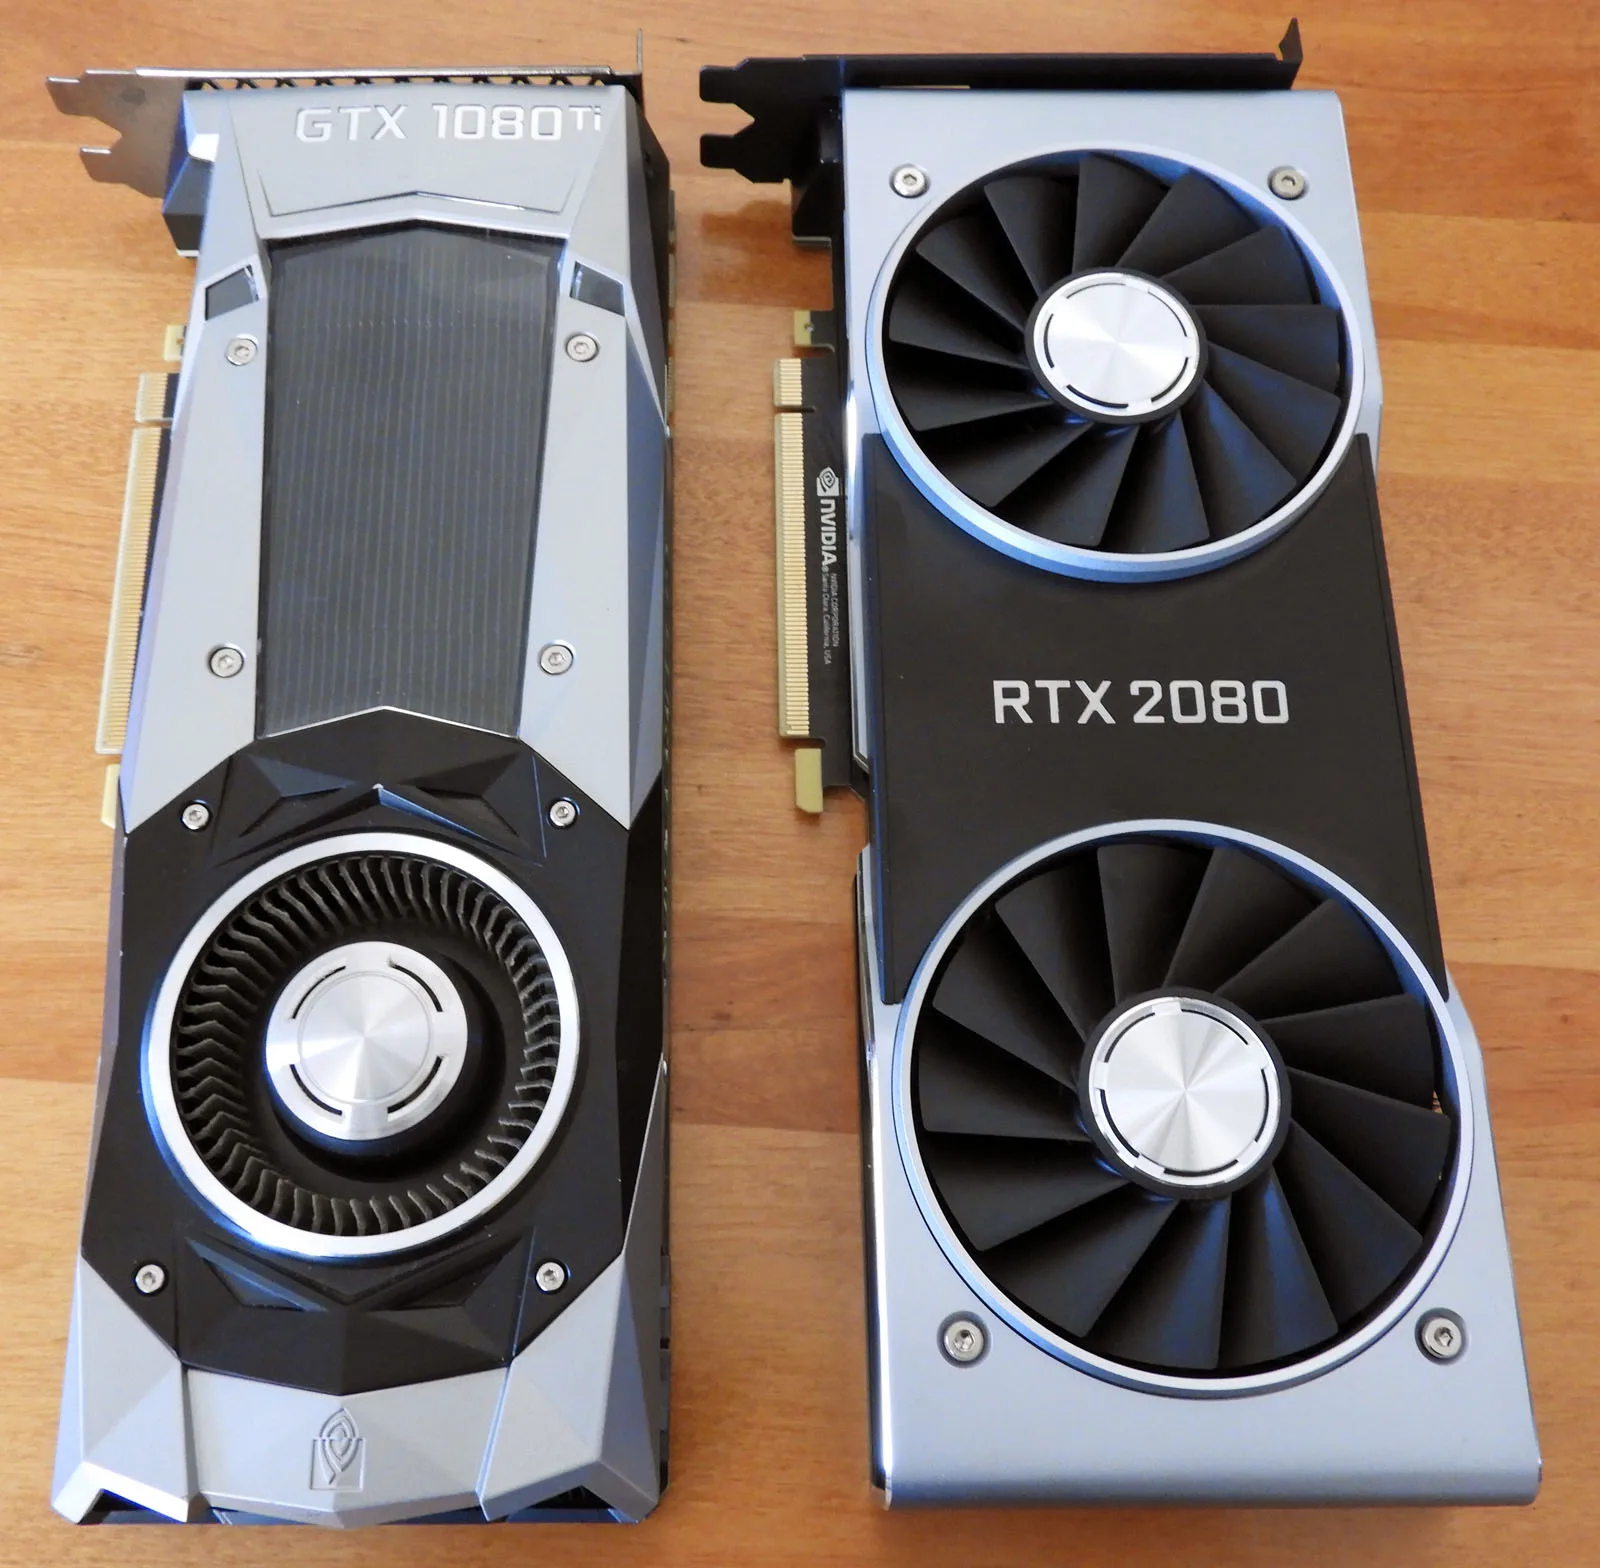
BTR has a 25 VR game benchmark suite, but this editor has been unable to enter VR due to a long illness without getting VR sick since May, and we are just now easing back into it. Since we posted our original review, we have benchmarked many more VR games in our follow-up reviews over the past two years. We have even compared FCAT VR with our own video benchmarks using a camera to capture images directly from a HMD lens. For BTR’s VR testing methodology, please refer to this evaluation.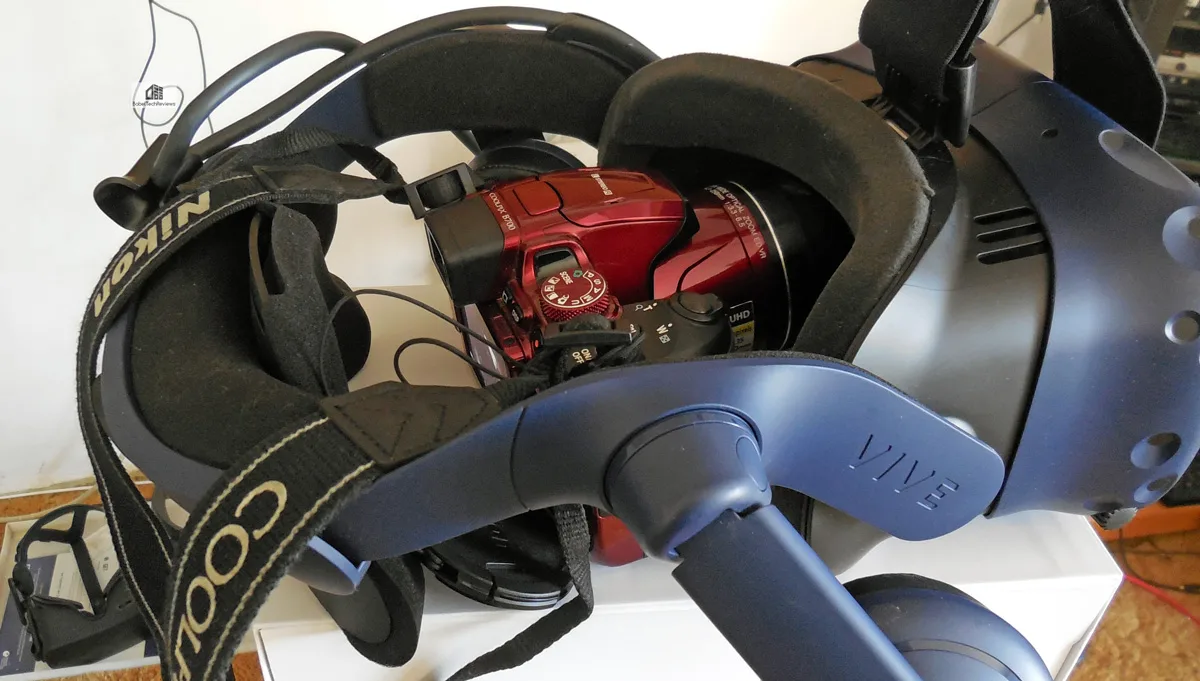
We will benchmark five Oculus Rift VR games with the GTX 1080 Ti Founders Edition versus the RTX 2080 Founders Edition using Intel’s Core i7-8700K at 4.7 GHz, an EVGA Z370 FTW motherboard and 16 GB of Kingston HyperX DDR4 at 3333 MHz on Windows 10 64-bit Home Edition. Here are the five VR games that we are benchmarking:
- Batman VR
- Chronos
- DiRT: Rally
- Project CARS 2
- Elite Dangerous
Until FCAT VR was released there was no universally acknowledged way to accurately benchmark the Oculus Rift. To compound the difficulties of benchmarking the Rift, there are additional complexities because of the way it uses a type of frame reprojection called asynchronous space warp (ASW) to keep framerates steady at either 90 FPS or at 45 FPS. It is important to be aware of VR performance since poorly delivered frames will actually make a VR experience quite unpleasant and the user can even become VR sick.
It is very important to understand how NVIDIA’s VRWorks functions to deliver a premium VR experience, and it is also important to understand how we can accurately benchmark VR as explained here. And before we benchmark our five VR games, let’s take a look at our Test Configuration on the next page.
Test Configuration – Hardware
- Intel Core i7-8700K (HyperThreading and Turbo boost is on to 4.7 GHz for all cores; Coffee Lake DX11 CPU graphics).
- EVGA Z370 FTW motherboard (Intel Z370 chipset, latest BIOS, PCIe 3.0/3.1 specification, CrossFire/SLI 8x+8x), supplied by EVGA
- HyperX 16GB DDR4 (2×8 GB, dual channel at 3333 MHz), supplied by HyperX
- RTX 2080 8 GB Founders Edition, stock FE clocks, supplied by NVIDIA
- GTX 1080 Ti 11 GB Founders Edition, stock FE clocks, supplied by NVIDIA
- 480 GB Team Group SSD
- 1.92 TB San Disk enterprise class SSD
- 2 TB Micron 1100 enterprise class SSD
- Seasonic 850W Gold Focus power supply unit
- EVGA CLC 280mm CPU water cooler, supplied by EVGA
- Onboard Realtek Audio
- Genius SP-D150 speakers, supplied by Genius
- EVGA DG-77, mid-tower case supplied by EVGA
- Monoprice Crystal Pro 4K
- Oculus Rift
Test Configuration – Software
- Nvidia’s GeForce 416.81 WHQL drivers. See Control Panel image below.
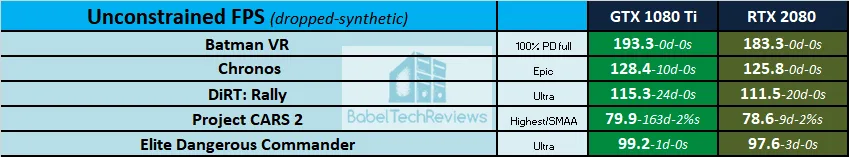
- Unconstrained framerate results show average frame rates in bold including dropped and synthetic frames shown on the chart next to the averages in a smaller italics font.
- Highest quality sound (stereo) used in all games.
- Windows 10 64-bit Home edition.
- Latest DirectX
- All 5 VR games are patched to their latest versions at time of publication.
- MSI Afterburner 4.6.0 Beta 9
- FCAT-VR Capture v0.9.3202.0 UAC
- FCAT-VR Beta 17
5 VR Game benchmark suite & 2 synthetic tests
Synthetic
- VRMark Cyan Room
- Unigine Superposition VR Benchmark 1080P Extreme
Oculus Rift VR Games
- Batman VR
- Chronos
- DiRT: Rally
- Project CARS 2
- Elite Dangerous
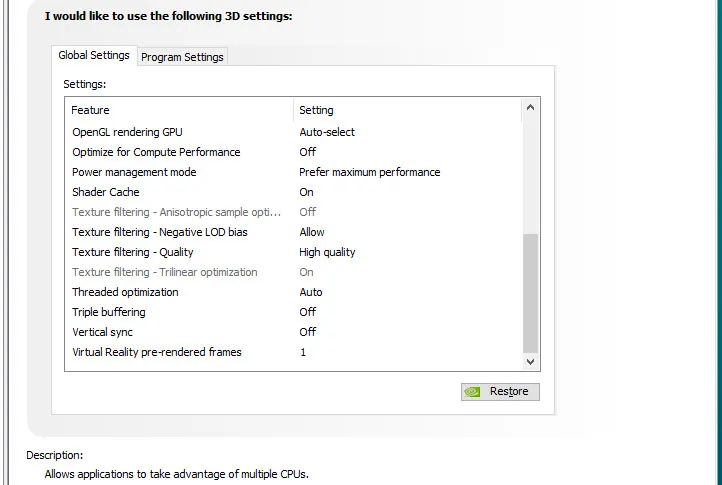
NVIDIA Control Panel settings:
Here are the NVIDIA Control Panel settings.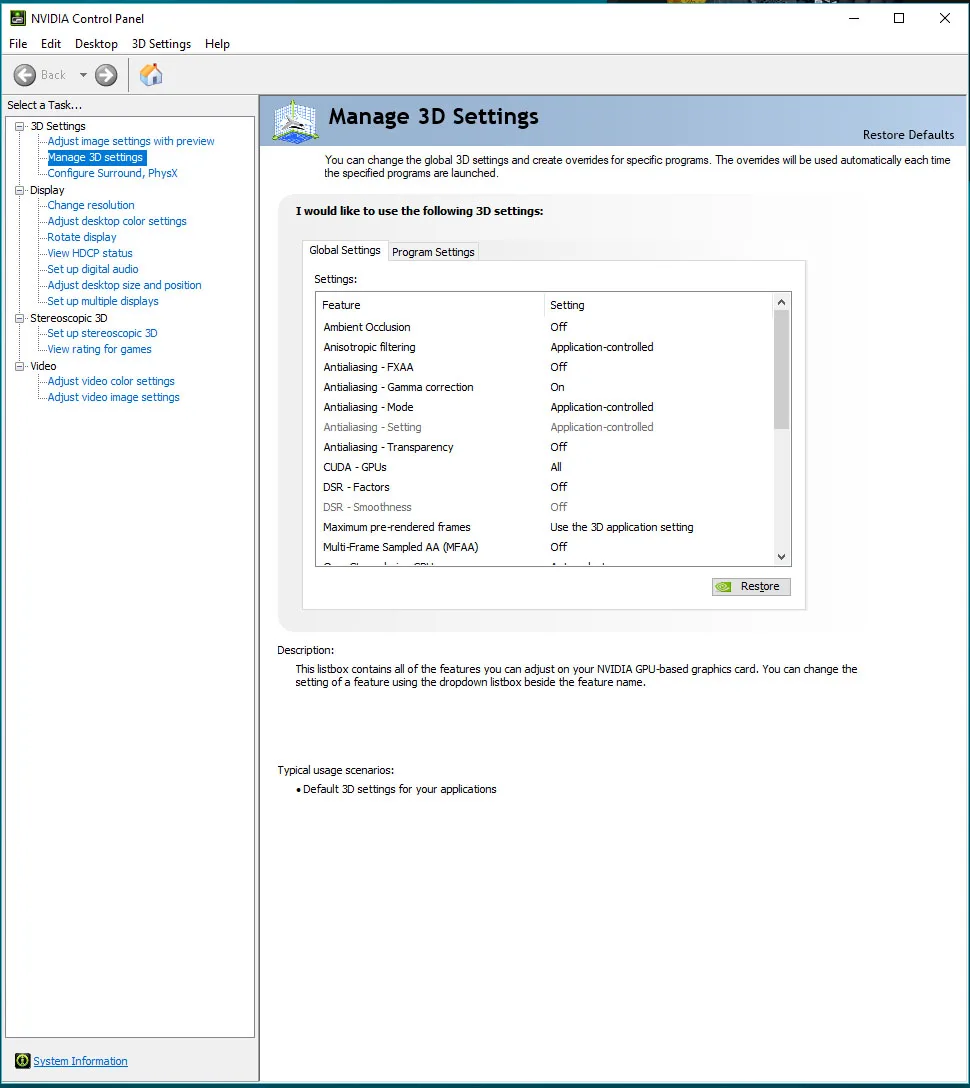
 We used MSI’s Afterburner to set both cards’ highest Power and Temperature targets. By setting the Power Limits and Temperature limits to maximum for each card, they do not throttle, but they can each reach and maintain their individual maximum clocks.
Let’s individually look at the VR games’ performance using two synthetic benches and five games using FCAT-VR.
Synthetic Benchmarks
We don’t give a lot of credence to synthetic benchmarks as they only are useful for the engines they are designed with and they have little to do with actual play in games. However, we used Unigine’s Superposition VR benchmark and VRMark’s Cyan Room benchmarks to see where our GTX 1080 Ti and RTX 2080 supposedly rank in relation to each other.
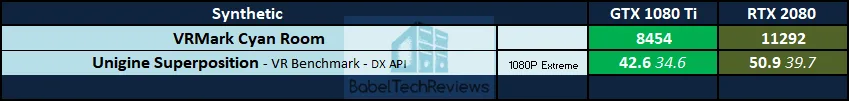
If we go by these synthetic tests, the RTX 2080 should be a lot faster in VR than the GTX 1080 Ti. Let’s see if this holds true for our five VR test games.
Batman Arkham VR
Batman Arkham VR is an unusual game that immerses you into Batman’s world but mostly doesn’t involve fighting. It is a short older game using the Unreal Engine that has a lot of interactivity with an emphasis on detective work and puzzle solving. 
Batman Arkham VR has few settings and we benchmark at its full resolution and with 100% pixel density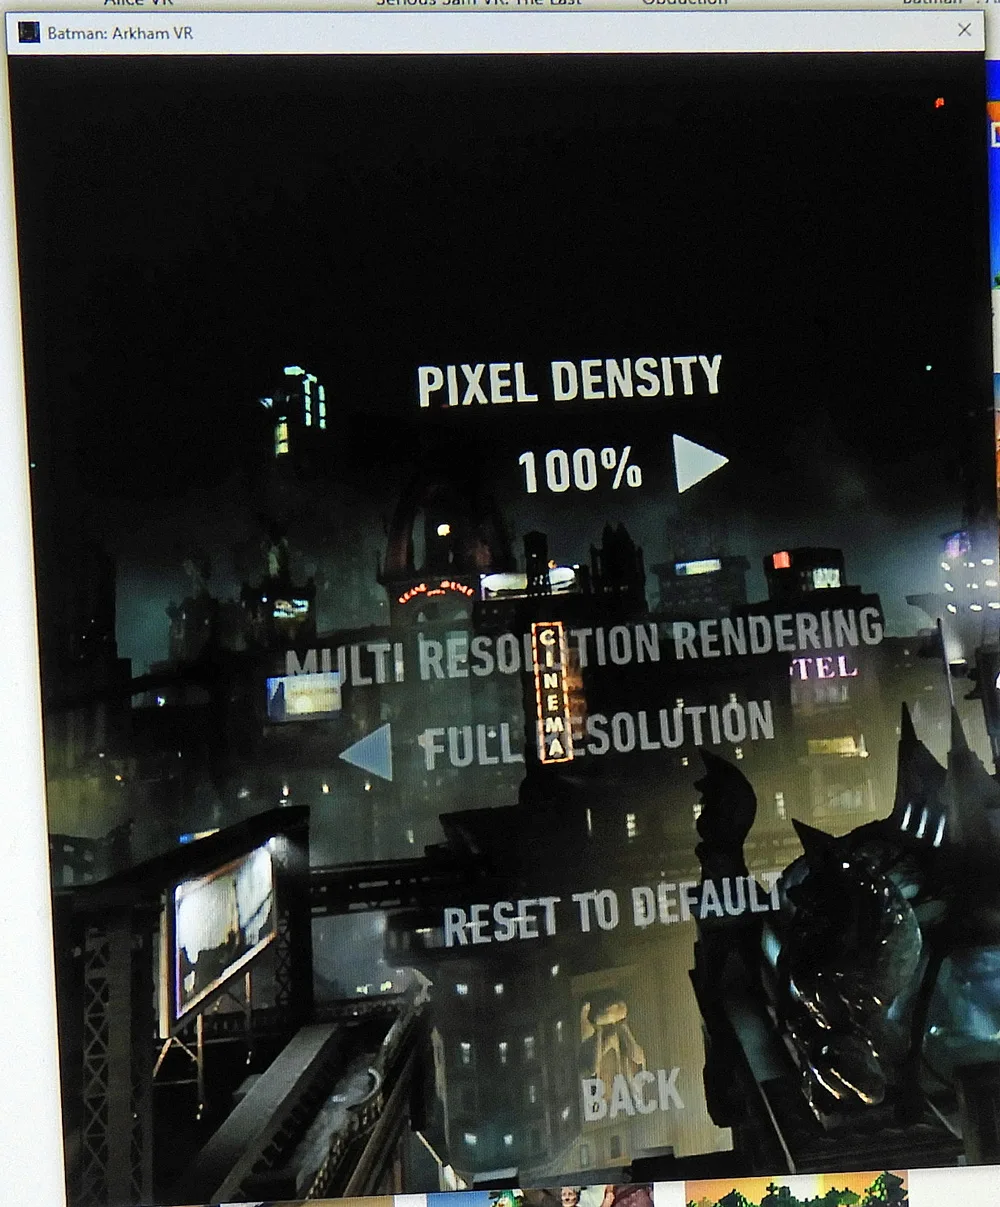
Here are the performance results of our two cards compared using the FCAT-VR generated chart.
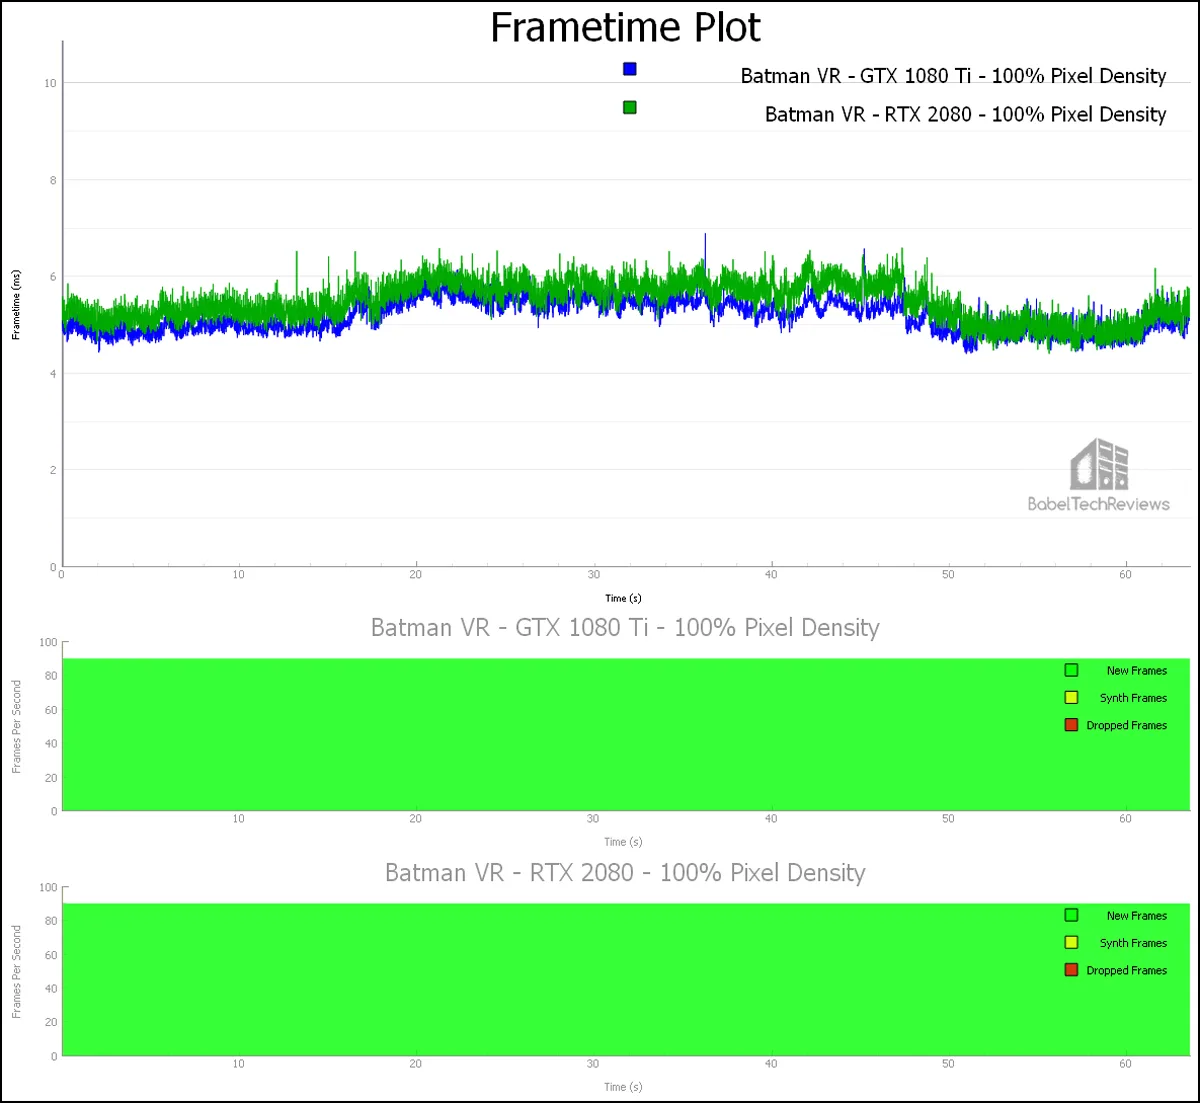
The unconstrained framerate of the GTX 1080 Ti is 193.3 FPS and surprisingly, it is faster than the RTX 2080 which manages 183.3 FPS. Neither card drops any frames or has to resort to generating synthetic frames using ASW in this older VR game.
Chronos
Chronos is a Rift launch title with graphics options that are still good for GPU testing. It is an very well-made 3rd-person view RPG, and it is also very difficult. It offers at least 15 hours of play with many puzzles to solve as well as requiring the player to be good in combat, especially with defense and attack timing. Overall Chronos is an excellent VR game.
We picked Epic which is the highest settings for each option.

Here is the FCAT-VR generated chart for Chronos.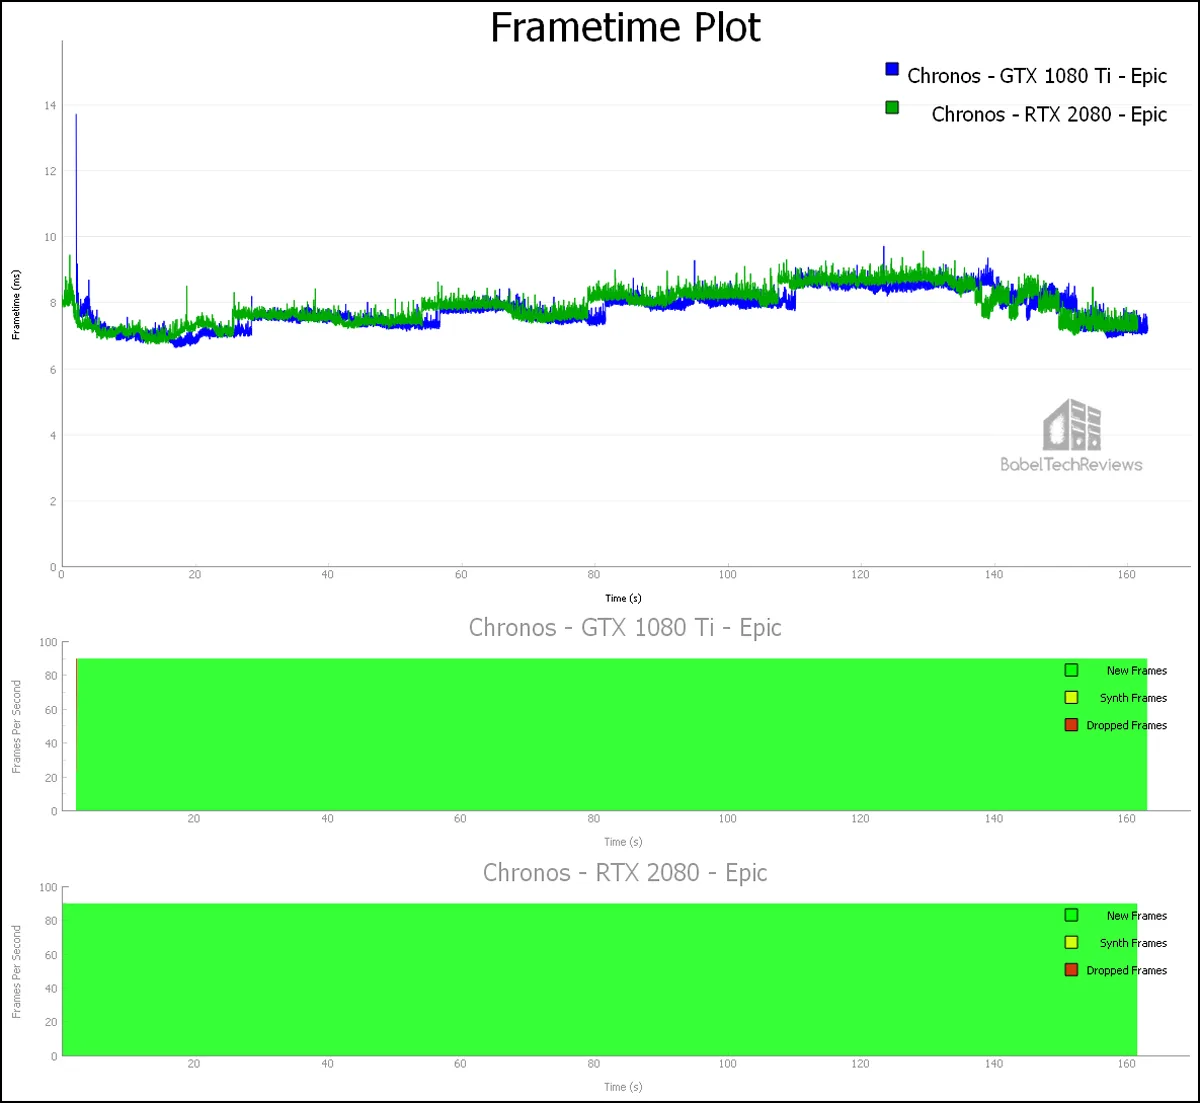
Again, the GTX 1080 Ti is slightly faster with 128.4 unconstrained FPS while the RTX 2080 manages 125.8 FPS. However, the GTX 1080 Ti drops 10 frames while the RTX 2080 doesn’t drop any.
Let’s check out DiRT: Rally next.
DiRT: Rally
DiRT: Rally has a built-in benchmark that is very repeatable. If the framerate drops below 90 FPS, the Test Summary of the built-in benchmark accurately shows the minimum as 45 FPS (with ASW reprojection). Unfortunately, it does not display unconstrained FPS or frametimes so we use FCAT-VR.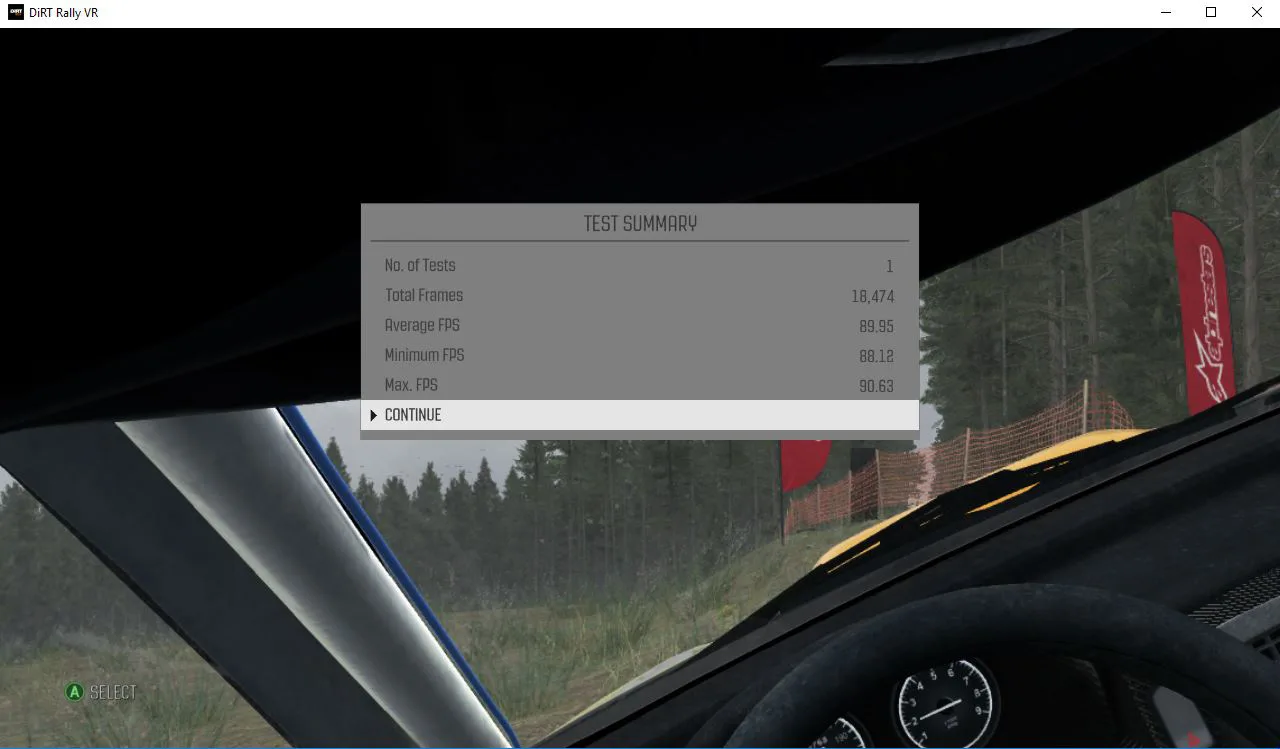 DiRT: Rally is a fun and demanding game for either PC gaming or for VR that requires the player to really learn its challenging road conditions. Best of all, DiRT: Rally has a lot of individual settings that may be customized although we benchmarked using the stock “Ultra” preset.
Here is the DiRT: Rally benchmark as run by our 2 test cards and charted by FCAT-VR.
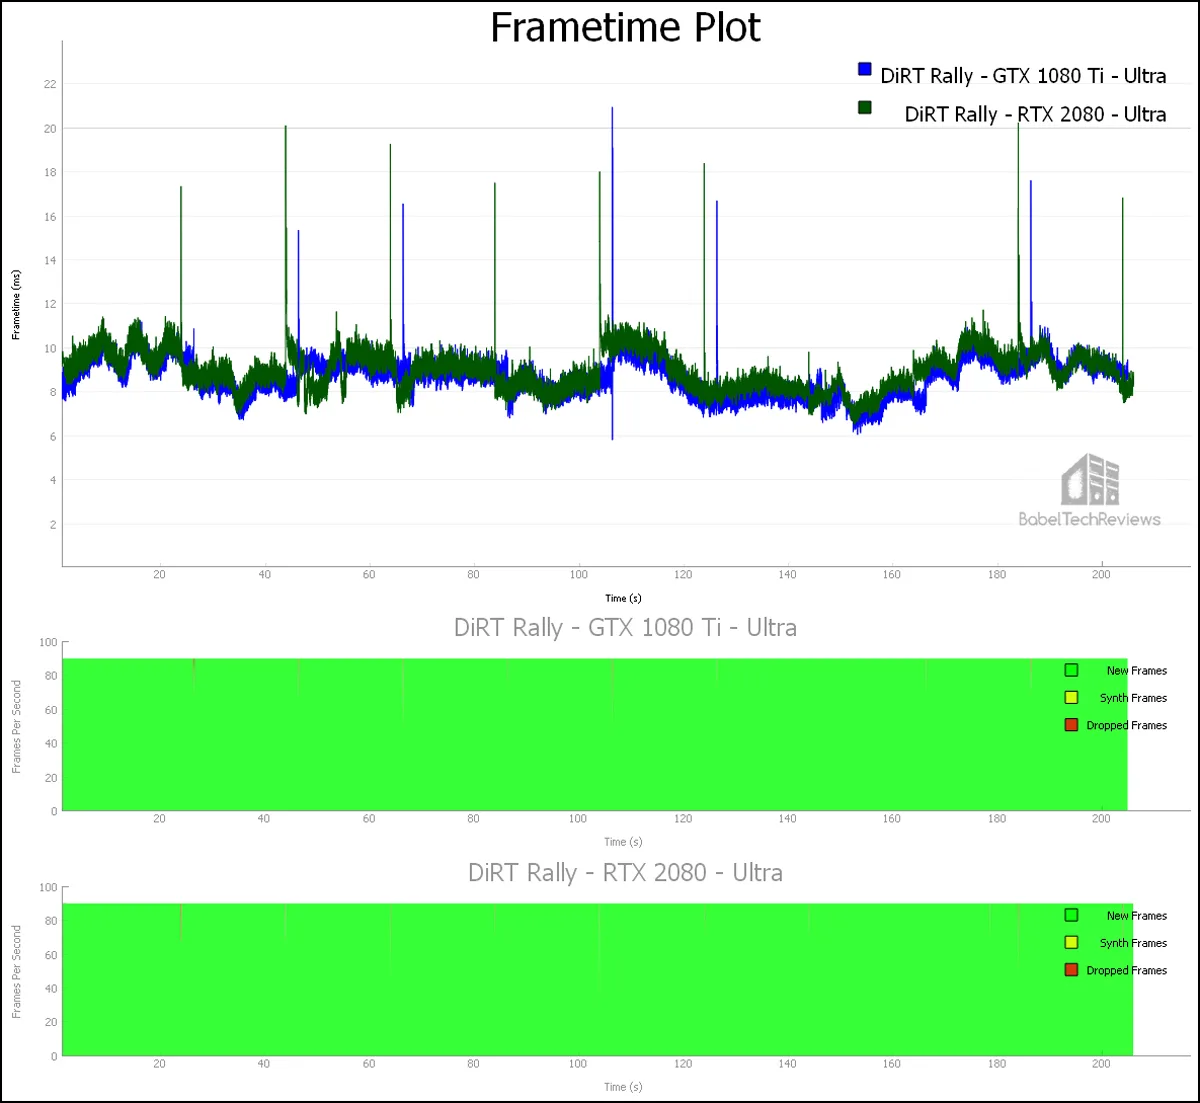
Again, the GTX 1080 Ti edges out its faster pancake gaming competitor with 115.3 unconstrained frames per second while the RTX 2080 manages 111.5 FPS. The GTX 1080 Ti drops 24 frames to the 20 frames the RTX 2080 drops, and neither card generates any synthetic frames.
Next we will check out a more demanding VR game, Project CARS 2.
Project CARS 2
One has to experience Project CARS 2 as a player to appreciate it, and there is absolutely no way to convey the incredible sense of immersion that comes from playing it in VR using a wheel and pedals.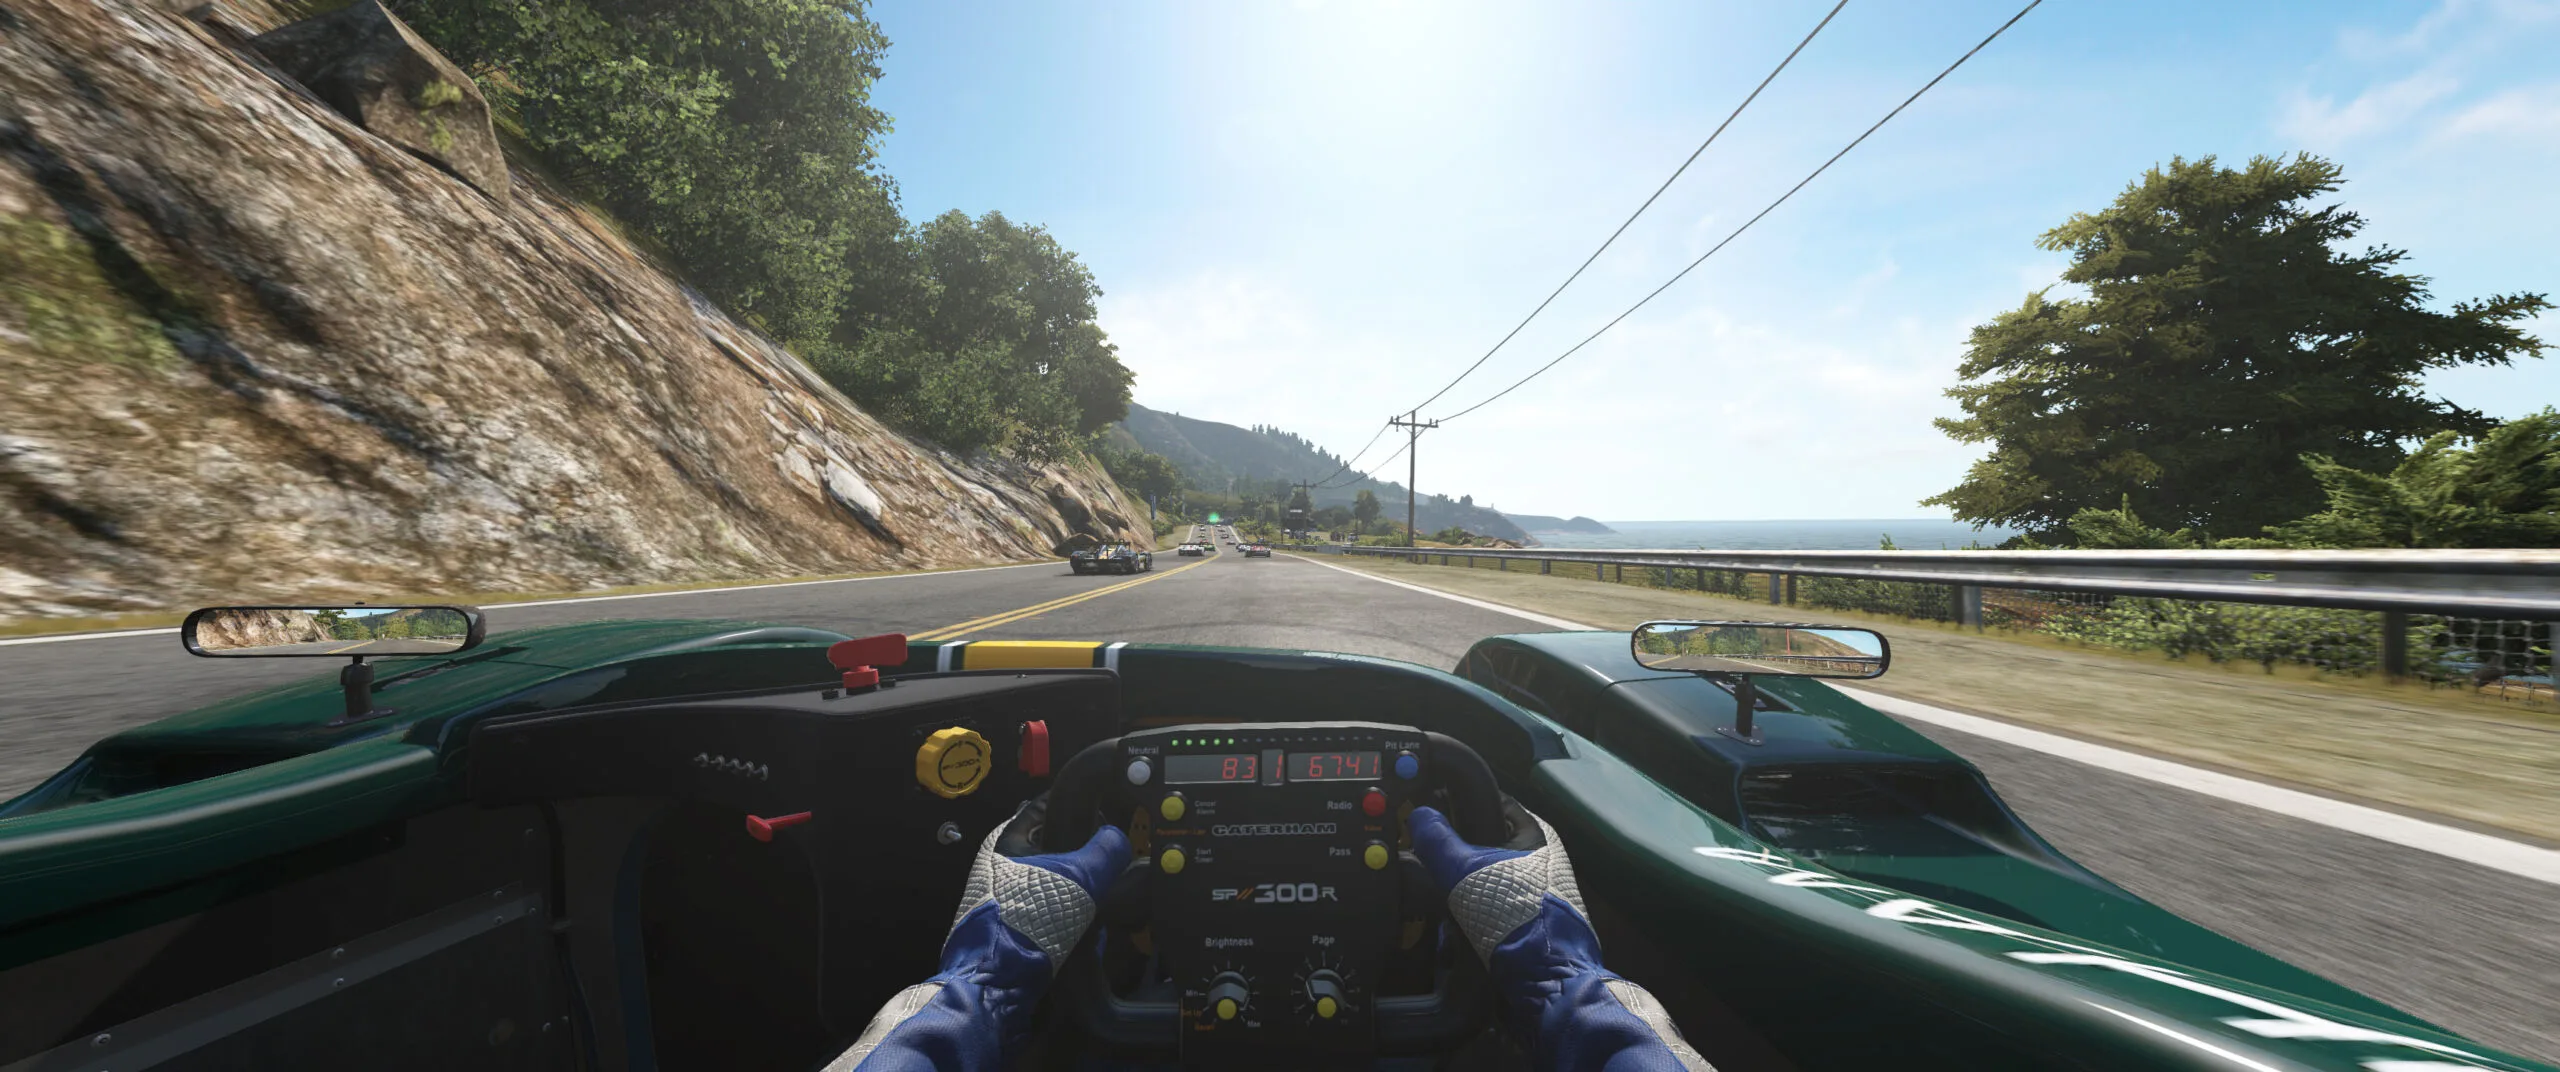
Project CARS 2 is a huge game that a player may spend hundreds of hours with, and there is a learning curve as one cannot just jump into a supercar and expect to immediately race successfully. Project CARS 2 is a sim, and although it can be dumbed-down into an arcade-style racer, it is best played with a racing wheel and pedals.
Project CARS 2 offers many performance options and settings, and we prefer playing with SMAA Ultra which appears to give a bit of temporal anti-aliasing.
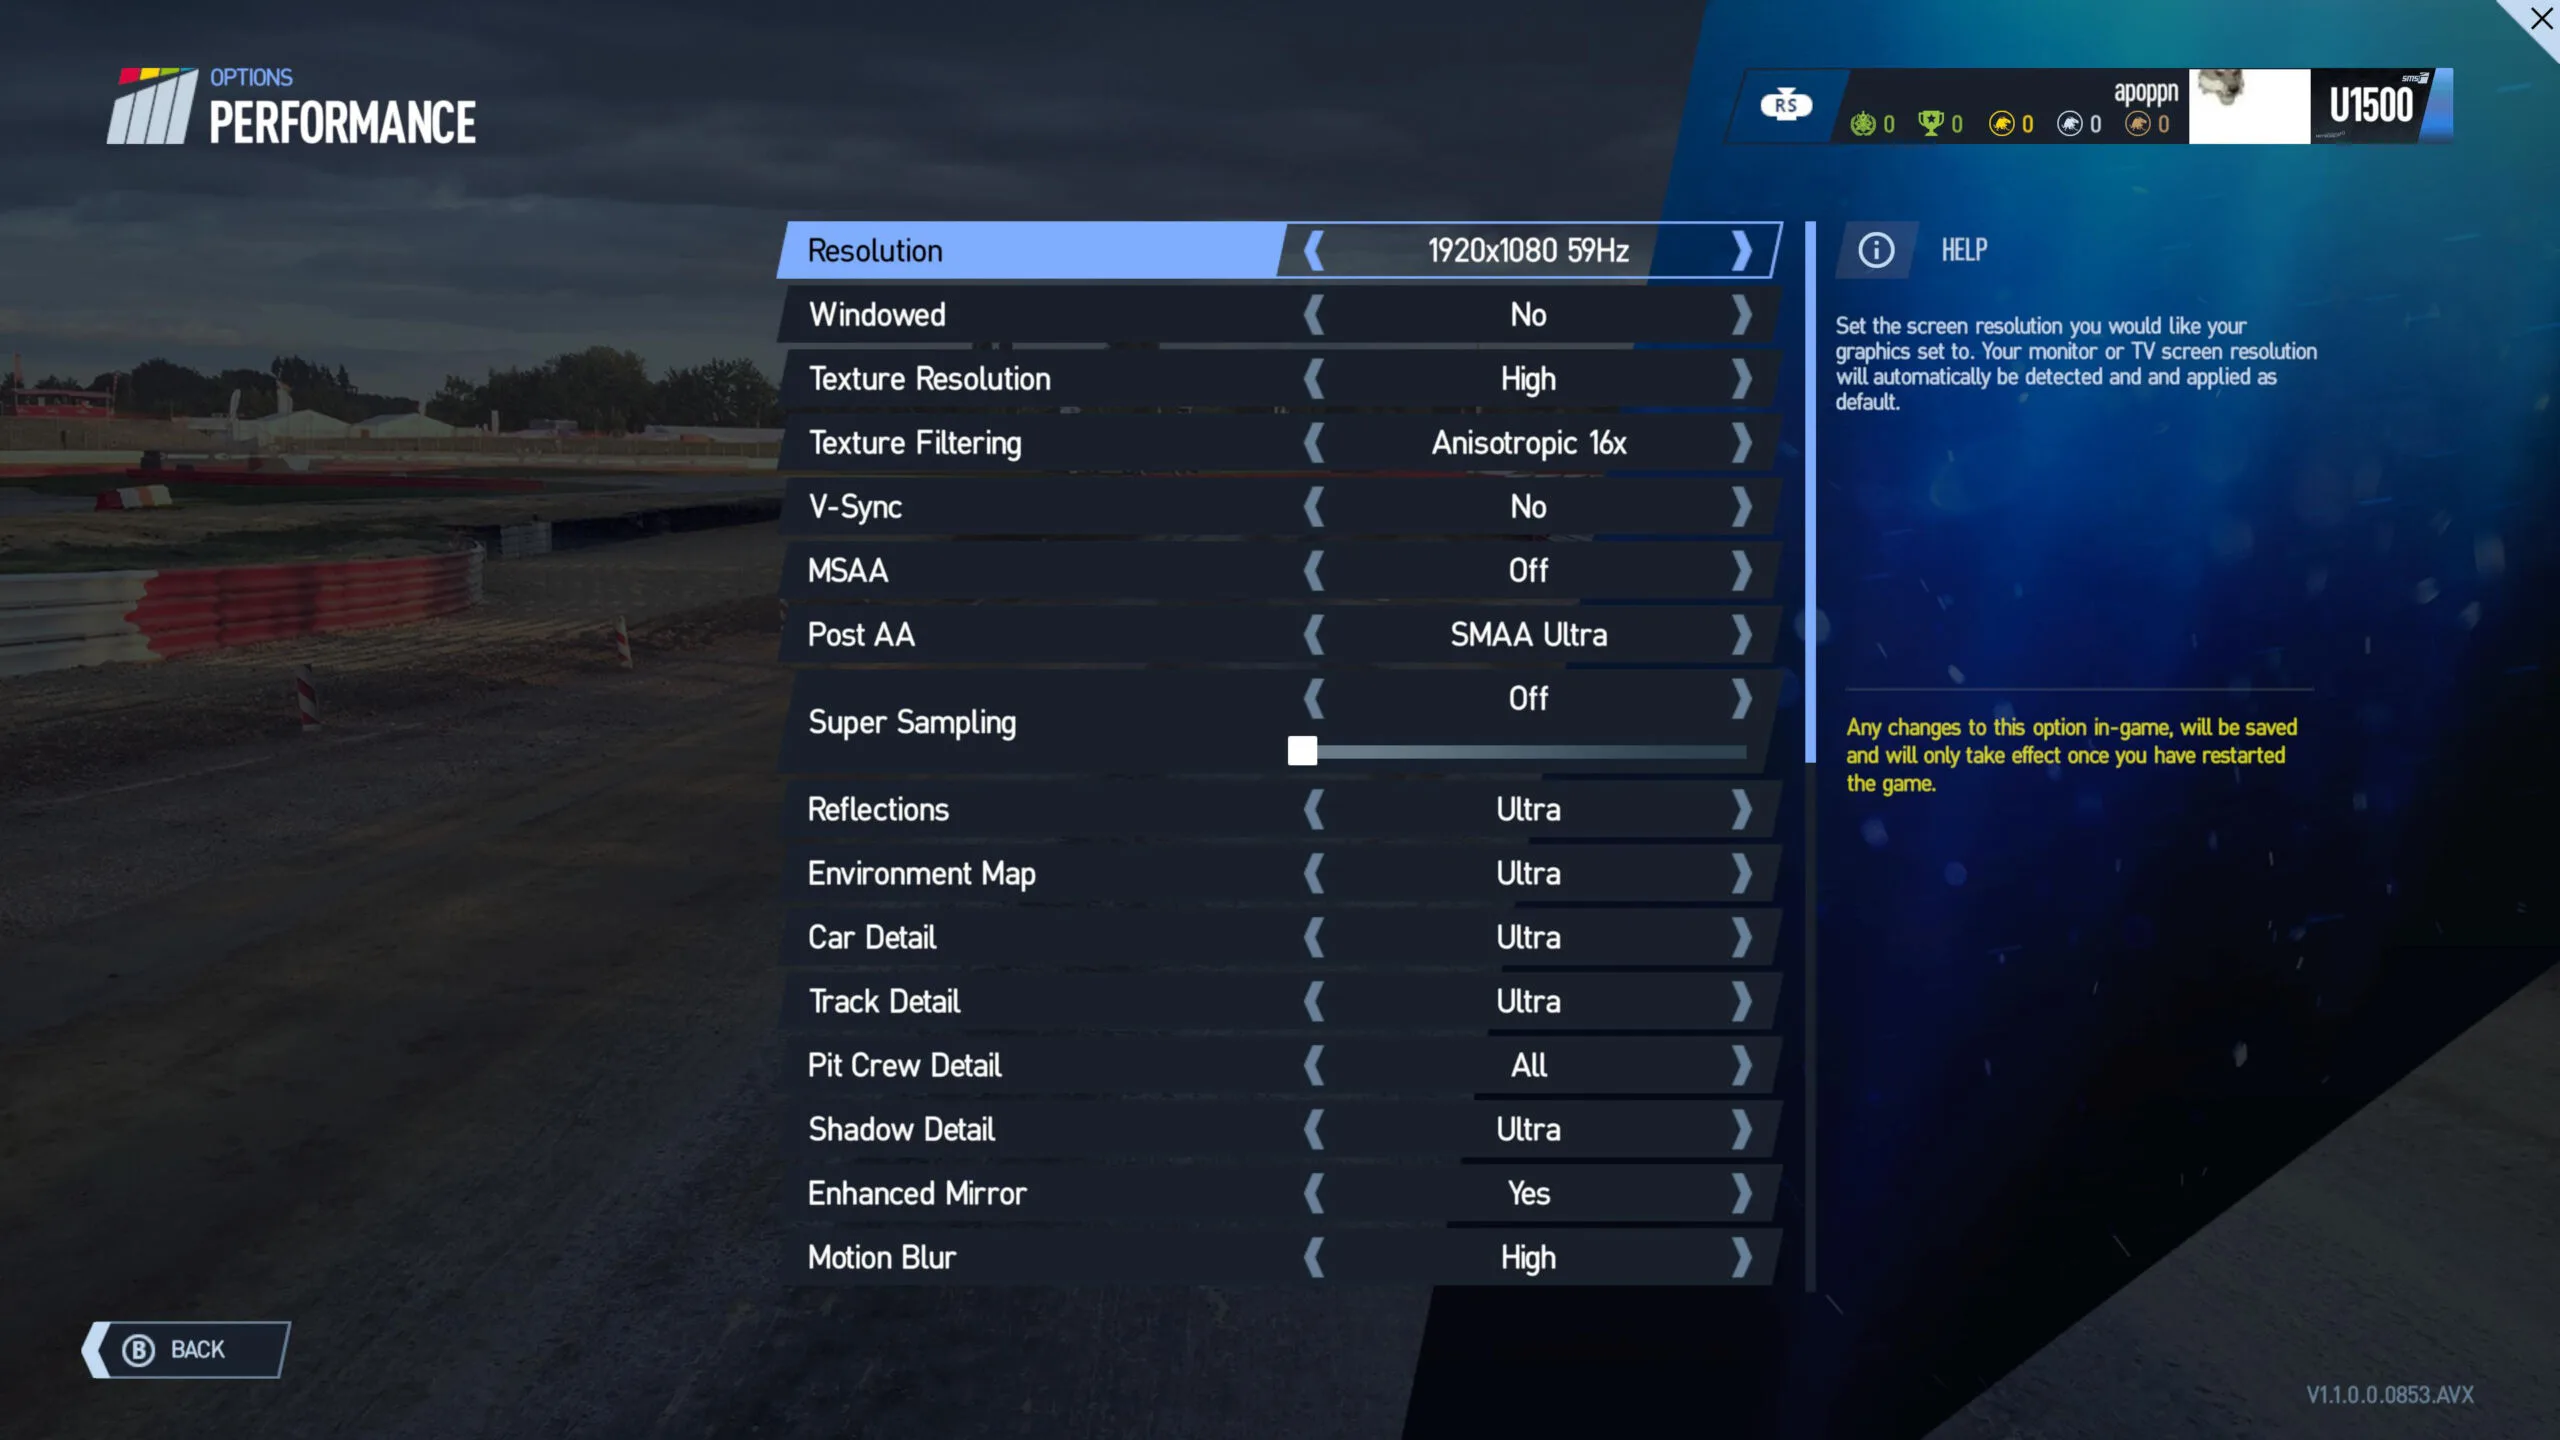
There are no overall default “ultra”, “high”, “medium”, or “low” settings, so we picked the SMAA Ultra pre-set and we used maximum settings – except for Motion Blur which looked best to us on Low. Other individual setting were moved to their highest settings including Pit Crew Detail to “All” and “Yes” for Enhanced Mirrors. For VR we set our mirrored desktop resolution to a windowed 1024×720.
Since our chosen settings are demanding, Project CARS 2 makes good use of the Oculus Asynchronous Space Warp (ASW) feature so that a card delivering less than 90 FPS will intelligently reproject every other frame and will still be playable without causing VR sickness. We would recommend, however, lowering grass and reflections to maximize framerate delivery outside of benchmarking.
Here are the results of our FCAT-VR benching.
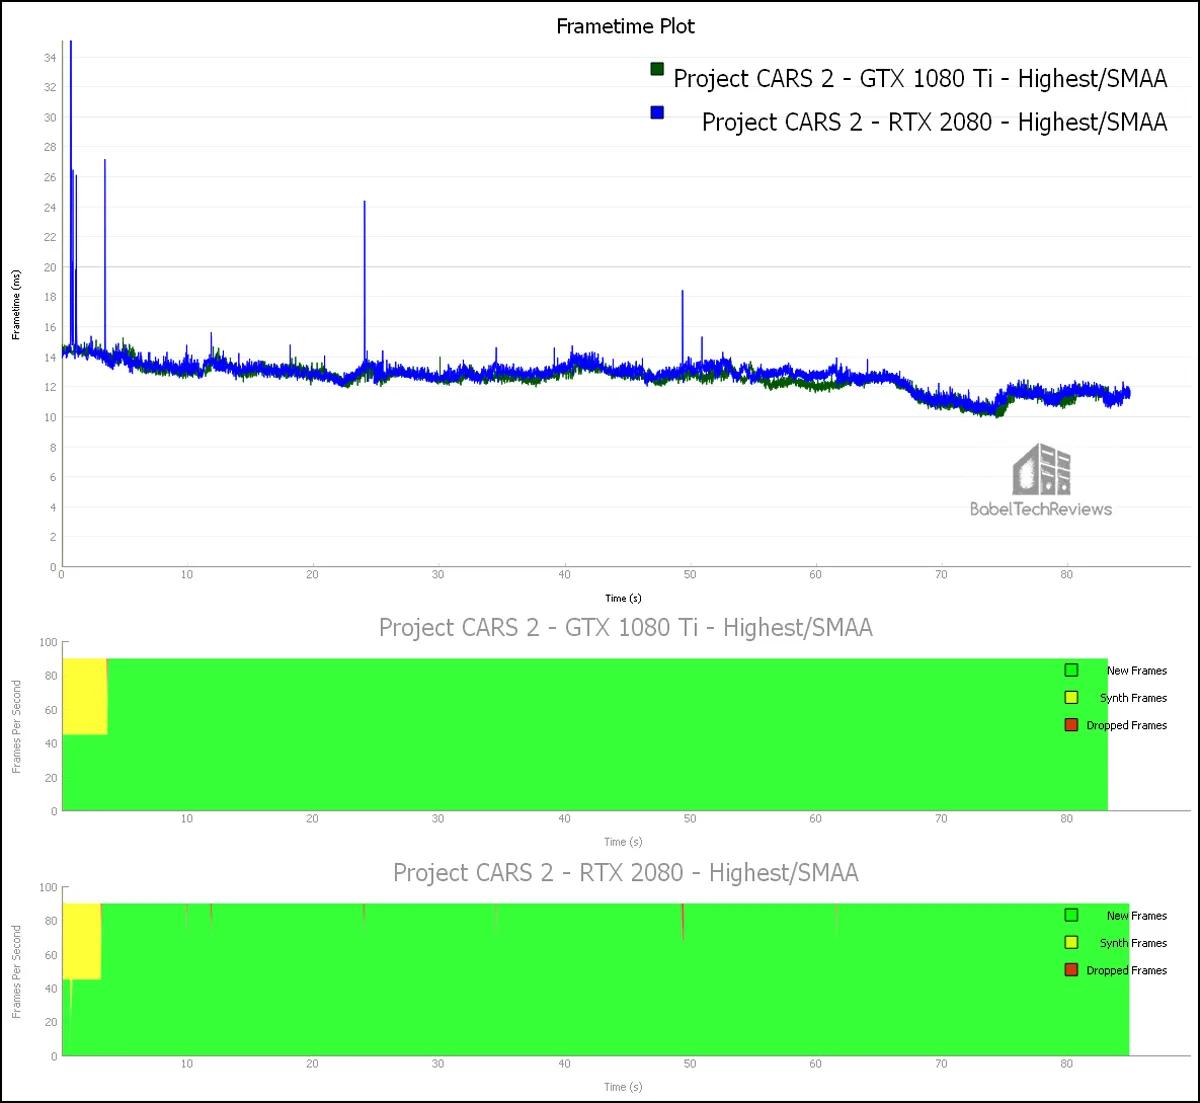
At our very high settings, neither card can deliver the ideal 90 frames per second to avoid ASW, so there was a 2% frame reprojection for both cards. Again, the GTX 1080 Ti edged out the RTX 2080 by a very slight margin – the Ti delivered 79.9 unconstrained frames per second while the RTX 2080 managed 78.6 FPS. However, the GTX 1080 Ti dropped only 1 frame while the RTX 2080 dropped nine.
Let’s look at our last VR test game, Elite Dangerous.
Elite Dangerous
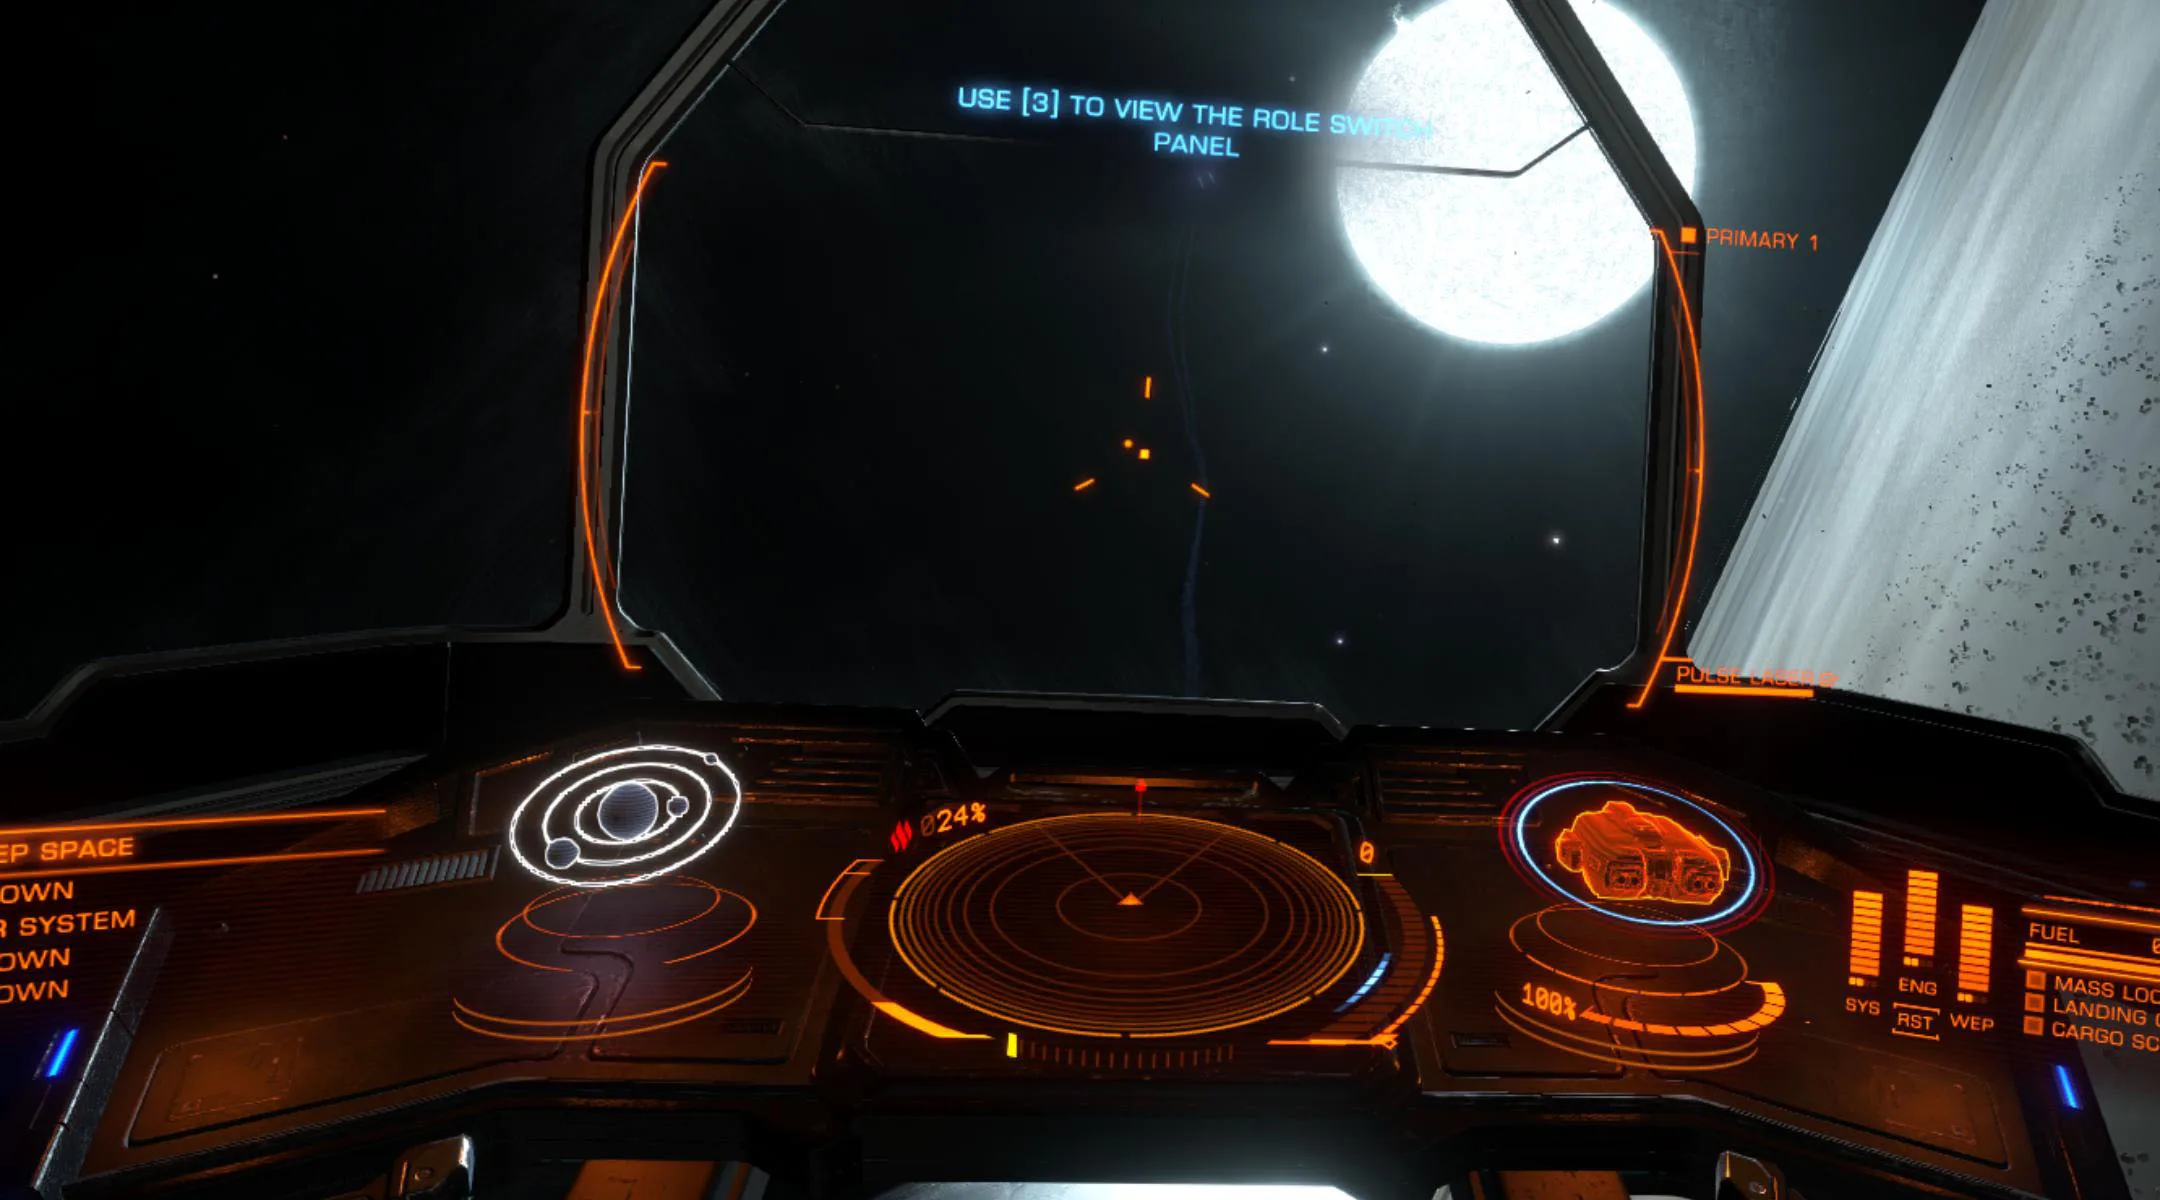 Elite Dangerous is a space sim with many options, and it is difficult to find a repeatable benchmark outside of the training missions. A player will spend a lot of time as the pilot of a space cruiser looking at a skybox of nearly empty space as they explore the universe completing a multitude of tasks. It is also co-op and multiplayer, and you need to be connected to the Internet to play. It has been updated often and has a very dedicated following of players.
We picked the default Ultra setting and maxed out our FoV. Here are the frametimes comparing the GTX 1080 Ti with the RTX 2080.
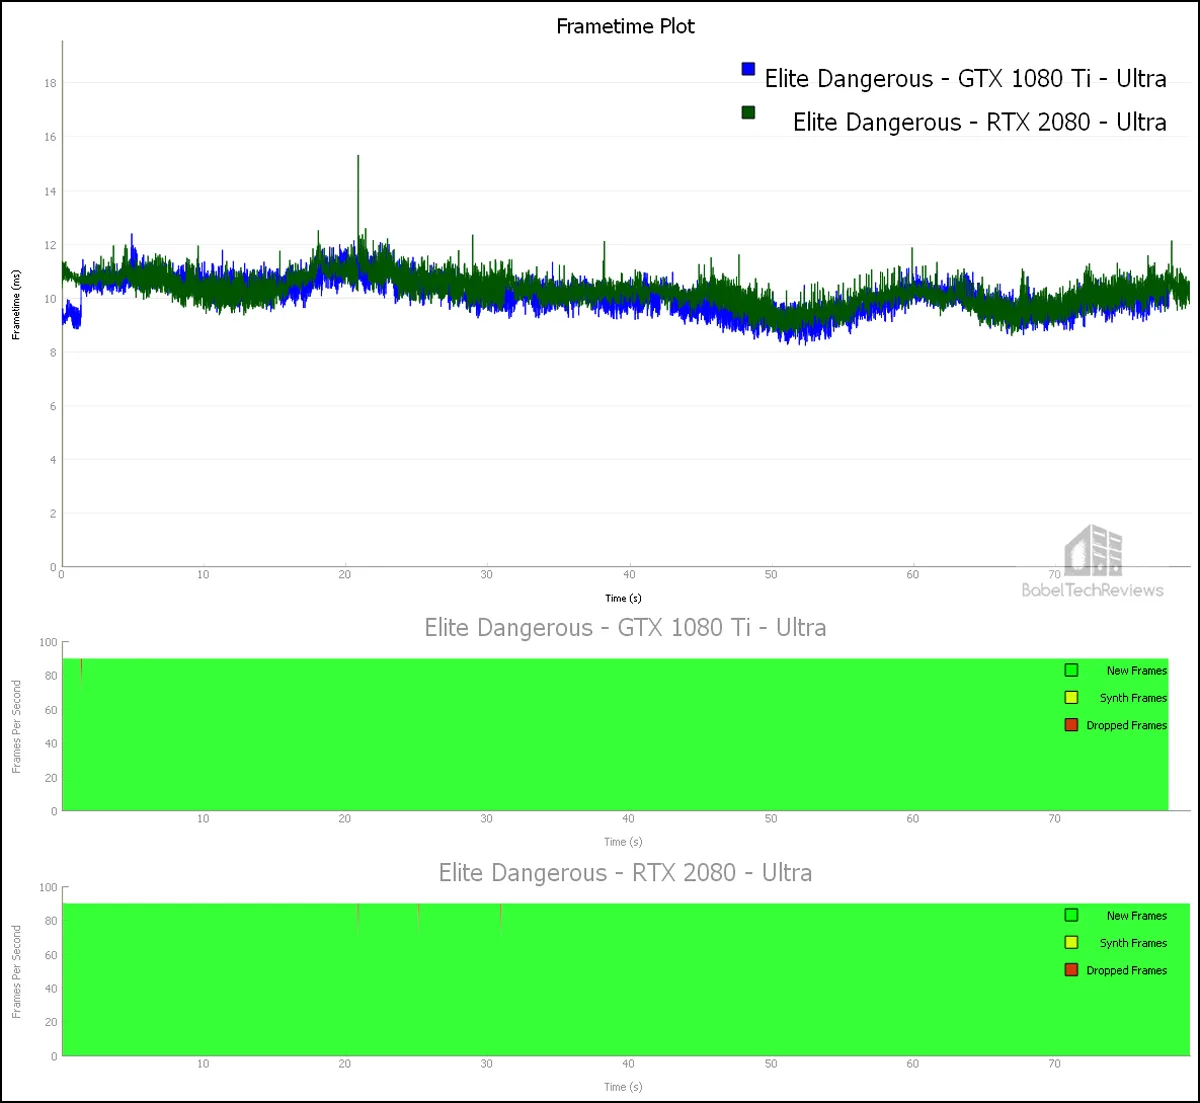
Again as in the 4 other games we tested, the GTX 1080 Ti edges out the RTX 2080 by a very slight margin. The GTX 1080 Ti delivers 99.2 unconstrained frames per second with one dropped frame, while the RTX 2080 delivers 97.6 FPS with 3 dropped frames. No synthetic frames were needed to be generated.
Let’s take a look at our overall Unconstrained Framerate chart summing up our five test games before we head to our conclusion.
Let’s check out our conclusion.
Conclusion
We were totally surprised that although the synthetic benchmarks indicated that the RTX 2080 would be much faster than the GTX 1080 Ti, the five games that we tested indicated that both cards are currently in the same class with the older Pascal card slightly edging out the newer Turing card.
We suspect that Turing’s VR drivers may not yet be mature, and we will return to benching our two cards again with our full 25 VR game benchmark suite at a later date. We also will benchmark the Turing flagship, the RTX 2080 Ti, and also the RTX 2070, and we will compare them with AMD’s fastest cards, the RX Vega 64 liquid cooled edition and the Red Devil RX Vega 56 to see how they all fare in VR.
Stay tuned, we are benching a brand new card for review this coming Thursday, and the results so far have surprised us.
Happy gaming!