The $1199 RTX 4080 Founders Edition VR Performance Review plus SPEC, Pro Apps, Workstation & GPGPU (Part 1)
BTR received a $1199 RTX 4080 Founders Edition (FE) from Nvidia but are late because we got a bad case of COVID-19 after the AMD Event in Las Vegas over two weeks ago. This Part 1 RTX 4080 review is a 10-VR game performance analysis versus the RTX 3080 Ti, the RTX 4090, and the RX 6900 XT using the Valve Index. Although the RTX 4080 is not a workstation card, we have included workstation SPEC benches and selected popular creative and synthetic apps. Next week, Part 2 will feature the performance of more than 40 games and we will include DLSS 3.0 results.
We will focus on raw VR performance to consider whether the new RTX 4080 Founders Edition at $1199 delivers a good value as a compelling upgrade from the last generation Ampere RTX 3080 Ti which also launched at $1199. We will also compare performance with Nvidia’s current flagship, the $1599 RTX 4090, and the former AMD flagship, the RX 6900 XT, which launched at $999. In addition to gaming, VR, and SPECworkstation3 GPU results, we have added creative results using Geekbench, the Blender 3.3.0 benchmark, and complete Sandra 2020 and AIDA64 GPGPU benchmark results plus some pro applications including Blender rendering and OTOY OctaneRender.
We benchmark using FCAT VR and Windows 11 Pro Edition 2H22 with Intel’s Core i9-13900K that we just upgraded from i9-12900K, and 32GB of T-FORCE DELTA RGB 6400MHz CL40 DDR5 2x16GB memory on an ASUS Prime-A Wi-Fi Z790 motherboard. All games and benchmarks are patched to their latest versions, and we use GeForce Game Ready 526.98 drivers for GeForce cards and Adrenalin 22.11.1 for the RX 6900 XT.
Let’s first take a quick look at the RTX 4080 Founders Edition before we go to the test configuration
The RTX 4080 FE
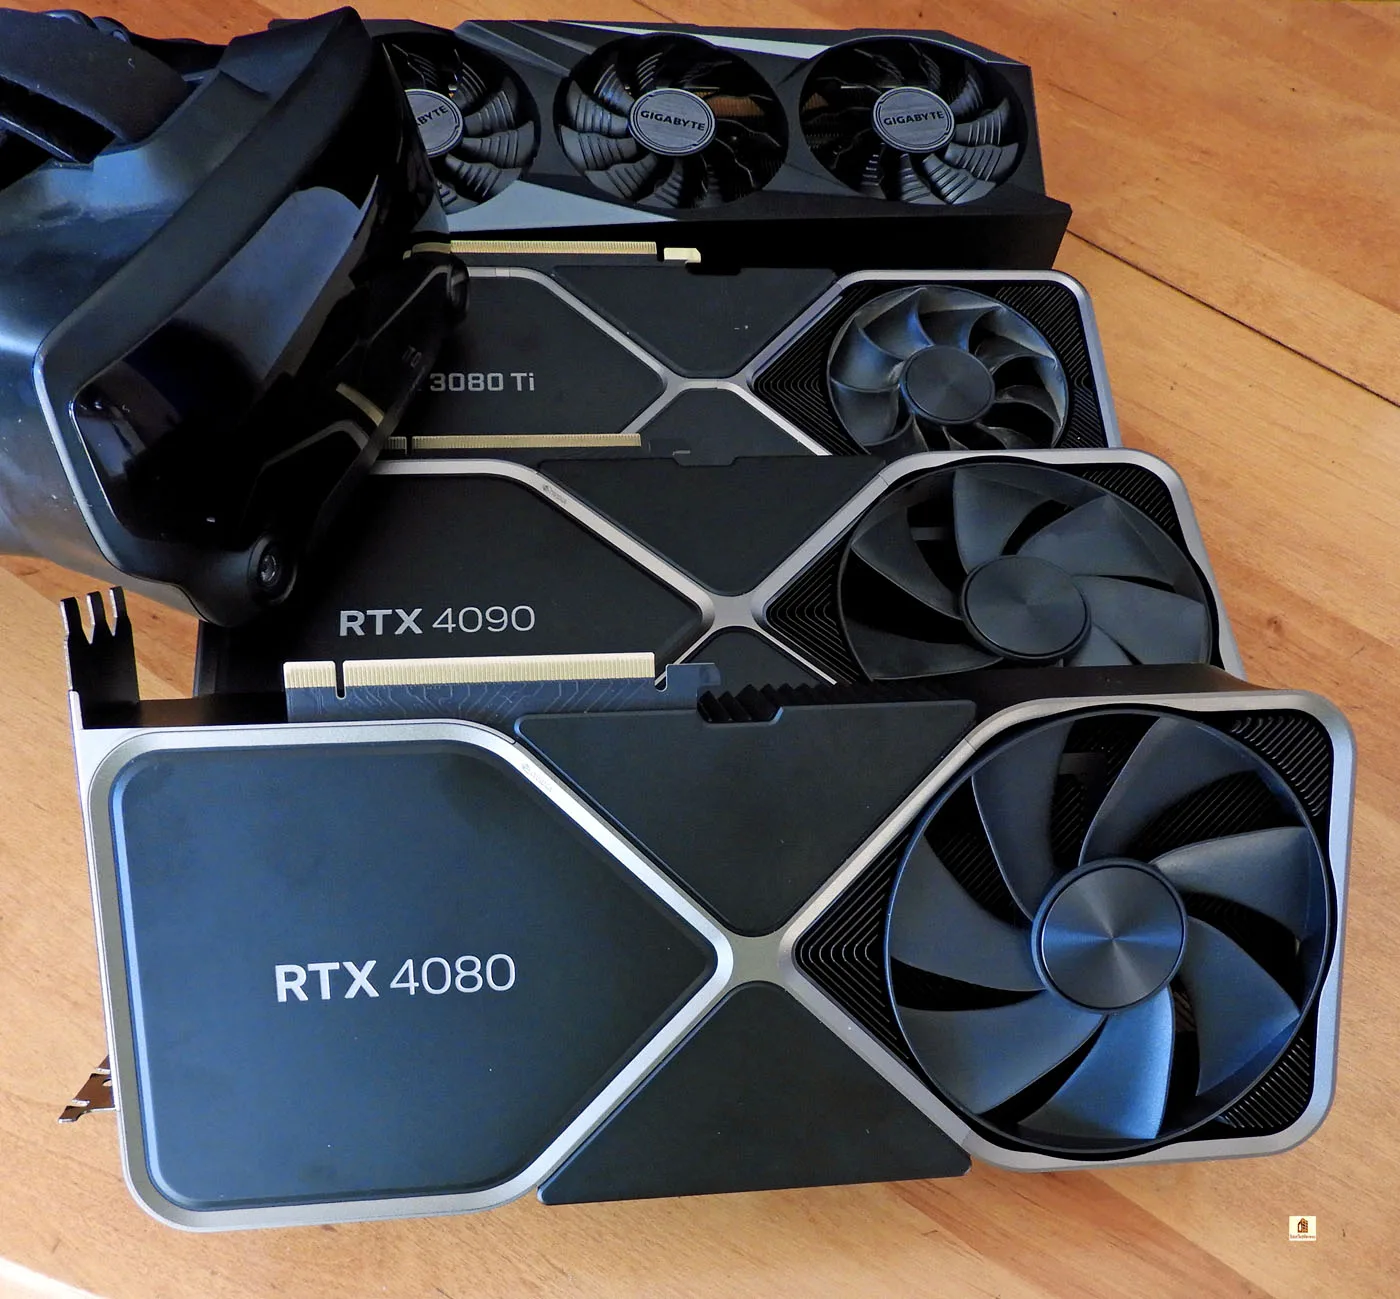
The RTX 4080 and RTX 4090 are externally physically identical twin cards. Refer to the RTX 4090 unboxing as the features and sizes are the same.
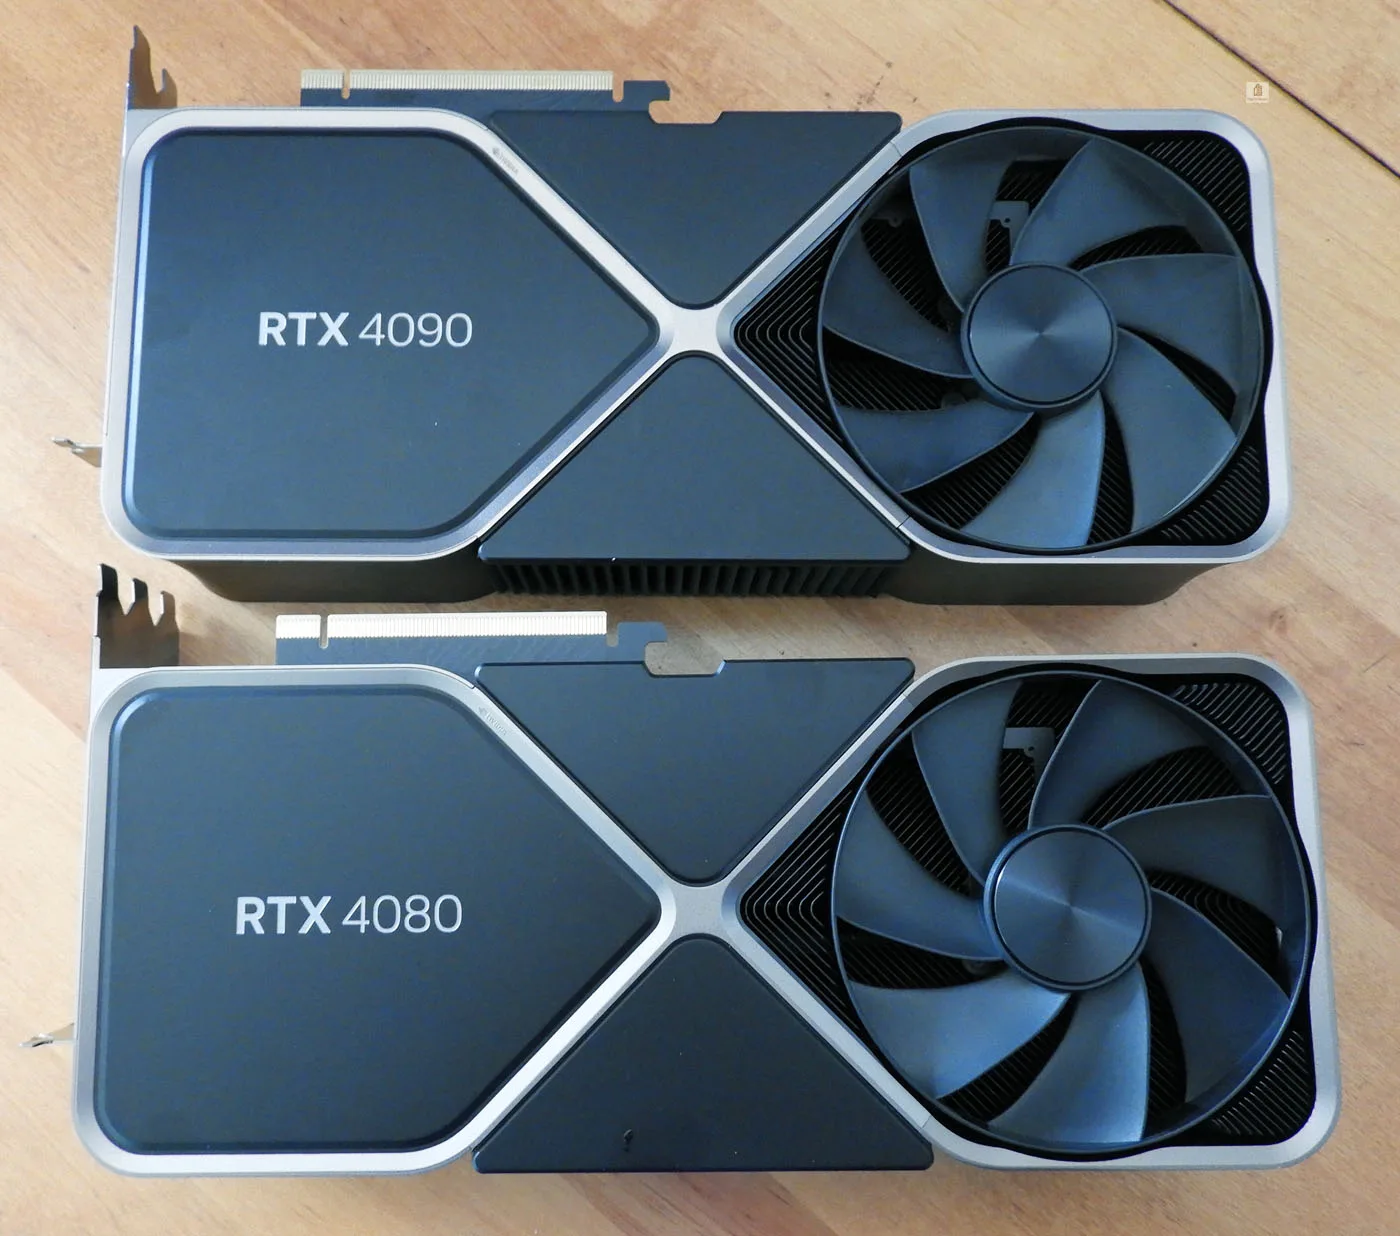
The primary differences lie inside in the RTX 4080’s cut down GPU chip capabilities with about 40% fewer CUDA cores and its lesser power draw requirements. Nvidia recommends a 850W minimum PSU for the 450W TDP RTX 4090 and includes a 4X Molex cable adapter while the 320W TDP RTX 4080 only needs a 750W minimum PSU and a 3X Molex cable adapter is included in that box.
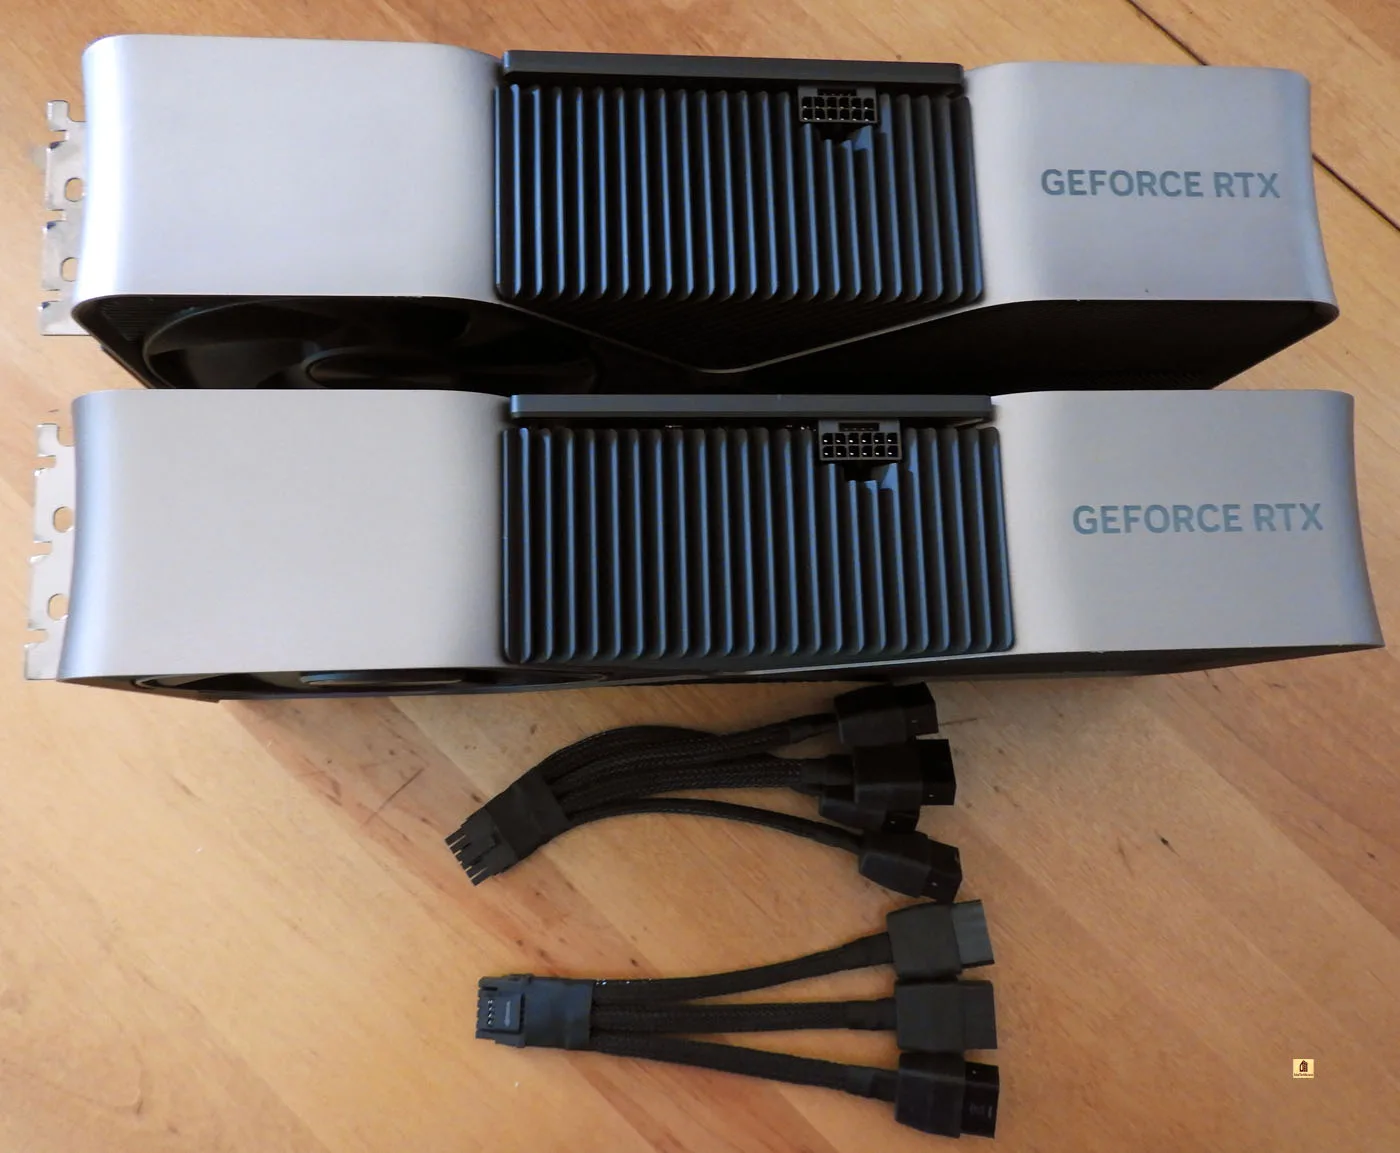
Newer PSUs may offer the new PCIe Gen5 single cable connector instead of using a bulky quad or tri cable adapter. Nvidia advises that the adapter should be firmly inserted into the card before installing it in the PC as an improperly seated connection may cause overheating and melting of the connector.
Both the RTX 4090 and RTX 4080 Founders Edition cards are beautifully designed using a very unique industrial style, and they are each much larger than the RTX 3080 Ti which is itself an imposing card. However, these new 40×0 FE cards tend not to heat up like the smaller last gen cards and they are also much quieter under full load. Either card looks great installed inside a case.
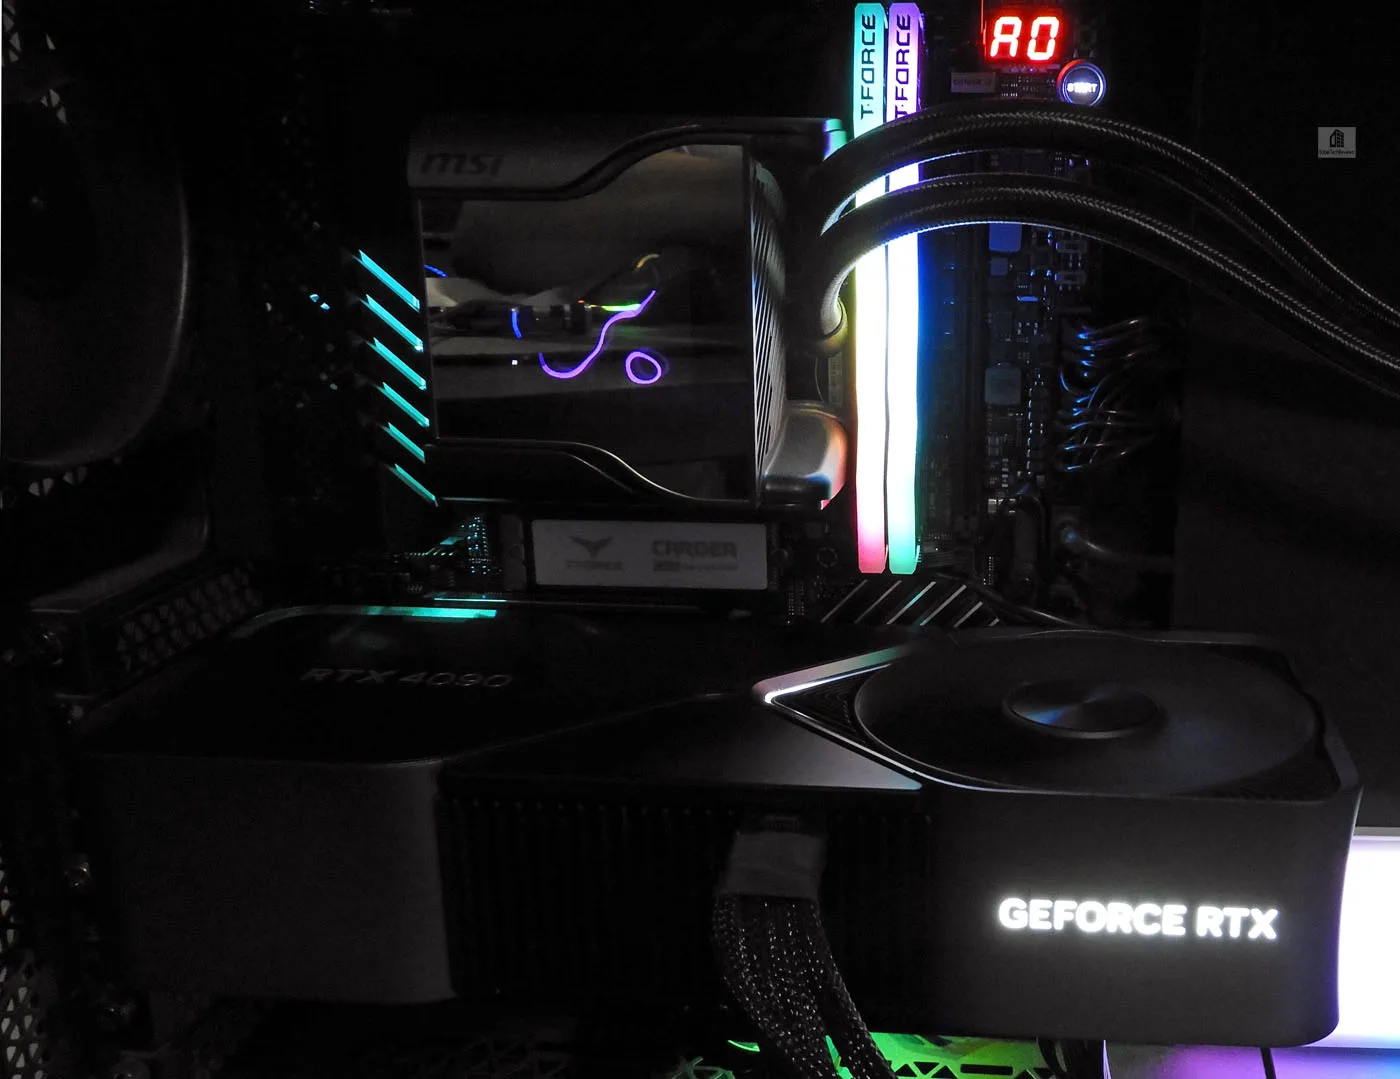
Disassembly appears to be difficult and should give pause to any enthusiast who may have custom watercooling in mind. In fact, we think that watercooling is a waste for the RTX 4080 Founders Edition as it doesn’t have any thermal issues.
Let’s check out our test configuration.
Test Configuration
Test Configuration – Hardware
- Intel Core i9-13900KF (HyperThreading and Turbo boost at stock settings)
- ASUS Prime-A Z790 LGA1700 motherboard (Intel Z790 chipset, latest BIOS, PCIe 5.0, DDR5)
- T-Force Delta RGB PC5-51200 6400MHz DDR5 CL40 2x16GB kit, supplied by TeamGroup
- Valve Index, 90Hz / 100% SteamVR Render Resolution
- RTX 4080 16GB Founders Edition, stock clocks, supplied by Nvidia
- Gigabyte RX 6900 XT GAMING OC, GV-R69XTGAMING OC-16GD 16GB, factory clocks
- RTX 3090 24GB Founders Edition, factory clocks, supplied by Nvidia
- RTX 4090 24GB Founders Edition, stock clocks, supplied by Nvidia
- 2 x T-Force Cardea Ceramic C440; 2TB PCIe Gen 4 x4 NVMe SSDs (one for AMD/one for Nvidia)
- T-Force M200 4TB USB 3.2 Gen2x2 Type-C external SSD, supplied by TeamGroup
- Super Flower LedEx, 1200W Platinum 80+ power supply unit
- MSI MAG Series CORELIQUID 360R (AIO) 360mm liquid CPU cooler
- Corsair 5000D ATX mid-tower (plus 1 x 140mm fan & 2 x 120mm Noctua fans)
- BenQ EW3270U 32? 4K HDR 60Hz
- LG C1 48″ 4K OLED HDR 120Hz display
Test Configuration – Software
- GeForce 526.98 drivers for Nvidia cards, and Adrenalin 22.11.1 for the RX 6900 XT.
- High Quality, prefer maximum performance, single display, set in the Nvidia control panel.
- High Quality textures, all optimizations off in the Adrenalin control panel
- VSync is off in the control panel and disabled for each game
- AA enabled as noted in games; all in-game settings are Ultra Preset or highest with 16xAF always applied – no upscaling is used except for five DLSS games tested using the Quality preset.
- Highest quality sound (stereo) used in all games
- All games have been patched to their latest versions
- VR charts use frametimes in ms where lower is better, but we also compare “unconstrained framerates” which shows what a video card could deliver (headroom; higher is better)
- Windows 11 Pro edition; 22H2 clean install for GeForce and Radeon cards using separate identical NVMe SSDs.
- Latest DirectX
- SteamVR latest beta
Games
VR Games
- Assetto Corsa: Competizione
- Elite Dangerous
- F1 2022
- Kayak Mirage
- Moss: Book II
- No Man’s Sky
- Project CARS 2
- Skyrim
- Sniper Elite
- The Walking Dead: Saints & Sinners
Synthetic
- Time Spy & Time Spy Extreme (DX12)
- 3DMark FireStrike – Ultra & Extreme
- Superposition
- VRMark Blue Room
- AIDA64 GPGPU benchmarks
- Blender 3.3.0 benchmark
- Geekbench
- Sandra 2020 GPGPU Benchmarks
- SPECworkstation3
- SPECviewperfect 2020
- Octanebench
- FCAT VR benching tool
- OpenVR Benchmark tool
NVIDIA Control Panel settings
Here are the NVIDIA Control Panel settings.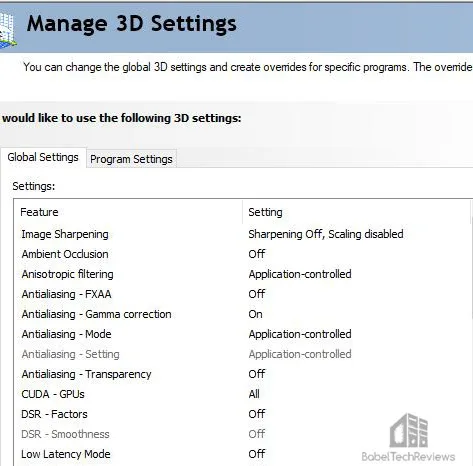
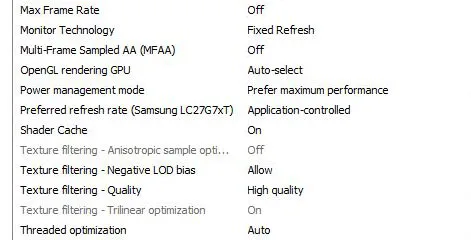

Unfortunately, we also did not have time to check out overclocking, but temperatures and noise levels are much lower than the RTX 3090 or RTX 3080 Ti FEs. We plan to follow up with a 40-plus pancake gaming review including DLSS 3.
Let’s check out performance using 10 VR games plus Workstation and creative benches.
First, we look at VR performance.
10 VR Games
For this review, we benchmarked the Valve Index using FCAT VR and set the SteamVR render resolution to 100% (2016×2240) which uses a factor of 1.4X (the native resolution is 1440×1600) to compensate for lens distortion and to increase clarity. The Index is still considered one of the best overall headsets due to its outstanding tracking and solid feature set, and we are going to compare the performance of the RX 4080 versus the RX 4090, the RX 3080 Ti, and against the RX 6900 XT at each game’s Ultra/Highest settings.
IMPORTANT: BTR’s charts use frametimes in ms where lower is better, but we also compare “unconstrained framerates” which shows what a video card could deliver (headroom) if it wasn’t locked to either 90 FPS or to 45 FPS by the HMD. In the case of unconstrained FPS, measuring just one important performance metric, faster is better.
We had planned to include Star Wars: Squadrons and MS Flight Simulator 2020, but neither game records properly with FCAT VR. So let’s individually look at our 10 sim-heavy VR games’ performance using FCAT VR.
First up, Assetto Corsa: Competizione.
Assetto Corsa: Competizione (ACC)
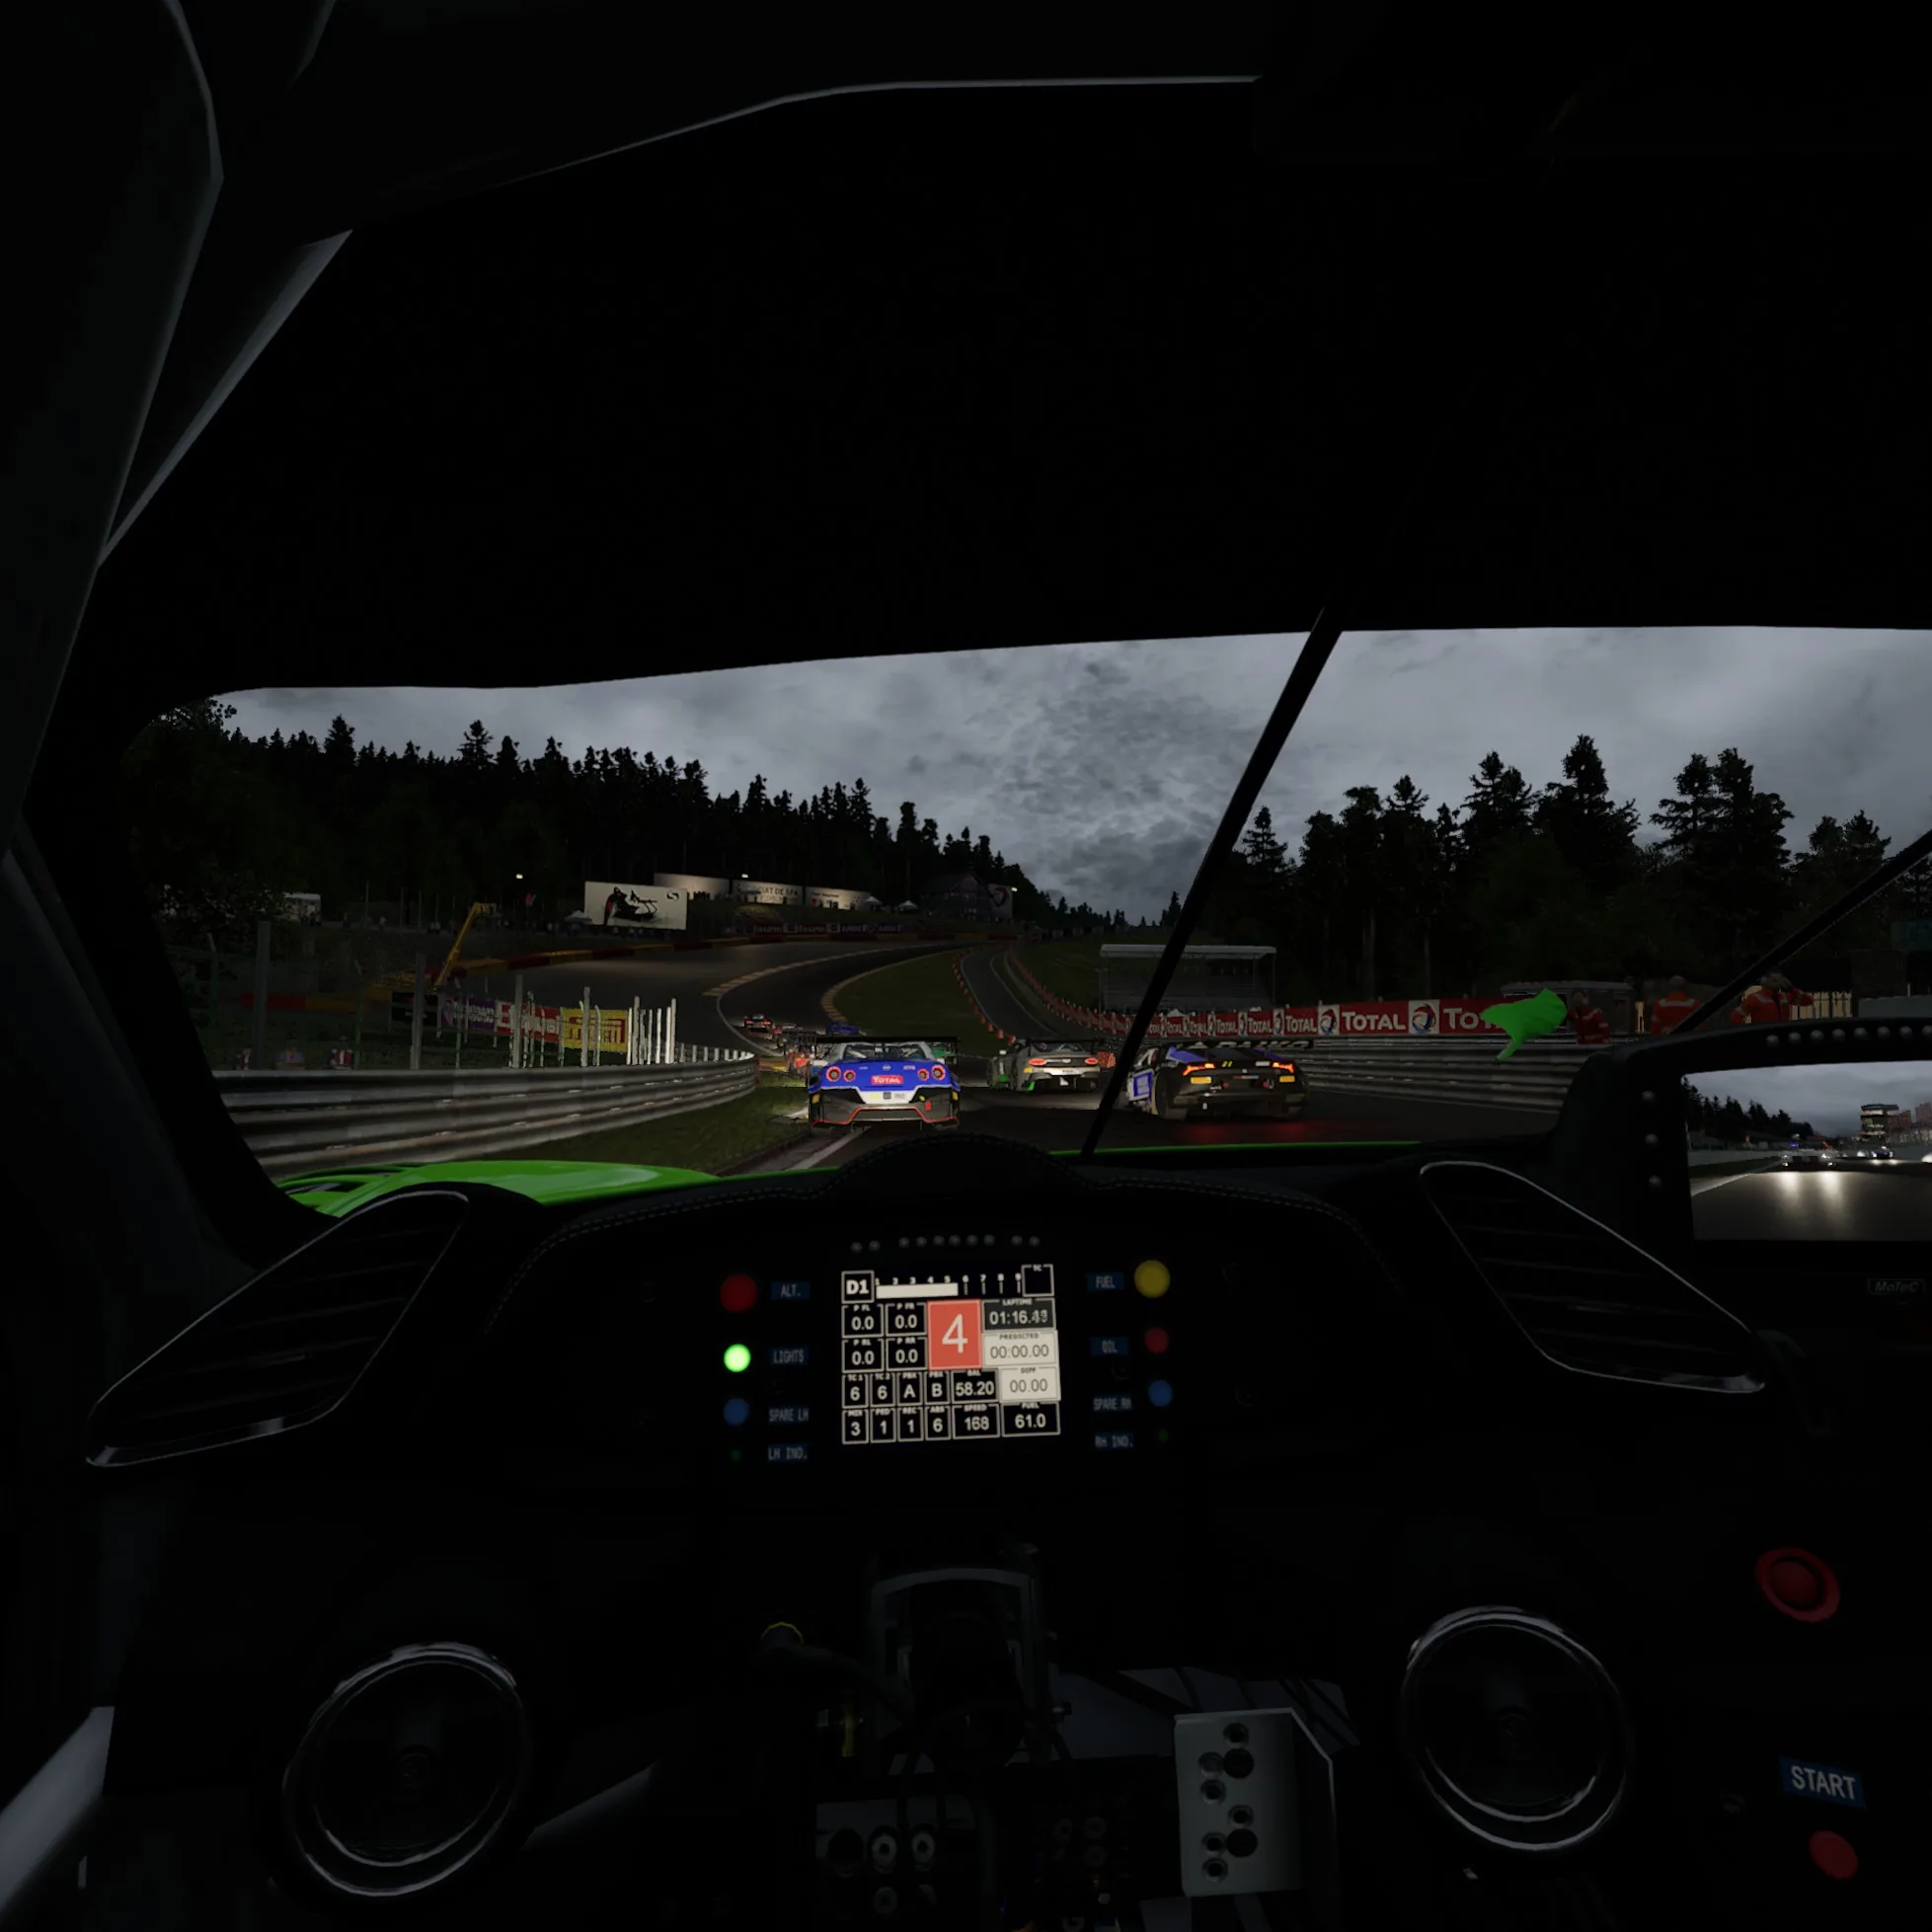
BTR’s sim/racing editor, Sean Kaldahl created the replay benchmark run that we use for both the pancake game and the VR game. It is run at night with 20 cars, lots of geometry, and the lighting effects of the headlights, tail lights, and everything around the track looks spectacular.
Here are the ACC FCAT VR frametimes using VR Ultra using the RTX 3080 Ti, the RTX 4080, and the RTX 4090. Unfortunately, the latest ACC patch made it impossible to bench the RTX 6900 XT.
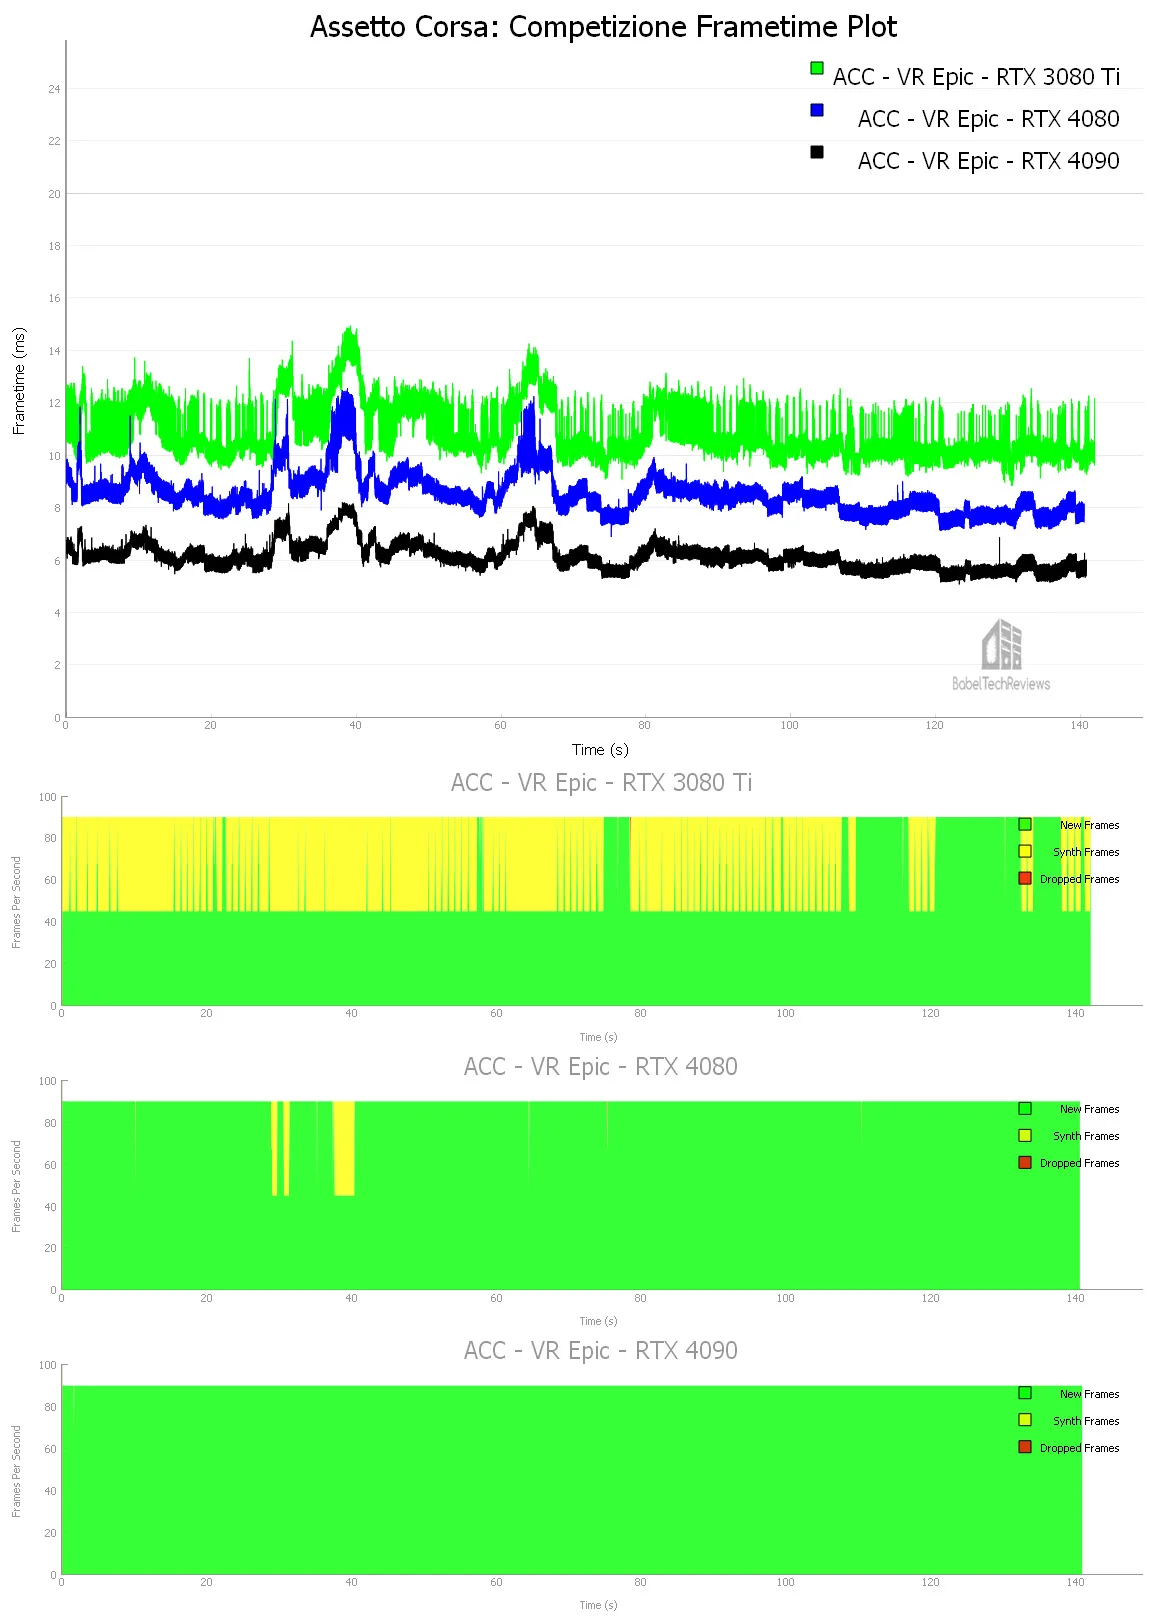
Here are the details are reported by FCAT-VR:
The RTX 3080 Ti managed 91.83 unconstrained FPS with 4649 (36%) synthesized frames with 1 dropped frame and 1 Warp miss.
The RTX 4080 delivered 118.42 unconstrained FPS with 207 (2%) synthesized frames with 1 dropped frame and 1 Warp miss.
The RTX 4090 achieved 164.03 unconstrained FPS together with 1 synthetic frame but with no dropped frames nor Warp misses.
The ACC racing experience is best with the RTX 4090 although the RTX 4080 delivers a nearly constant 90 FPS on the Epic VR preset unlike the RTX 3080 Ti which requires more than one-third of its frames to be synthesized. Only the RTX 4090 has the performance headroom to increase the render resolution to above 100% or use the Index’ faster refresh rate (120Hz/144Hz) or even to use a higher resolution headset like the Reverb G2.
Next, we check out Elite Dangerous.
Elite Dangerous (ED)
Elite Dangerous is a popular space sim built using the COBRA engine. It is hard to find a repeatable benchmark outside of the training missions.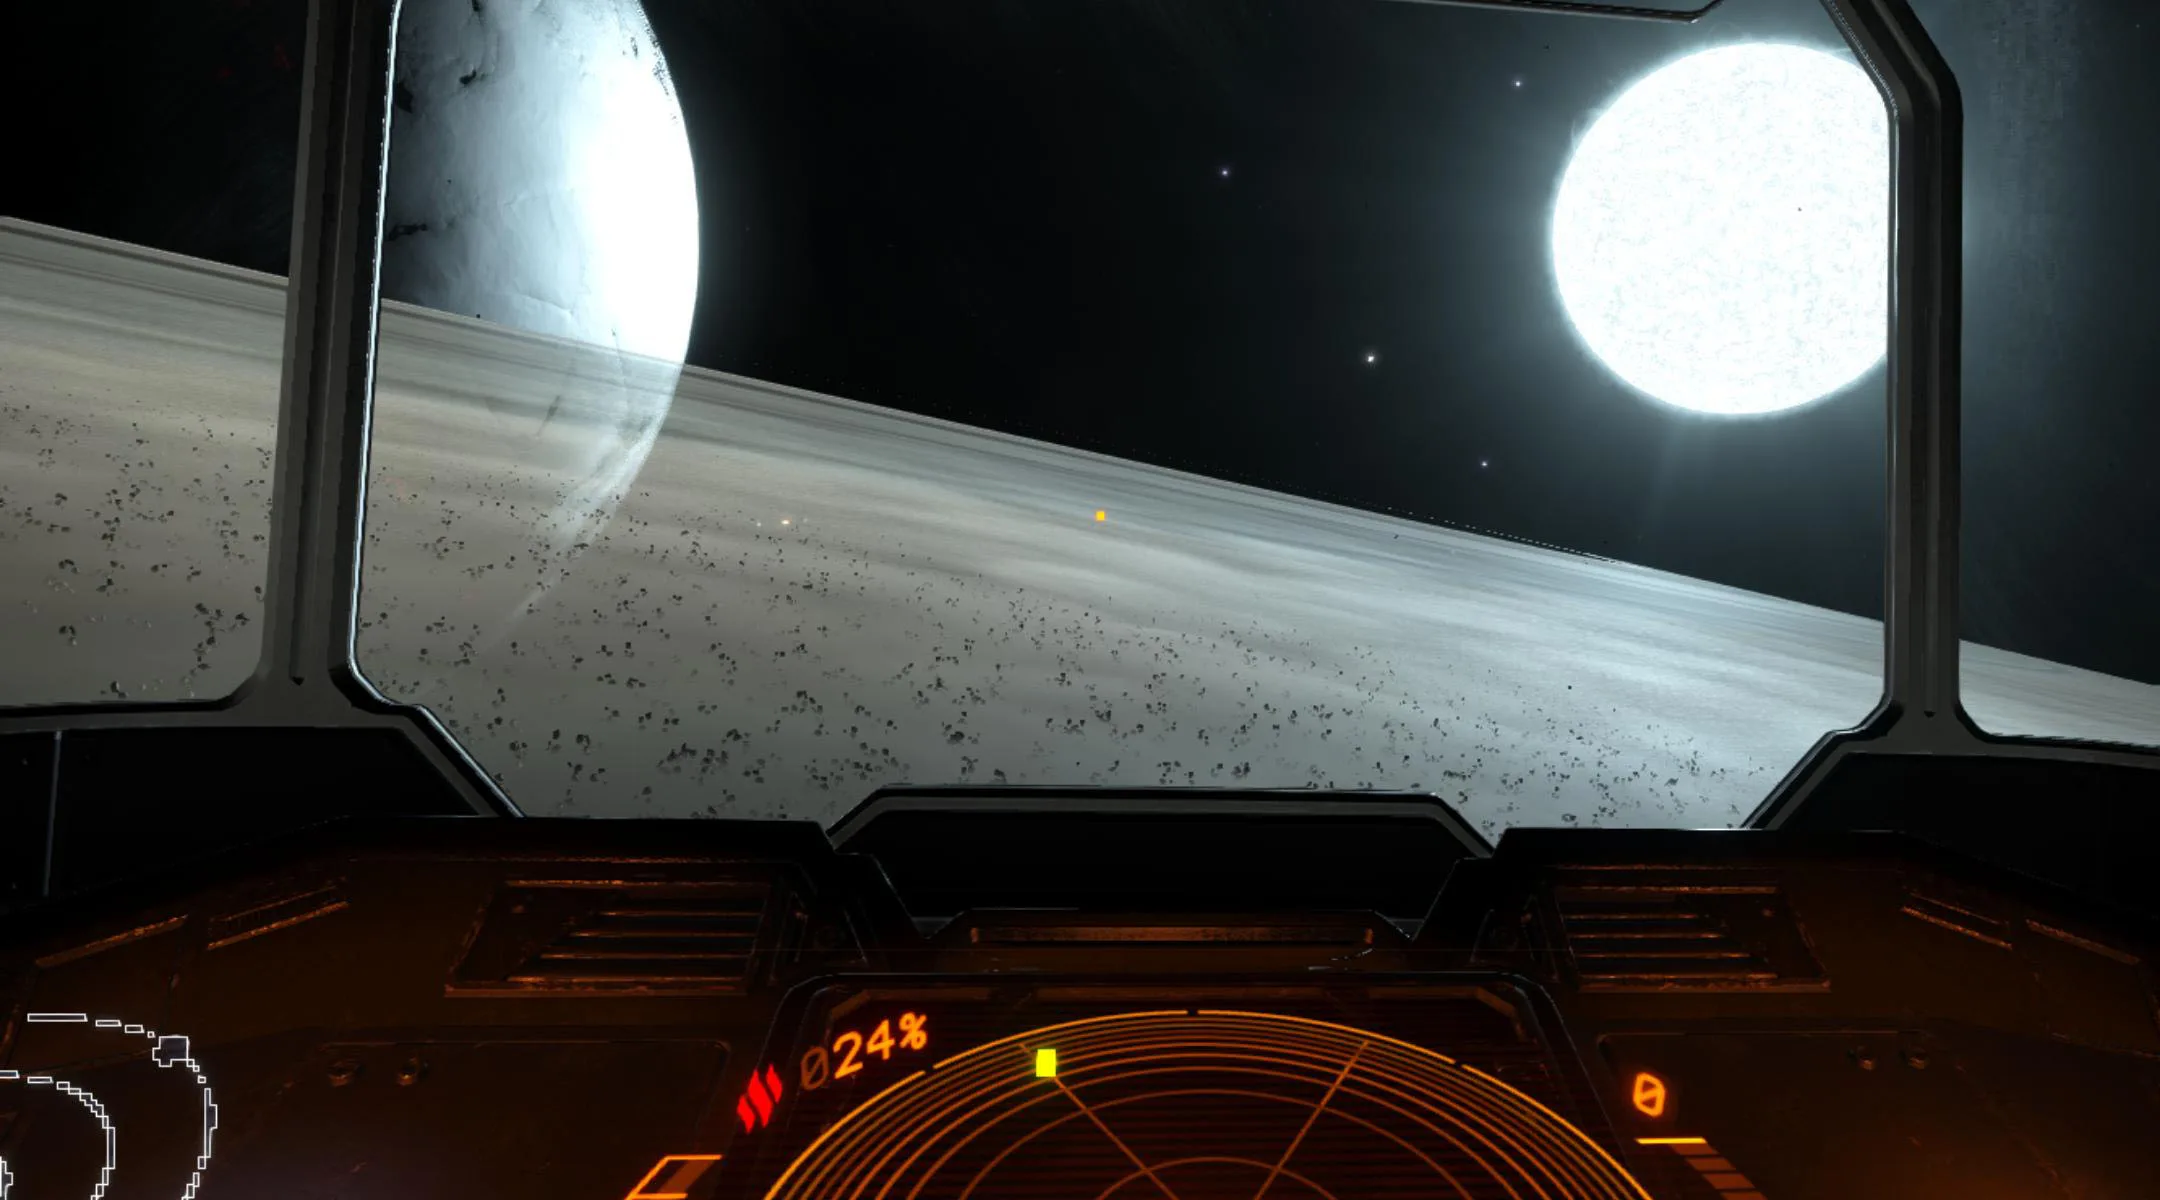
A player will probably spend a lot of time piloting his space cruiser while completing a multitude of tasks as well as visiting space stations and orbiting a multitude of different planets. Elite Dangerous is also co-op and multiplayer with a dedicated following of players.
We picked the Ultra Preset and we set the Field of View to its maximum. The RX 6900 XT wouldn’t run with the latest driver according to the error message.
Here are the frametimes.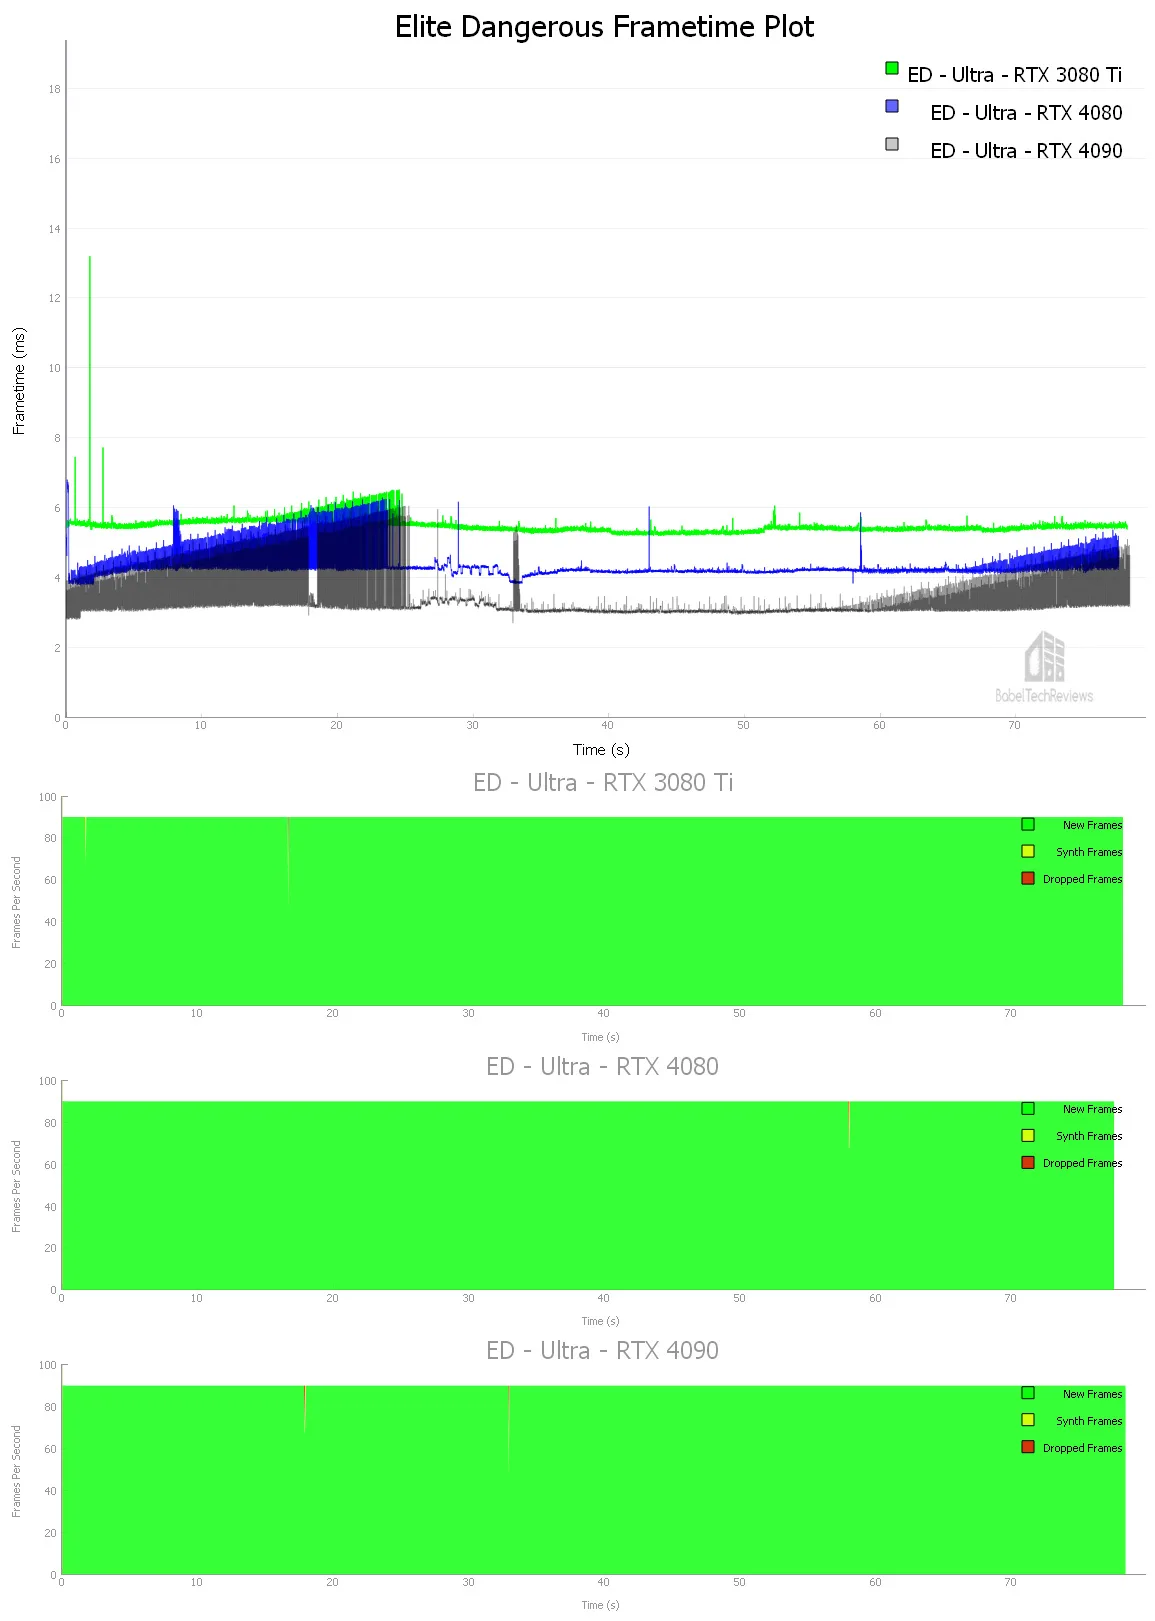
Here are the details as reported by FCAT-VR:
The RTX 3080 Ti managed 182.93 unconstrained FPS with 2 synthesized frames plus 1 dropped frame and 1 Warp miss.
The RTX 4080 delivered 230.98 unconstrained FPS with 1 synthesized frame and 1 dropped frame and 1 Warp miss.
The RTX 4090 brings 296.16 unconstrained FPS together with 2 synthetic frames but with 2 dropped frames and 2 Warp misses.
The experience playing Elite Dangerous at Ultra settings is not perceptibly different on any tested video card but the RTX 4090 has a lot more performance headroom to increase the render resolution or to use a higher resolution headset like the Reverb G2 or the Vive Pro 2.
Let’s look at our newest VR sim, F1 2022.
F1 2022
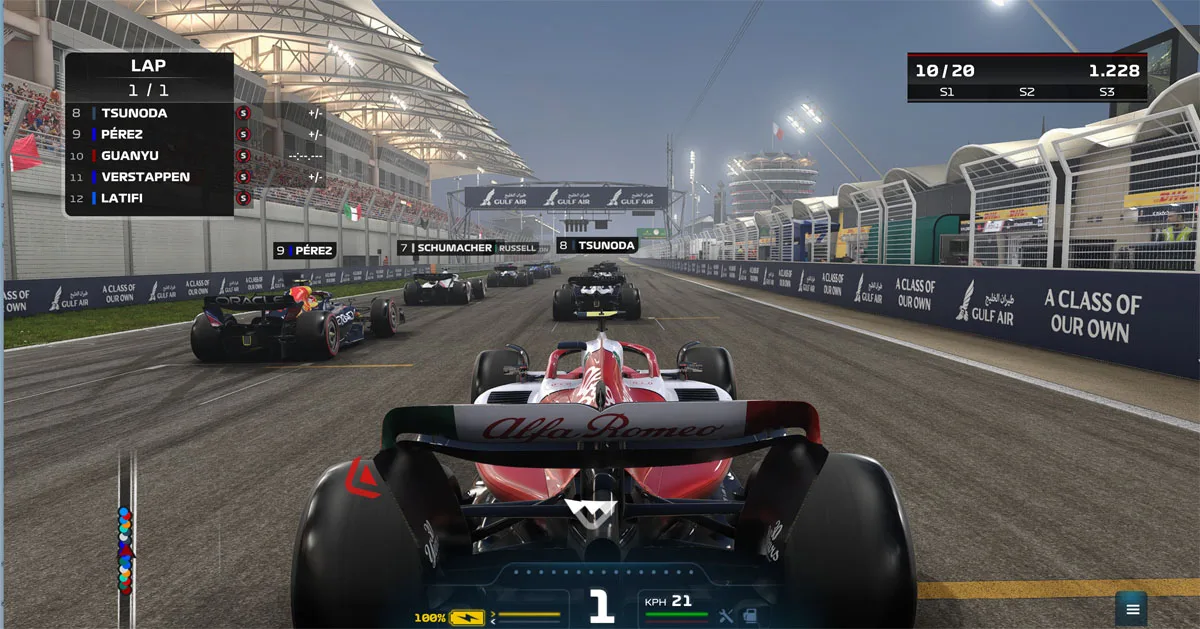
Codemasters has captured the entire Formula 1 2021 season racing in F1 2022, and the VR immersion is good. The graphics are customizeable and solid, handling and physics are good, the AI is acceptable, the scenery is outstanding, and the experience ticks many of the necessary boxes for a racing sim.
Here is the frametime plot for F1 2022.
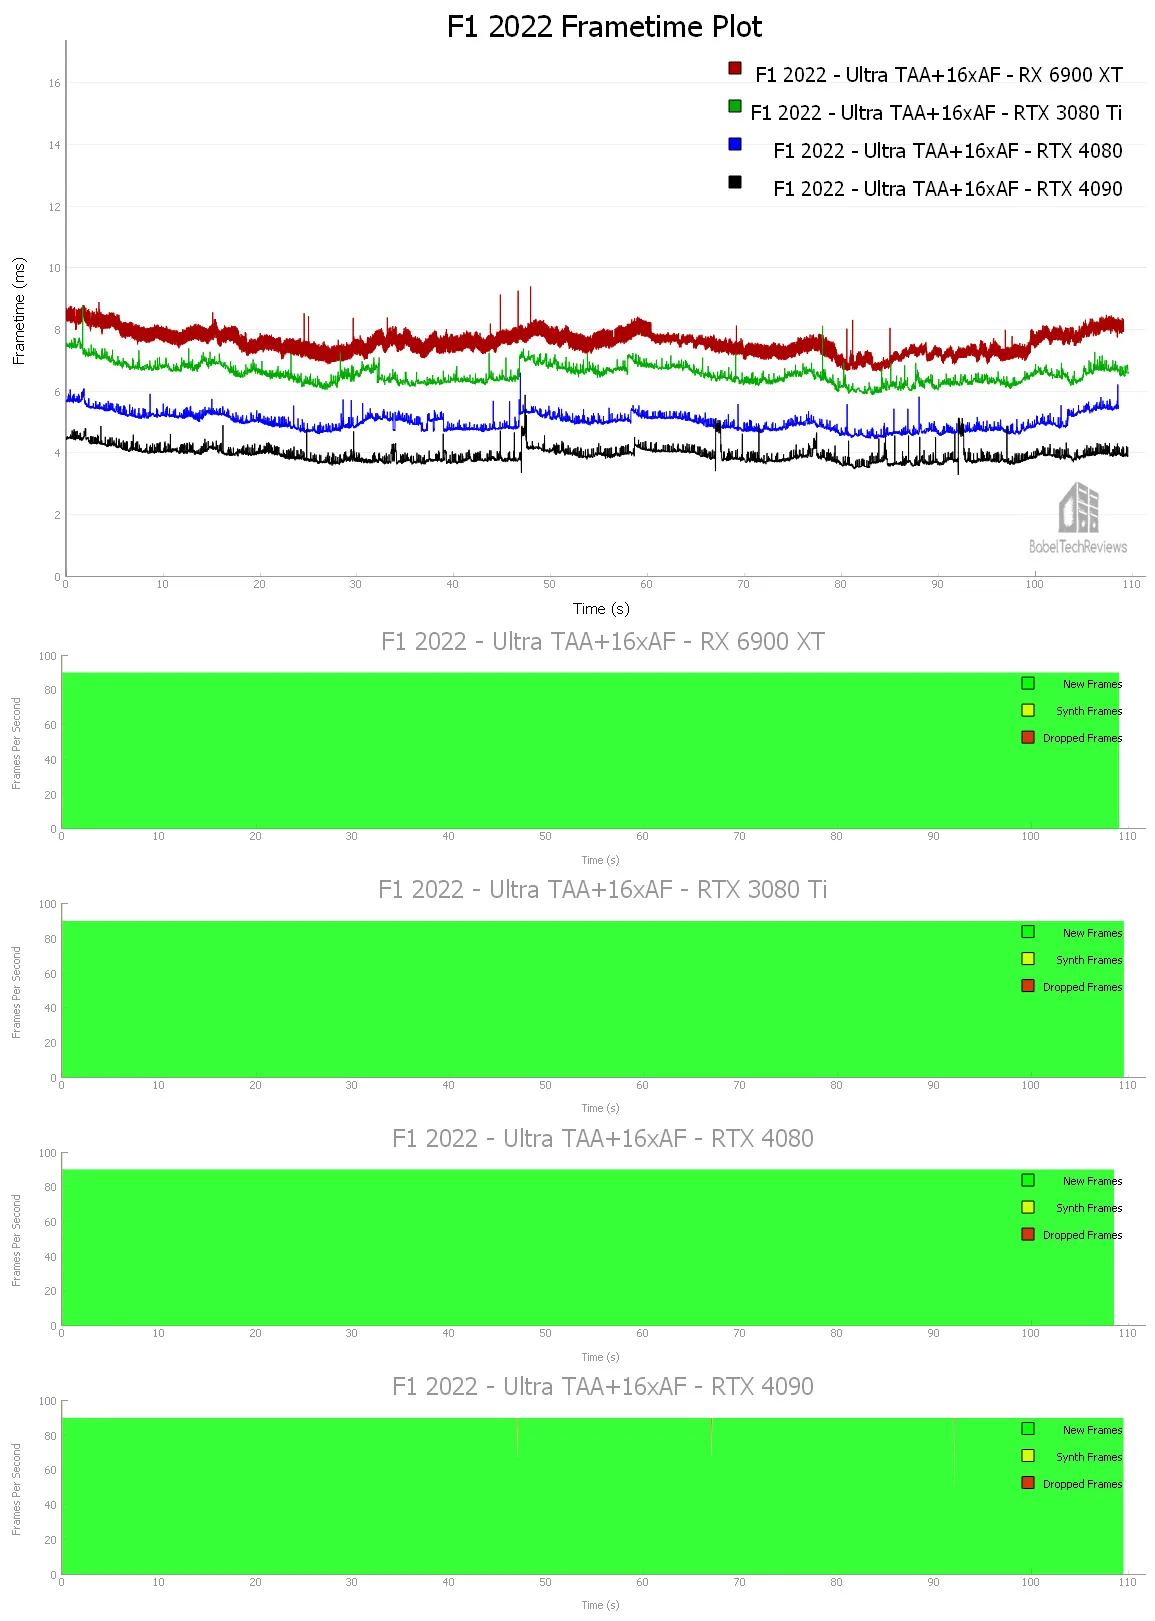
Here are the details as reported by FCAT-VR.

The RX 6900 XT delivered 132.21 unconstrained FPS with no synthesized or dropped frames nor Warp misses.
The RTX 3080 Ti managed 152.67 unconstrained FPS with no synthesized or dropped frames nor Warp misses.
The RTX 4080 achieved 200.24 unconstrained FPS with no synthesized or dropped frames nor Warp misses.
The RTX 4090 delivered 254.72 unconstrained FPS together with 3 synthetic frames plus with 3 dropped frames and 3 Warp misses.
The experience playing F1 2022 using the Ultra preset is not very different on any of these video cards but the RTX 4090 and RTX 4080 have considerably more performance headroom to use 120Hz/144Hz or to use a higher resolution headset.
Kayak VR: Mirage
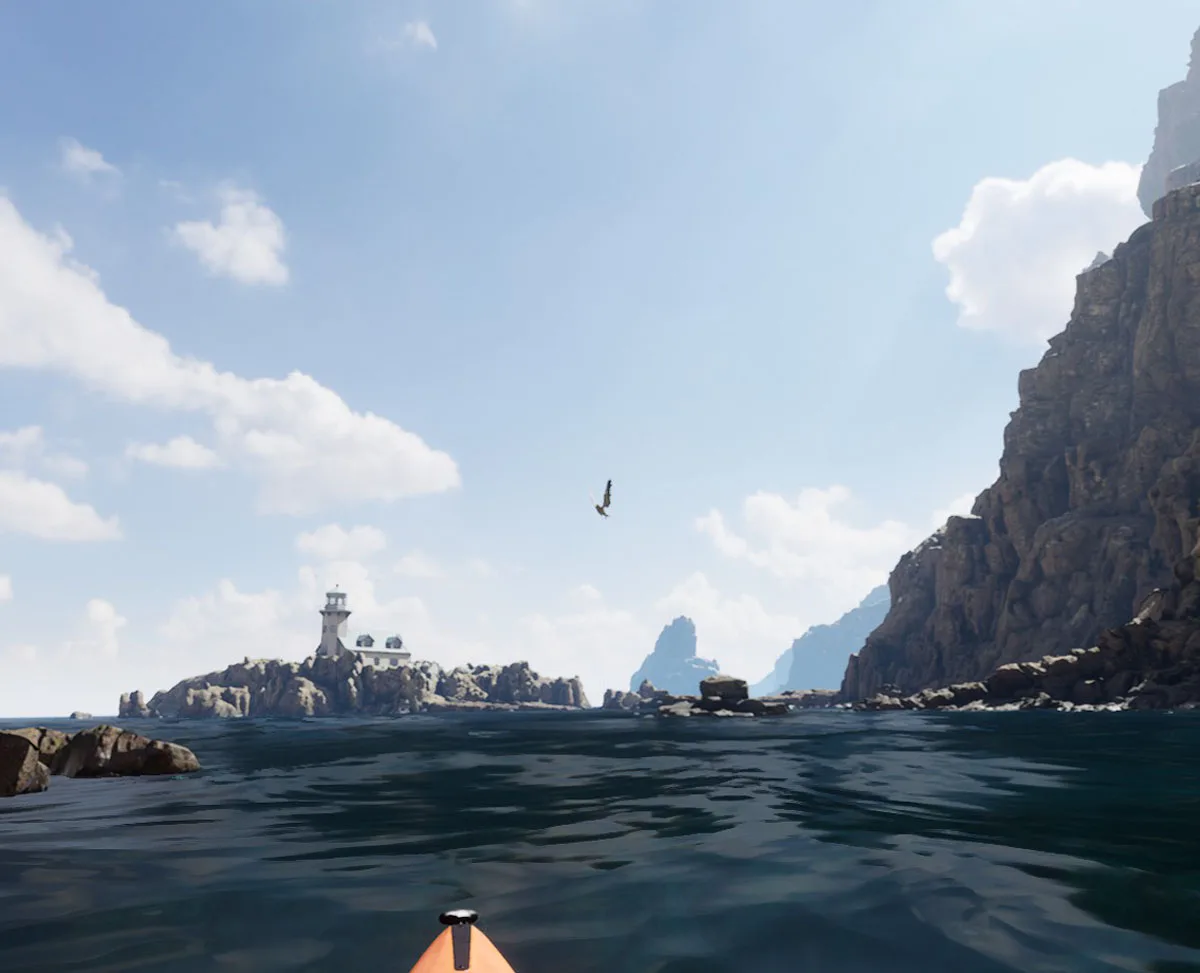
The outstanding near-photorealistic visual fidelity really sets Kayak VR: Mirage apart from other simulators. It boasts a wide range of locales with day/night/sunset options offering tropical, icy, desert, and even stormy scenarios with trips to Costa Rica, Antarctica, Norway, and Australia and occasional interactions with wildlife. It can be played as a relaxing sim or as a strenous workout with competitive time trials which offer asynchronous multiplayer and ranking on global leaderboards.
We benchmark at 100% resolution with the highest “Cinematic” in-game settings but do not use DLSS or FSR.
Here is the frametime plot for Kayak VR: Mirage.
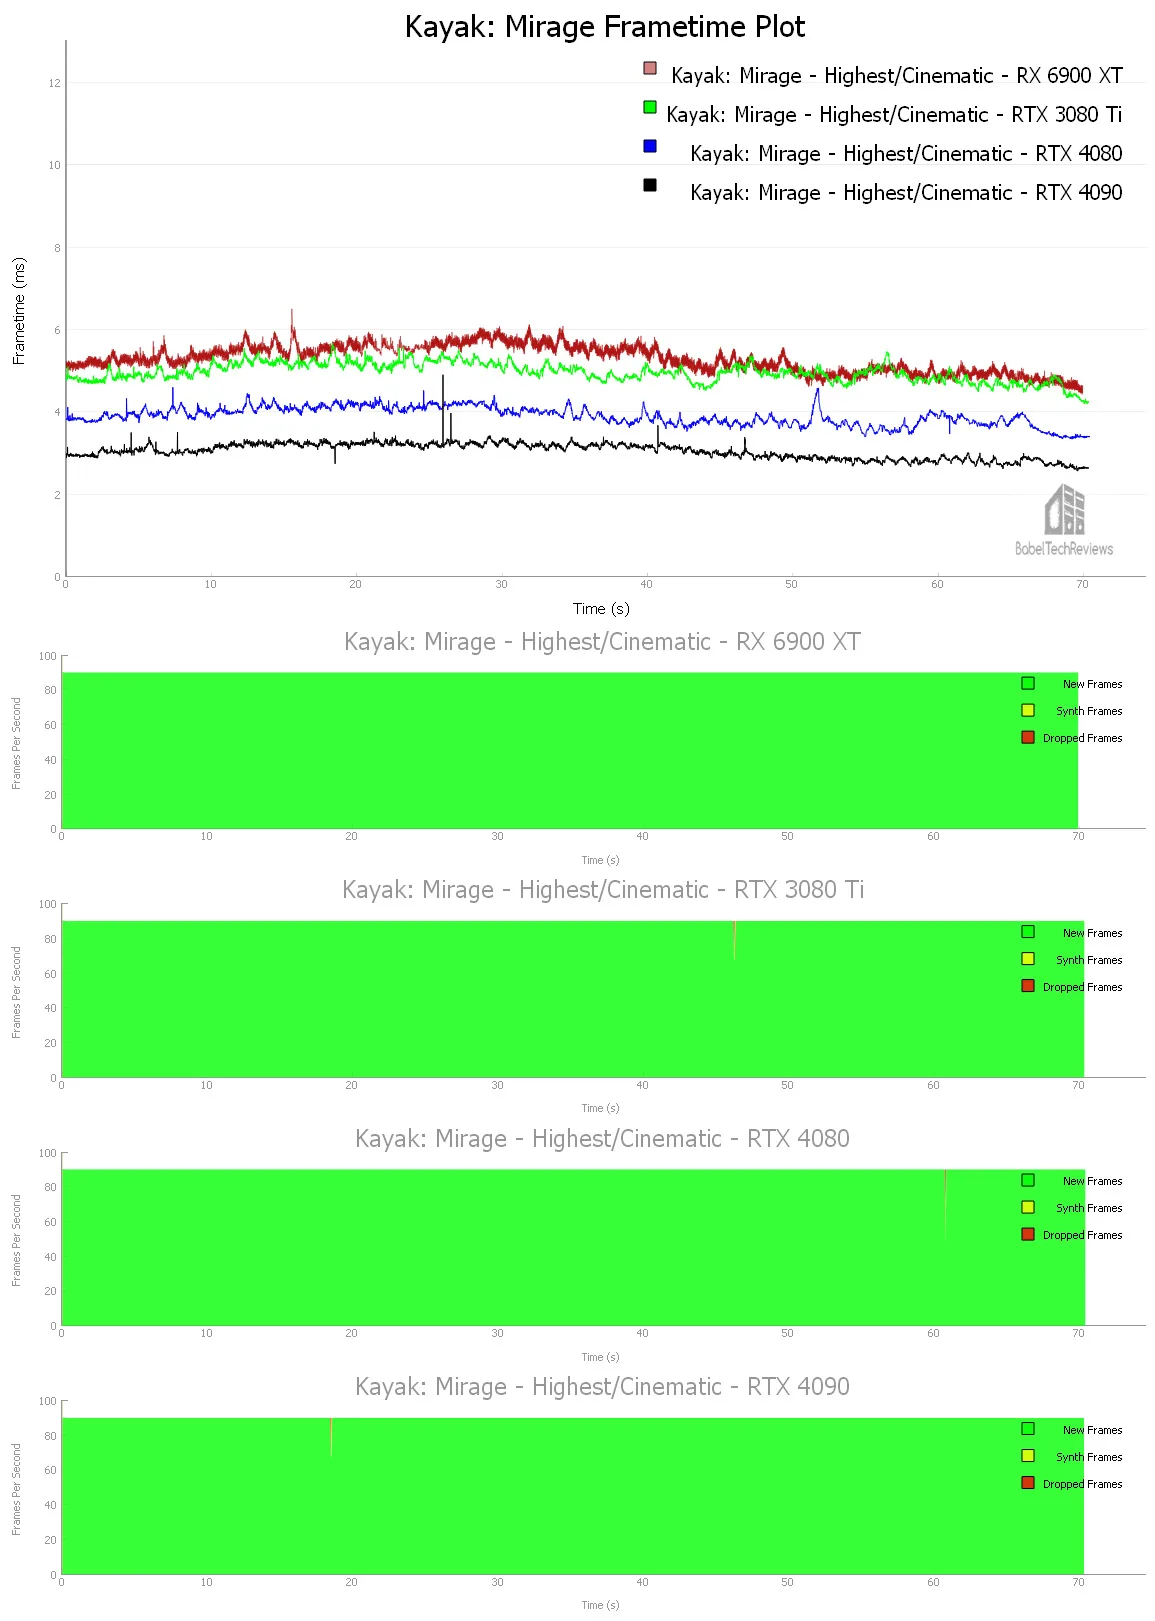
Here are the FCAT-VR details.

The RX 6900 XT delivered 189.78 unconstrained FPS with no synthesized frames or dropped frames nor Warp misses.
The RTX 3080 Ti managed 201.89 unconstrained FPS with 1 synthetic frame plus 1 dropped frame and 1 Warp miss.
The RTX 4080 delivered 257.16 unconstrained FPS with 1 synthesized and 1 dropped frame and 1 Warp miss.
The RTX 4090 got 329.35 unconstrained FPS together with 1 synthetic frame and 1 dropped frame plus 1 Warp miss.
Kayak VR: Mirage looks fantastic at 100% resolution with maximum settings and would be well-suited for play on the Reverb G2 with any of our test cards.
Next, we look at Moss: Book II.
Moss: Book II
Moss: Book II is an amazing VR experience with much better graphics than the original game. It’s a 3rd person puzzle adventure game played seated that offers a direct physical interaction between you (the Reader) and your avatar, Quill, a mouse that bring real depth to the story. Extreme attention has been paid to the tiniest details with overall great art composition and outstanding lighting that make this game a must-play for gamers of all ages.
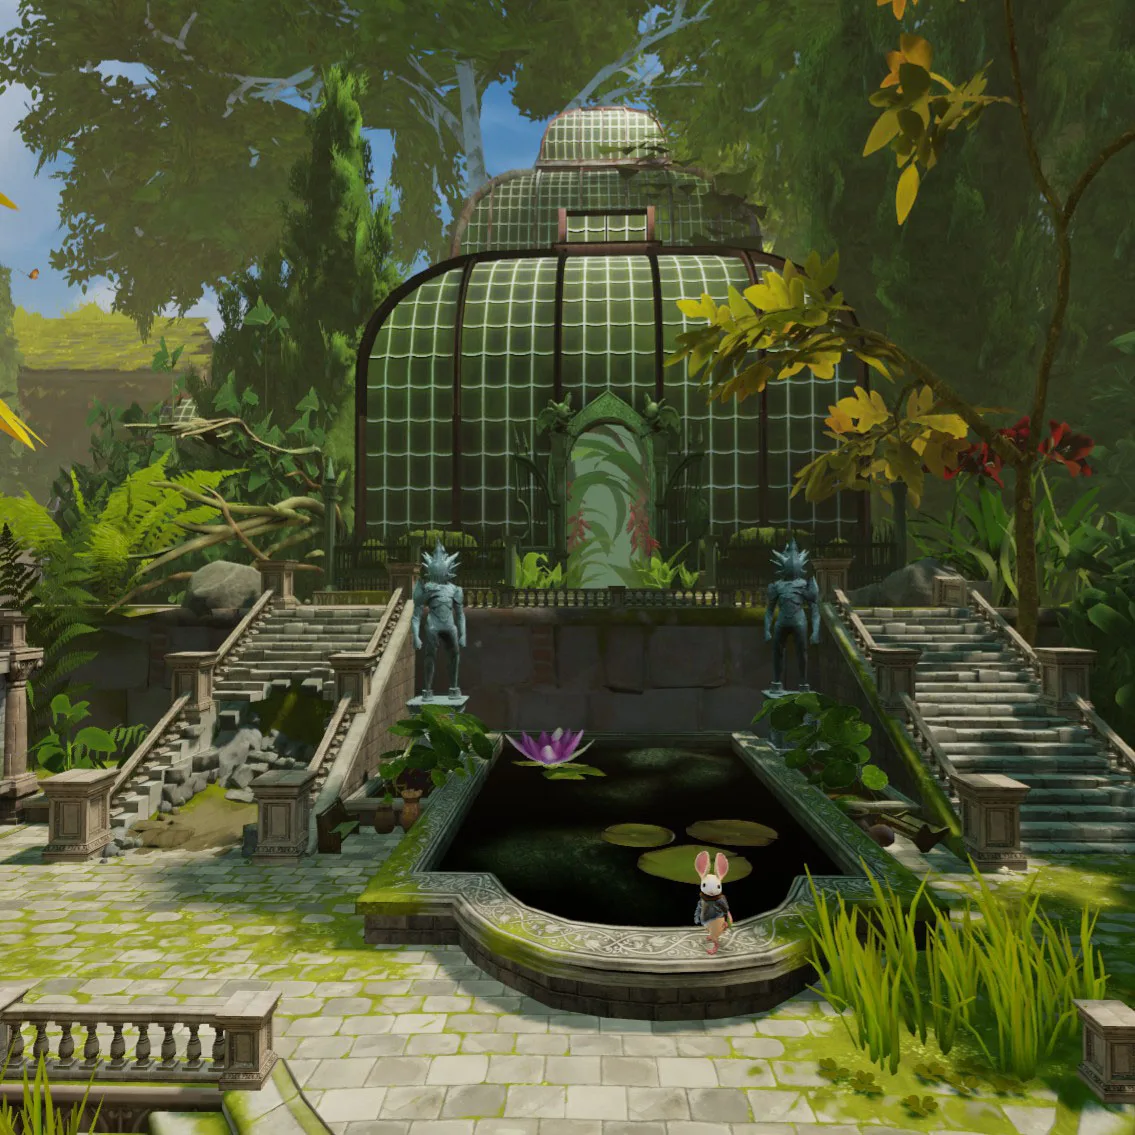
Moss II boasts very good visuals and we use the in-game highest settings.
Here are the frametimes plots of our four cards.
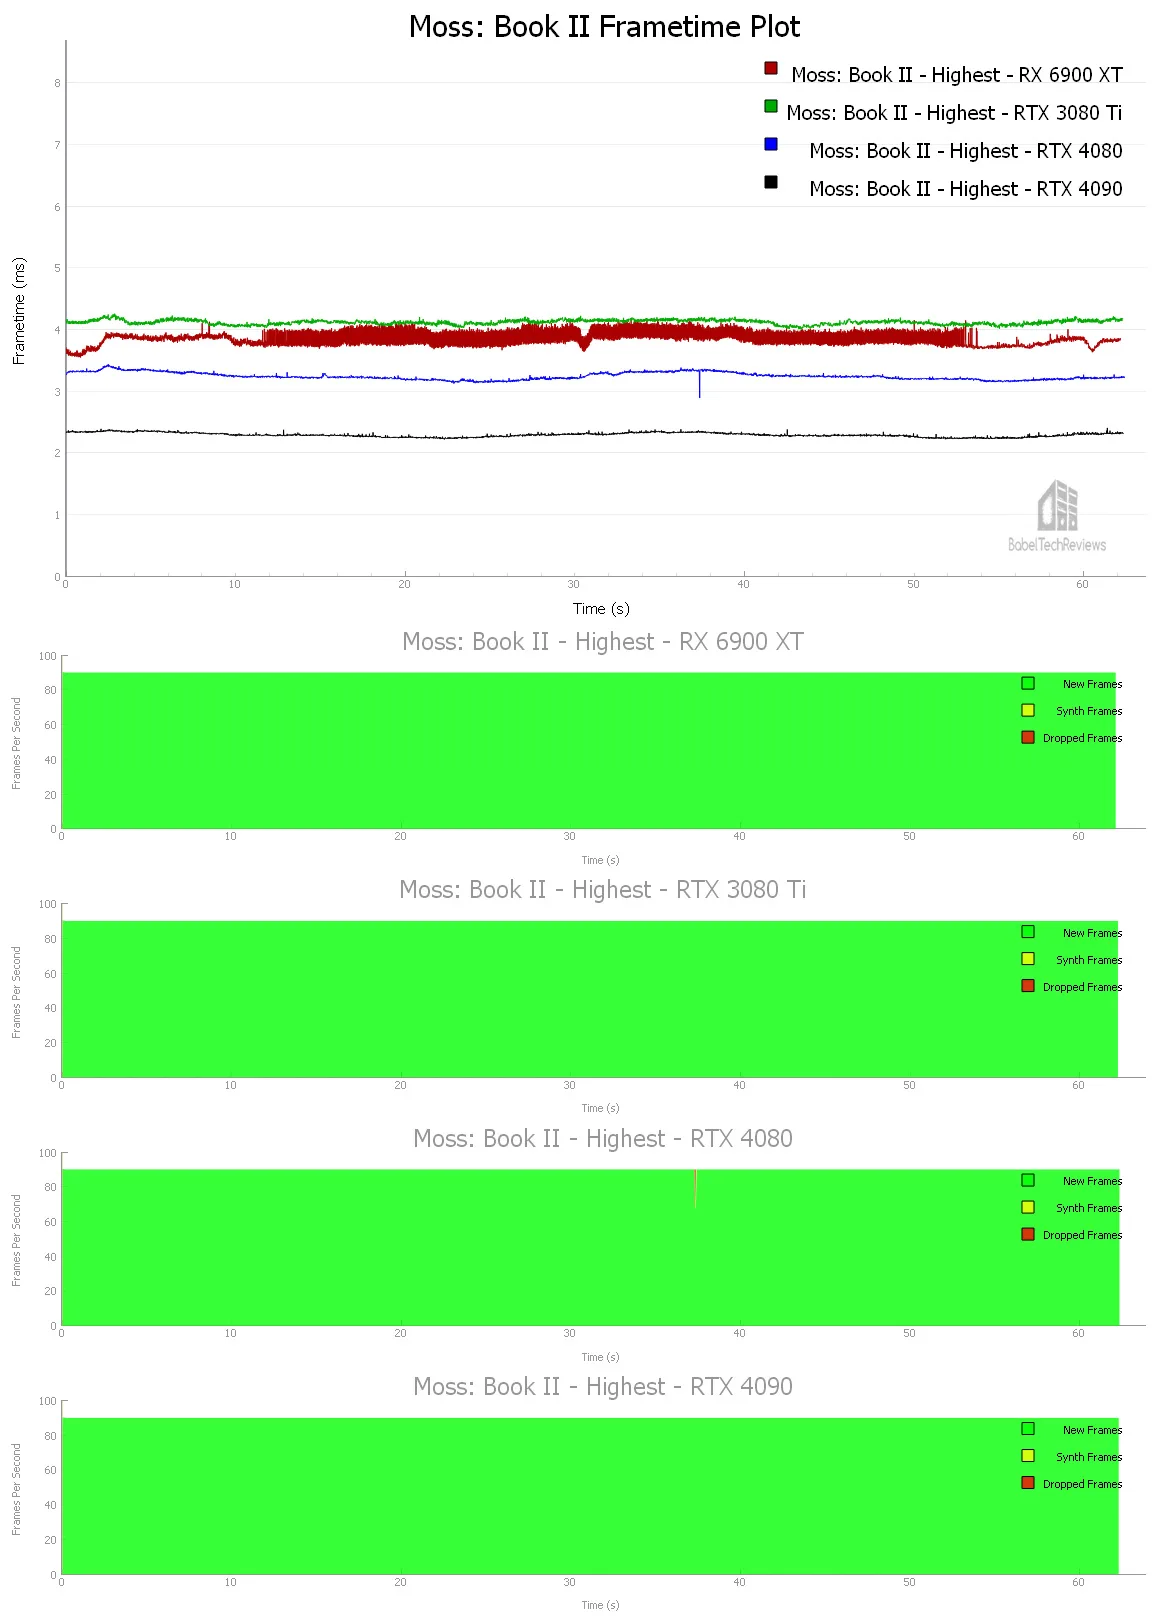
Here are the details are reported by FCAT-VR:

The RX 6900 XT delivered 260.40 unconstrained FPS with no synthesized or dropped frames nor Warp misses.
The RTX 3080 Ti managed 242.83 unconstrained FPS with no synthesized or dropped frames nor Warp misses.
The RTX 4080 delivered 308.44 unconstrained FPS with 1 synthetic and 1 dropped frame and 1 Warp miss.
The RTX 4090 achieved 436.34 unconstrained FPS no synthesized or dropped frames nor Warp misses.
The experience playing Moss II on the Valve Index is identical between cards. It is not demanding so it can be played on a high resolution headset like the Reverb G2 or the Vive Pro 2 and supersampling may also be used.
Next, we will check out another demanding VR game, No Man’s Sky.
No Man’s Sky (NMS)
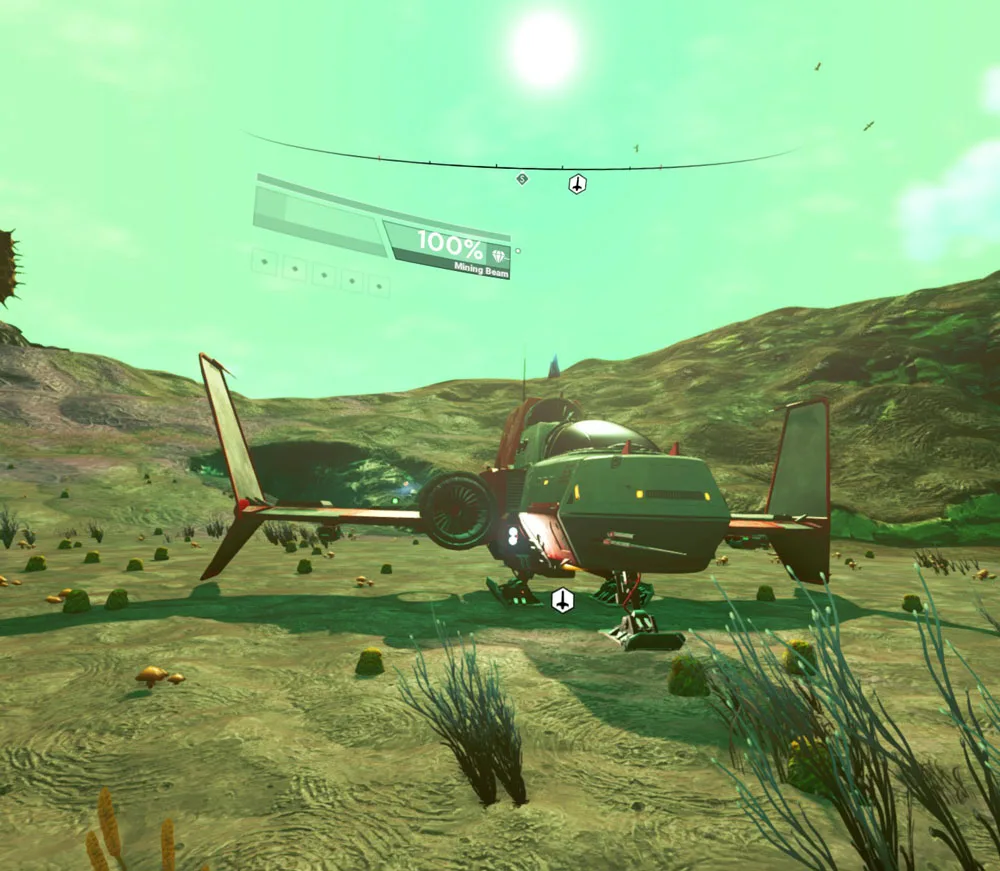
No Man’s Sky is an action-adventure survival single and multiplayer game that emphasizes survival, exploration, fighting, and trading. It is set in a procedurally generated deterministic open universe, which includes over 18 quintillion unique planets using its own custom game engine.
The player takes the role of a Traveller in an uncharted universe by starting on a random planet with a damaged spacecraft equipped with only a jetpack-equipped exosuit and a versatile multi-tool that can also be used for defense. The player is encouraged to find resources to repair his spacecraft allowing for intra- and inter-planetary travel, and to interact with other players.
Here is the No Man’s Sky Frametime plot. We set the settings to Maximum which is a step over Ultra including setting the anisotropic filtering to 16X and upgrading to FXAA+TAA. Since DLSS is available for RTX cards and the Quality setting improves performance without impacting image quality, we used it. Updated: We did not use any upscaling method.
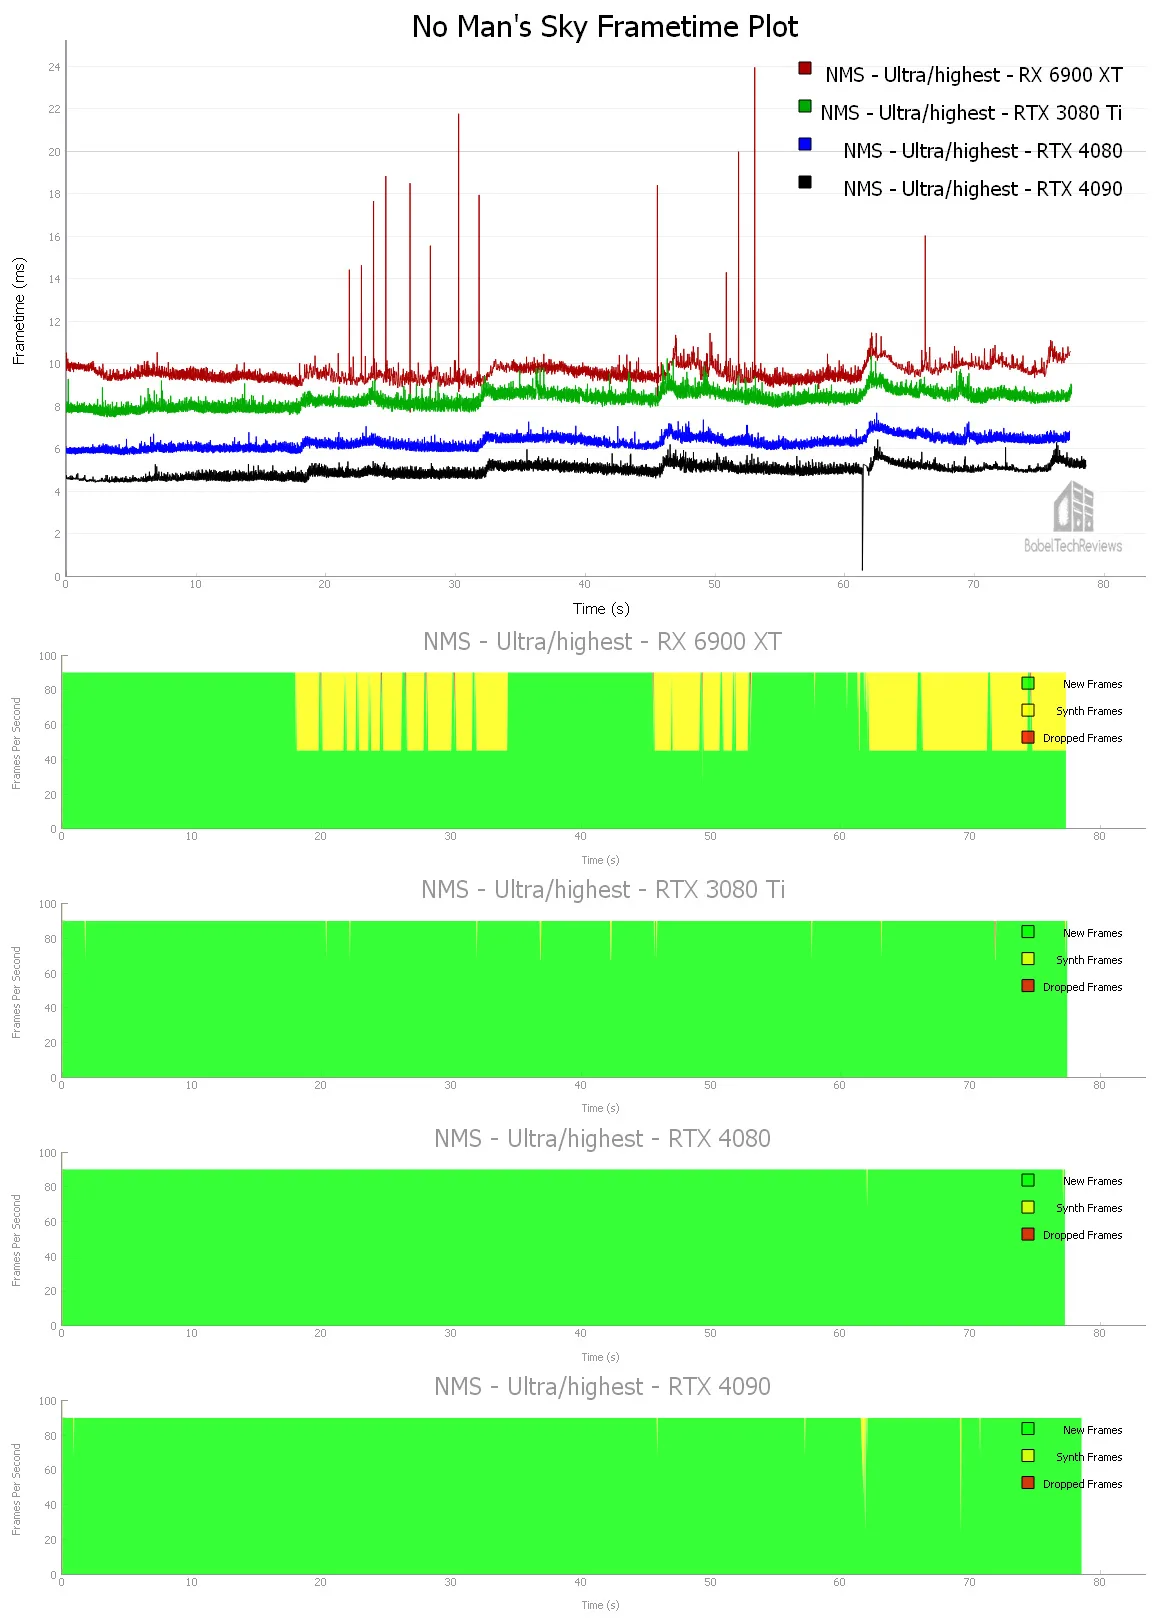
Here are the FCAT-VR details of our comparative runs.

The RX 6900 XT brought 104.13 unconstrained FPS with 1601 (23%) synthesized frames plus 9 dropped frames and 9 Warp misses.
The RTX 3080 Ti managed 119.88 unconstrained FPS with 14 synthetic frames and with 1 dropped frame and 1 Warp miss.
The RTX 4080 delivered 159.10 unconstrained FPS with 2 synthesized frames but no dropped frames nor Warp misses.
The RTX 4090 achieved 201.96 unconstrained FPS together with 17 synthetic frames but with no dropped frames nor Warp misses.
The experience playing No Man’s Sky using the highest settings is not very different using the three GeForce video cards but RX 6900 XT gamers may want to lower some individual settings to remain above 90 FPS. The RTX 4080 and RTX 4090 have enough performance headroom to increase the refresh rate, render resolution, or to perhaps use a higher resolution headset.
Let’s continue with another VR game, Project CARS 2, that we still like better than its successor even though it is no longer available for online play.
Project CARS 2 (PC2)
There is still a sense of immersion that comes from playing Project CARS 2 in VR using a wheel and pedals. It uses its in-house Madness engine, and the physics implementation is outstanding. 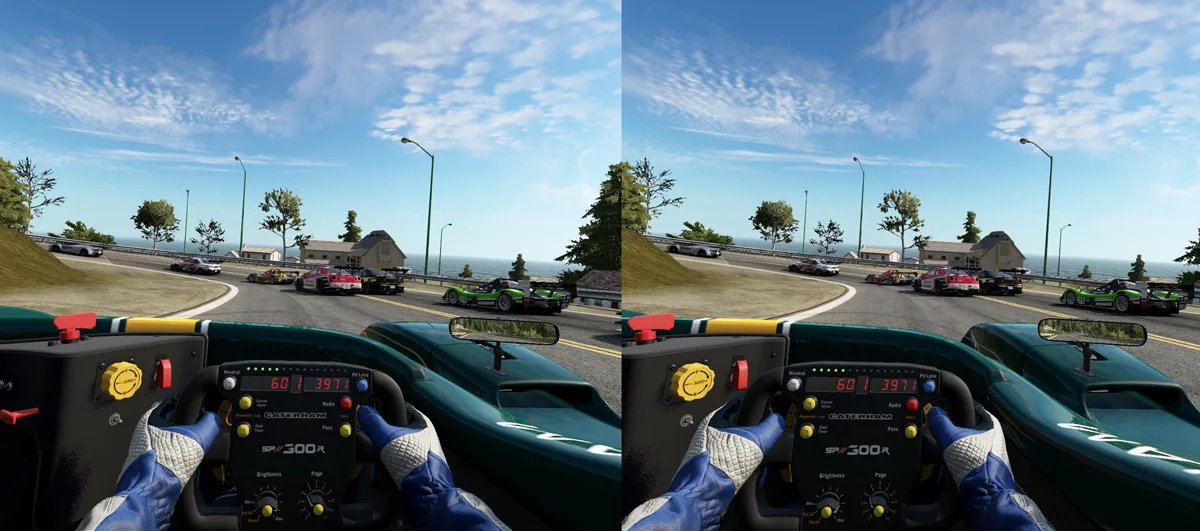
Project CARS 2 offers many performance options and settings and we prefer playing with SMAA Ultra rather than to use MSAA.
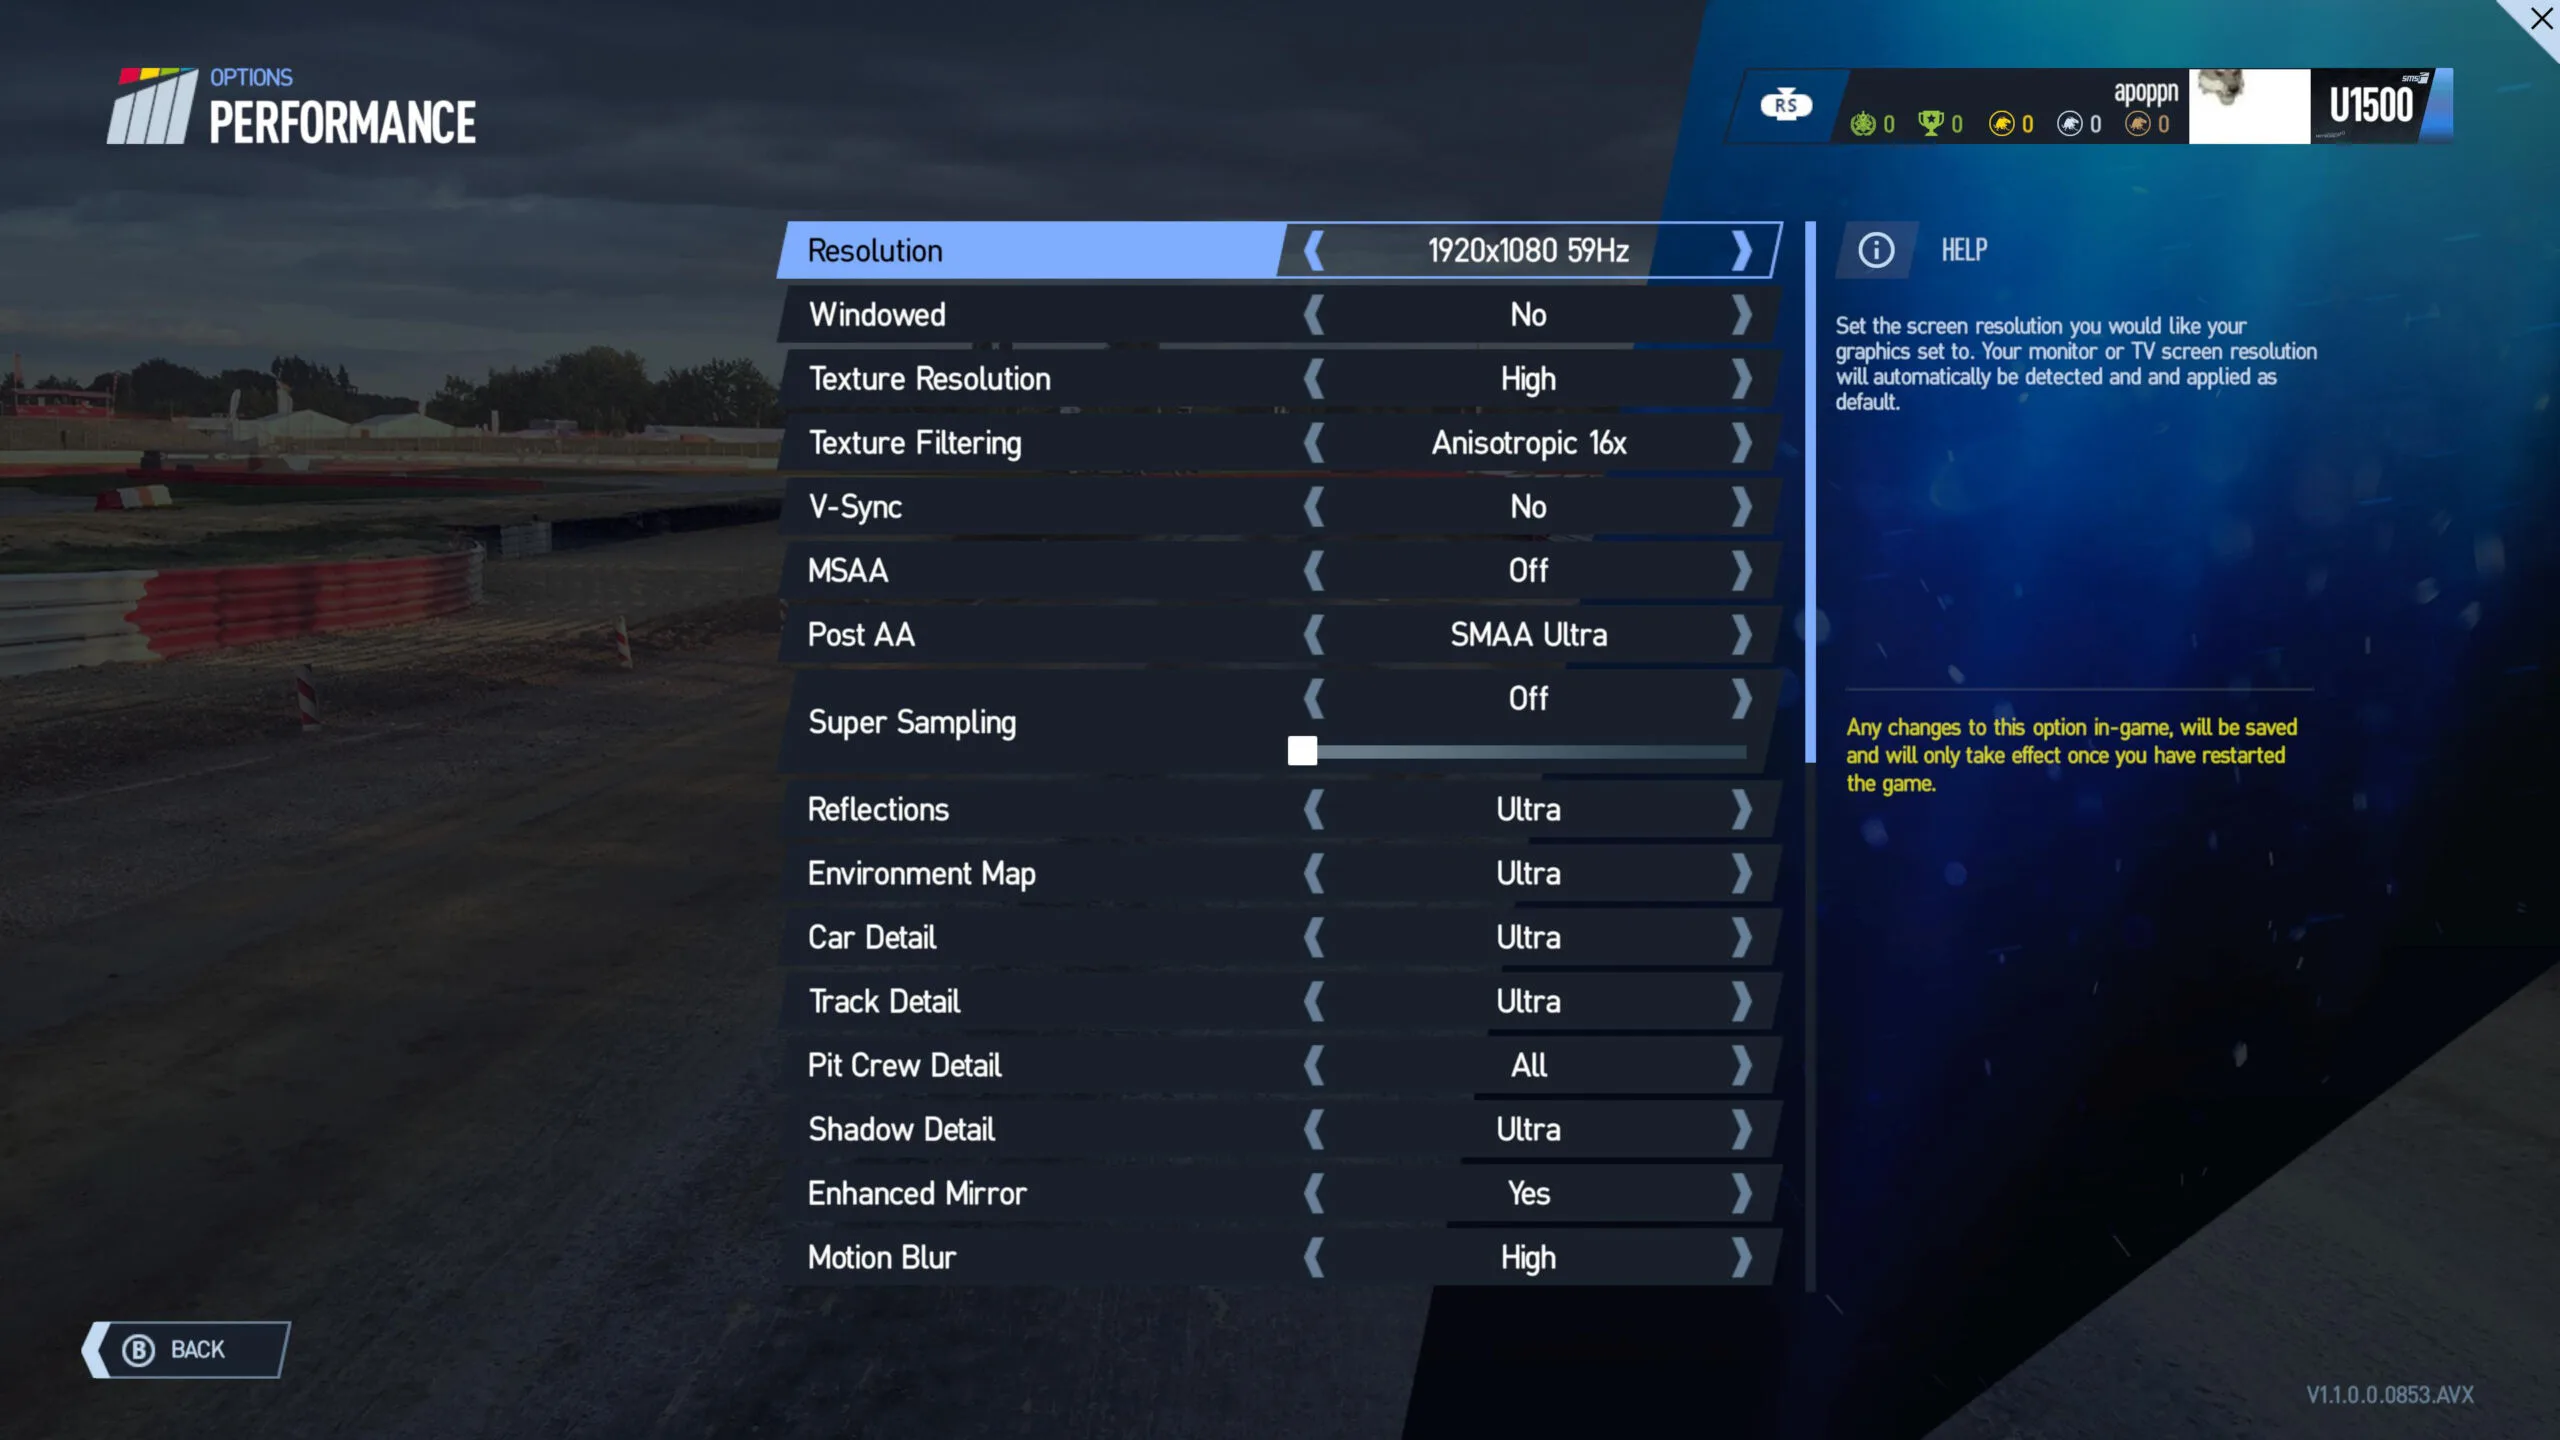
We used maximum settings including for Motion Blur.
Here is the frametime plot.
Here are the FCAT-VR details.
The RX 6900 XT delivered 163.67 unconstrained FPS with 1 synthesized and 1 dropped frames plus 1 Warp miss.
The RTX 3080 Ti managed 142.16 unconstrained FPS with 2 synthetic frames plus 2 dropped frames and 2 Warp misses.
The RTX 4080 got 200.88 unconstrained FPS with no synthesized frames nor dropped frames and no Warp misses.
The RTX 4090 achieved 253.50 unconstrained FPS together with 3 synthetic frames plus 2 dropped frames and 2 Warp misses.
The experience playing Project CARS 2 using maximum settings is similar for all four video cards but the RTX 4090 and RTX 4080 have far more performance headroom to increase the frequency to 120Hz or to use a higher resolution headset.
Next we will check out a classic VR game, Skyrim VR.
Skyrim VR
Skyrim VR is an older game that is no longer supported by Bethesda, but fortunately the modding community has adopted it. It is not as demanding as many of the newer VR ports so its performance is still very good on maxed-out settings using its Creation engine.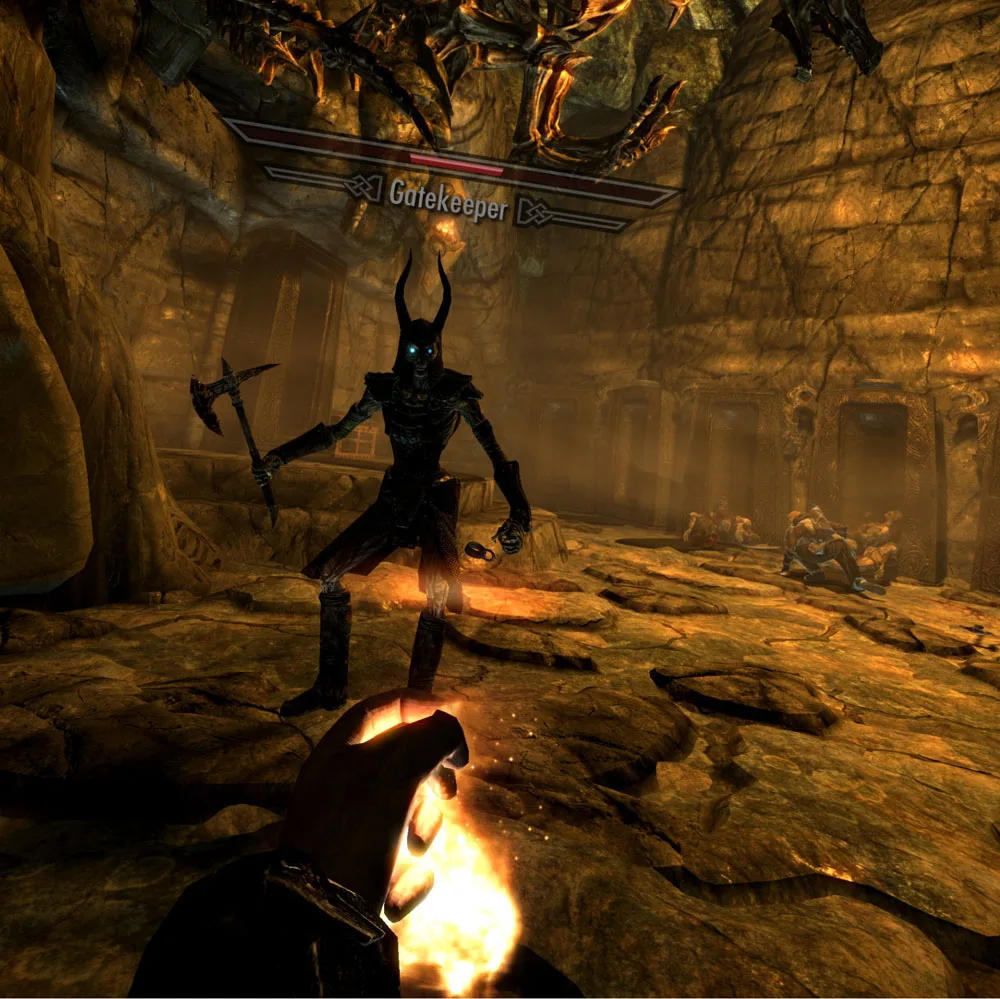
We benchmarked vanilla Skyrim using its highest settings plus we increased the in-game Supersample option to maximum.
Here are the frametime results.
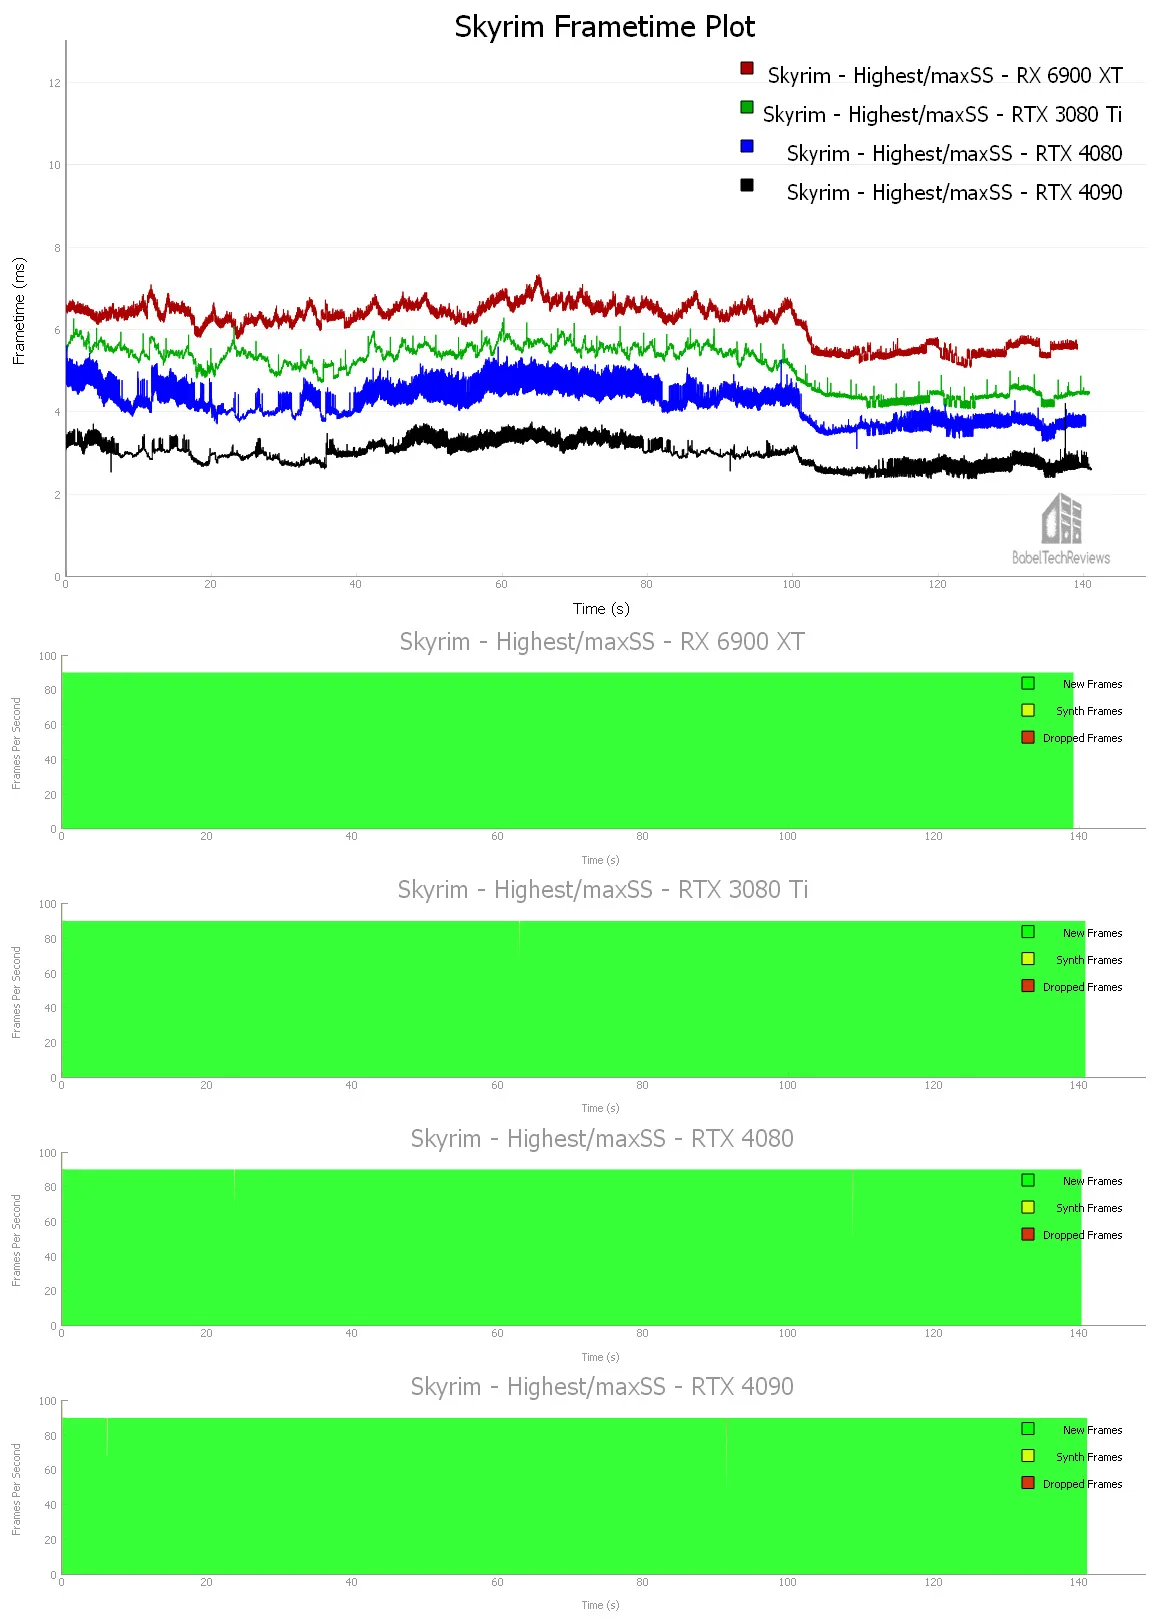
Here are the details of our comparative runs as reported by FCAT-VR.

The RX 6900 XT provided 162.13 unconstrained FPS with no synthesized or dropped frames nor Warp misses.
The RTX 3080 Ti managed 194.63 unconstrained FPS with no synthesized or dropped frames nor Warp misses.
The RTX 4080 achieved 239.08 unconstrained FPS with 2 synthetic frames plus 2 dropped frames and 1 Warp miss.
The RTX 4090 delivered 337.76 unconstrained FPS together with 2 synthetic frame and with 2 dropped frames plus 1 Warp miss.
All cards deliver an identical vanilla Skyrim VR experience with a ton of extra performance headroom to add mods and, in addition, to raise the render resolution using the two faster cards.
Next we check out Sniper Elite VR.
Sniper Elite VR
Sniper Elite VR’s visuals are decent with good texture work that is well-realized. The building architecture and panoramas look good, explosions are convincing and the weapons convey a sense of weight, although not achieving realism. It is primarily an arcade style sniping game featuring its signature X-Ray kill cam, but it offers multiple ways to achieve goals including with explosives and by using three other main weapon choices besides your rifle.
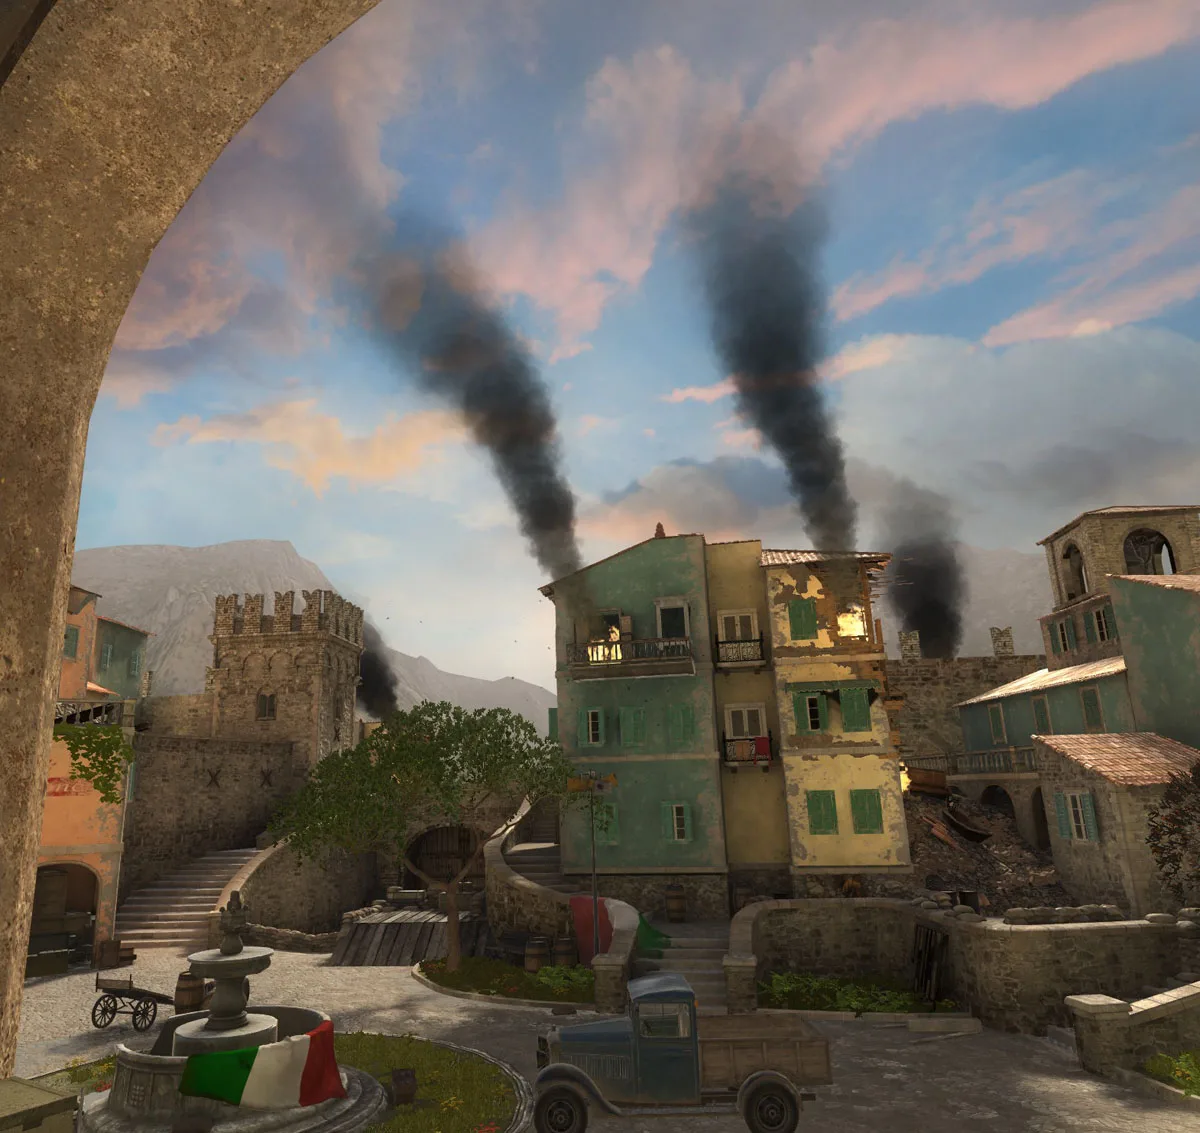
We benchmarked using the Highest settings.
Here is the frametime plot.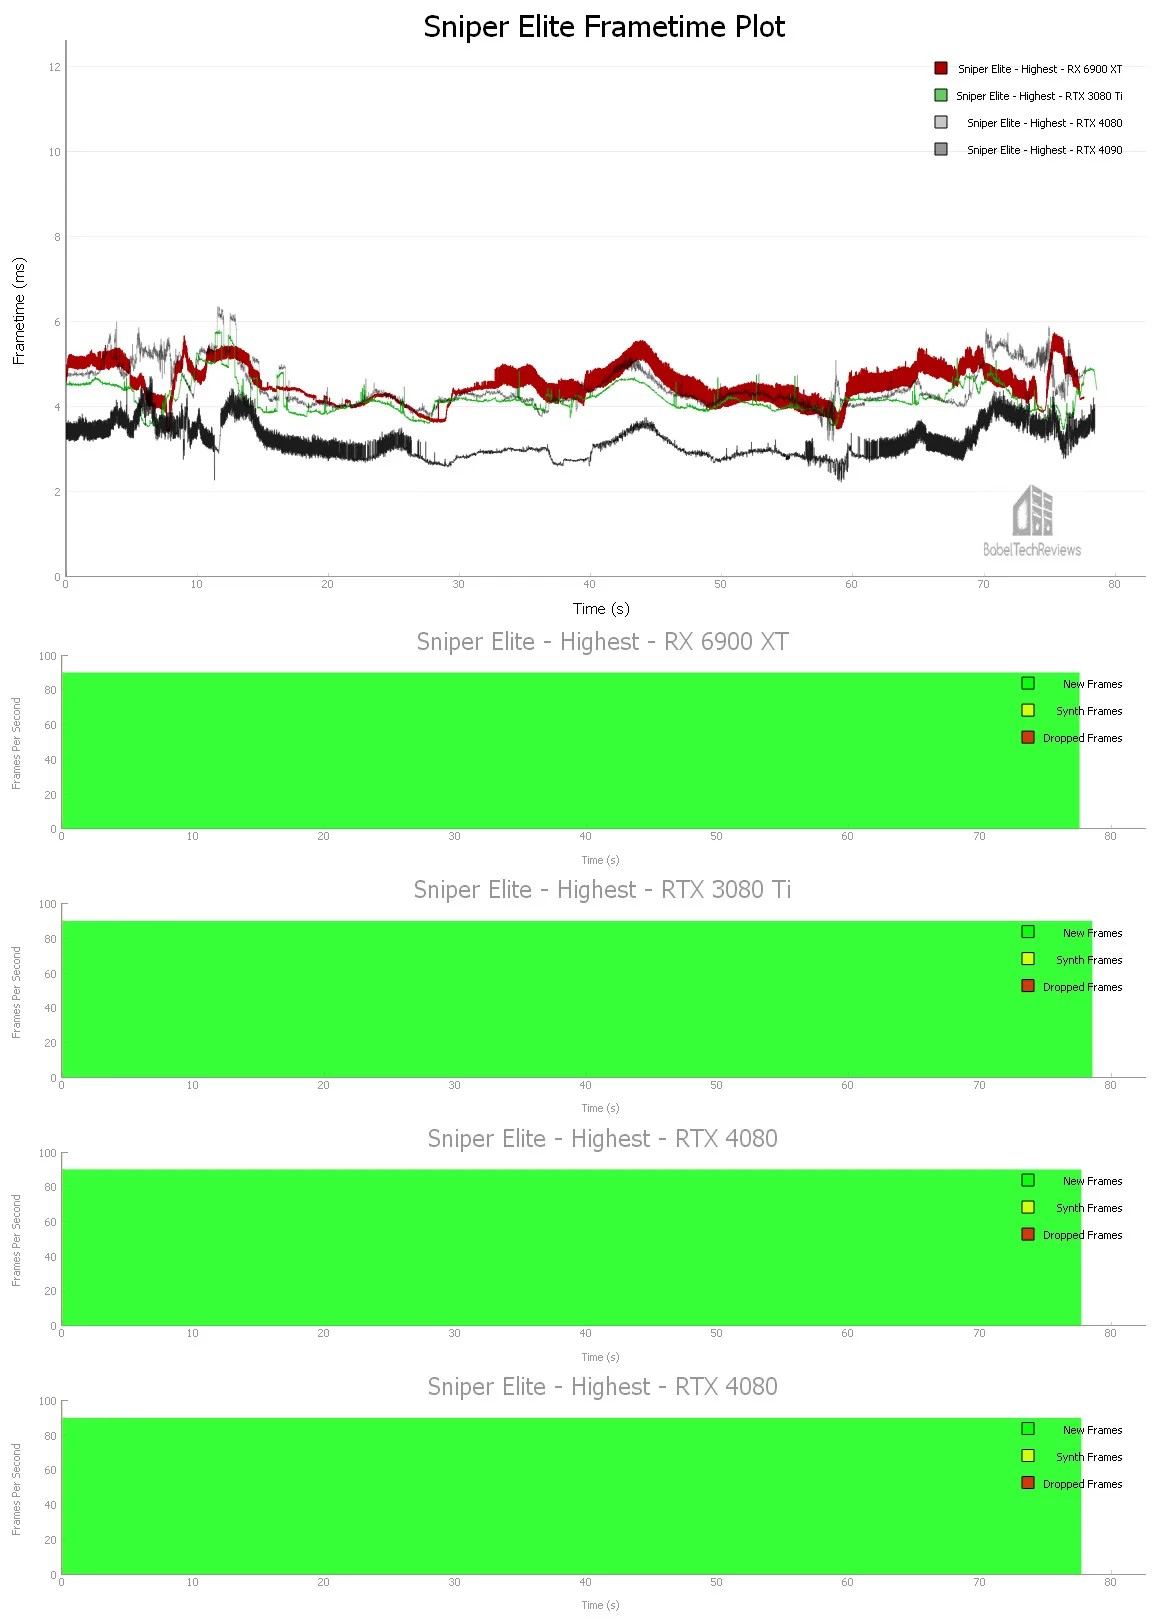
Here are the details:
The RX 6900 XT delivered 222.93 unconstrained FPS with no synthesized or dropped frames nor Warp misses.
The RTX 3080 Ti got 239.07 unconstrained FPS with no synthesized or dropped frames nor Warp misses.
The RTX 4080 delivered 223.33 unconstrained FPS with no synthesized or dropped frames nor Warp misses.
The RTX 4090 brought 318.03 unconstrained FPS together with 1 synthetic and 1 dropped frames and 1 Warp miss.
All four cards deliver a similar playing experience on High with the faster two cards offering more performance headroom. We recommend that any performance headroom be used for increasing the SteamVR render resolution. Since the RTX 4080 only matches the RX 6900 XT and is behind the RTX 3080 Ti, we suspect it may be a driver issue.
Last up, The Walking Dead: Saints & Sinners.
The Walking Dead: Saints & Sinners
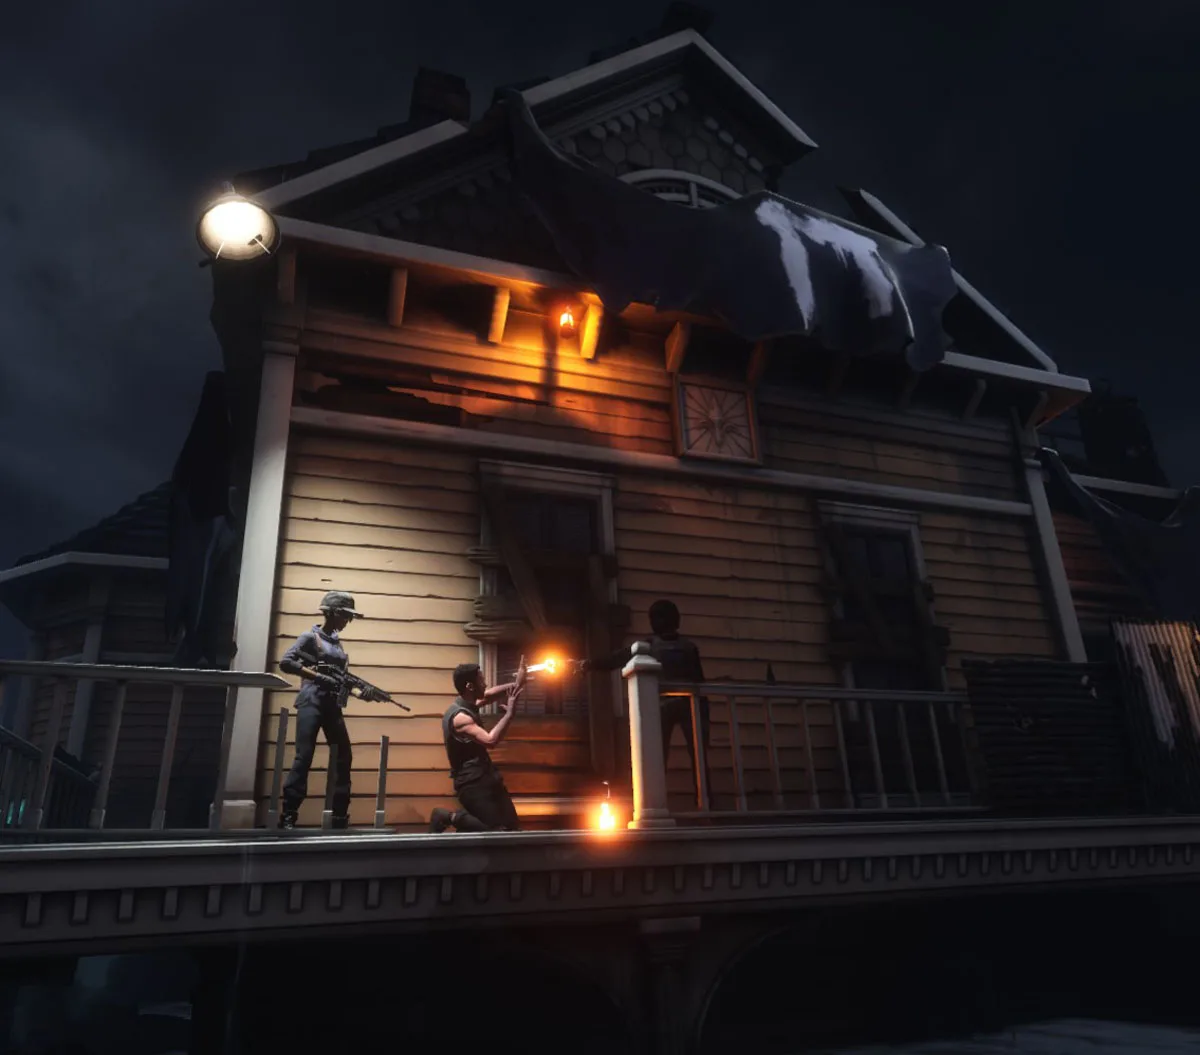
The Walking Dead: Saints & Sinner is the last of BTR’s 10 VR game benching suite. It is a first person survival horror adventure RPG with a strong emphasis on crafting. Its visuals using the Unreal 4 engine are very good and it makes good use of physics for interactions.
We benchmarked Saints and Sinners using its High preset and we left the Pixel Density at 100%. Here is the frametime chart.
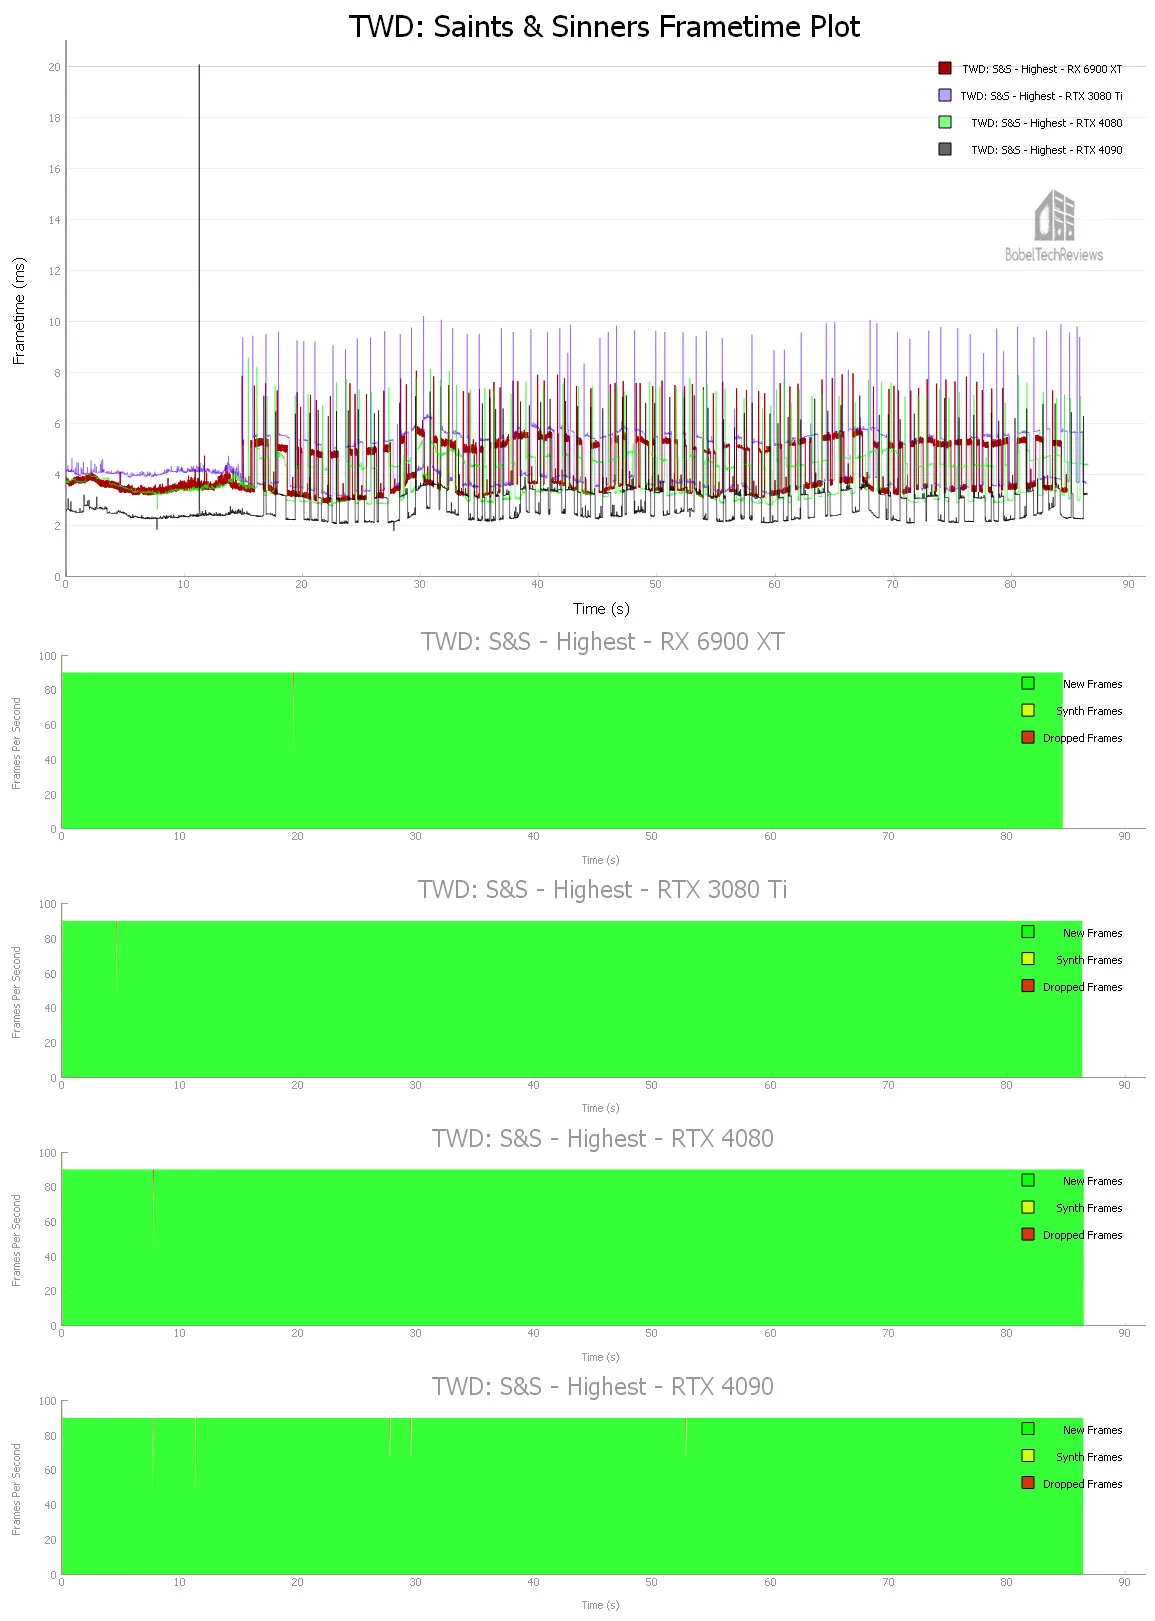
Here are the details as reported by FCAT-VR.
The RX 6900 XT delivered 240.00 unconstrained FPS with 1 synthetic frames and 1 dropped frames and 1 Warp miss.
The RTX 3080 Ti managed 222.18 unconstrained FPS with 1 synthetic frames and 1 dropped frames and 1 Warp miss.
The RTX 4080 got 260.94 unconstrained FPS with 1 synthetic frames and 1 dropped frames and 1 Warp miss.
The RTX 4090 achieved 366.41 unconstrained FPS together with 6 synthetic frames and with 4 dropped frames and 4 Warp misses.
Playing The Walking Dead: Saints & Sinners using the in-game Ultra preset and 100% Pixel Density is similar for all 4 cards but there is significantly more performance headroom for the RTX 4090 and to a lesser extent the RTX 4080 for increasing the render resolution or using a higher resolution headset.
Let’s check out synthetic VR tests and unconstrained framerates.
Unconstrained Framerates & Synthetic VR Benchmarks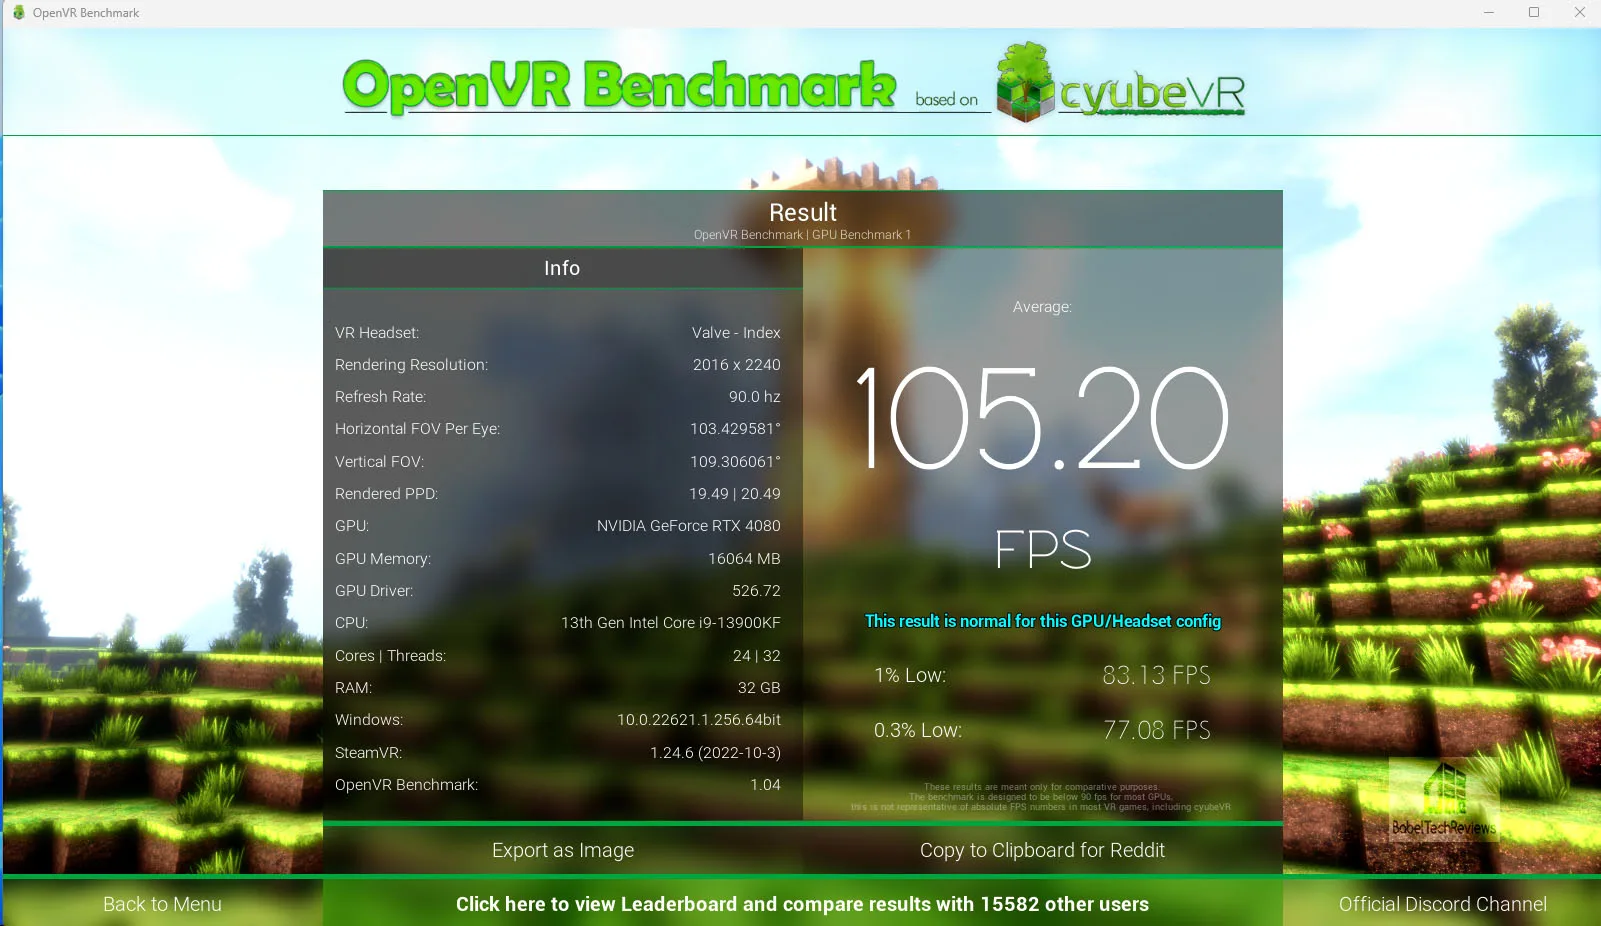
The following chart summarizes the overall Unconstrained Framerates (the performance headroom) of our two cards using our 10 VR test games. The preset is listed on the chart and higher is better. In addition, we present three synthetic VR benchmarks.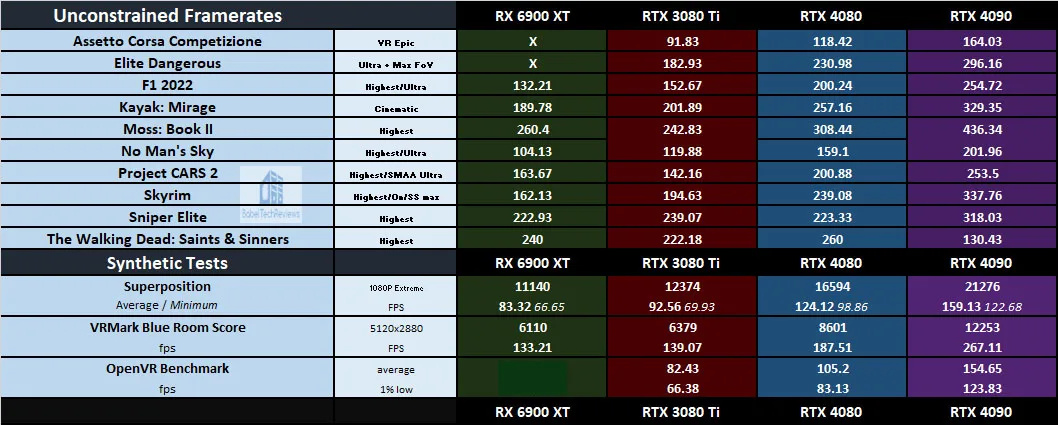
The RX 4080 FE averages close to one-third higher unconstrained frames for many VR benchmarks and sits in between the RTX 3080 Ti and the RTX 4090 FE in this important performance metric. However, unconstrained framerates are just one metric that has to be taken together with the frametime plots to have real meaning.
It is clear that the RTX 4090 and the RTX 4080 are ready for higher resolution headsets than the Valve Index. In many cases, either card may be able to use the higher refresh rates of 120Hz/144Hz for fast-paced and/or sim racing games.
Creative, Pro & Workstation Apps
Let’s look at Creative applications next to see if the RTX 4080 is a good upgrade from the RTX 3080 Ti or RX 6900 XT. We test starting with Geekbench.
GeekBench
GeekBench is an excellent CPU/GPU benchmarking program which runs a series of tests and times how long a GPU (in this case) takes to complete its tasks. It benchmarks OpenCL, Vulkan, and CUDA performance
OpenCL, Vulkan, and CUDA Performance
The RTX 4080 OpenCL, Vulkan, and CUDA performance are charted below. 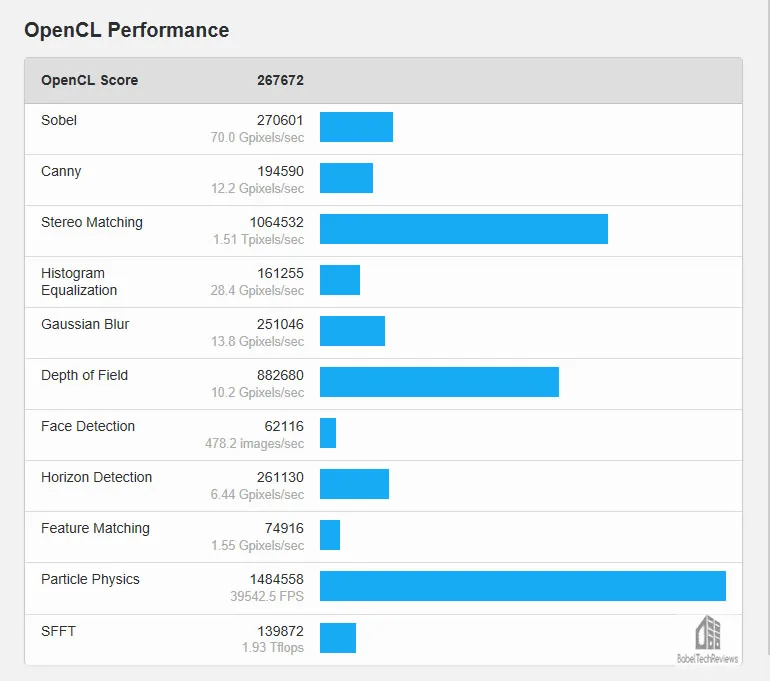
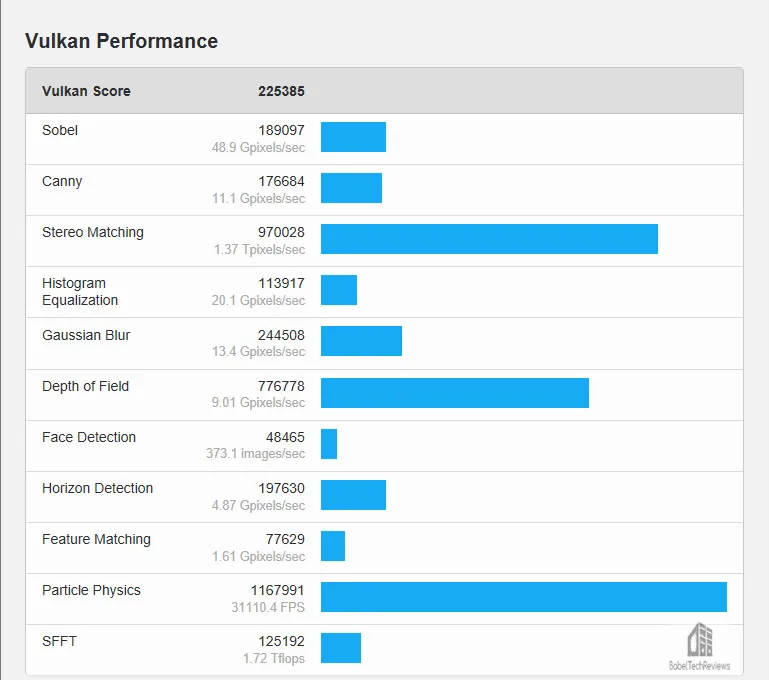
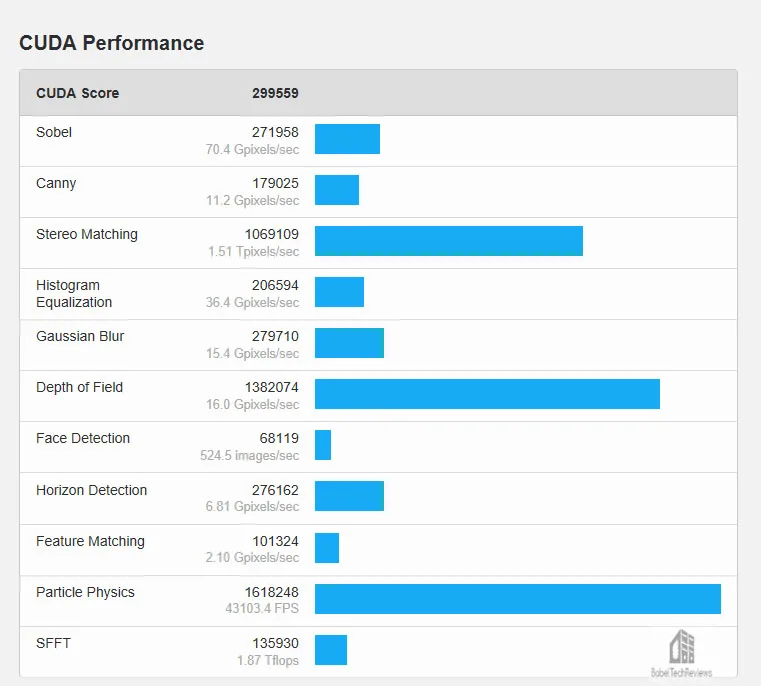
Next we test the summary charts below show the overall comparative performance scores.

Again, the RTX 4090 performance is outstanding.
Next up, Blender benchmark.
Blender 3.3.0 Benchmark
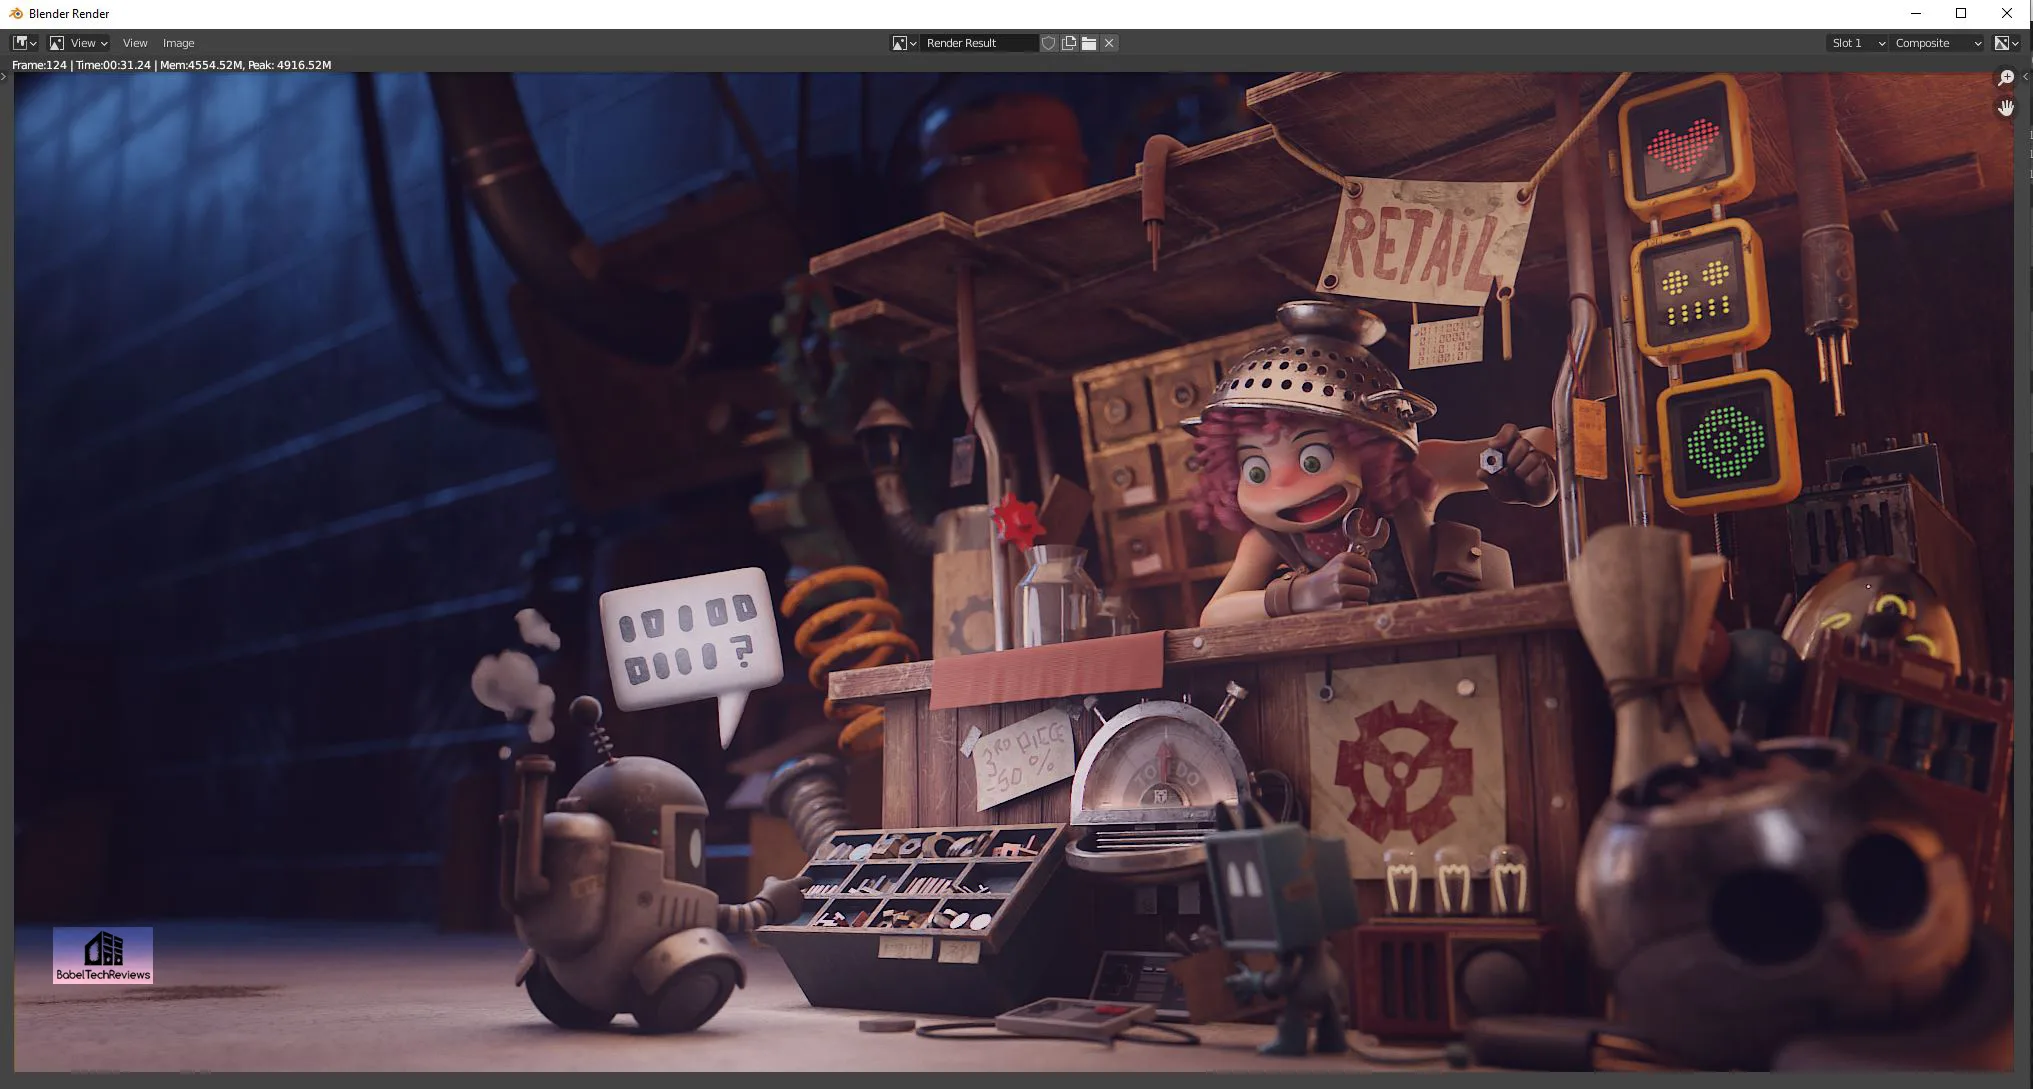
Blender is a very popular open source 3D content creation suite. It supports every aspect of 3D development with a complete range of tools for professional 3D creation.
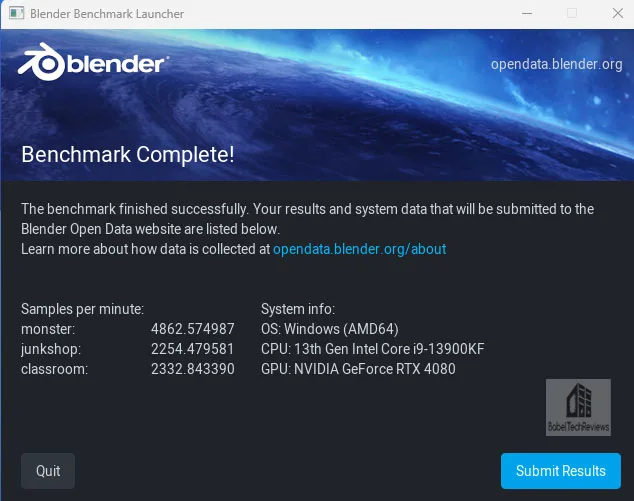
For the following chart, higher is better as the benchmark renders a scene multiple times and gives the results in samples per minute.

Blender’s benchmark performance is highest using the RTX 4090, and often the amount of time saved is substantial over using the next fastest card, the RTX 4080.
Next, we look at the OctaneBench.
OTOY Octane Bench
OctaneBench allows you to benchmark your GPU using OctaneRender. The hardware and software requirements to run OctaneBench are the same as for OctaneRender Standalone.
We run OctaneBenc 2020.1.5 for Windows and here are the RTX 4080’s complete results and overall score of 946.30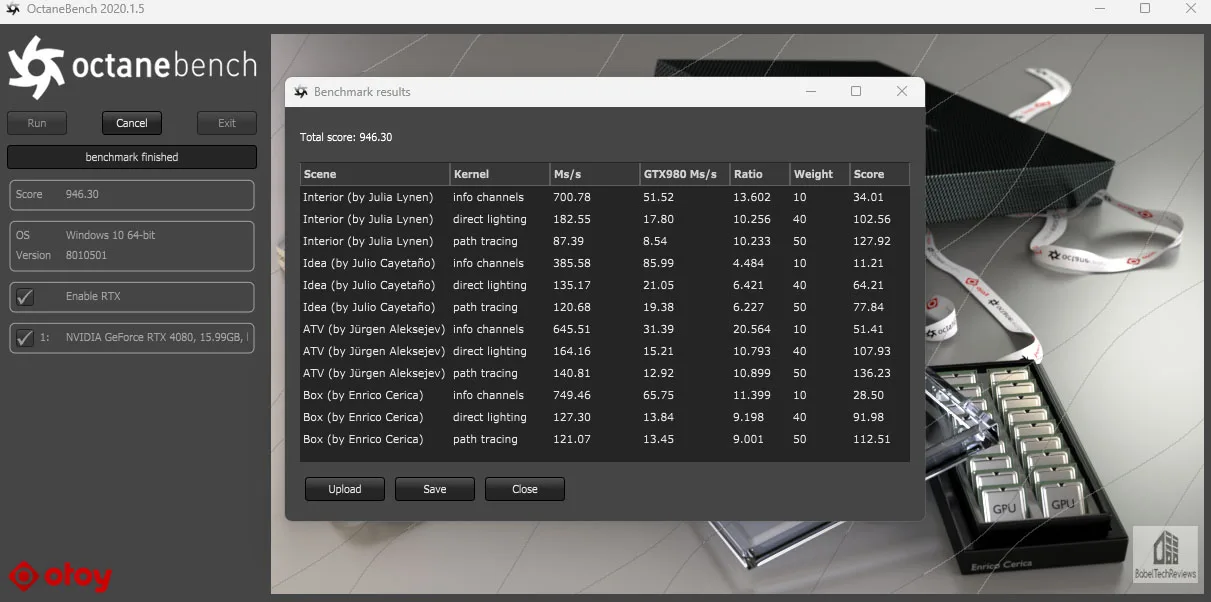
Here is the summary comparing the three cards that can run this render benchmark.

The RTX 4090 is a beast of a card when used for rendering and the RTX 4080 sits in between, above the RTX 3080 Ti.
Next, we move on to AIDA64 GPGPU benchmarks.
AIDA64
AIDA64 is an important industry tool for benchmarkers. Its GPGPU benchmarks measure performance and give scores to compare against other popular video cards.
AIDA64’s benchmark code methods are written in Assembly language, and they are well-optimized for every popular AMD, Intel, NVIDIA and VIA processor by utilizing the appropriate instruction set extensions. We use the Engineer’s full version of AIDA64 courtesy of FinalWire. AIDA64 is free to to try and use for 30 days.
Here is the chart summary of the AIDA64 GPGPU benchmarks with the RTX 4090, the RTX 4080, the RTX 3080 Ti, and the RX 6900 XT side-by-side.

Generally the RTX 4090 is faster at almost all of AIDA64’s GPGPU benchmarks than the other cards with the RTX 4080 in second place. So let’s look at Sandra 2020 next.
SiSoft Sandra 2020
To see where the CPU, GPU, and motherboard performance results differ, there is no better tool than SiSoft’s Sandra 2020. SiSoftware SANDRA (the System ANalyser, Diagnostic and Reporting Assistant) is a excellent information & diagnostic utility in a complete package. It is able to provide all the information about your hardware, software, and other devices for diagnosis and for benchmarking. Sandra is derived from a Greek name that implies “defender” or “helper”.
There are several versions of Sandra, including a free version of Sandra Lite that anyone can download and use. 20/21-R16a is the latest version, and we are using the full engineer suite courtesy of SiSoft. Sandra 2020 features continuous multiple monthly incremental improvements over earlier versions of Sandra. It will benchmark and analyze all of the important PC subsystems and even rank your PC while giving recommendations for improvement.
With the above in mind, we ran Sandra’s intensive GPGPU benchmarks and charted the results summarizing them. The performance results of the RTX 4080 and RTX 4090 are compared with the performance results of the RTX 3080 Ti, and the RX 6900 XT.
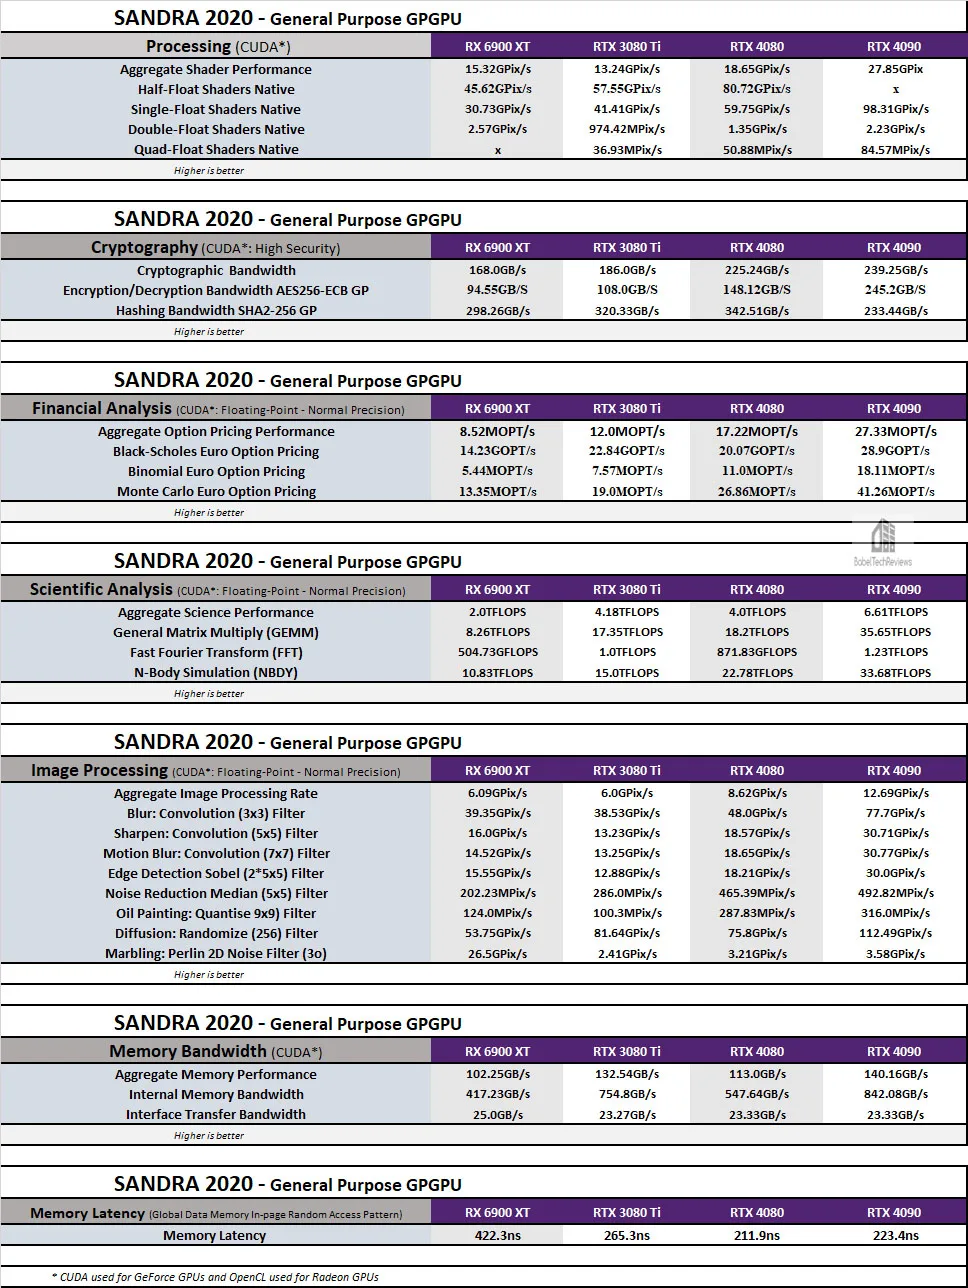
Second only to the RTX 4090, the RTX 4080 is faster than the RTX 3080 Ti and it distinguishes itself in every area – Processing, Cryptography, Financial and Scientific Analysis, Image Processing, and Bandwidth.
Next up, SPEC benchmarks.
SPECworkstation3.1 Benchmarks
All the SPECworkstation 3 benchmarks are based on professional applications, most of which are in the CAD/CAM or media and entertainment fields. All of these benchmarks are free except for vendors of computer-related products and/or services.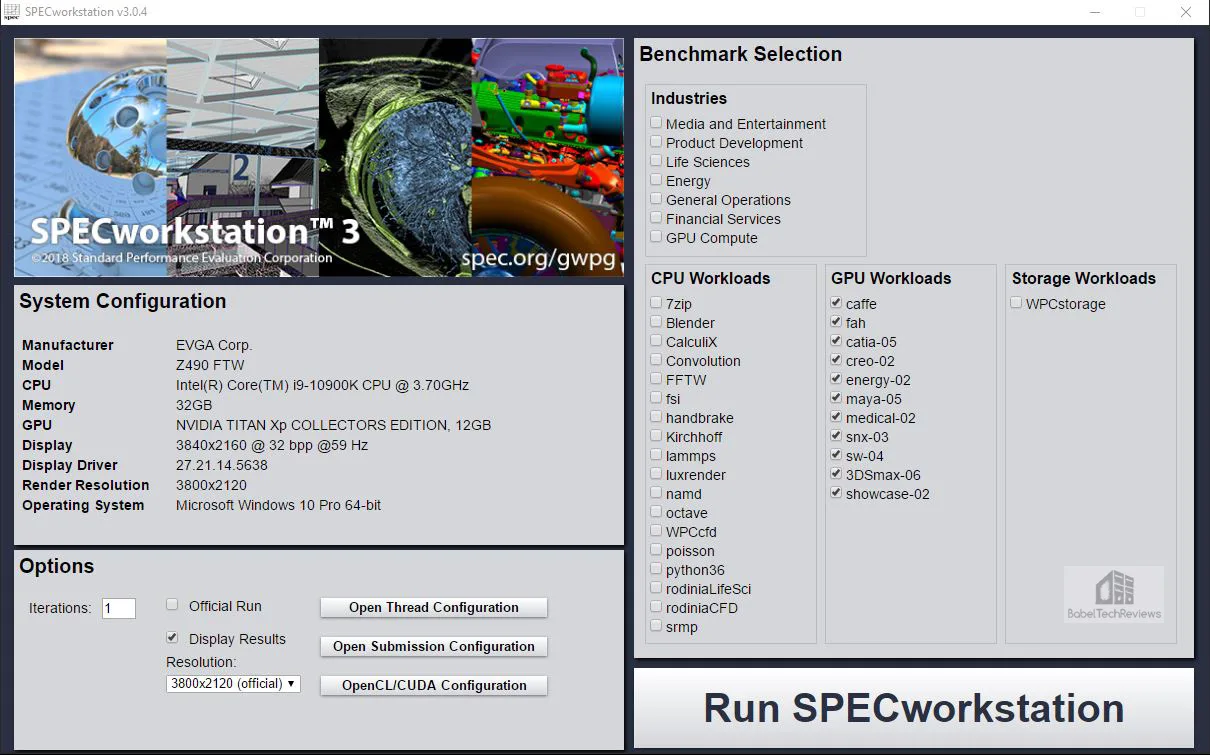
The most comprehensive workstation benchmark is SPECworkstation 3. It’s a free-standing benchmark which does not require ancillary software. It measures GPU, CPU, storage and all other major aspects of workstation performance based on actual applications and representative workloads. We only tested the GPU-related workstation performance as checked in the image above.
Here are our RTX 4080 raw SPECworkstation 3.1 raw scores: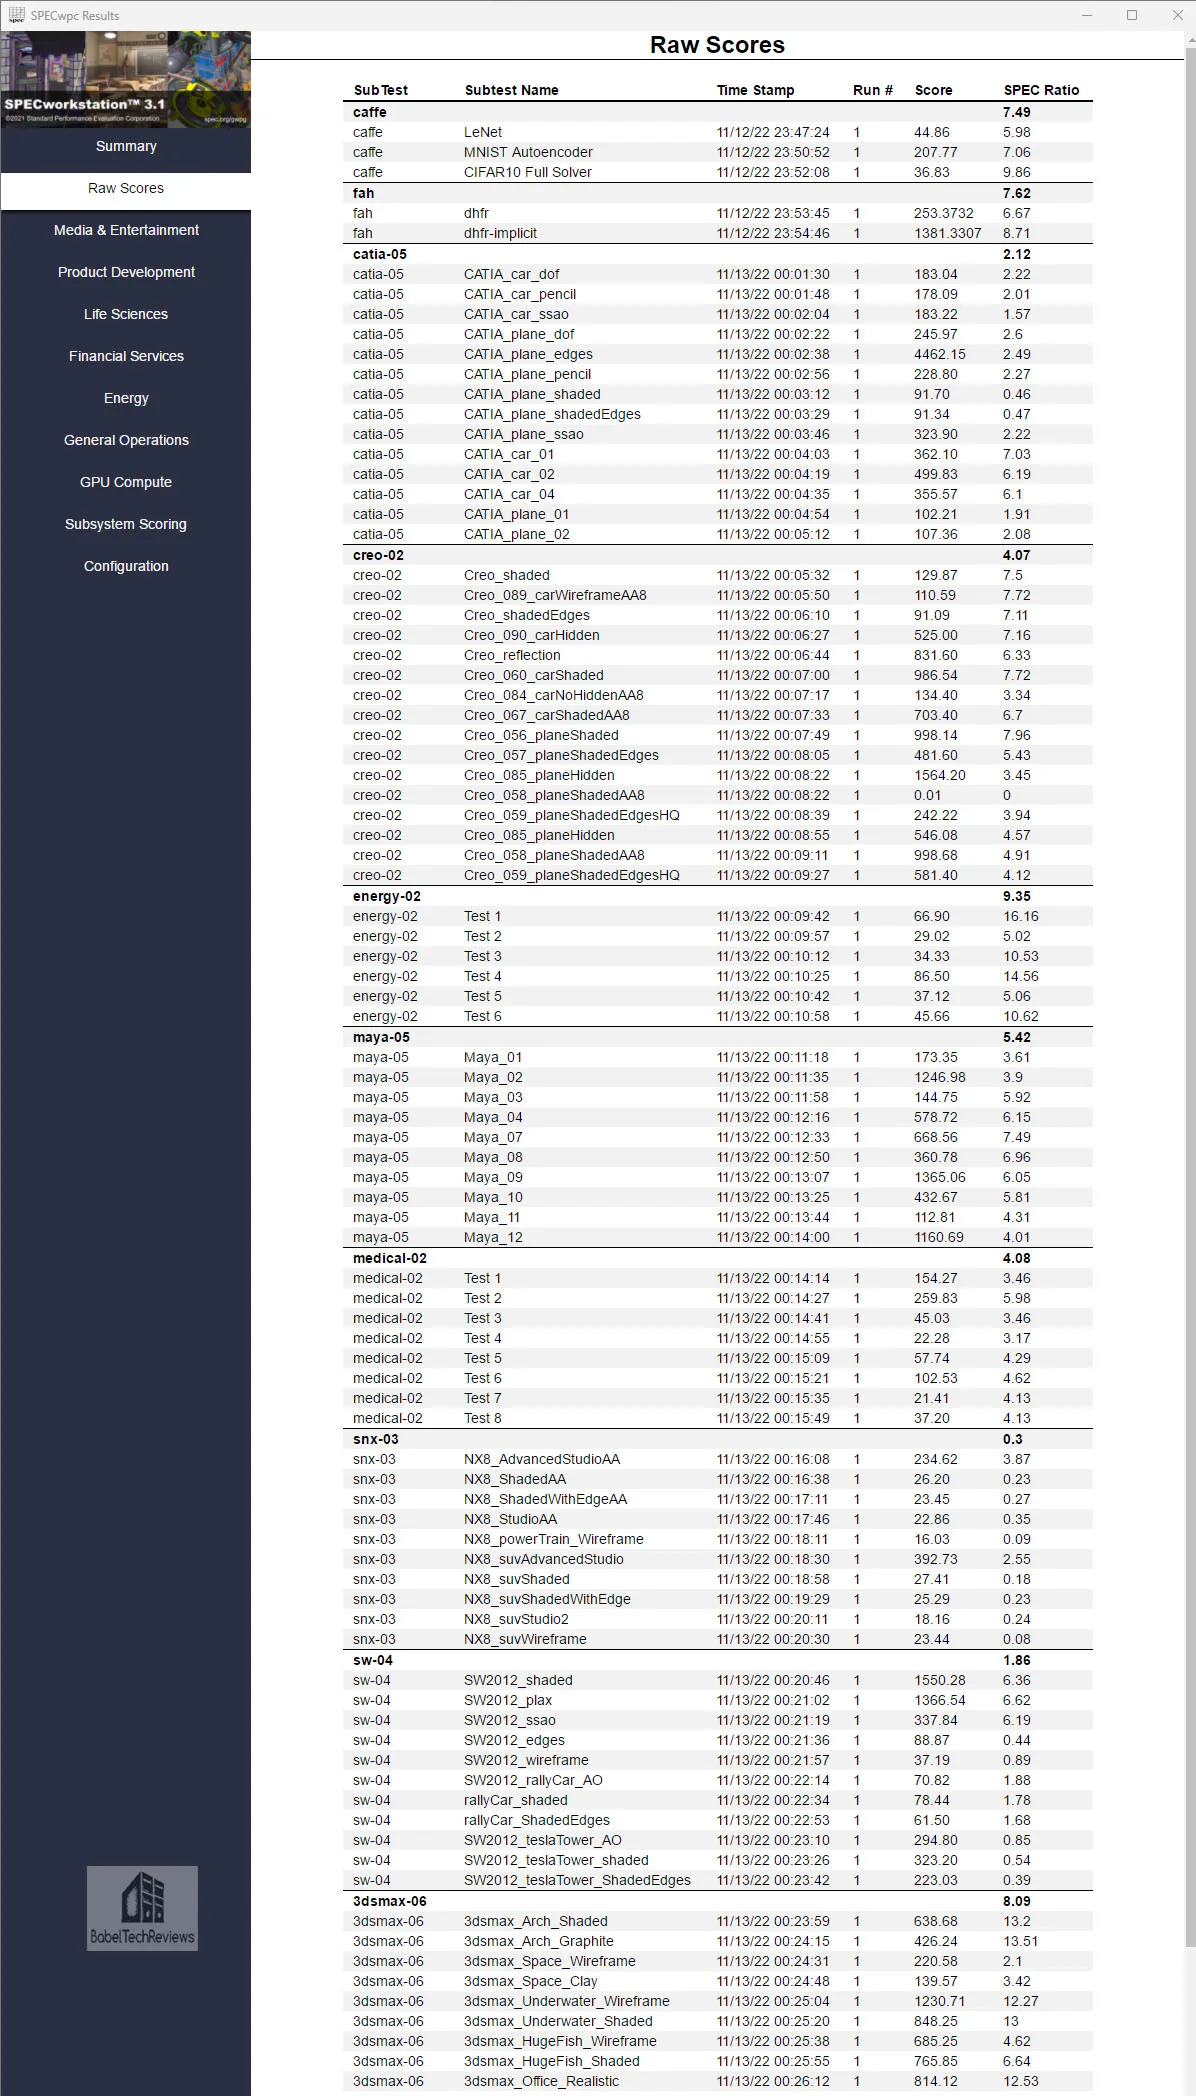

Below are the SPECworkstation 3.1 RTX 4090 results summarized in a chart along with the three competing cards, the RTX 4090, the RTX 3080 Ti, and the RTX 6900 XT. Higher is better since we are comparing scores.

The RTX 4090 is not a workstation card, yet it uses brute force to win most of the benches against the other cards with the RTX 4080 in second place.
Finally, we benchmark using SPECviewperfect GPU benches.
SPECviewperf 2020 GPU Benches
The SPEC Graphics Performance Characterization Group (SPECgpc) has released a 2020-22 version of its SPECviewperf benchmark that features updated viewsets, new models, support for up to 4K display resolutions, and improved set-up and results management. We use the highest available 3800×2120 display resolution for high end cards.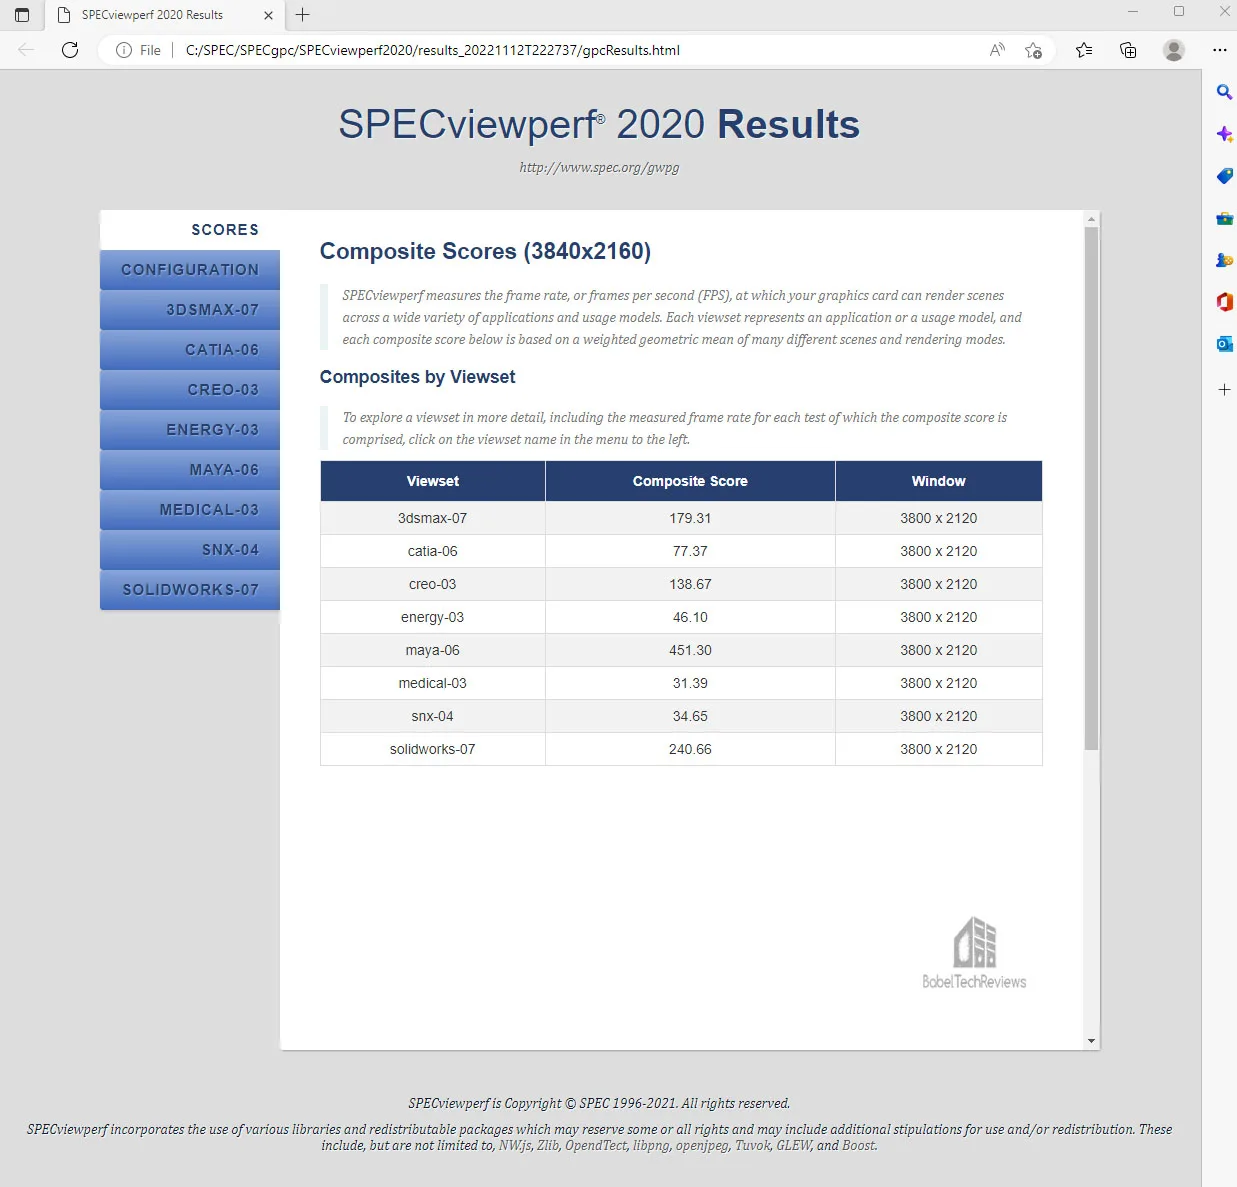
Here are SPECviewperf 2020 GPU RTX 4080 benchmarks summarized in a chart together with our three competing cards.

Although we see three architectures with different strengths and weaknesses, the RTX 4090 is a beast in SPEC benchmarks followed by the RTX 4080 in a solid second place.
After seeing the totality of the benches, creative users may choose to upgrade their existing systems with a new RTX 4080 or 4090 based on the performance increases and the associated increases in productivity that they require. The question to buy a RTX 4080 should be based on the workflow and requirements of each user as well as budget. Time is money to a professional depending on how these apps are used.
Let’s head to our conclusion.
Final Thoughts
Besides suffering with COVID-19, this has been an enjoyable exploration evaluating the new Ada Lovelace RTX 4080 FE versus the RTX 4090 FE, the RTX 3080 TI FE, and Gigabyte RTX 6900 XT Gaming OC. The RTX 4080 performed brilliantly performance-wise, blowing away its other two former flagship competitors and slotting in almost one-third slower than the RTX 4090.
The RTX 4080 at $1199 is a decent upgrade from the $1199 RTX 3080 Ti although it is not as impressive as upgrading from a RTX 3090 ($1499) to a RTX 4090 ($1599). If a VR enthusiast wants the very fastest card, then the RTX 4090 is the best choice for high resolution VR headsets and for creative/workstation apps. For $400 less, the RTX 4080 is a solid choice and it will provide a performance uplift over the RTX 3080 Ti, but not as dramatically as the RTX 4090.
In the last Ampere generation, the $699 RTX 3080 provided the best value, but almost unbelievably, the RTX 4090 provides the best performance bang for buck in Nvidia’s new Ada Lovelace lineup so far. We also notice that there is plenty of performance room for a possible future RTX 4080 Ti to slot in between the RTX 4080 and the RTX 4090.

We are very impressed with the RTX 4080 raw performance after testing it over the past few days in VR. It currently stands as the second fastest video card in the world and would be a solid choice for a high resolution VR headset.
The Founders Edition of the RTX 4080 is well-built, solid, good-looking, and it stays cool and quiet even when overclocked – the big card does not get hot like the RTX 3090 and under load it is quieter than the RTX 3080 Ti FE. The RTX 4080 Founders Edition offers a big performance improvement over the previous $1199 RTX 3080 FE for VR and pro apps although it doesn’t give as great a value as when the RTX 3080 FE launched for $699 two years ago.
However, we cannot give any final verdict now as there is a lot more RTX 4080 benchmarking results on the way next week. We will more extensively test the RTX 4080, RTX 4090, RTX 3080 Ti, and RX 6900 XT using 40-plus pancake games including testing DLSS 3 to determine overall value. Future reviews will hopefully test AMD’s upcoming 7000 series cards and we also plan to test the role of the CPU for VR performance. Stay tuned to BTR!
Happy Gaming!
