This overclocking showdown is a follow-up to the $199 EVGA GTX 1060 3GB and the $199 PowerColor Red Devil RX 470 4GB evaluations. Today, we have updated each card to its latest drivers and have optimized our overclocks with all performance options set to their upper limits to get the highest performance.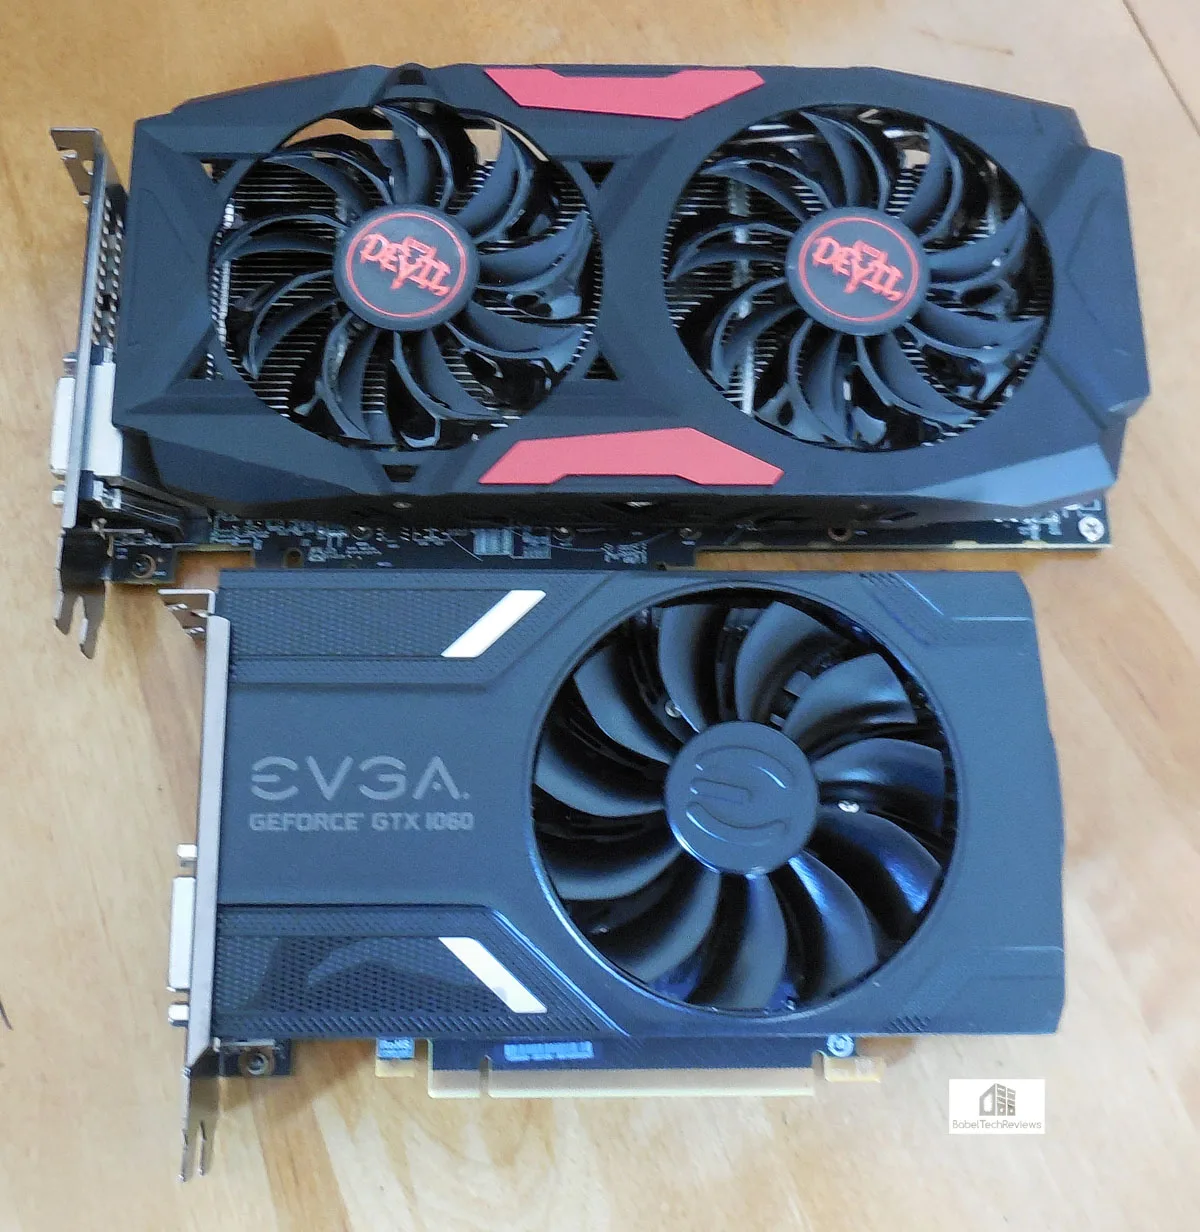
At stock, the reference clocked EVGA GTX 1060 3GB won overall in DX11 performance over the Red Devil-clocked RX 470, and fell marginally short of the 6GB reference version GTX 1060 much as the RX 470 stands in relation to the RX 480. This time, we will overclock the EVGA GTX 1060/3GB and the Red Devil RX 470 as far as they each will go with a maxed-out fan profile and with added voltage to see where they stand in relation to each other fully overclocked.
The Red Devil RX 470 OC vs. the EVGA GTX 1060 3GB
The $199 PowerColor Red Devil version of the RX 470 4GB is factory clocked up to it’s maximum boost speeds of 1270MHz from 1206MHz at stock. The details of our manual overclocking to 5% may be found here. We found that as long as the temperatures remain cool and the Power and Temperature limits are maximized, it will not throttle. Even at 100% fan, the noise level is acceptable and the temperatures remain in the mid-70s C. 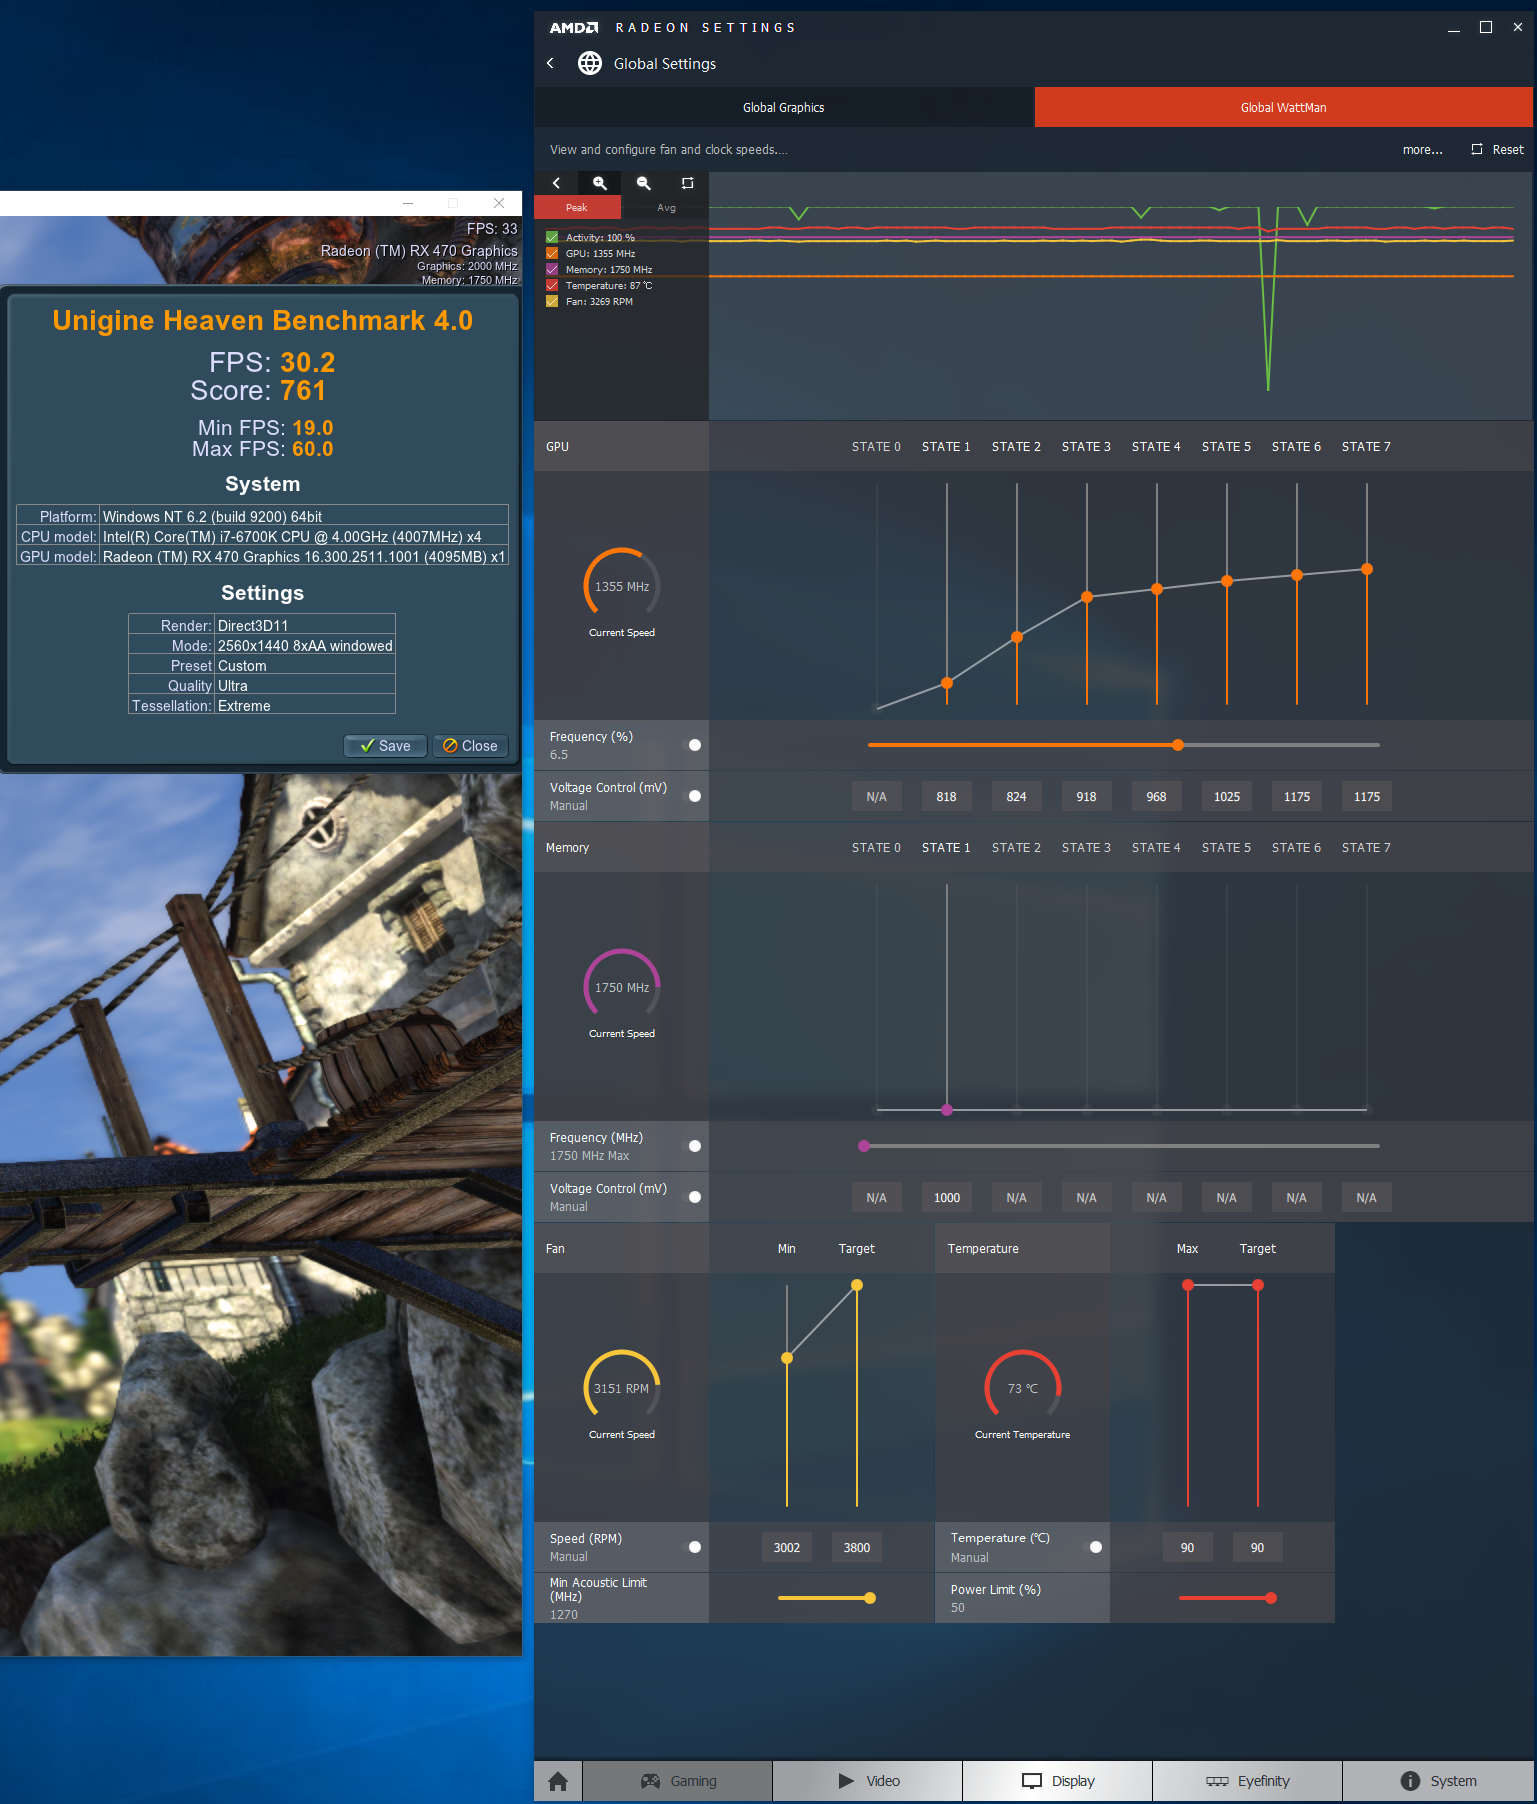
We again tried a +6.5% overclock as the voltage was now maximized, but the overclock was right on the edge of stability and we experienced occasional crashes to desktop even though our games could still complete our benchmarks. Although for a day-to-day overclock, we will use +6%, for this overclocking evaluation we settled on 6.5%, or on 1355MHz boost with stock memory clocks (1750MHz). Higher memory clocks did not generally gain any performance and often negatively impacted it.
Overclocking the Gaming Edition of the EVGA GTX 1060 3GB
We devoted a separate evaluation to the EVGA GTX 1060 3GB which you can read here. We achieved a final stable overclock of +125 MHz to the core which settled in at or above 1974MHz with GPU Boost 3.0 for the majority of our benching as we kept our room cool for all of our game benchmarks. 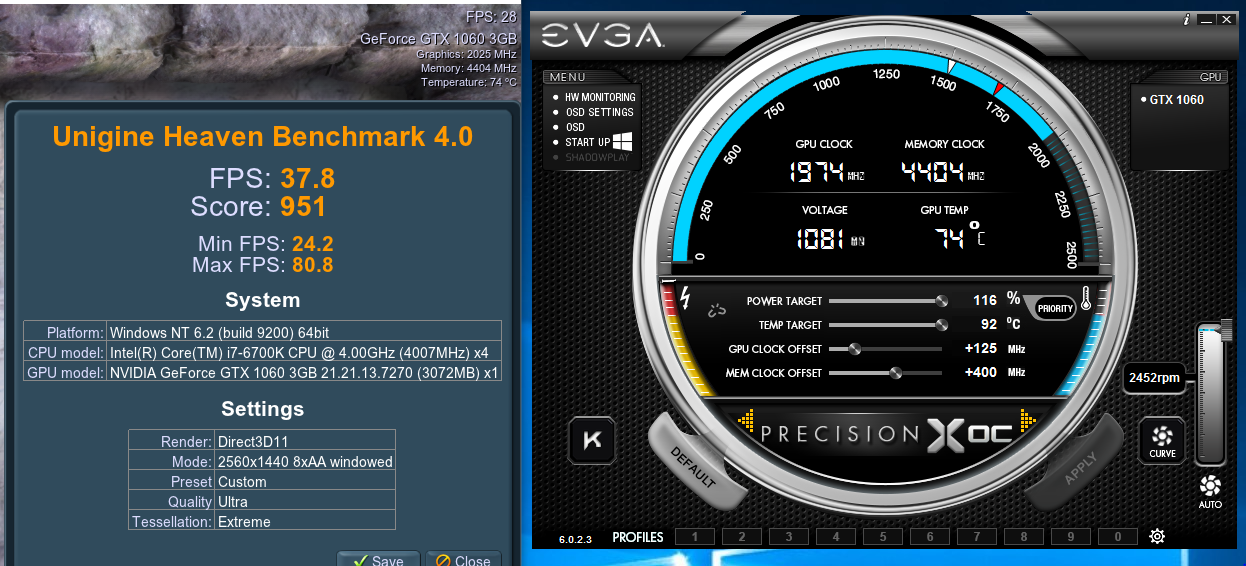 Watching the PrecisionX OC in-game overlay during our benchmark runs we also often observed 1987MHz. Our memory overclock remained at +400MHz for its clock of 4404MHz which greatly contributed to the increased performance. The fan got a mild whine which became intrusive when pushed from 90% to 100% but the GPU remained cool in the mid-70s C.
Testing Platform
Our testing platform is Windows 10 Home 64-bit, using an Intel Core i7-6700K at 4.00GHz which turbos to 4.4GHz for all cores as set in the ASRock Z7170 motherboard’s BIOS, and 16GB of G.SKILL DDR4 at 3000MHz. The settings and hardware are identical except for the two cards being tested.
We also feature our newest 2016 games, Mirror’s Edge Catalyst and Deux Ex Mankind Divided, and we also include Ashes of the Singularity, Hitman, Rise of the Tomb Raider, and Total War Warhammer using DX12. We have also added Futuremark’s DX12 benchmark, Time Spy. We will compare the performance of 25 modern games at 1920×1080 and at 2560×1440 resolutions with maximum settings.
Before we run benchmarks, let’s check out the test configuration.
Test Configuration – Hardware
- Intel Core i7-6700K (reference 4.0GHz, HyperThreading and Turbo boost is on to 4.4GHz; DX11 CPU graphics).
- ASRock Z7170M OC Formula motherboard (Intel Z7170 chipset, latest BIOS, PCIe 3.0/3.1 specification, CrossFire/SLI 8x+8x)
- G.Skill Ripjaws V 16GB DDR4 (2x8GB, dual channel at 3000MHz)
- EVAG GTX 1060 3GB, Gaming Edition, manually overclocked, supplied by EVGA
- Red Devil RX 470 4GB, manually overclocked, supplied by PowerColor.
- Two 2TB Toshiba 7200 rpm HDDs for each platform
- EVGA 1000G 1000W power supply unit (for both platforms)
- Thermaltake Water2.0, supplied by Thermaltake
- Onboard Realtek Audio
- Genius SP-D150 speakers, supplied by Genius
- Thermaltake Overseer RX-I full tower case, supplied by Thermaltake
- ASUS 12X Blu-ray writer
- Monoprice Crystal Pro 4K
Test Configuration – Software
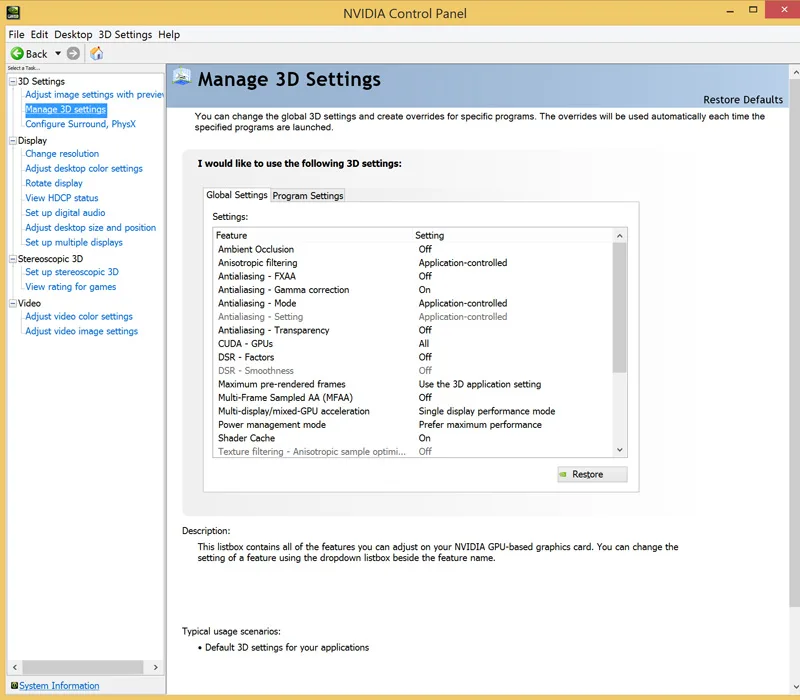
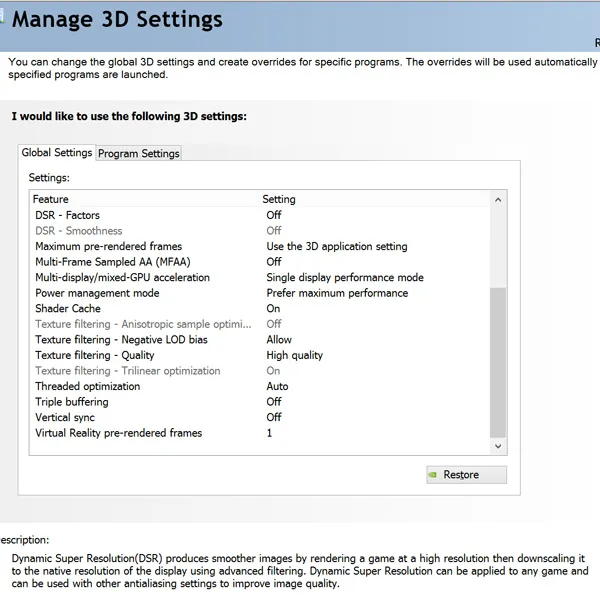
- GeForce WHQL 372.70 was used for the EVGA GTX 1060/3GB. High Quality, prefer maximum performance, single display. See control panel images below.
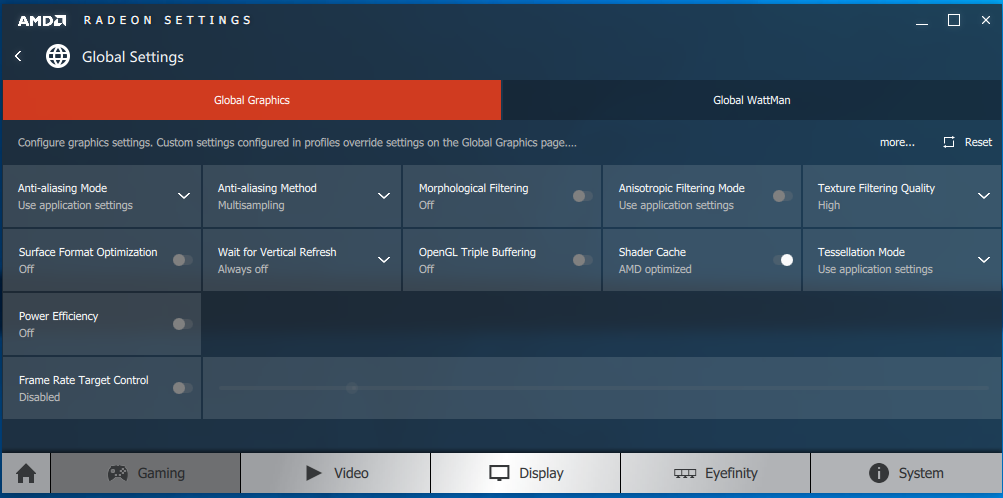
- AMD Crimson Software 16.8.3 hotfix drivers were used for the benching the Red Devil RX 470. See control panel image below.
- VSync is off in the control panel.
- AA enabled as noted in games; all in-game settings are specified with 16xAF always applied
- All results show average frame rates including minimum frame rates shown in italics on the chart next to the averages in smaller font. Percentage differences are calculated between the average frame rates of the RX 470 and of the GTX 1060/3GB.
- Highest quality sound (stereo) used in all games.
- Windows 10 64-bit Home edition, all DX11 titles were run under DX11 render paths. Our four DX12 titles are run under the DX12 render path. Latest DirectX
- All games are patched to their latest versions at time of publication.
- Crimson Software WattMan
- EVGA’s Precision XOC, reviewer’s version 6.
-
The 25 PC Game benchmark suite & 2 synthetic tests
Synthetic
- Firestrike – Basic & Extreme
- Time Spy DX12
- Crysis 3
- Metro: Last Light Redux (2014)
- Middle Earth: Shadows of Mordor
- Alien Isolation
- Dragon’s Age: Inquisition
- Dying Light
- Grand Theft Auto V
- ProjectCARS
- the Witcher 3
- Batman: Arkham Origins
- Mad Max
- Fallout 4
- Star Wars Battlefront
- Assassin’s Creed Syndicate
- Just Cause 3
- Rainbow Six Siege
- DiRT Rally
- Far Cry Primal
- Tom Clancy’s The Division
- Mirror’s Edge Catalyst
- Deus Ex Mankind Divided
DX12 Games
- Ashes of the Singularity
- Hitman
- Rise of the Tomb Raider
- Total War: Warhammer
Nvidia Control Panel settings:
AMD Crimson Control Center Settings:
Calculating Percentages
There are two methods of calculating percentages. One is the “Percentage Difference” that we are using to compare the GTX 1060 3GB versus the Red Devil RX 470, and the other is “Percentage Change” which we use to show the improvements of an overclocked card versus stock performance.
For the percentage difference used in this comparison of the frame rates of the RX 470 versus the GTX 1060/3GB, we are simply dividing the difference between the two results by the average of the two numbers. This is usually expressed algebraically where “V” equals value: ( | V1 – V2 | / ((V1 + V2)/2) ) * 100
Let’s head to the performance charts to primarily see how the overclocked-to-the-max EVGA GTX 1060 3GB Gaming edition compares with the overclocked-to-the-max PowerColor Red Devil RX 470.
Performance summary charts
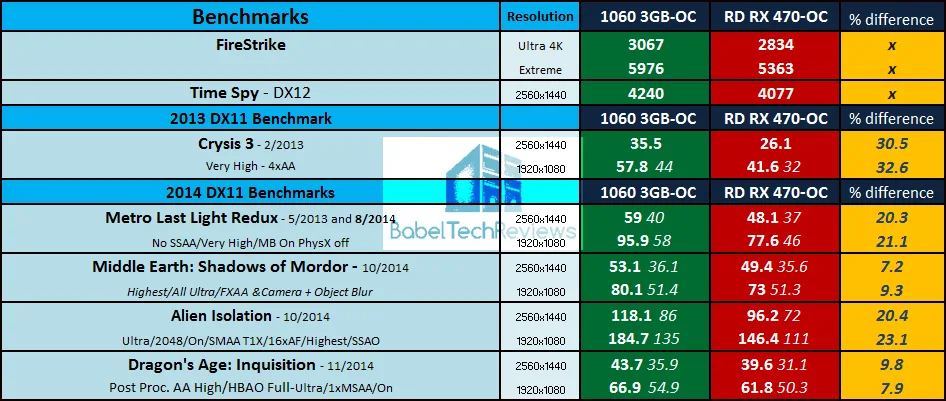
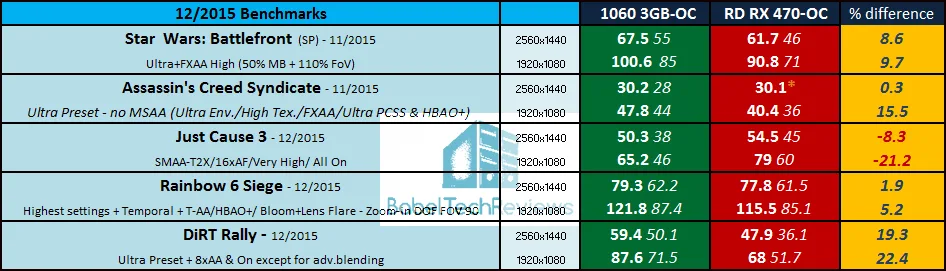
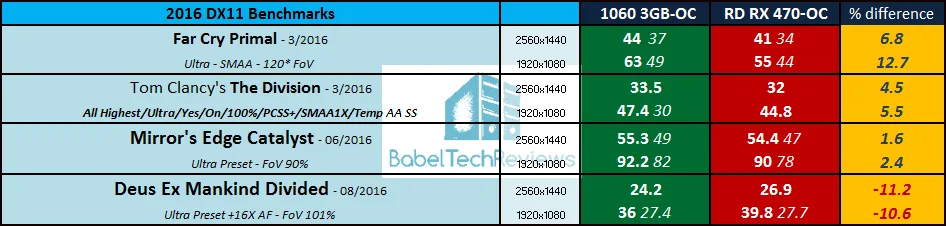
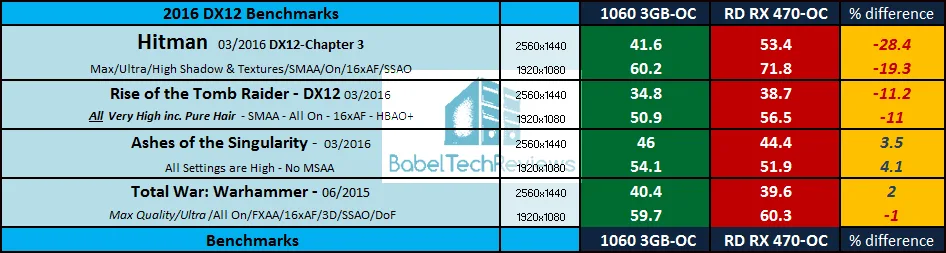
Below is the summary chart of 25 games and 2 synthetic tests. The highest settings are always chosen and it is usually DX11; DX12 is picked above DX11 where available. Specific settings are listed on the performance charts. The benches were run at 1920×1080 and at 2560×1440.
All results, except for FireStrike and Time Spy, show average frame rates and higher is always better. Minimum frame rates are shown when they are available and they make sense, next to the averages but they are in italics and in a slightly smaller font. The GTX 1060 overclocked results are in the first column, the overclocked Red Devil RX 470 results are in the second column, and third column shows the performance difference (RX 470 “wins” are denoted by a red “-” minus sign).
Our original charts comparing the reference EVGA GTX 1060/3GB with the GTX 1060/6GB and with the PowerColor-clocked Red Devil RX 470 are here. The $199 stock-clocked EVGA GTX 1060 3GB is overall faster than the $199 PowerColor Red Devil RX 470.
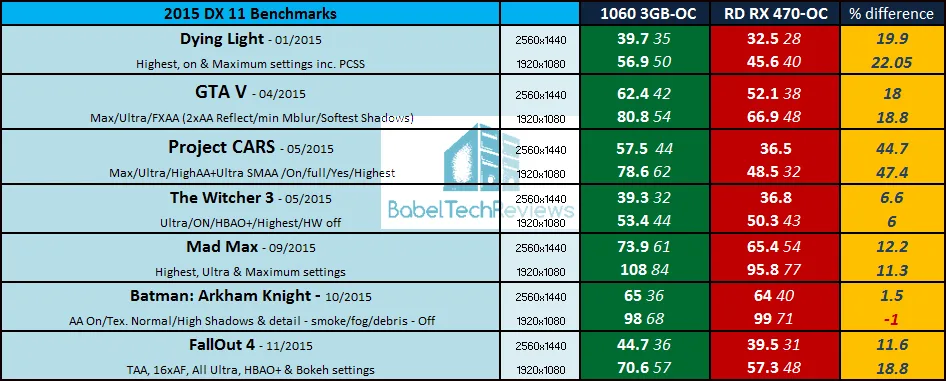
The superior overclocking abilities of the GTX 1060 allow it to win in more games and at a higher percentage of difference over the overclocked RX 470 than it did at stock. In 50 individual game benchmarks, the Red Devil RX 470 wins 14 benchmarks but when both cards are further overclocked, it only wins 10 benchmarks against the EVGA GTX 1060 3GB Gaming edition.
Let’s head to our conclusion.
Conclusion
This has been quite an interesting exploration for us in evaluating the overclocked $199 Red Devil RX 470 versus the overclocked $199 EVGA GTX 1060 3GB Gaming edition. The GTX 1060 3GB is a faster card at stock, and due to its superior headroom for overclocking, it pulls even further away from the overclocked Red Devil RX 470. The GTX 1060 3GB wins in 4 out of 5 of our individual game benchmarks against the RX 470.
Both cards appears to scale well with an overclock although the GTX 1060 overclocks further and uses less power. Turning the fans each to their highest settings, they do make more noise which is more like a “whoosh” of air. At 100% fan, the EVGA card gets a more intrusive whine but does not require anything more than an aggressive fan profile to remain cool even at maximum overclock.
 Based on our ongoing experiences with both cards, we continue to give a Good Value recommendation to the Red Devil RX 470 at $199 and a Great Value recommendation to the EVGA GTX 1060 3GB at the same price.
Next up, we will follow up on our PowerColor Red Devil RX 480 “unleashed” BIOS evaluation with an unleashed overclocking showdown versus the EVGA GTX 1060 SC 6GB on Tuesday. Stay tuned.
Happy Gaming!
Comments are closed.