The $1199 RTX 4080 Founders Edition Performance of 50+ Games, VR, Pro Apps, & More
Although the $1199 RTX 4080 Founders Edition has been out for nearly a month, a lingering bad case of COVID-19 caused BTR’s Part 1 VR review to be a week late and we were then unable to conclude if the card is a good value. This Part 2 RTX 4080 review concludes BTR’s 53 game performance analysis versus the RTX 3080 and 3080 Ti, the RTX 4090, and the RX 6900 XT. Although the RTX 4080 is not a workstation card, we have also summarized VR, workstation SPEC benches and selected popular creative and synthetic apps.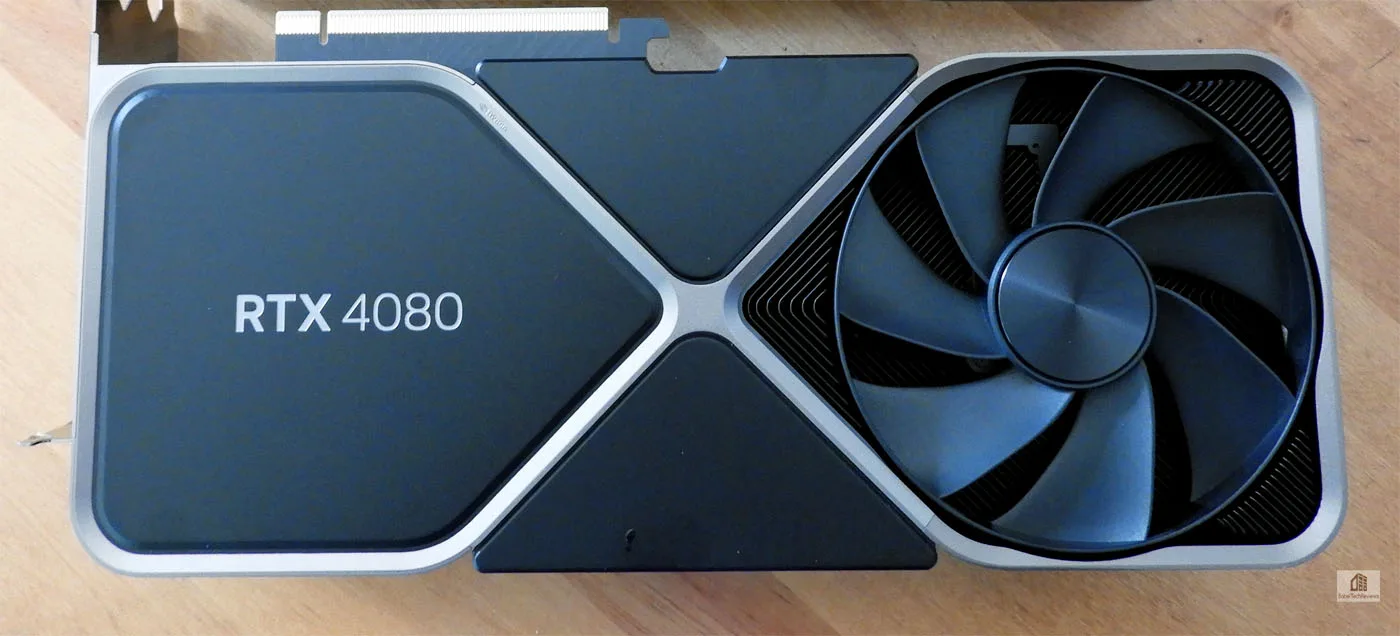
It may be that the RTX 4080 Founders Edition at $1199 delivers a good value as an upgrade from the last generation Ampere RTX 3080 Ti which also launched at $1199 but a $400 launch price increase over the $799 RTX 3080 may be very difficult to accept. We benchmark using FCAT VR and Windows 11 Pro Edition 2H22 with Intel’s Core i9-13900KF, and 32GB of T-FORCE DELTA RGB 6400MHz CL40 DDR5 2x16GB memory on an ASUS Prime-A Wi-Fi Z790 motherboard. All games and benchmarks are patched to their latest versions, and we use recent drivers.
Let’s check out our test configuration.
Test Configuration
Test Configuration – Hardware
- Intel Core i9-13900KF (HyperThreading and Turbo boost at stock settings)
- ASUS Prime-A Z790 LGA1700 motherboard (Intel Z790 chipset, latest BIOS, PCIe 5.0, DDR5)
- T-Force Delta RGB PC5-51200 6400MHz DDR5 CL40 2x16GB kit, supplied by TeamGroup
- Valve Index, 90Hz / 100% SteamVR Render Resolution
- RTX 4080 16GB Founders Edition, stock clocks, supplied by Nvidia
- Gigabyte RX 6900 XT GAMING OC, GV-R69XTGAMING OC-16GD 16GB, factory clocks
- AMD reference RX 6800 XT 16GB, stock clocks, supplied by AMD
- RTX 3090 24GB Founders Edition, factory clocks, supplied by Nvidia
- RTX 4090 24GB Founders Edition, stock clocks, supplied by Nvidia
- 2 x T-Force Cardea Ceramic C440; 2TB PCIe Gen 4 x4 NVMe SSDs (5,000/4,400MB/s – one for AMD/one for Nvidia)
- T-Force M200 4TB USB 3.2 Gen2x2 Type-C external SSD (2,000/2000MB/s – supplied by TeamGroup
- Super Flower LedEx, 1200W Platinum 80+ power supply unit
- MSI MAG Series CORELIQUID 360R (AIO) 360mm liquid CPU cooler
- Corsair 5000D ATX mid-tower (plus 1 x 140mm fan & 2 x 120mm Noctua fans)
- BenQ EW3270U 32? 4K HDR 60Hz
- LG C1 48? 4K OLED HDR 120Hz display
Test Configuration – Software
- GeForce 526.98 drivers for RTX 4080/4090 and 527.37 for RTX 3080/3080 Ti, and Adrenalin 22.11.1 for the RX 6900 XT.
- High Quality, prefer maximum performance, single display, set in the Nvidia control panel.
- High Quality textures, all optimizations off in the Adrenalin control panel
- VSync is off in the control panel and disabled for each game
- AA enabled as noted in games; all in-game settings are Ultra Preset or highest with 16xAF always applied – no upscaling is used except for the nine DLSS games tested using the Quality preset.
- Highest quality sound (stereo) used in all games
- All games have been patched to their latest versions
- VR charts use frametimes in ms where lower is better, but we also compare “unconstrained framerates” which shows what a video card could deliver (headroom; higher is better)
- Windows 11 Pro edition; 22H2 clean install for GeForce and Radeon cards using separate identical NVMe SSDs.
- Latest DirectX
- SteamVR latest beta
Games
Vulkan
- Sniper Elite
- DOOM Eternal
- Red Dead Redemption 2
- Wolfenstein Youngblood
- World War Z
- Strange Brigade
- Rainbow Six: Siege
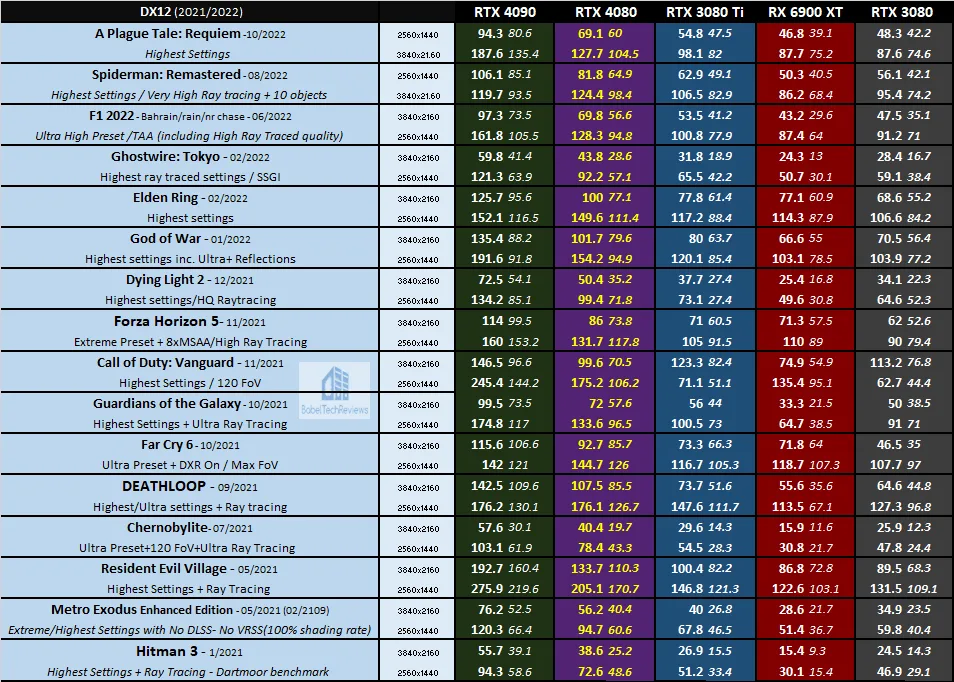
DX12
- A Plague Tale: Requiem
- Spiderman: Remastered
- F1 2022
- Ghostwire: Tokyo
- Elden Ring
- God of War
- Dying Light 2
- Forza Horizon 5
- Call of Duty: Vanguard
- Marvel’s Guardians of the Galaxy
- Far Cry 6
- DEATHLOOP
- Chernobylite
- Resident Evil Village
- Metro Exodus Enhanced Edition
- Hitman 3
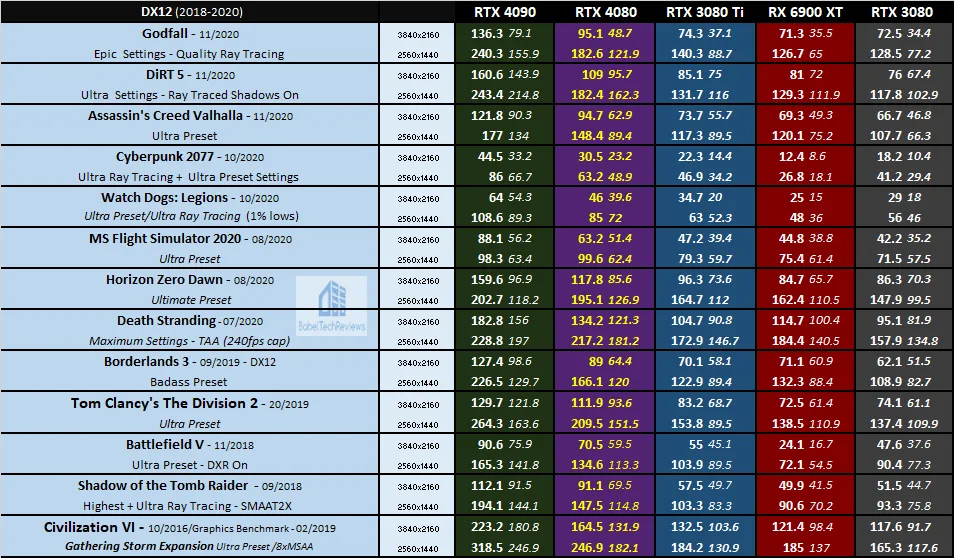
- Godfall
- DiRT 5
- Assassin’s Creed Valhalla
- Cyberpunk 2077
- Watch Dogs: Legions
- Horizon Zero Dawn
- Death Stranding
- Borderlands 3
- Tom Clancy’s The Division 2
- Civilization VI – Gathering Storm Expansion
- Battlefield V
- Shadow of the Tomb Raider
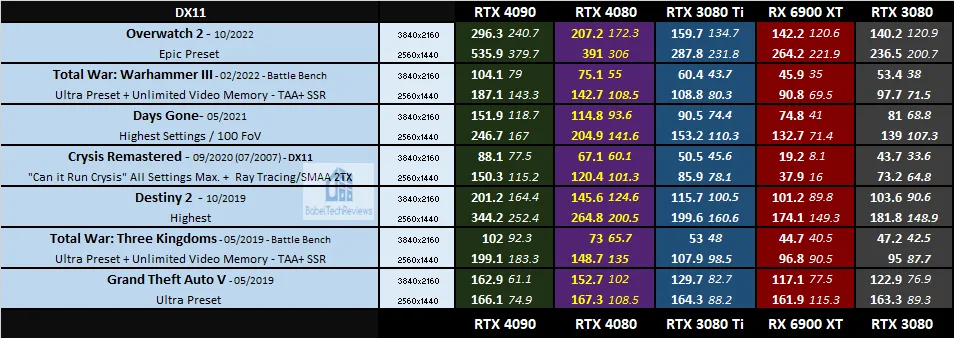
DX11
- Overwatch 2
- Total War: Warhammer III
- Days Gone
- Crysis Remastered
- Destiny 2 Shadowkeep
- Total War: Three Kingdoms
- Grand Theft Auto V
VR Games
- Assetto Corsa: Competizione
- Elite Dangerous
- F1 2022
- Kayak Mirage
- Moss: Book II
- No Man’s Sky
- Project CARS 2
- Skyrim
- Sniper Elite
- The Walking Dead: Saints & Sinners
Synthetic
- Time Spy & Time Spy Extreme (DX12)
- 3DMark FireStrike – Ultra & Extreme
- Superposition
- VRMark Blue Room
- AIDA64 GPGPU benchmarks
- Blender 3.3.0 benchmark
- Geekbench
- Sandra 2020 GPGPU Benchmarks
- SPECworkstation3
- SPECviewperfect 2020
- Octanebench
- FCAT VR benching tool
- OpenVR Benchmark tool
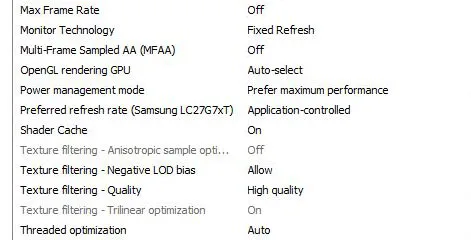
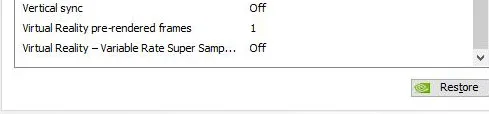
NVIDIA Control Panel settings
Here are the NVIDIA Control Panel settings.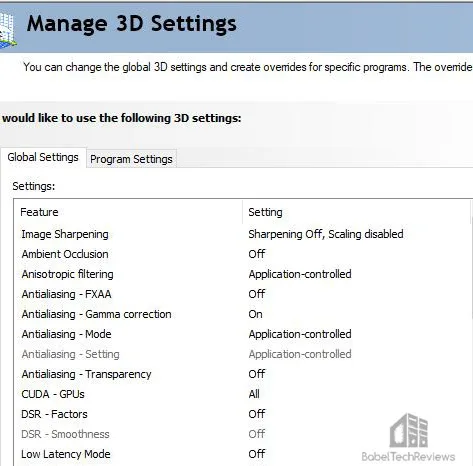
 Let’s check out performance using 41 pancake and 5 VR games plus Workstation and creative benches on the next page.
Performance summary charts & graphs
Main Performance Gaming Summary Charts
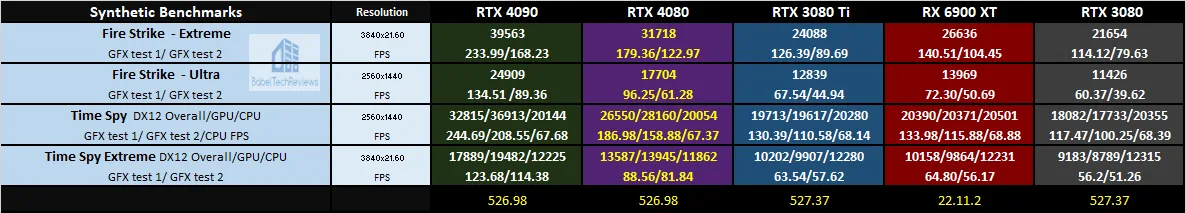
Here are the summary charts of 43 games and 4 synthetic tests. The highest settings are always chosen, ray tracing is enabled for all games that offer it, and the settings are listed on the chart. The benches were run at 2560×1440 and at 3840×2160.
Five cards are compared and they are listed in order starting with the RTX 4090, the RTX 4080 (yellow text), the RTX 3080 Ti, the RX 6900 XT, and the RTX 3080. All results, except for synthetic scores, show average framerates, and higher is better. Minimum framerates are next to the averages in italics and in a slightly smaller font. Minimum framerates are expressed by the 99th-percentile (1% lows) and higher is better.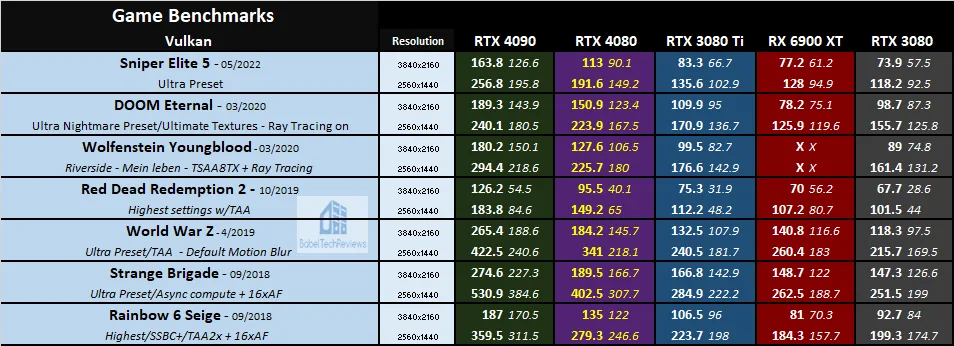
Here are the synthetic benchmark results.
Jon Peddie ran some interesting data averaging the total framerates of all games tested represented by the following chart:
![]()
The RTX 4090 ($1599) offers a very substantial improvement over the RTX 3080 Ti’s ($1199) baseline performance while the RTX 4080 ($1199) delivers a far less impressive step up over the RTX 3080 ($699) considering their respective launch prices.
All of the games that we tested ran well with the RTX 4080 coming in second only to the RTX 4090. This is achieved with no upscaling whatsoever!
Although the RTX 4090 is the first single-GPU card that is truly suitable for 4K/60+ FPS using ultra/maxed-out ray traced settings for most modern demanding games without any upscaling, there will have to be some compromises made for the RTX 4080.
Next we look at nine RTX/DLSS enabled games, each using maximum ray traced settings and the highest Quality DLSS.
RTX/DLSS Benchmarks
The RTX 4080 FE maintains its performance dominance over the RTX 3080 and pulls even further away when Quality DLSS is enabled.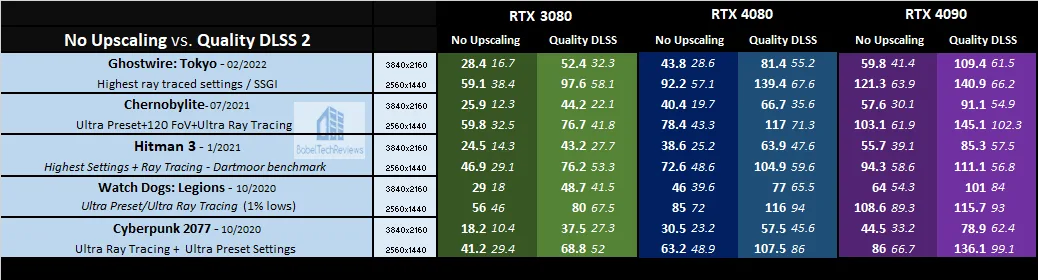
Using Quality DLSS, we can see that the RTX 4090 will take advantage of an LG C1 4K/120Hz panel using the most demanding ray traced modern games although the RTX 4080 will not do so. From testing DLSS 2 exhaustively, we note that the Quality setting at 4K is visually equal to or better than the native image.
We only had a short time to check out DLSS 3 performance which upscales far better than DLSS 2 and looks just as good. We believe that DLSS 3 will prove especially advantageous for the less powerful than RTX 4090 upcoming Ada Lovelace cards including the RTX 4080.
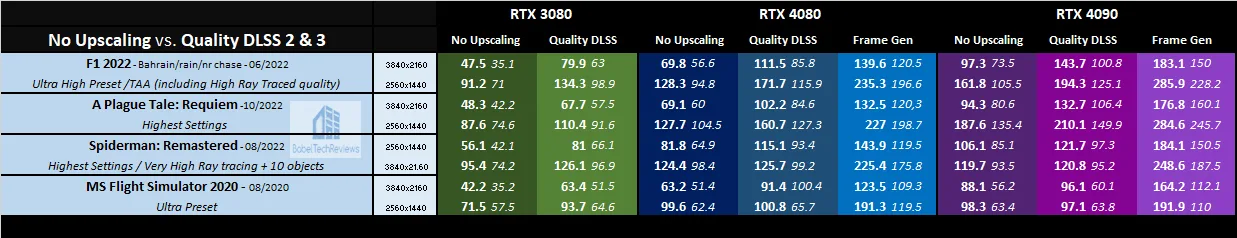 Frame Generation is only available on RTX 4000 series cards. The image quality is outstanding and there are only some minor artifacts visible in certain situations.
Next, we look at VR performance.
VR Games
For this review we benchmarked the Valve Index and set the SteamVR render resolution to 100%. For the full VR review, including all of the charts, see Part 1. BTR’s VR charts use frametimes in ms where lower is better, but we also compare “unconstrained framerates” which shows what a video card could deliver (headroom) if it wasn’t locked to either 90 FPS or to 45 FPS by the HMD. In the case of unconstrained FPS, we measure just one important performance metric where faster is better.
Unconstrained Framerates & Synthetic VR Benchmarks
The following chart summarizes the overall Unconstrained Framerates (the performance headroom) of our two cards using our 10 VR test games. The preset is listed on the chart and higher is better. In addition, we present three synthetic VR benchmarks.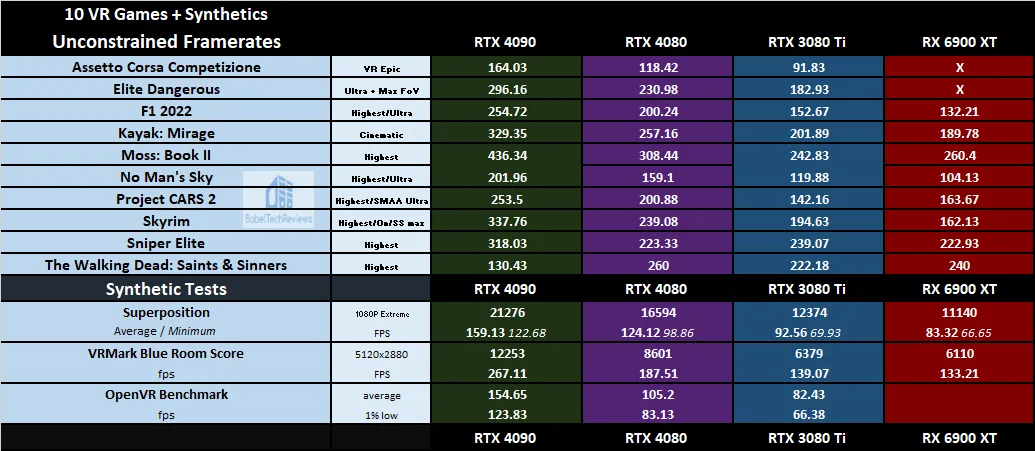
The RX 4080 FE averages close to one-third higher unconstrained frames for many VR benchmarks and sits in between the RTX 3080 Ti and the RTX 4090 FE in this important performance metric. However, unconstrained framerates are just one metric that has to be taken together with the frametime plots to have real meaning.
It is clear that the RTX 4090 and the RTX 4080 are ready for higher resolution headsets than the Valve Index. In many cases, either card may be able to use the higher refresh rates of 120Hz/144Hz for fast-paced and/or sim racing games.
Creative, Pro & Workstation Apps
Let’s look at Creative applications next to see if the RTX 4080 is a good upgrade from the RTX 3080 Ti or RX 6900 XT. We test starting with Geekbench. Please note that we have added RTX 3080 benchmarks that were not present in Part 1.
GeekBench
GeekBench is an excellent CPU/GPU benchmarking program which runs a series of tests and times how long a GPU (in this case) takes to complete its tasks. It benchmarks OpenCL, Vulkan, and CUDA performance
OpenCL, Vulkan, and CUDA Performance
The RTX 4080 OpenCL, Vulkan, and CUDA performance are charted below.the summary charts below show the overall comparative performance scores.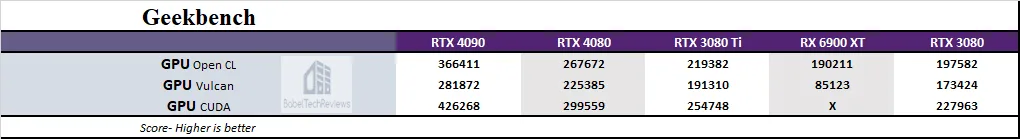
The RTX 4080 performance is outstanding second only to the RTX 4090.
Next up, Blender benchmark.
Blender 3.3.0 Benchmark
Blender is a very popular open source 3D content creation suite. It supports every aspect of 3D development with a complete range of tools for professional 3D creation.
For the following chart, higher is better as the benchmark renders a scene multiple times and gives the results in samples per minute.
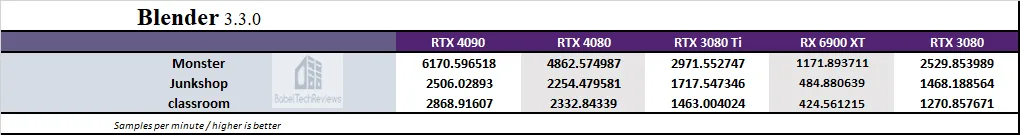
Blender’s benchmark performance is highest using the RTX 4090, and often the amount of time saved is substantial over using the next fastest card, the RTX 4080.
Next, we look at the OctaneBench.
OTOY Octane Bench
OctaneBench allows you to benchmark your GPU using OctaneRender. The hardware and software requirements to run OctaneBench are the same as for OctaneRender Standalone.
We run OctaneBenc 2020.1.5 for Windows and here are the RTX 4080’s complete results and overall score of 946.30
Here is the summary comparing the four test cards that can run this render benchmark.
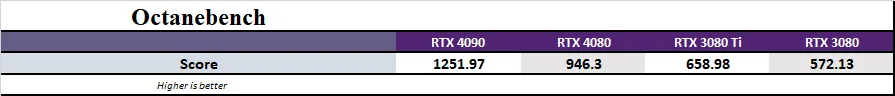
The RTX 4090 is a beast of a card when used for rendering and the RTX 4080 sits in between, above the RTX 3080 Ti.
Next, we move on to AIDA64 GPGPU benchmarks.
AIDA64
AIDA64 is an important industry tool for benchmarkers. Its GPGPU benchmarks measure performance and give scores to compare against other popular video cards.
AIDA64’s benchmark code methods are written in Assembly language, and they are well-optimized for every popular AMD, Intel, NVIDIA and VIA processor by utilizing the appropriate instruction set extensions. We use the Engineer’s full version of AIDA64 courtesy of FinalWire. AIDA64 is free to to try and use for 30 days.
Here is the chart summary of the AIDA64 GPGPU benchmarks with the RTX 4090, the RTX 4080, the RTX 3080 Ti, and the RX 6900 XT side-by-side.
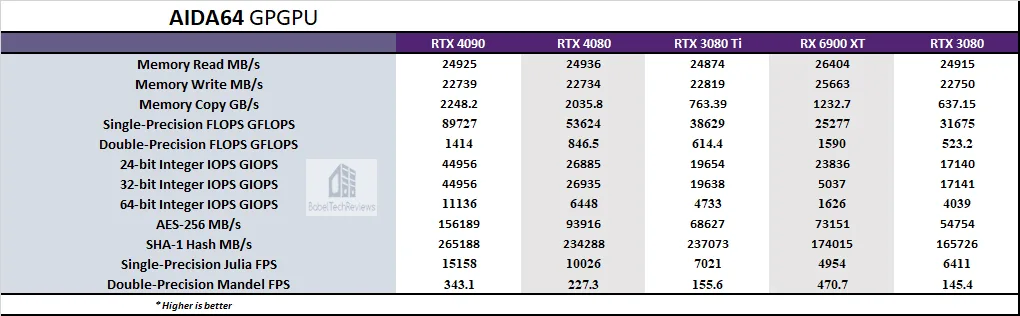
Generally the RTX 4090 is faster at almost all of AIDA64’s GPGPU benchmarks than the other cards with the RTX 4080 in second place. So let’s look at Sandra 2020 next.
SiSoft Sandra 2020
To see where the CPU, GPU, and motherboard performance results differ, there is no better tool than SiSoft’s Sandra 2020. SiSoftware SANDRA (the System ANalyser, Diagnostic and Reporting Assistant) is a excellent information & diagnostic utility in a complete package. It is able to provide all the information about your hardware, software, and other devices for diagnosis and for benchmarking. Sandra is derived from a Greek name that implies “defender” or “helper”.
There are several versions of Sandra, including a free version of Sandra Lite that anyone can download and use. 20/21-R16a is the latest version, and we are using the full engineer suite courtesy of SiSoft. Sandra 2020 features continuous multiple monthly incremental improvements over earlier versions of Sandra. It will benchmark and analyze all of the important PC subsystems and even rank your PC while giving recommendations for improvement.
With the above in mind, we ran Sandra’s intensive GPGPU benchmarks and charted the results summarizing them. The performance results of the RTX 4080 and RTX 4090 are compared with the performance results of the RTX 3080 Ti, and the RX 6900 XT.
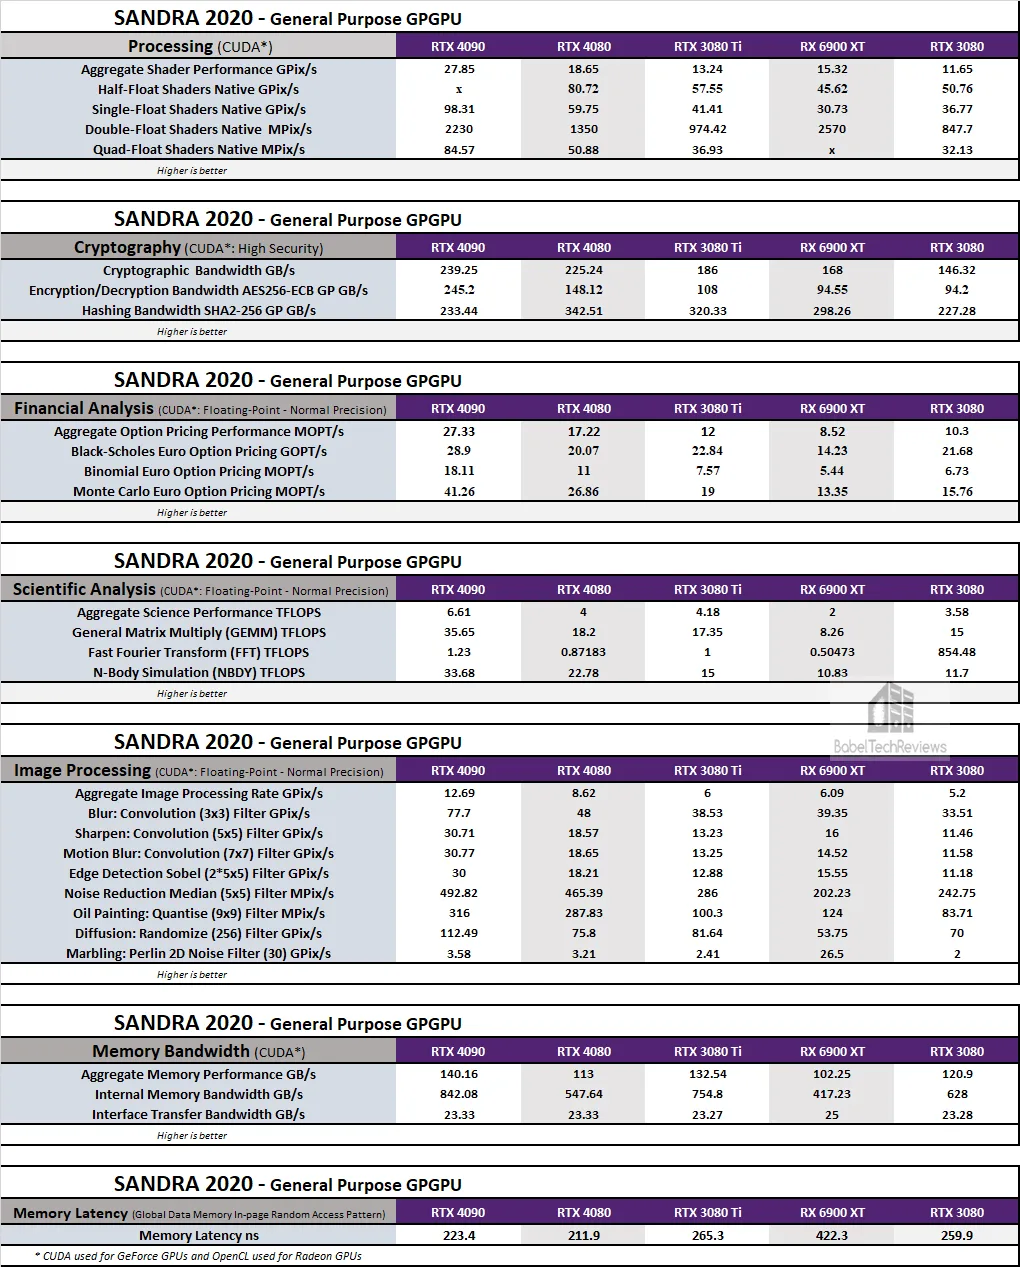
Second only to the RTX 4090, the RTX 4080 is faster than the RTX 3080 Ti and it distinguishes itself in every area – Processing, Cryptography, Financial and Scientific Analysis, Image Processing, and Bandwidth.
Next up, SPEC benchmarks beginning with SPECviewperfect GPU benches.
SPECviewperf 2020 GPU Benches
The SPEC Graphics Performance Characterization Group (SPECgpc) has released a 2020-22 version of its SPECviewperf benchmark that features updated viewsets, new models, support for up to 4K display resolutions, and improved set-up and results management. We use the highest available 3800×2120 display resolution for high end cards.
Here are SPECviewperf 2020 GPU RTX 4080 benchmarks summarized in a chart together with our four competing cards.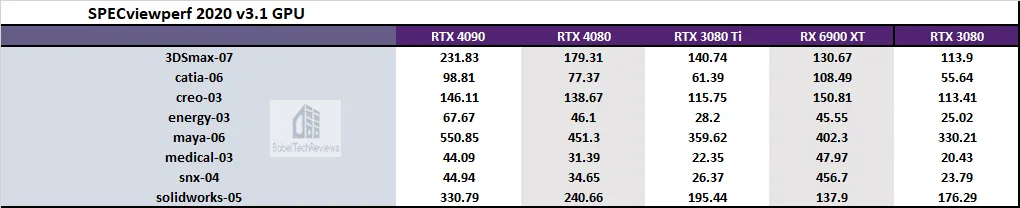
Although we see three architectures with different strengths and weaknesses, the RTX 4090 is a beast in SPEC benchmarks followed by the RTX 4080 in a solid second place.
SPECworkstation3.1 Benchmarks
All the SPECworkstation 3 benchmarks are based on professional applications, most of which are in the CAD/CAM or media and entertainment fields. All of these benchmarks are free except for vendors of computer-related products and/or services.
The most comprehensive workstation benchmark is SPECworkstation 3. It’s a free-standing benchmark which does not require ancillary software. It measures GPU, CPU, storage and all other major aspects of workstation performance based on actual applications and representative workloads. We only tested the GPU-related workstation performance as checked in the image above.
Below are the SPECworkstation 3.1 RTX 4080 results summarized in a chart. Higher is better since we are comparing scores.
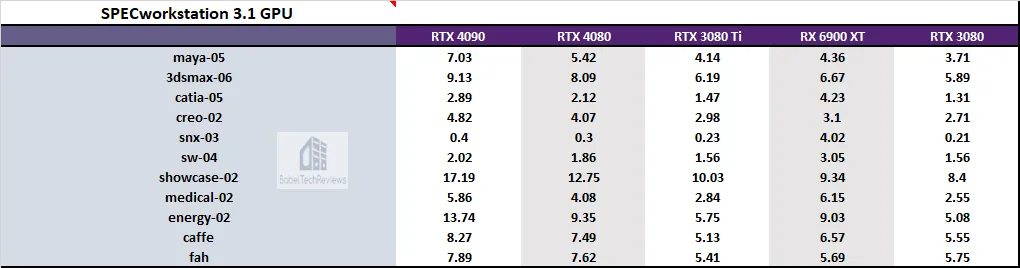
We see similar results to Viewperf2020.
Let’s head to our conclusion.
Final Thoughts
This has been an enjoyable exploration comparing the new Ada Lovelace RTX 4080 and 4090 FEs with the RTX 3080 and 3080 Ti FEs and Gigabyte RTX 6900 XT Gaming OC. The RTX 4080 performed solidly performance-wise below the RTX 4090 and well above the other cards. The RTX 4090 at $1599 is the upgrade from the $1199 RTX 3080 Ti since the RTX 4090 gives at least a 170% (1.7X) improvement over its baseline performance. If a gaming enthusiast wants the very fastest card then the RTX 4090 is the only choice for intensive gaming and high resolution VR headsets.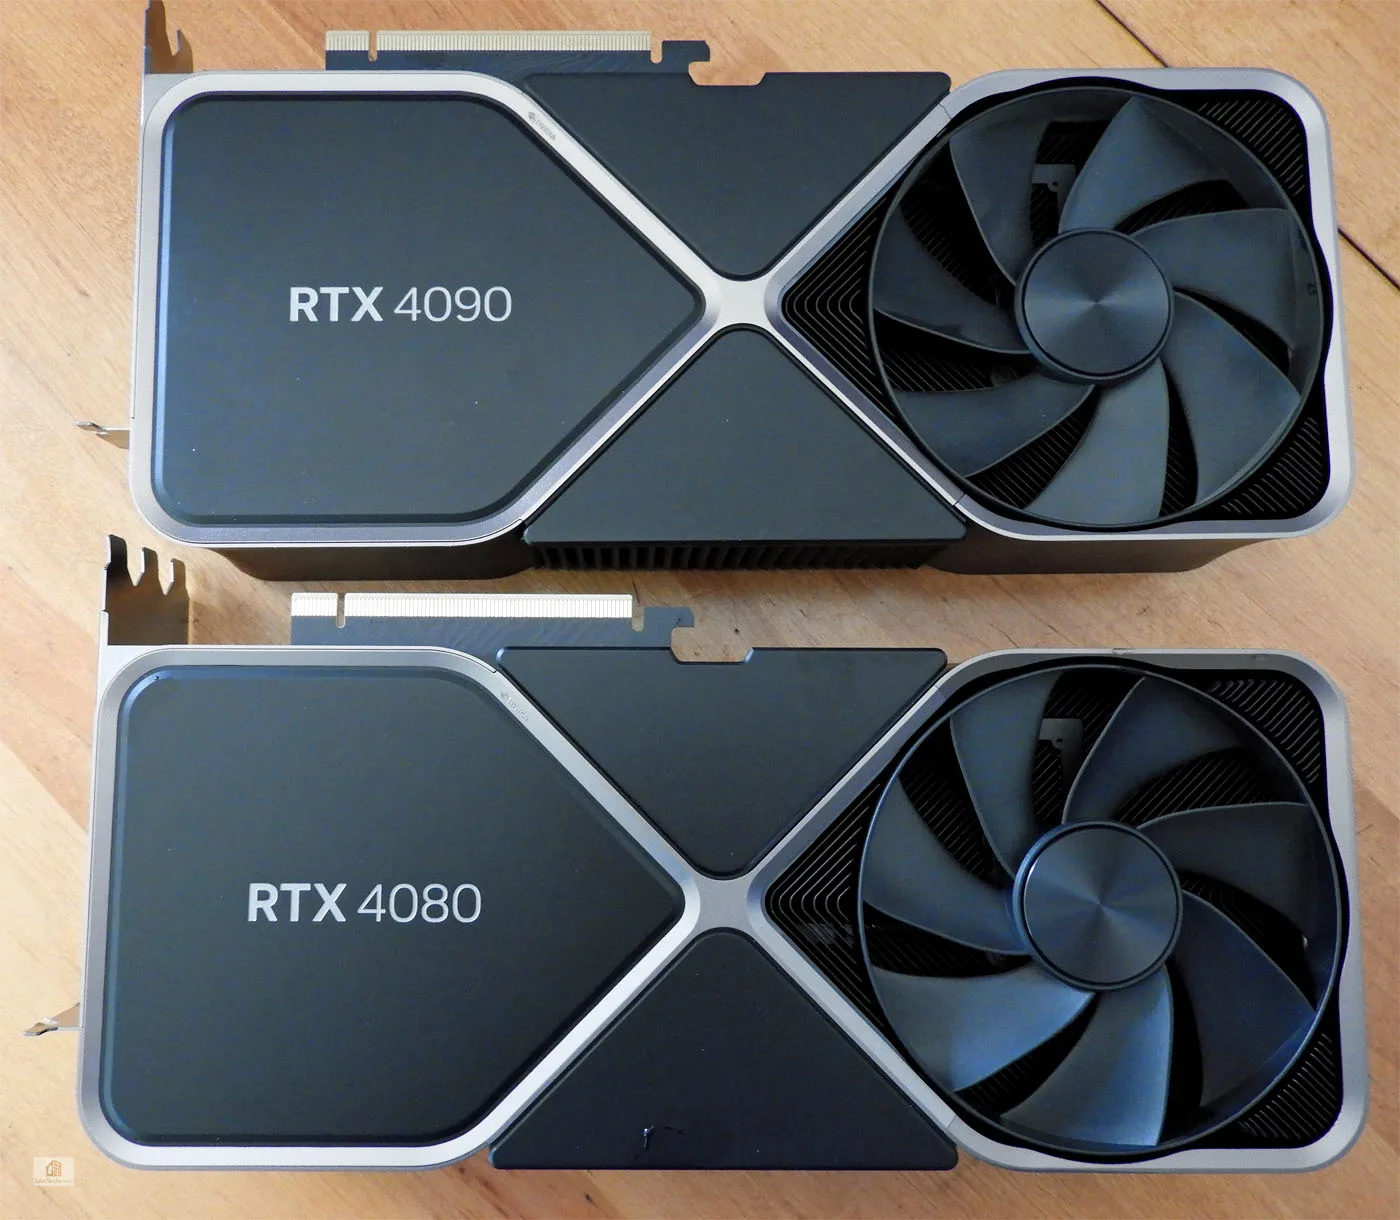
The situation is not as clear with the RTX 4080 FE. It is a very fast card and the second fastest in the world although it rather trails the 4090 performance and leaves a lot of room for a future 4080 Ti. It’s expensively overbuilt compared to the RTX 4090 FE as it simply doesn’t require such a massive chassis. It’s performance at $1200 compared to the $699 RTX 3080 does not justify its price nearly as well as the $1599 RTX 4090 which dominates over the formerly $1200 RTX 3080 Ti. We think Jon Peddie’s total framerate comparison aggregated averages of our 43 games give a good picture of overall performance to value.
![]()
We cannot call the RTX 4080 a good value for gamers as it is a halo card that underperforms at $1200 compared with the $1599 RTX 4090. We think Nvidia was over optimistic in pricing the RTX 4080 as high as they did. Of course, it’s easier to lower prices than to raise them after launch, and we may see bundles and price softening after AMD’s new 7900 Radeons release depending on how they perform.
We think that DLSS 3 brings a great future value to the new 4000 series as it has already received support from many of the world’s leading game developers, with more than 35 games and applications announcing support including game engines, including Unity, Unreal, and Frostbite Engine. If a game already uses DLSS 2 Super Resolution, upgrading to DLSS 3 is a relatively simple process that will make both Super Resolution and Frame Generation available.
Stay tuned, there is a lot more on the way from BTR coming this week including another mega-card review featuring VR.
Happy Gaming!