Windows 11 Performance Analysis (Windows 11 21H2 vs. Windows 10 21H1) – 23 games benchmarked using a Radeon RX 6700 XT and GeForce RTX 3080
The Windows 11 OS upgrade (version 21H2, build 22000) started to become publicly available a month ago, and this performance analysis will showcase gaming using both the reference AMD Radeon RX 6700 XT and the Gigabyte AORUS GeForce RTX 3080 MASTER.
Our testing platform is a recent install of Windows 11 and Windows 10 64-bit Pro Edition, an i9-9900K with stock clocks, a Gigabyte Z390 AORUS PRO motherboard, and 32GB of T-FORCE XTREEM ARGB WHITE DDR4 3200MHz paired with our RX 6700 XT, and 32GB of Kingston DDR4 3333MHz paired with our RTX 3080. The games tested, settings, hardware, and Adrenalin and GeForce drivers are identical except for the Windows OS builds we compare.
Before offering the performance data and charts of each different analysis scenario, it’s important to describe both the hardware and software configurations used in our testing as well as the analysis methodology.
Benching Methodology
Test Configuration – Hardware
- Intel Core i9-9900K (Hyper-Threading/Turbo boost on; stock settings)
- Gigabyte Z390 AORUS PRO motherboard (Intel Z390 chipset, v.F12l BIOS)
- T-FORCE XTREEM ARGB WHITE 32GB DDR4 (2×16GB, dual-channel at 3200 MHz CL14), supplied by TeamGroup
- Kingston HyperX Predator 32GB DDR4 (2×16GB, dual-channel at 3333 MHz CL16)
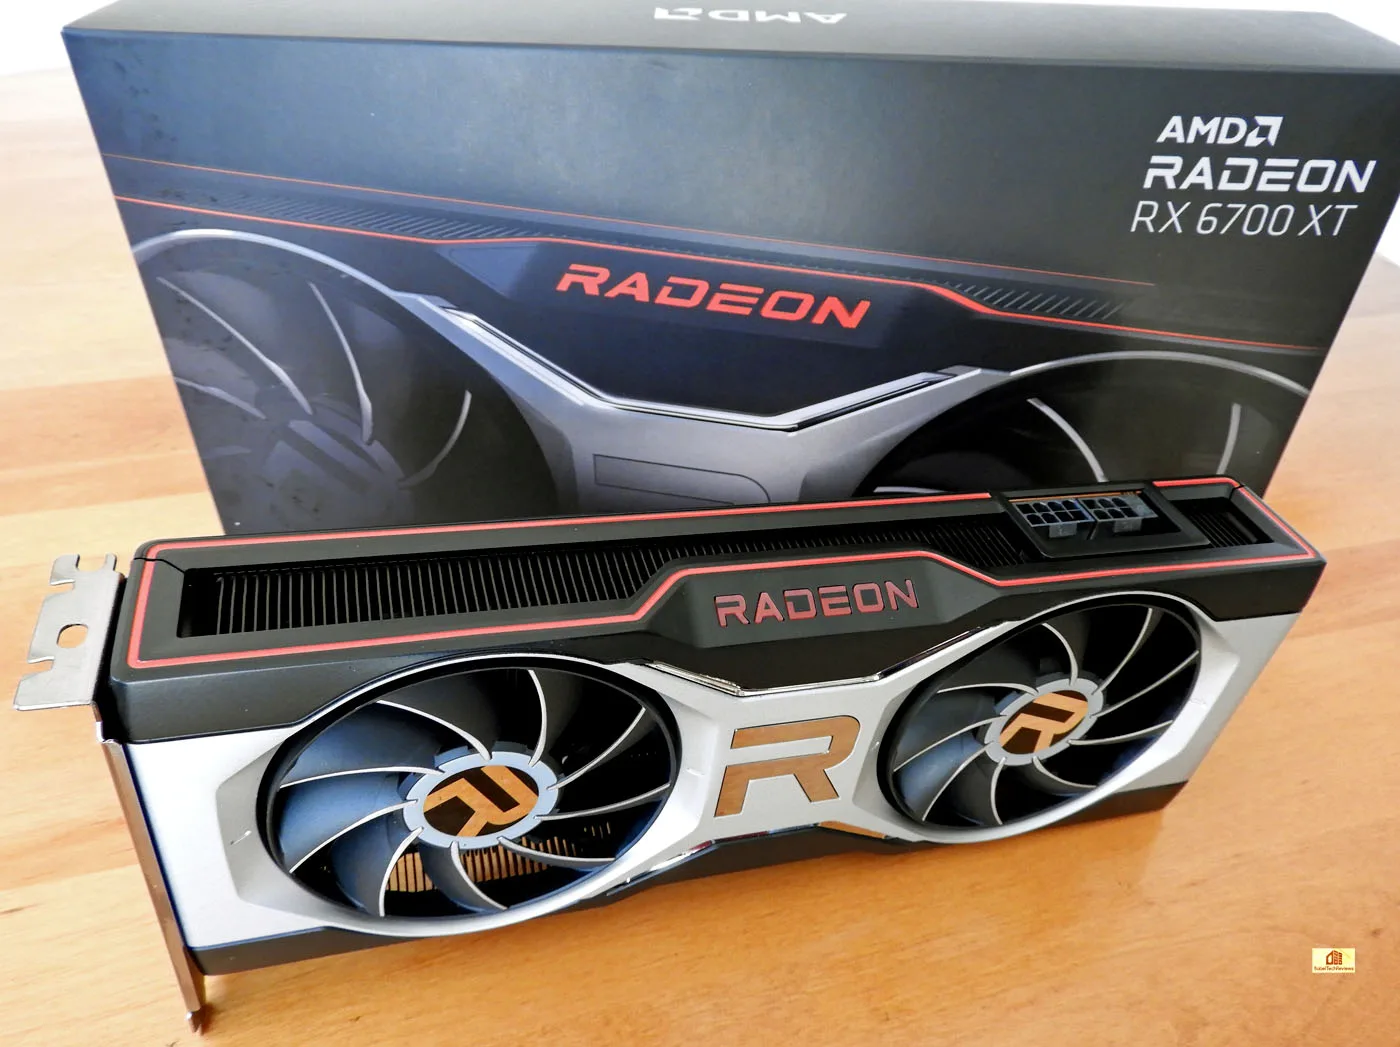
- AMD Radeon RX 6700 XT (Reference) 12GB, stock clocks, on loan from AMD
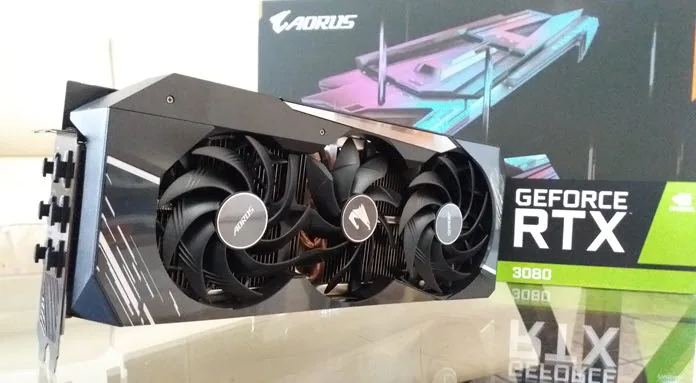
- Gigabyte AORUS GeForce RTX 3080 MASTER 10GB (rev. 1.0); v.F4 VBIOS, stock clocks
- Samsung 500GB SSD 960 EVO NVMe M.2
- WD Blue 1TB SATA SSD
- Corsair RM750x, 750W 80PLUS Gold power supply unit
- ASUS TUF Gaming VG289Q 28? IPS UltraHD (3840×2160) 60Hz 5ms FreeSync Monitor (Fixed Refresh Rate On) when testing games at 2160p resolution.
- ASUS ROG Swift PG279Q 27? IPS QuadHD (2560 x 1440) 165Hz 4ms G-Sync Monitor (Fixed Refresh Rate On) when testing games at 1440p or 1080p resolution.
Test Configuration – Software
- Radeon Software Adrenalin 21.11.1 beta drivers; Radeon features ‘Disabled’, texture filtering quality set to ‘High’, and tesselation mode set to ‘Use application settings’; AMD FreeSync ‘Disabled’ (when applicable).
- NVIDIA GeForce 496.49 WHQL drivers; ‘High Quality’ and ‘prefer maximum performance’ (on a per-game profile-basis); Shader Cache Size ‘Unlimited’ (globally); fixed refresh rate (globally).
- Resizable BAR off.
- V-Sync ‘off, unless application specifies’ in the Software Adrenalin control center; and off in-game.
- V-Sync application controlled in the NVIDIA control panel, and disabled in-game.
- AA and AF as noted in games; all in-game settings are specified.
- Windows 10 64-bit Pro edition, latest updates v21H1, and Windows 11 64-bit Pro edition, latest updates v21H2; High-performance power plan, HAGS off, Game Mode, Game DVR & Game Bar features off, and Control Flow Guard (CFG) off on a per-game basis.
- GIGABYTE and ASUS tools not installed.
- Latest DirectX
- All 23 games are patched to their latest versions at the time of publication.
- 3DMark’s suite and UNIGINE Superposition benchmark, the latest version
- Basemark GPU benchmark, v.1.1
- UNIGINE Superposition, v.1.1
- CapFrameX (CX), the latest version
- RivaTuner Statistics Server (RTSS), the latest version
- Display Driver Uninstaller (DDU), the latest version; always uninstall the display driver using DDU in safe mode, clean, and restart.
-
ISLC (Purge Standby List) before each benchmark.
Radeon Software Adrenalin Suite-related
- The minimal Radeon Adrenalin Software installation is used.
- We install the display driver.
- We enable the ‘Issue detection’ setting.
GeForce Driver Suite-related
- We use DCH Game Ready drivers.
- The display driver is installed.
- We install the latest version of PhysX.
- Ansel is disabled.
Hybrid & Non-Synthetic Tests-related
- Single run per test.
Game Benchmarks-related
- We use the corresponding built-in or custom benchmark sequence.
Frametimes Capture & Analysis tool-related
- CapFrameX is used for capturing and analyzing the relevant performance numbers obtained from each recorded built-in or custom benchmark sequence.
- Consecutive runs until detecting 3 valid runs (no outliers) that can be aggregated by CapFrameX using the following method:
- ‘Aggregate excluding outliers’:
- Outlier metric: Third, P0.2 (0.2% FPS percentile).
- Outlier percentage: 3% (the % the FPS of an entry can differ from the median of all entries before counting as an outlier).
- ‘Aggregate excluding outliers’:
- We compare and value the results and aggregated records in terms of percentages of gain/loss, by setting the following thresholds to consider a certain % value as significant (not within the margin of error) for our benchmarking purposes:
- Score/FPS Avg > 3% when valuing hybrid and non-synthetic benchmarks;
- FPS Avg > 3% when evaluating raw performance;
- P1/P0.2 > 3% when evaluating frame time consistency; after applying our custom formula
{[(LowPercentileFPS_2 / AvgFPS_2) / (LowPercentileFPS_1 / AvgFPS_1)] – 1} x 100
Benchmark Suite: 23 PC Games, 4 Hybrid & 4 Non-Synthetic Tests
Hybrid Tests (3DMark)
- DirectX Raytracing feature test
- Fire Strike Ultra
- Port Royal
- Time Spy Extreme
Non-Synthetic Tests
- Basemark GPU
- Boundary: Raytracing Benchmark
- Neon Noir (Benchmark)
- UNIGINE Superposition
DX11 Games
- Borderlands 3 (DX11)
- Chernobylite (DX11)
- Days Gone (DX11)
- Deus Ex: Mankind Divided (DX11)
- Far Cry New Dawn (DX11)
- Neon Noir (DX11; Loop Mode)
- Tom Clancy’s Ghost Ghost Recon Breakpoint (DX11)
- Tom Clancy’s The Division 2 (DX11) – with Radeon
DX12 Games
- Borderlands 3 (DX12)
- Cyberpunk 2077 (DX12)
- DIRT 5 (DX12)
- F1 2021 (DX12)
- Far Cry 6 (DX12)
- Horizon Zero Dawn (DX12)
- LEGO® Builder’s Journey (DX12)
- Metro Exodus (DX12)
- Metro Exodus PC Enhanced Edition (DX12)
- Myst (2021, DX12)
- Shadow of the Tomb Raider (DX12)
- Tom Clancy’s The Division 2 (DX12) – with GeForce
- Watch Dogs: Legion (DX12)
Vulkan Games
- DOOM Eternal (VK)
- Quake 2 RTX (VK; v.1.5.0)
- Strange Brigade (VK)
- Tom Clancy’s Ghost Recon Breakpoint (VK)
- Wolfenstein Youngblood (VK)
Software Adrenalin Control Center Settings
Here are the global Adrenalin Control Center settings:
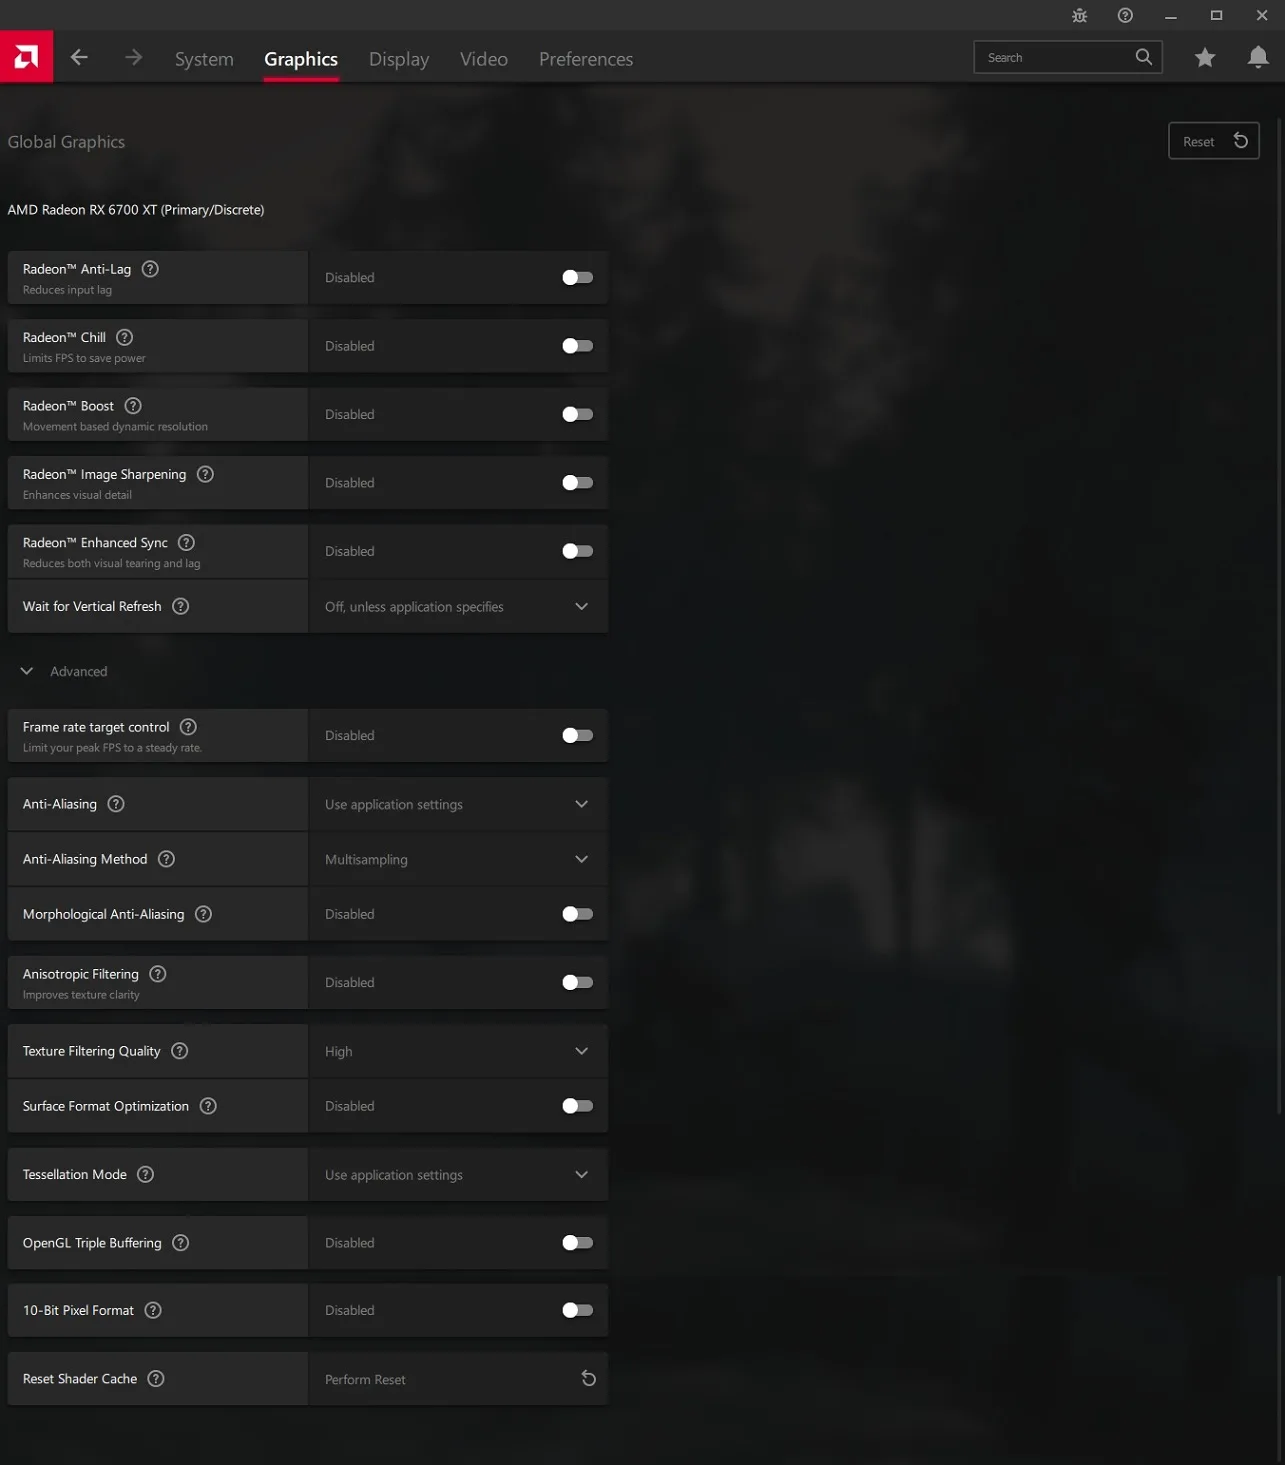
All AMD Radeon Software Adrenalin settings are set so that all optimizations are off, Texture filtering is set to ‘High’, and Tessellation uses application settings.
NVIDIA Control Panel settings
Here are the global NVIDIA Control Panel settings:
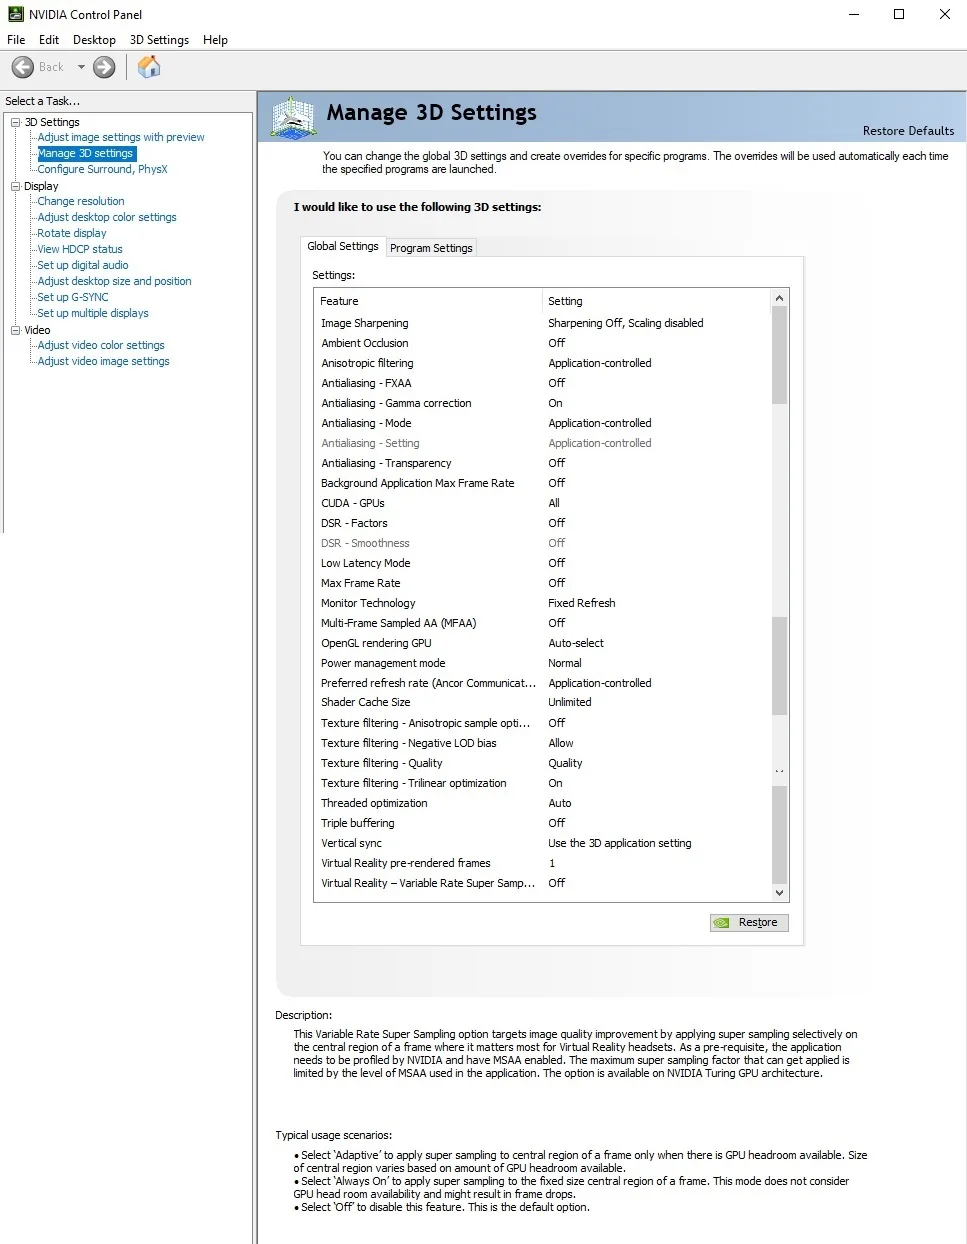
Both ‘High-Quality’ values for texture filtering-quality setting and ‘Prefer maximum performance’ for power management mode are set on a per-game or program profile-basis via Manage 3D Settings > Program settings tab.
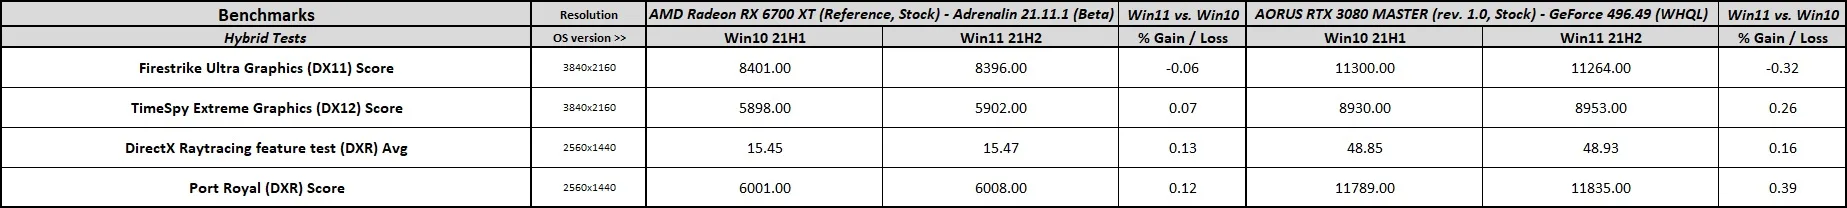
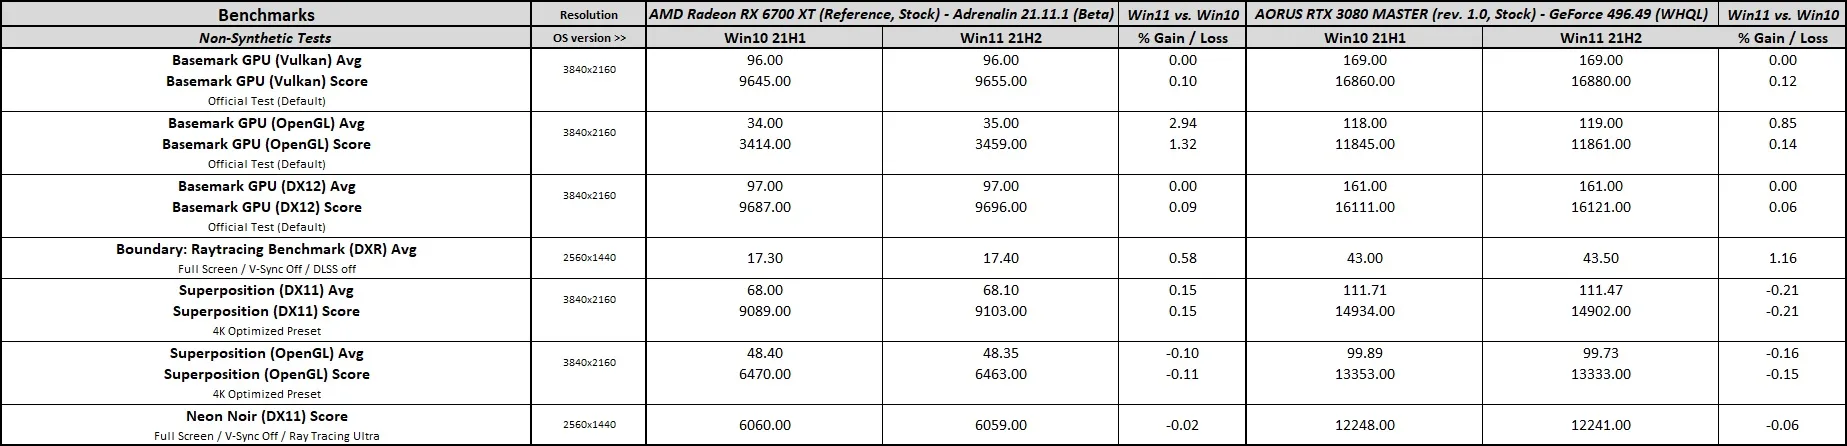
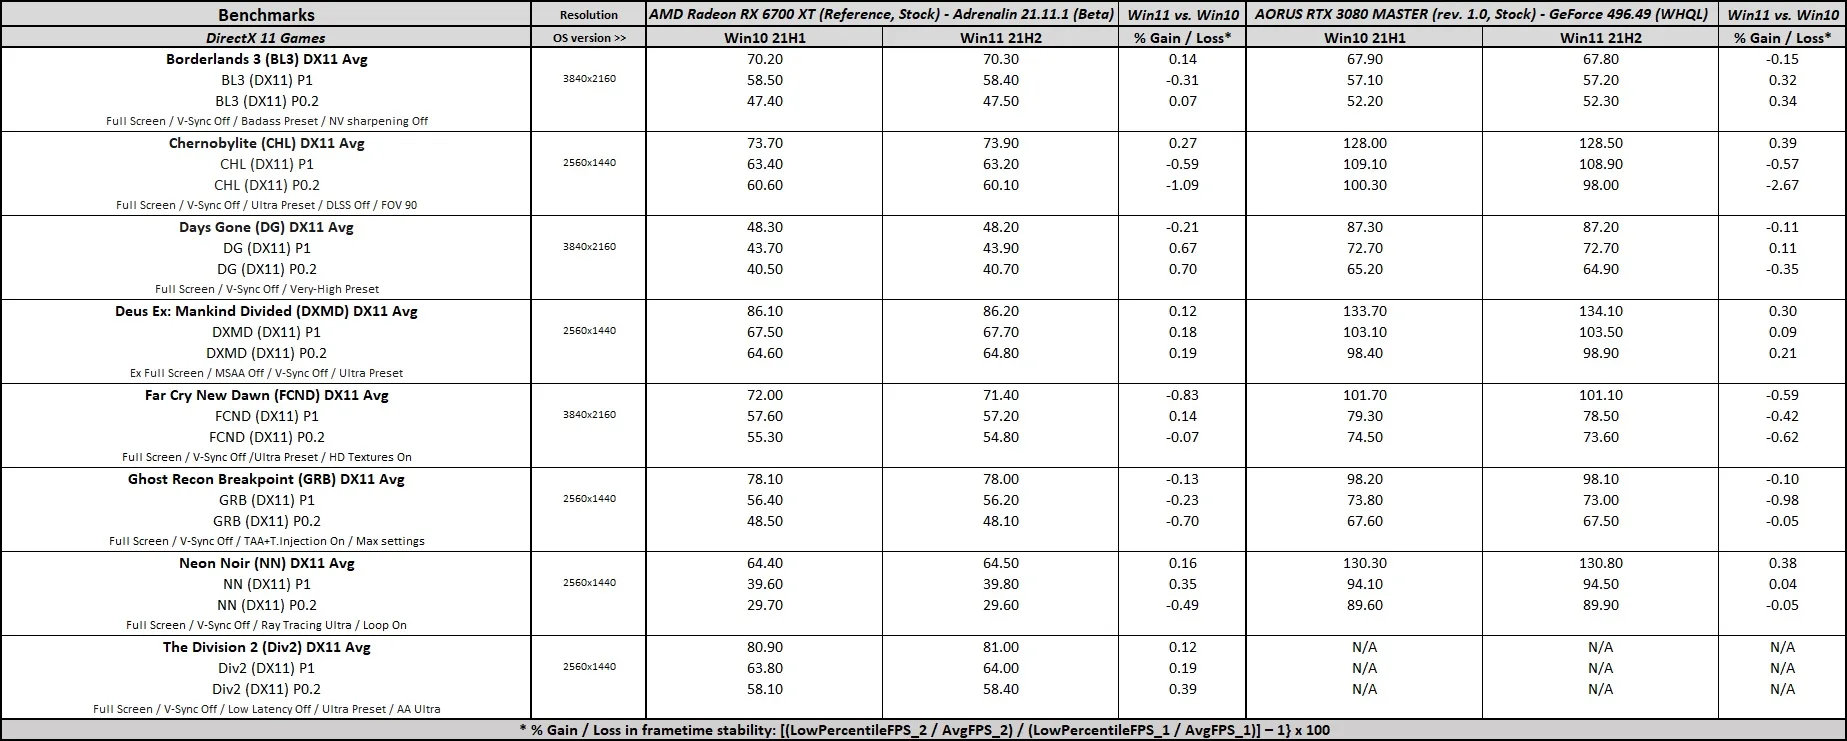
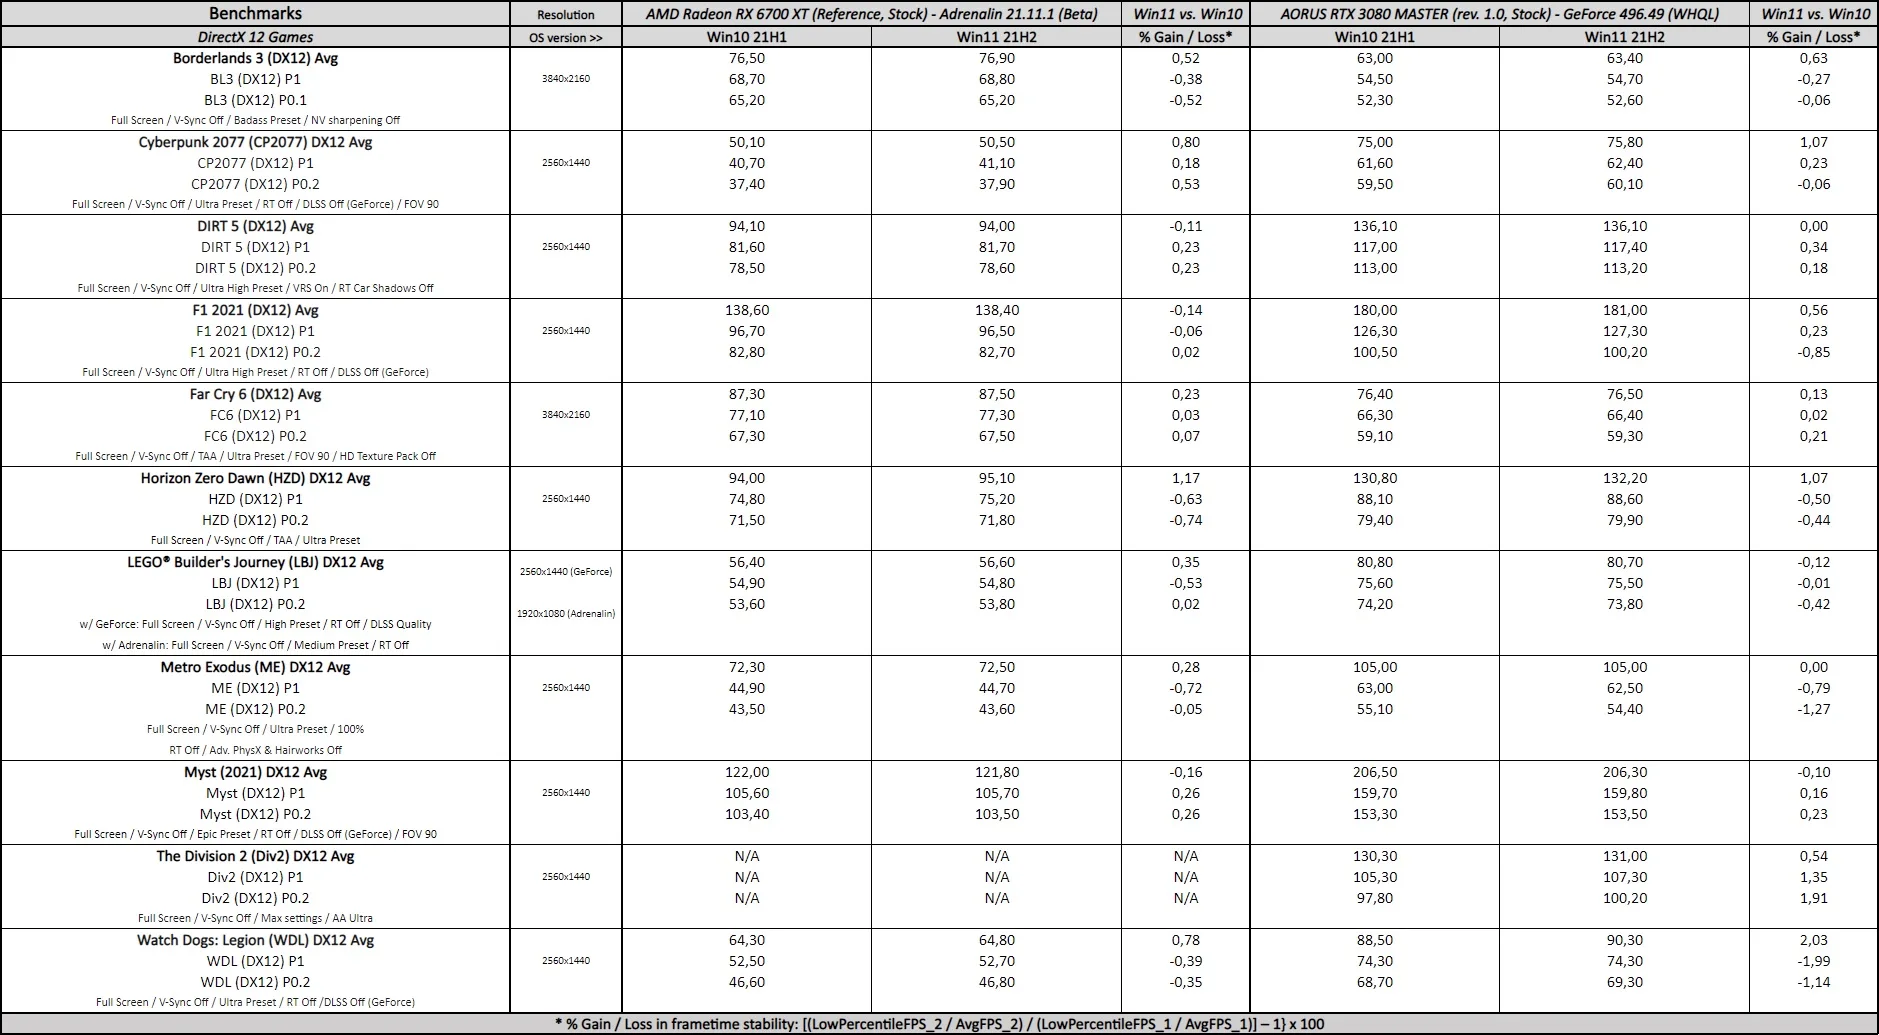
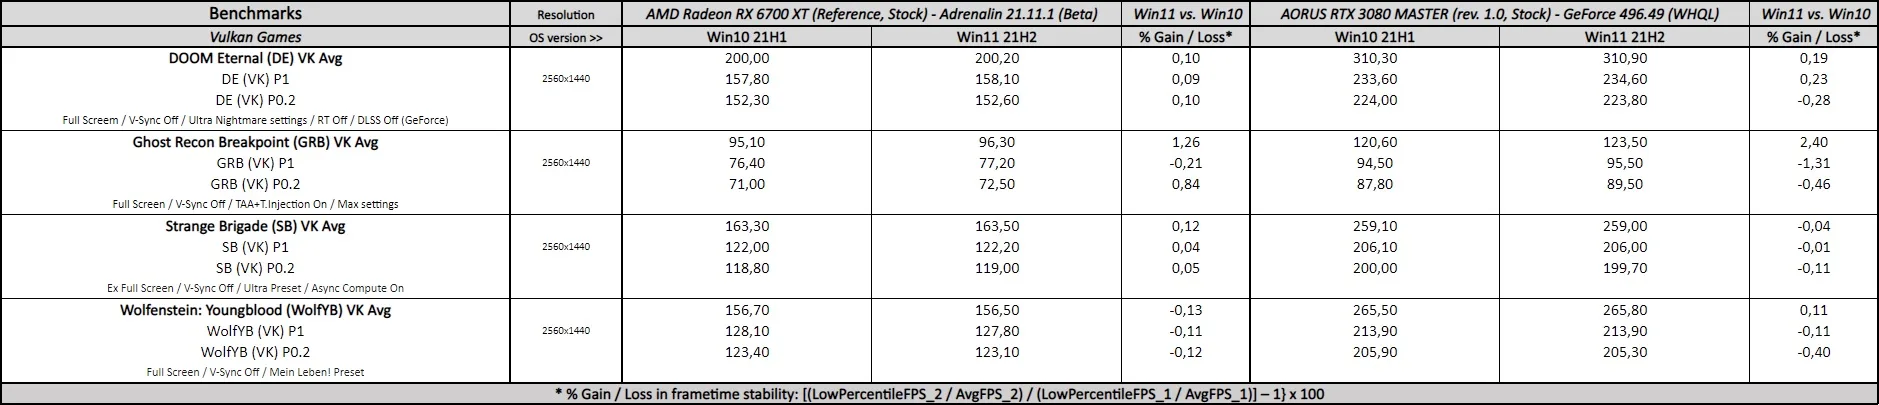
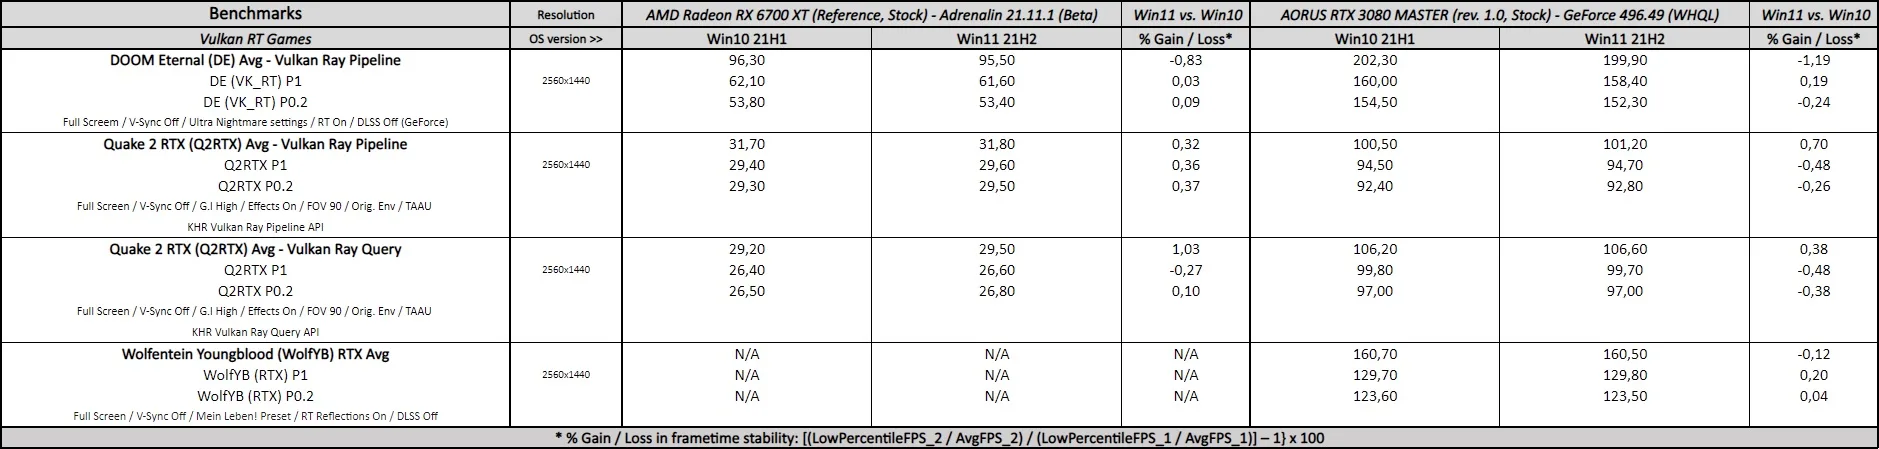
The Performance Summary Charts – Windows 11 21H2 vs. Windows 10 21H1
Below are the summary charts of 23 games plus 4 hybrid and 4 non-synthetic benchmarks used to compare the performance changes for the reference RX 6700 XT and the AORUS RTX 3080 MASTER from the Windows 10 May 2021 (21H1) version to the latest Windows 11 (21H2) version.
You can see the list of graphics settings on the charts, and we run each built-in or custom game benchmark’s sequence at 2560×1440, except for Borderlands 3, Days Gone, Far Cry New Dawn, and Far Cry 6, tested at 3840×2160 resolution when using our RTX 3080; and LEGO® Builder’s Journey (DX12 & DXR) and Watch Dogs: Legion (DXR) which are tested at 1920×1080 resolution when using our RX 6700 XT. You may click on each chart to open a pop-up for the best viewing.
Results give average framerates and higher is better. We display the low FPS percentiles (P1 and P0.2) below the corresponding averages. We use CapFrameX to record frametimes over time and to visualize and convert them into their corresponding average FPS and P1 and P0.2 FPS percentiles values. There are also columns showing percentages of gain/loss in both raw performance (average FPS) and, when applicable, in frametimes consistency or stability between the different driver versions. To calculate the gains or losses in stability we applied our custom formula:
{[(LowPercentileFPS_2 / AvgFPS_2) / (LowPercentileFPS_1 / AvgFPS_1)] – 1} x 100
We mark significant performance changes (higher than 3%) in bold and use purple for the significant improvements or orange font for regressions.
Windows 11 Performance Analysis Charts

Notes on Win dows 11 (21H2) performance
We found no significant differences in gaming performance using the latest Windows 11 (21H2) version compared with Windows 10 May 2021 (21H1) version using our RX 6700 XT and RTX 3080. Overall, the results are well within what is considered our 3% margin of error, or ‘benchmarking noise’.
Let’s head to our conclusion.
Disclaimer
Please be aware that the following results, notes, and the corresponding Windows OS version recommendation are valid for similar Radeon or GeForce gaming rigs using Adrenalin 21.11.1 or GeForce Game Ready 496.49 drivers. Its representativeness, applicability, and usefulness on different Windows versions, GPU architectures, testing benches, and GPU drivers may vary.
Conclusion
Based on our previous results and findings, we recommend upgrading to the latest Windows 11 version (21H2) since its raw performance and smoothness or frametimes consistency level is approximately on par with Windows 10 version 21H1.
Finally, we found the latest public Windows 11 build to be functionally stable and relatively bug-free.
Let’s Play!
***
Rodrigo González (aka ‘RodroG’) is an enthusiast gamer and tech reviewer interested especially in shooter games, open-world role-playing games, and software and hardware benchmarking. He is the author of the NVIDIA WHQL Driver Performance Benchmarks Series and founder and moderator of the r/allbenchmarks community on Reddit.
Comments are closed.