The Team Group L5 LITE 3D 480 GB SSD review
A Solid State Drive (SSD) has an advantage for a gamer over a Hard Disk Drive (HDD) by saving time loading games and game levels. Although game framerates are identical, a SSD will give an enthusiast a noticeable performance boost by loading apps faster while using less power. Unfortunately, the past 18 months have seen SSD flash memory prices raise, making the transition to an SSD expensive.
It appears that SSD pricing has recently softened, and we purchased two Team Group L5 LITE 3D 2.5″ 480 GB SSDs (T253TD480G3C101) in January for $99 each, shipped from Newegg. And since then, although they list for $128, they have been on sale 3 times for $99. This review intends to determine if a $99 480 GB SSD is cost-effective and suitable for a gamer.
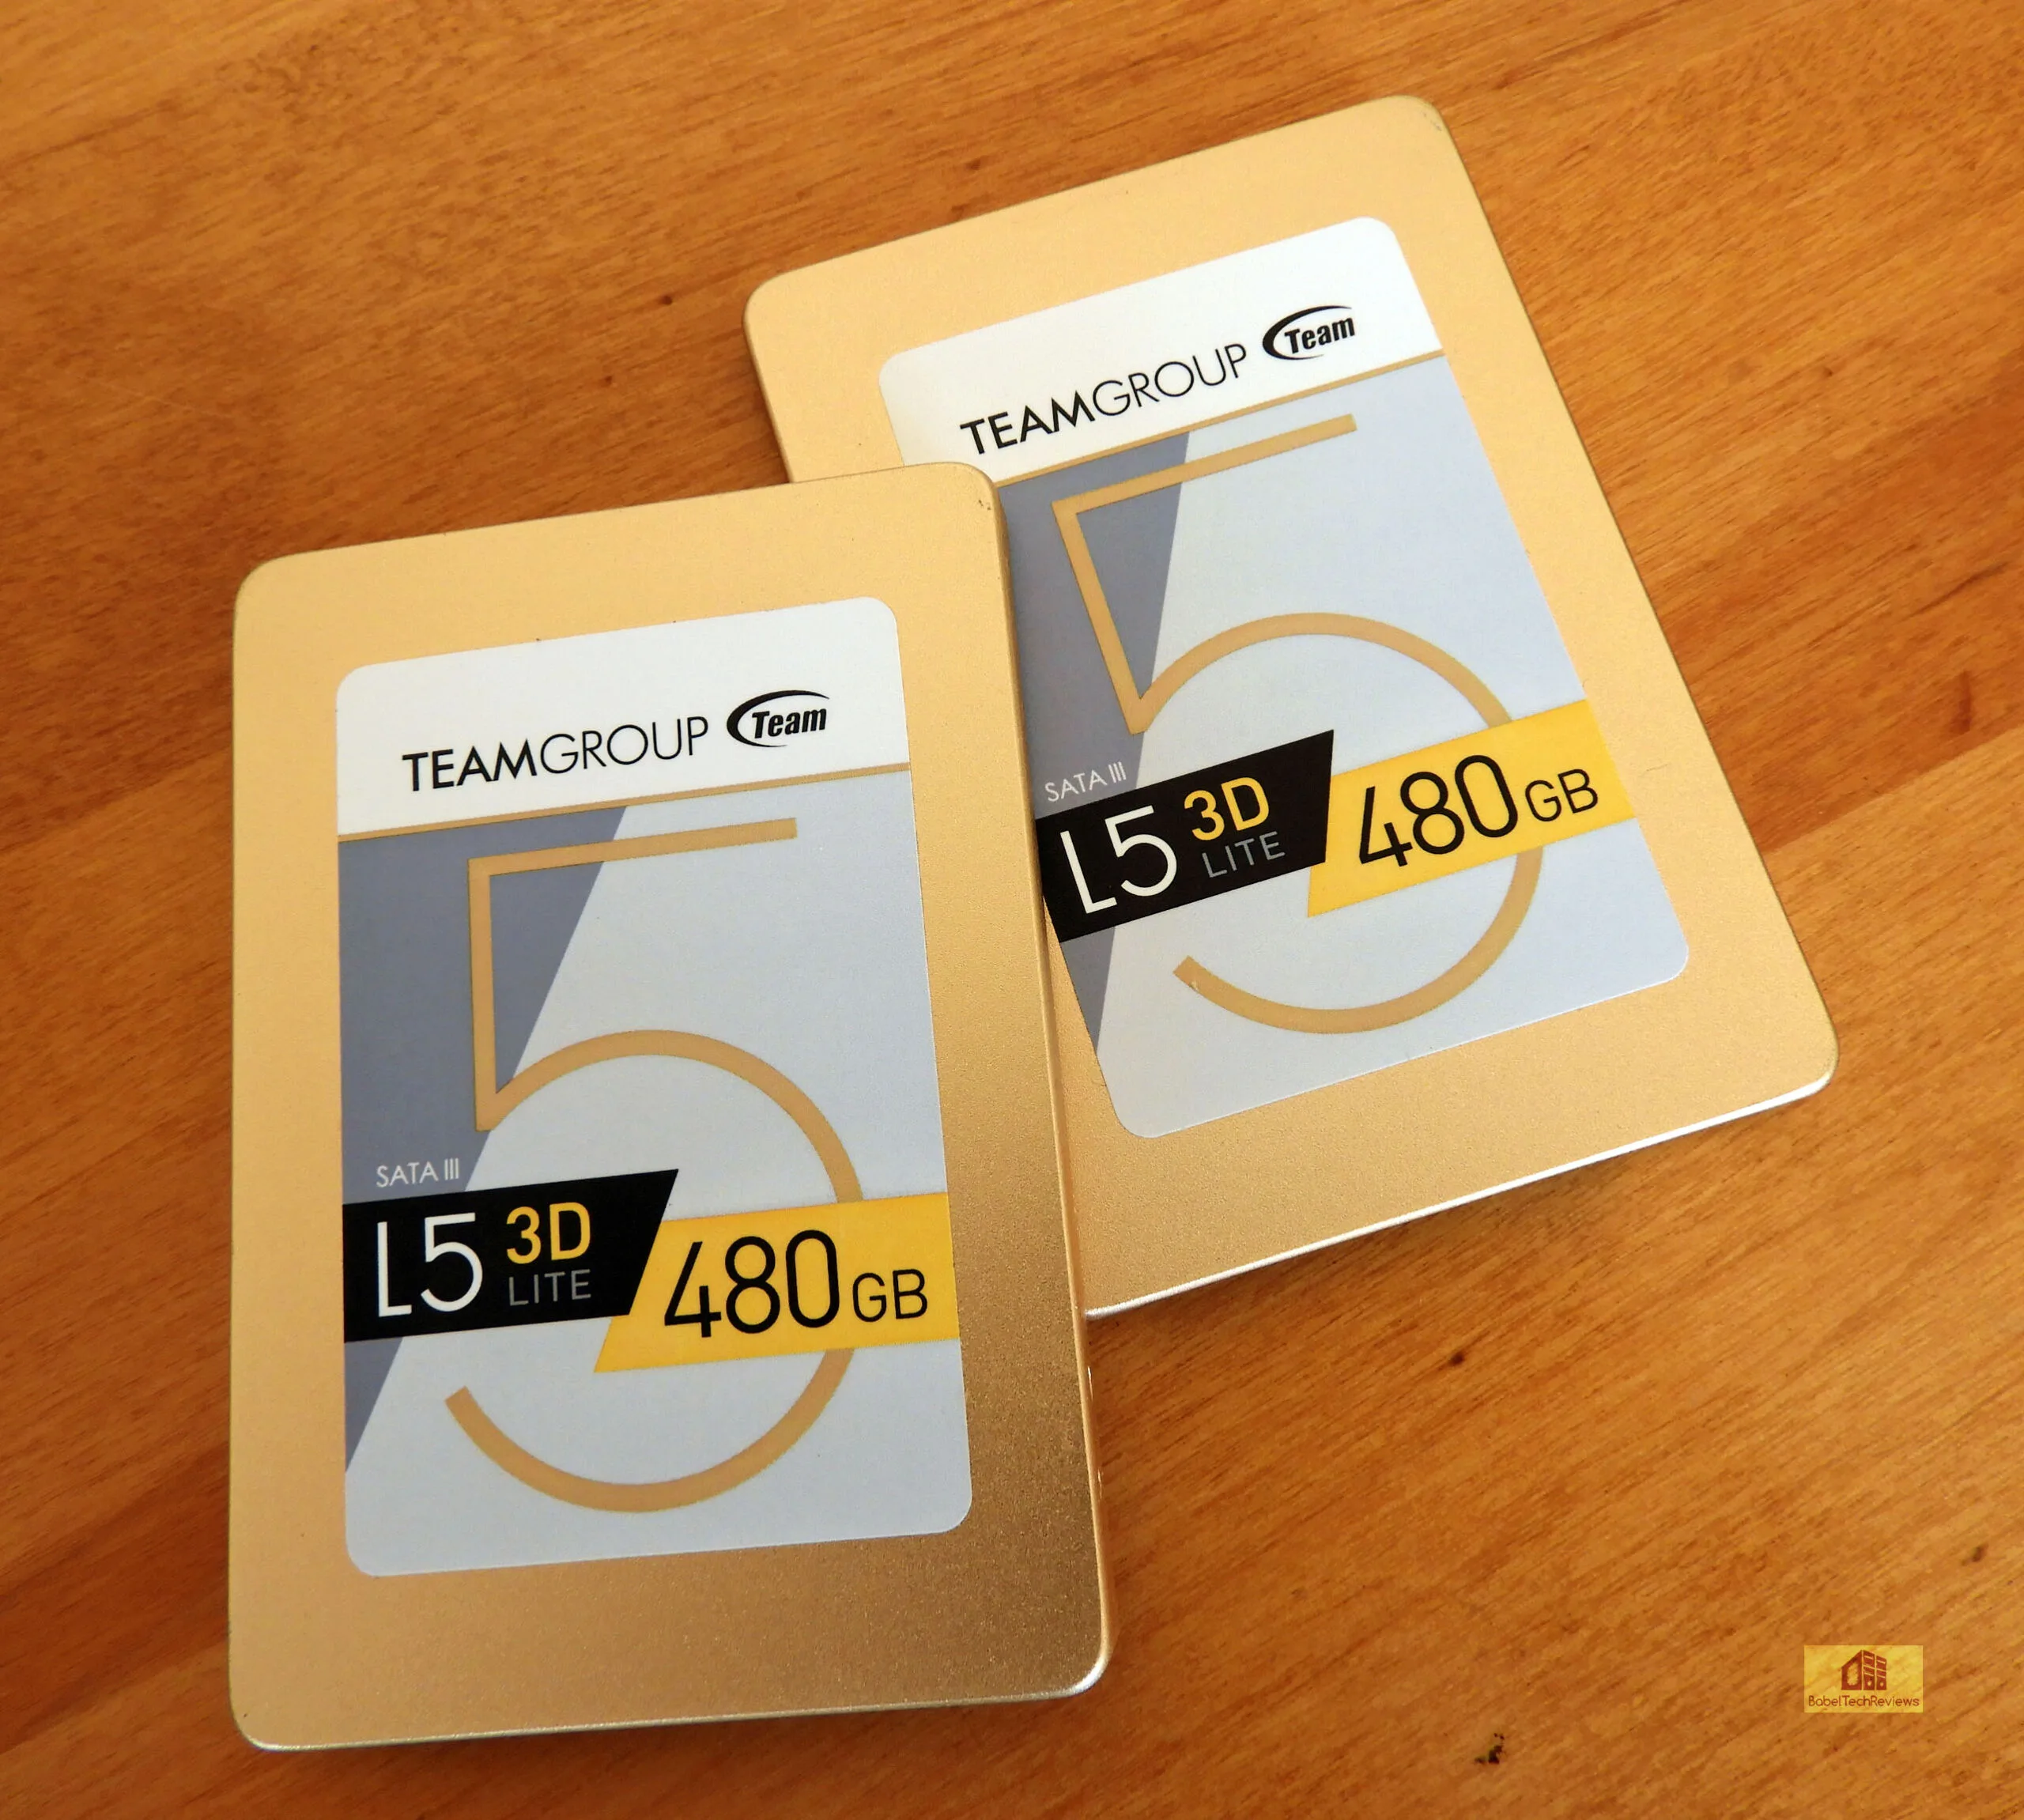
BTR has been using two older generation 240 GB SATA III HyperX SSDs for our Windows boot drives, but they are too small for Windows Store games which work best on C drive, so we upgraded to two Team Group 480 GB SSDs. We always use two identical boot drives – one for AMD and one for NVIDIA – and we also use a 1.92 TB SanDisk SSD for our primary game storage together with a 2 TB Seagate FireCuda SSHD (Solid State Hard Drive) hybrid caching/traditional hard drive for additional storage.
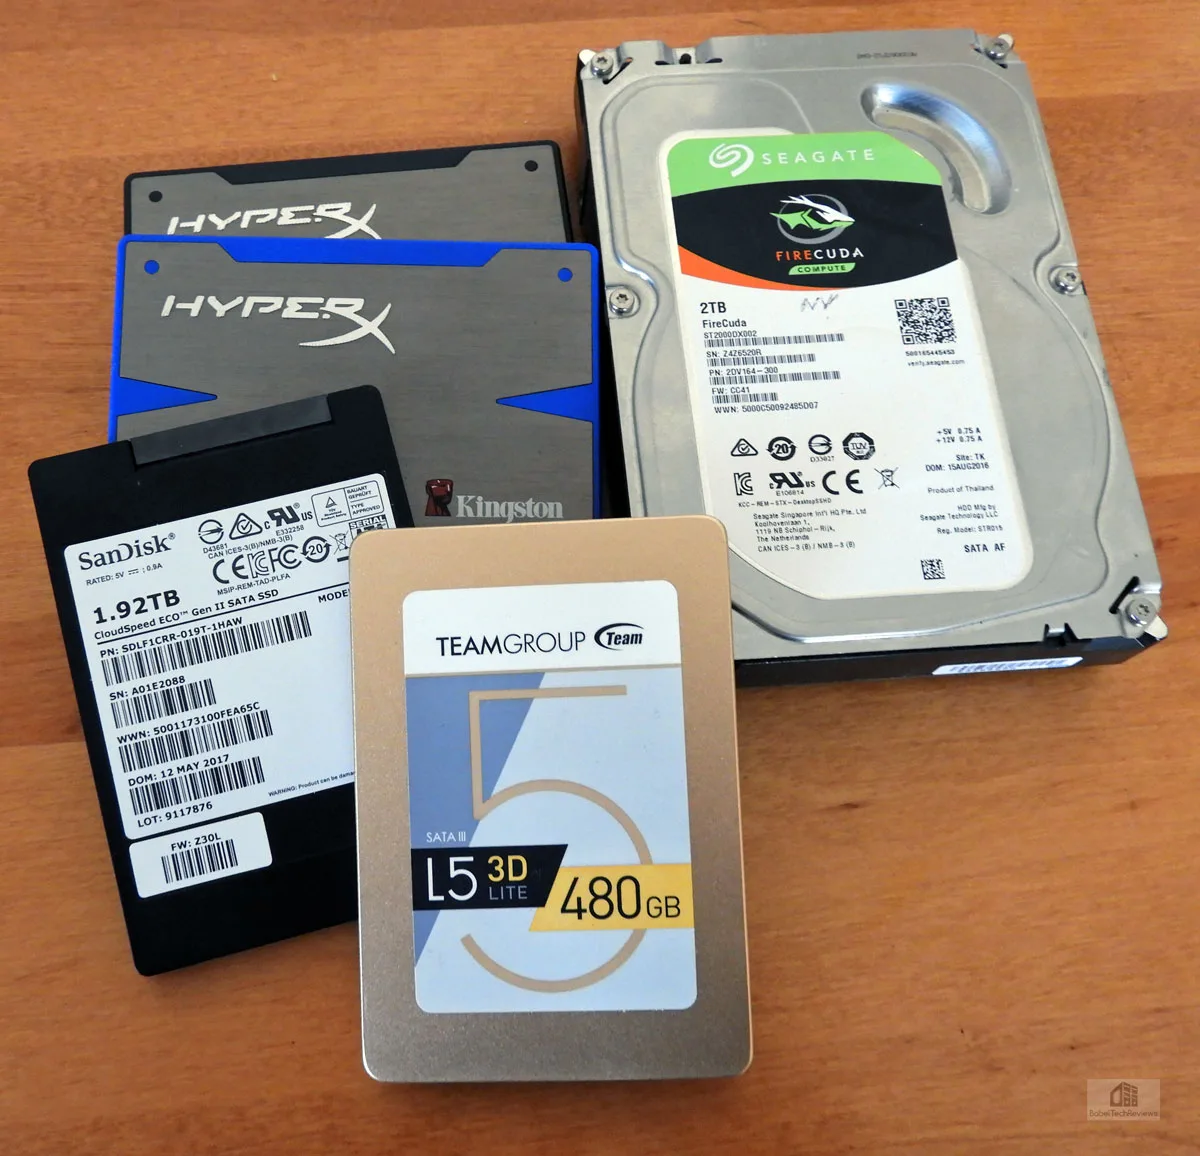
For this review, we are going to compare 4 SSDs from several generations – the original Kingston 240 GB HyperX (brown) and its faster memory-equipped sibling, the 240 GB HyperX Blue; a 1.92 TB SanDisk enterprise-class SSD, and the 480 GB Team Group SSD – to a 2 TB FireCuda SSHD which is a traditional 7200 rpm Seagate HDD coupled with 8 GB of flash drive. Both HyperX SSDs use 25nm MLC and the second generation of SandForce SSD controller (SF-2281). The 1.92 TB SanDisk CloudSpeed ECO Gen II SSD (SXPLFA) is also a Generation II 15nm MLC SSD with an emphasis on enterprise reliability. In contrast, the Team Group SSD uses 3D NAND.
Our testing platform is Windows 10 64-bit, using an Intel Core i7-8700K overclocked to 4.7 GHz for all cores as set in the EVGA Z370 FTW motherboard’s BIOS, and 16 GB of HyperX DDR4 at 3333MHz. The settings and hardware are identical except for the drives being tested, and the graphics are powered by a GTX 1070 Ti Founders Edition (FE). We benchmark with all of our drives at less than 75% capacity, and in addition, all of the drives have been in use for months, so the results are as “real world” as they get.
First, here are the features and specifications of the Team Group L5 LITE 3D 480 GB SSD from Team Group’s website:
Features and Product Specifications
Features
- 3D NAND – excellent choice for upgrade
- Read/write speed is 4 times faster than traditional hard drive – breathe new life into old system
- Smooth read/write speed – up to 470 MB/s of reading speed is able to enhance the speed and performance of the overall system
- Ultra lightweight and slim – 2.5-inch hard drive with just 7.0 mm thickness, it can be installed on laptop or any other system
- Support S.M.A.R.T. technology – monitoring hard drive status efficiently
- Support TRIM – bring out its best performance on the compatible operating system
- Three years product warranty with free technical support service
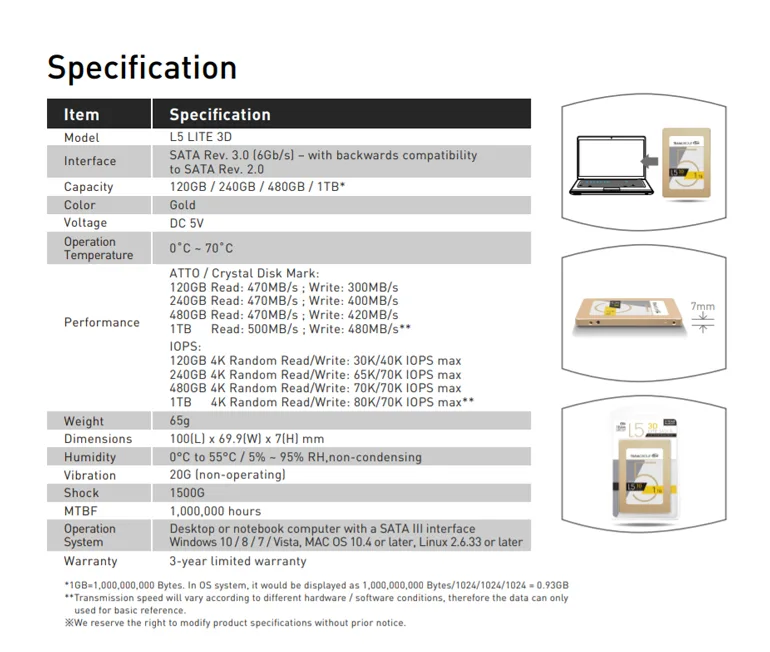 The Team Group SSD uses garbage collection and TRIM to keep the SSD operating efficiently, and there are the usual wear-leveling and error checking algorithms to insure the data transfers are accurate. The specifications look good for a basic SSD with 3D NAND. Let’s take a closer look by unboxing the Team Group 480 GB SSD next.
Unboxing
The Team Group 480 GB comes in a very basic blister pack which doesn’t include mounting screws nor does it really advertise its features. Of course, we bought two – one for AMD and the other for NVIDIA.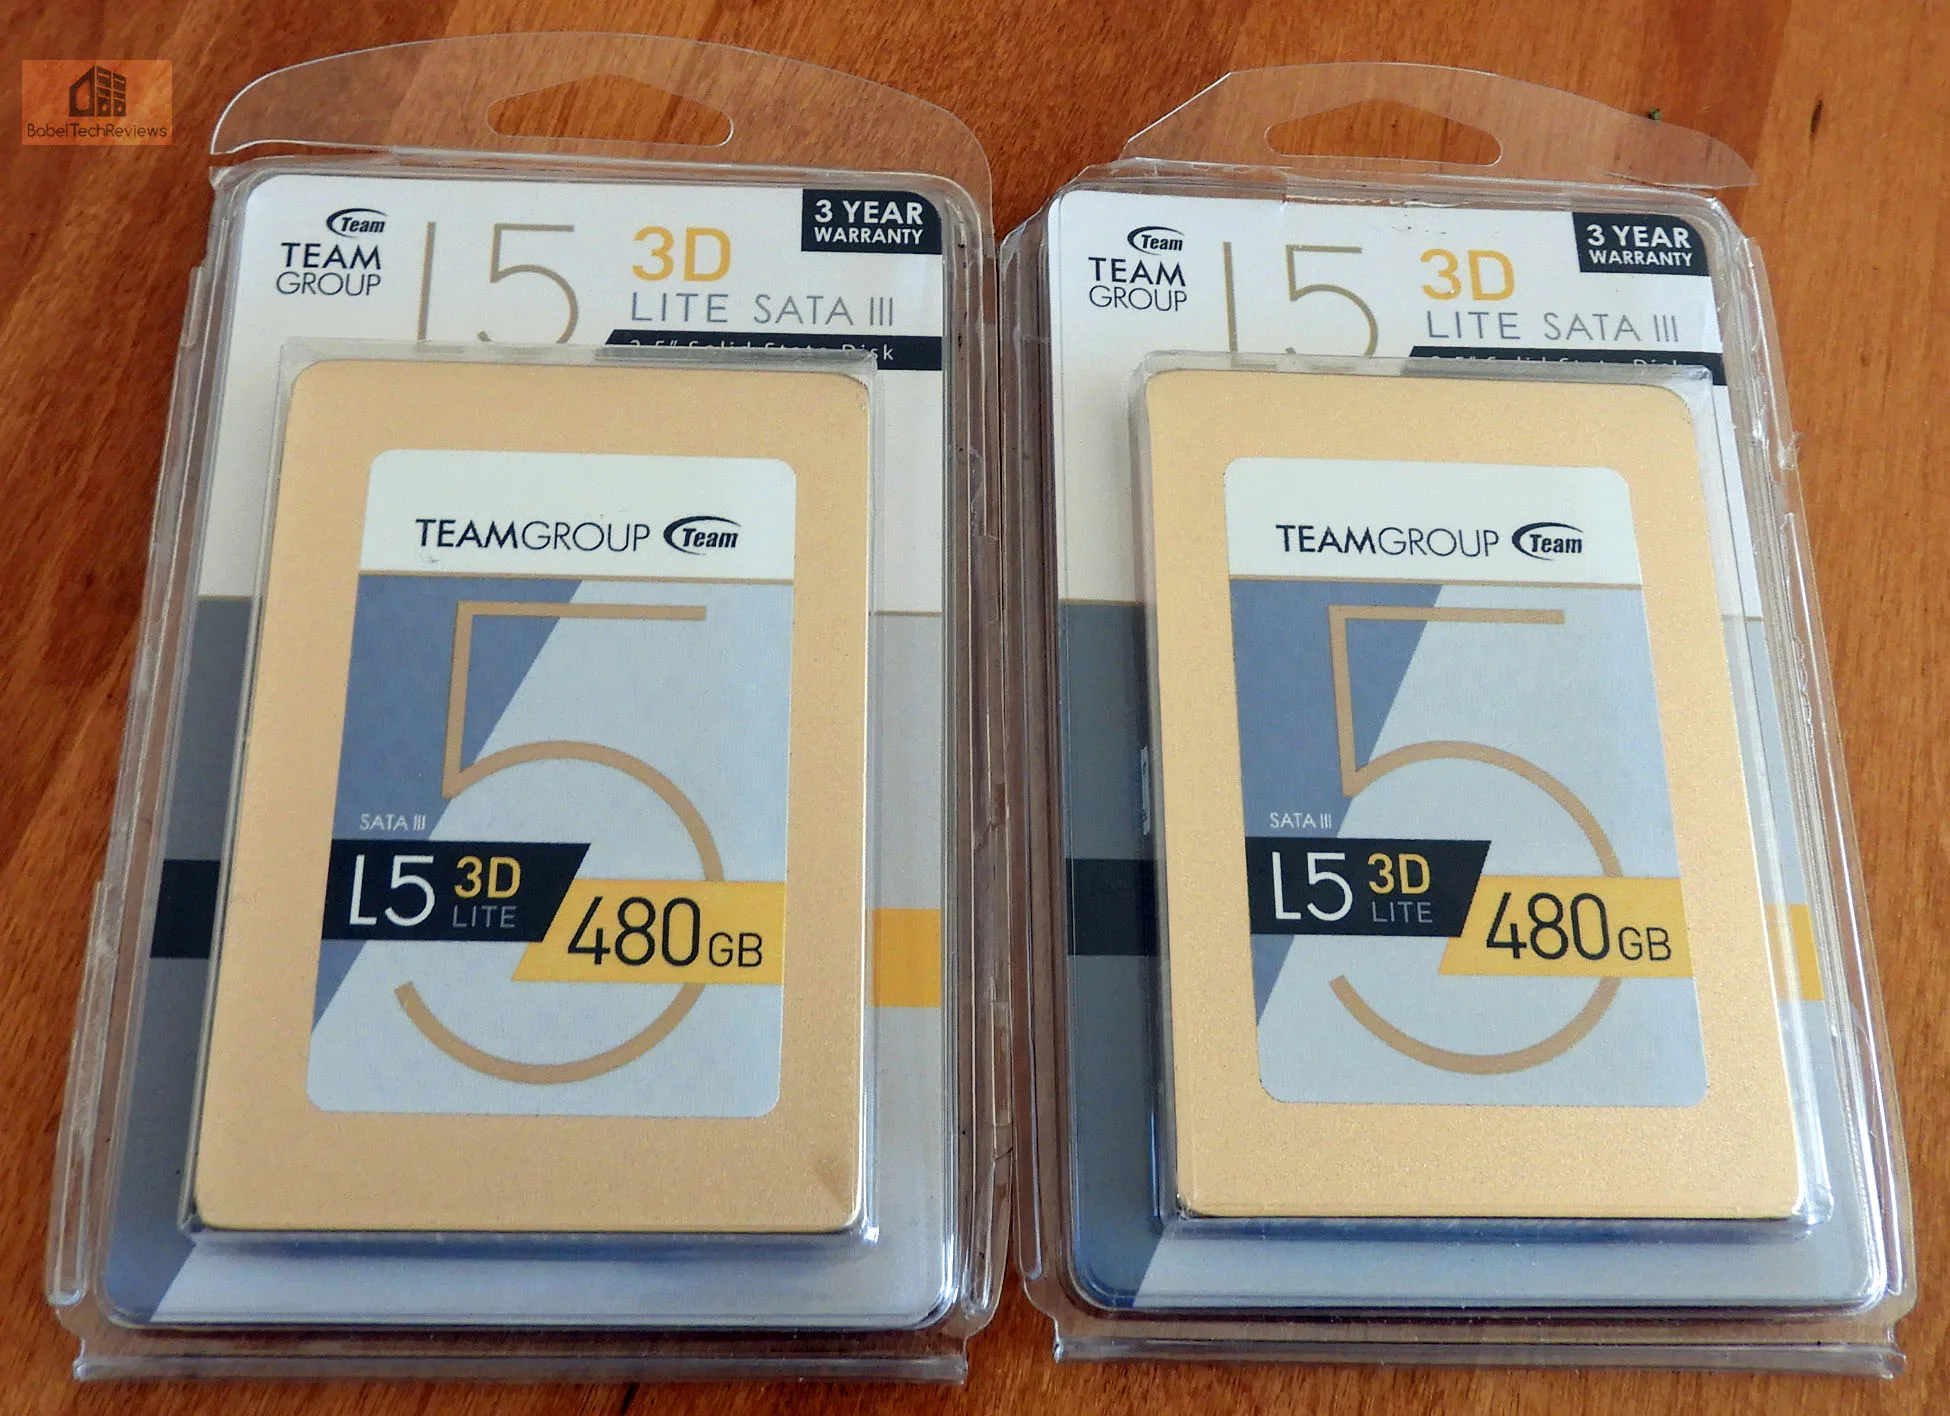
Here is the other side.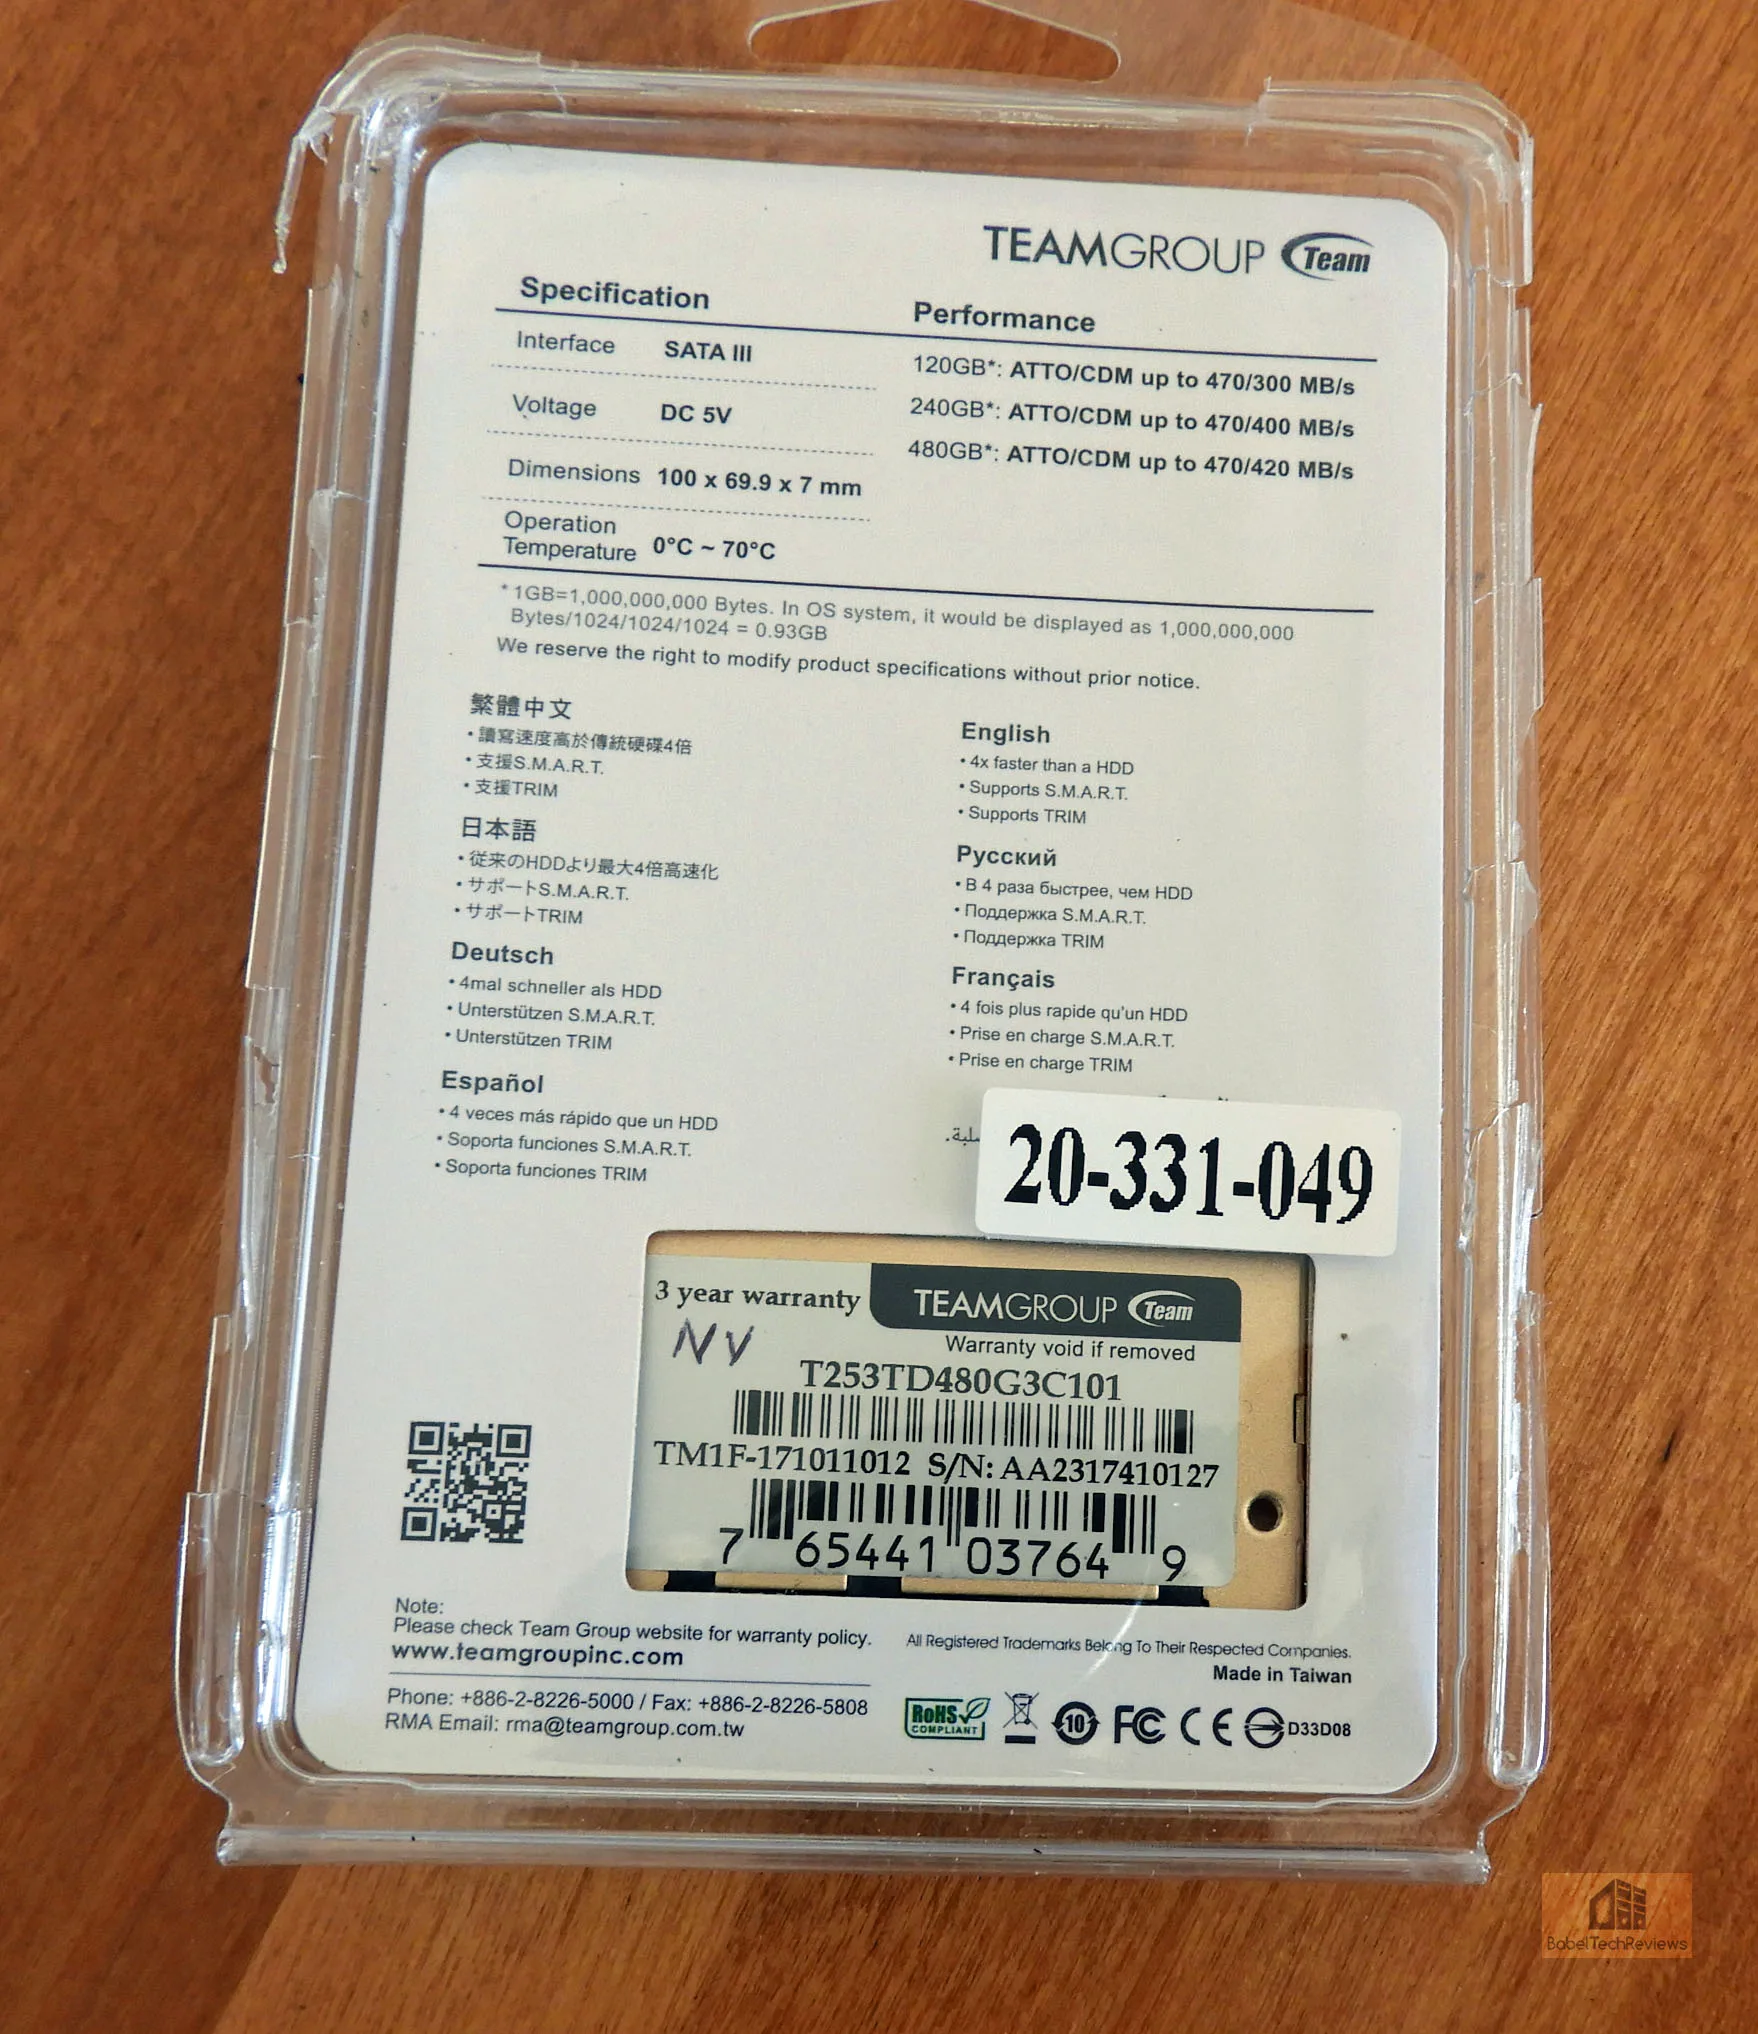
The metallic color is passably acceptable and rather different from other drives, but it is hidden anyway when it is installed in our EVGA DG-77 case. One thing that is very noticeable is that the Team Group SSD is very lightweight when compared with other SSDs, and Team Group touts this as an advantage for notebooks. They also claim it is durable and less likely to be damaged from shock by bumping or dropping it.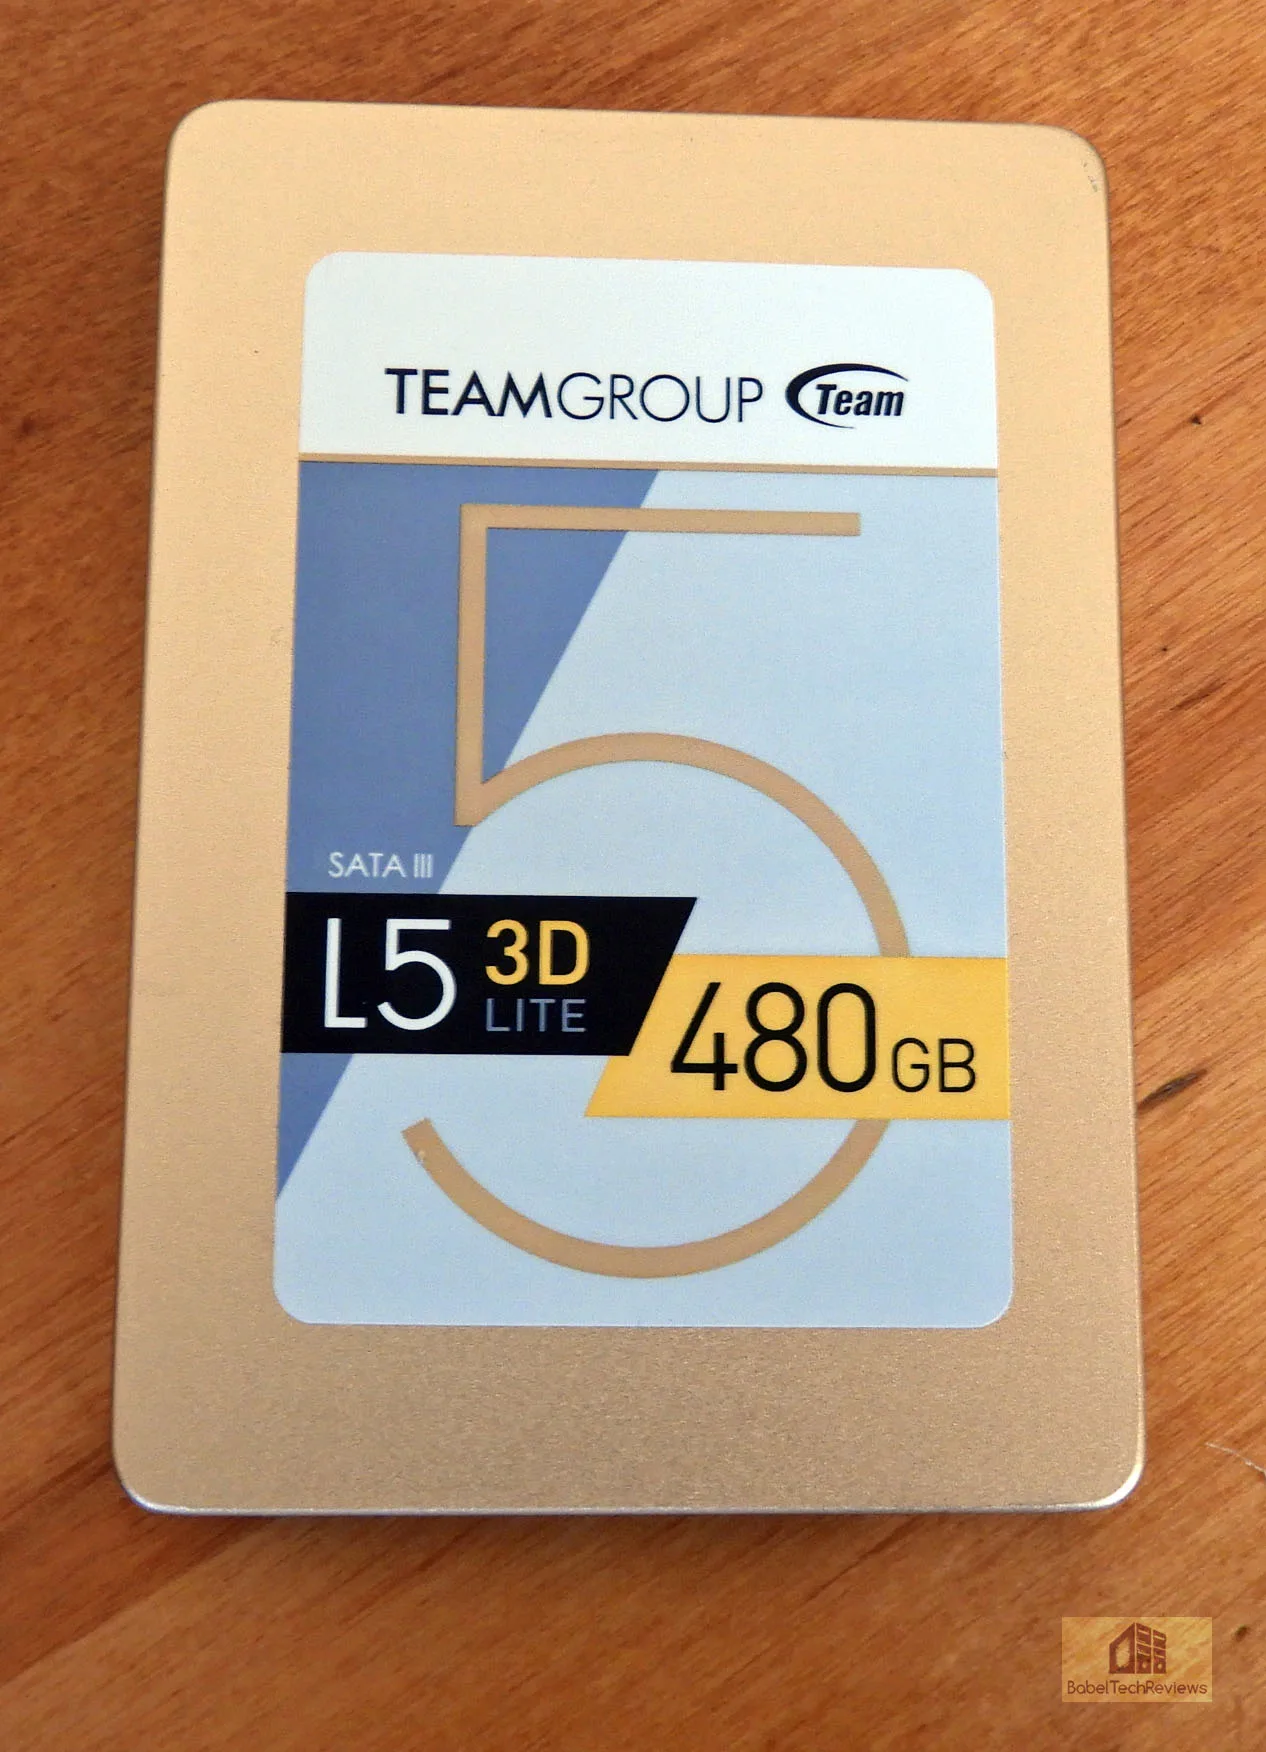
Here is the other side.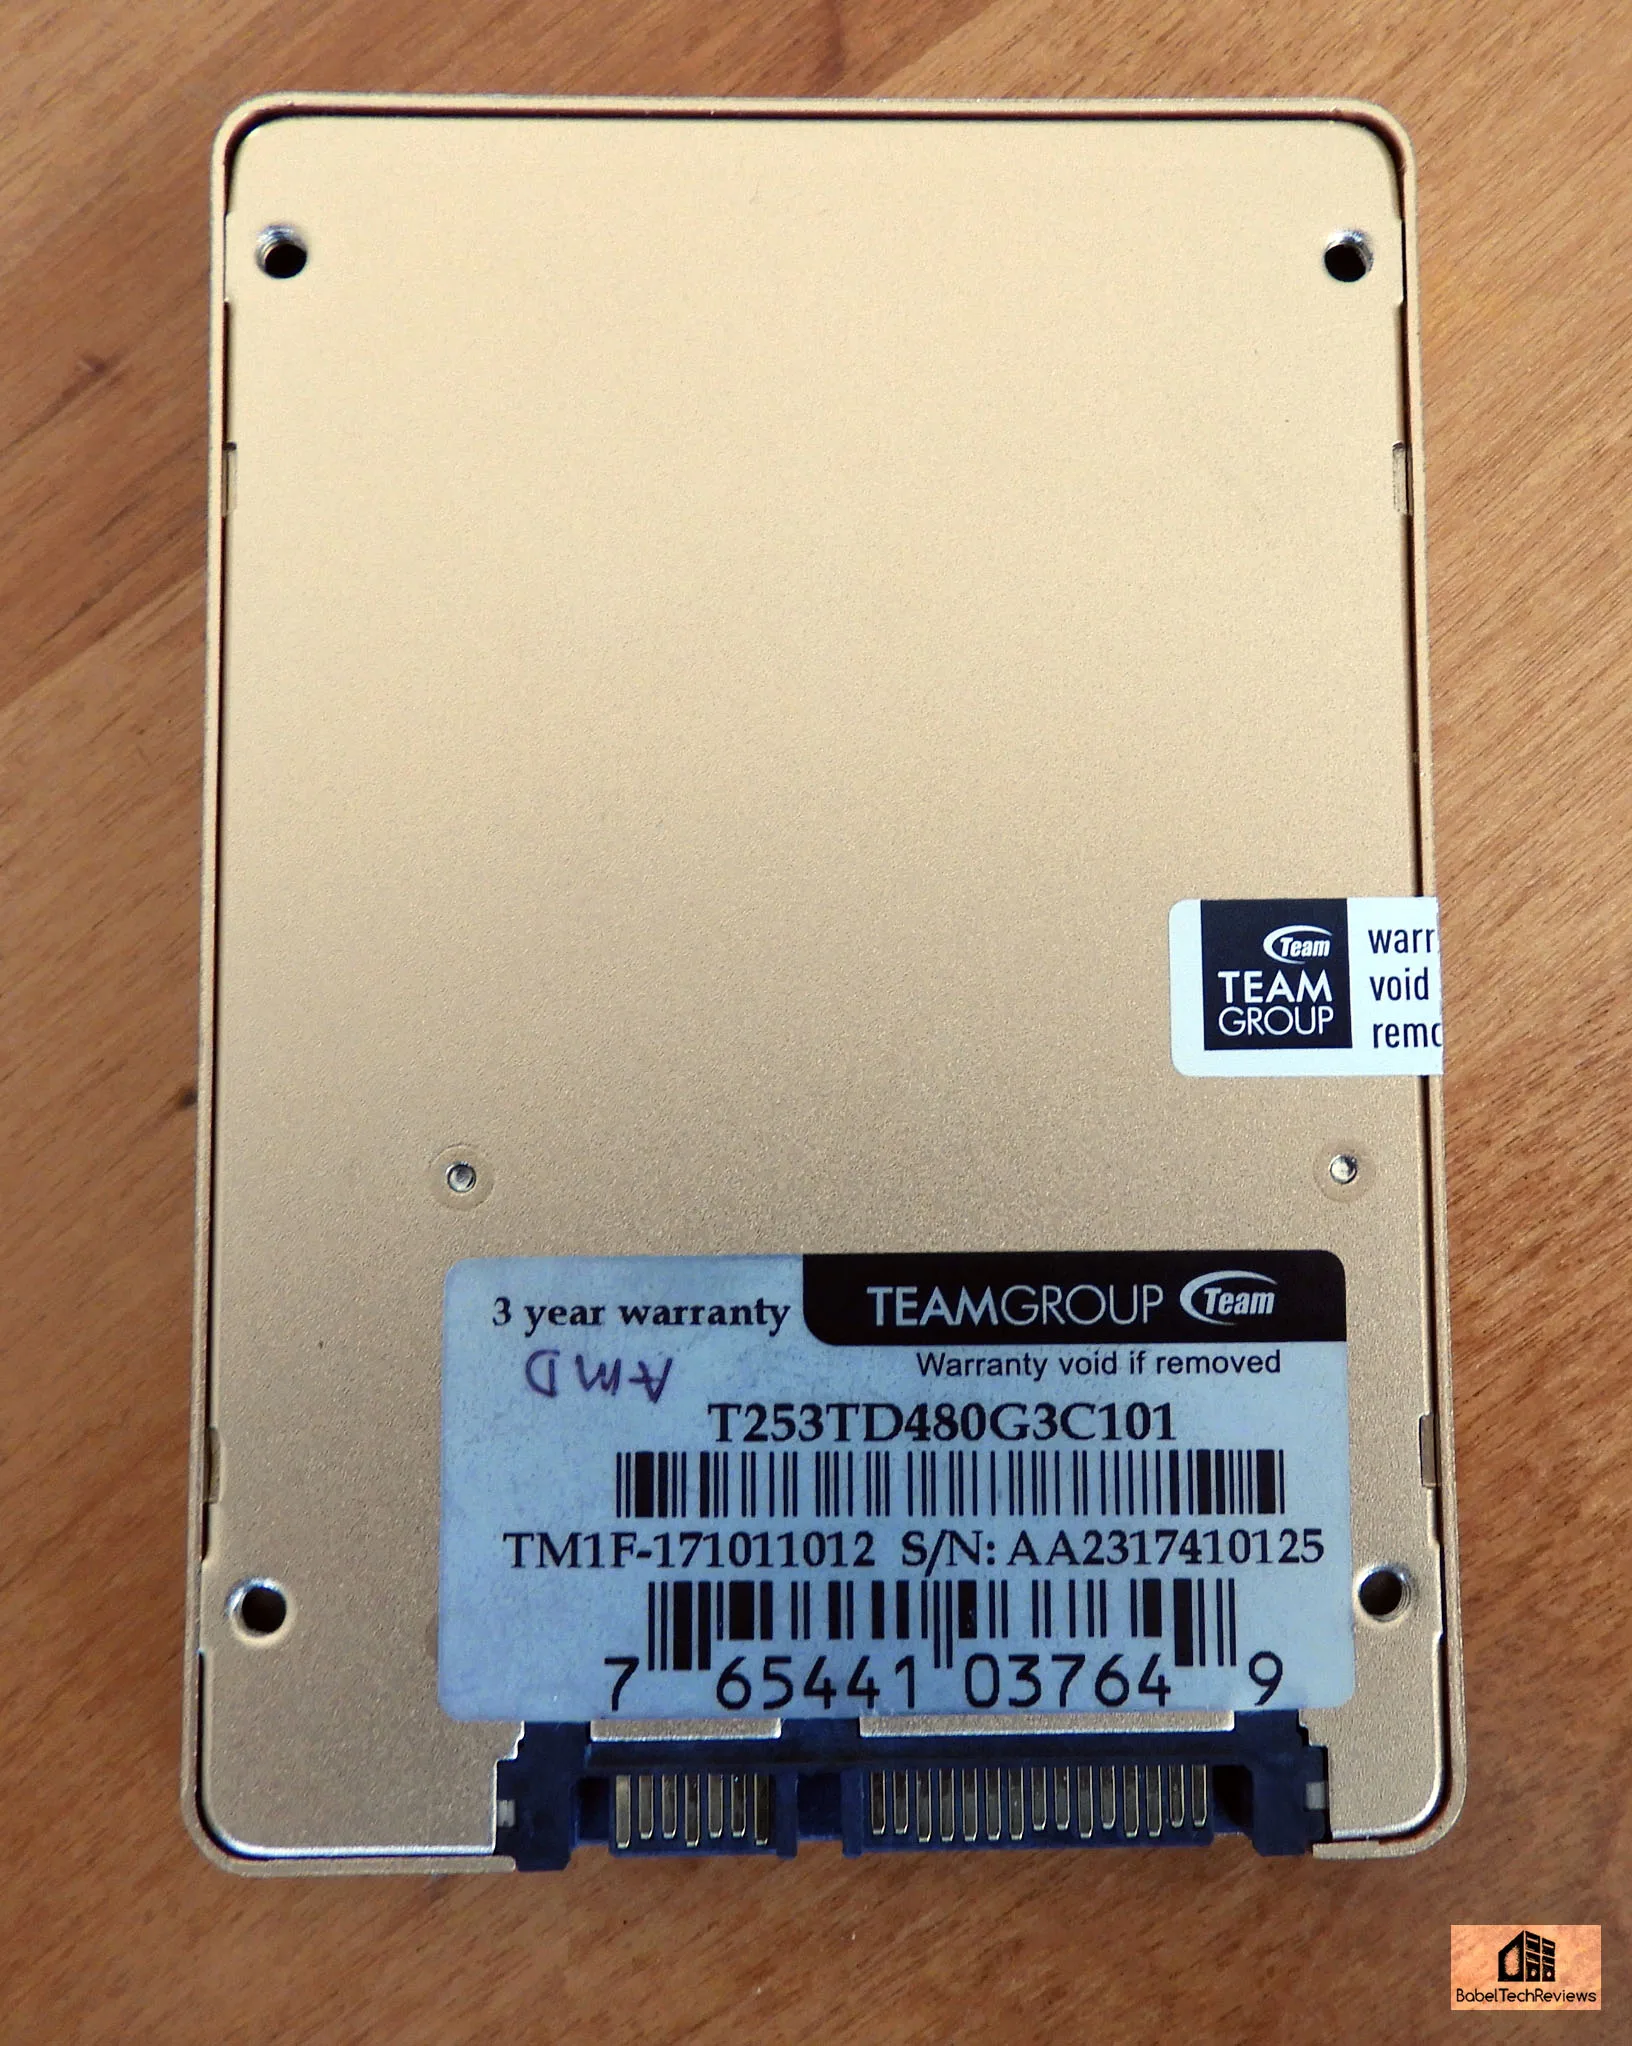
It is a SATA III SSD with the usual connectors. Here is a group picture with our other drives.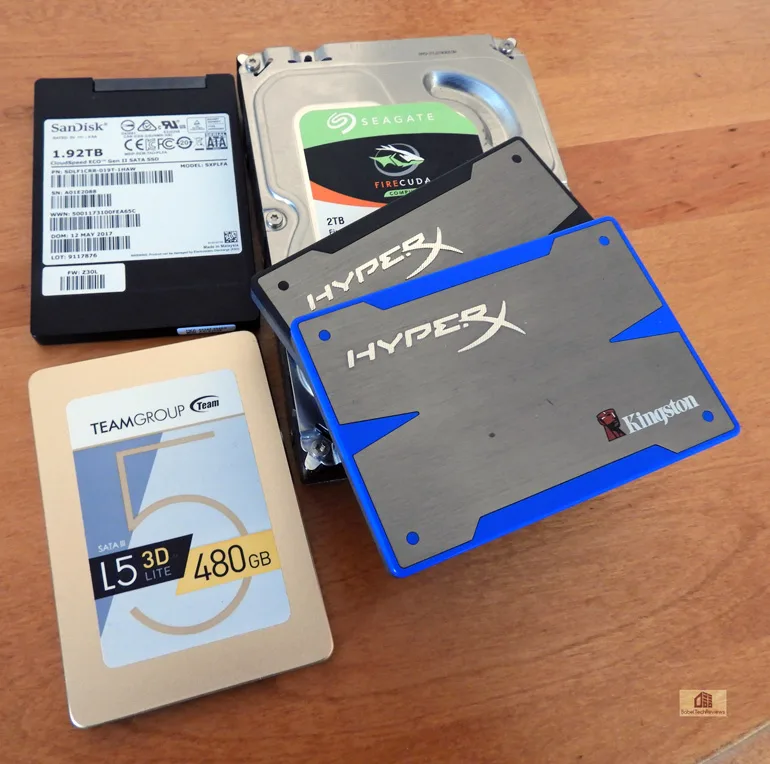
Let’s look next at our test configuration before we do any benching
Test Configuration – Hardware
- Intel Core i7-8700K (HyperThreading and Turbo boost is locked on to 4.7 GHz for all six cores. Coffee Lake DX11 CPU graphics.
- EVGA Z370 FTW motherboard (Intel Z370 chipset, latest BIOS, PCIe 3.0/3.1 specification, CrossFire/SLI 8x+8x), supplied by EVGA
- HyperX 16GB DDR4 (2x8GB, dual channel at 3333MHz), supplied by HyperX/Kingston
- GTX 1070 Ti Founders Edition 8GB, stock clocks, supplied by NVIDIA
- Team Group L5 LITE 3D 2.5″ 480 GB SSD
- 240 GB HyperX SSD (Brown), supplied by Kingston
- 240 GB HyperX SSD (Blue), supplied by Kingston
- 1.92 TB SanDisk CloudSpeed ECO Gen II SSD (SXPLFA)
- 2 TB Seagate 7200 rpm SSHD (Solid State Hard Drive)
- EVGA 1000G 1000W power supply unit
- EVGA CLC 280mm CPU water cooler, supplied by EVGA
- Onboard Realtek Audio
- Genius SP-D150 speakers, supplied by Genius
- EVGA DD-77, mid-tower case supplied by EVGA
- Monoprice Crystal Pro 4K
Test Configuration – Software
-
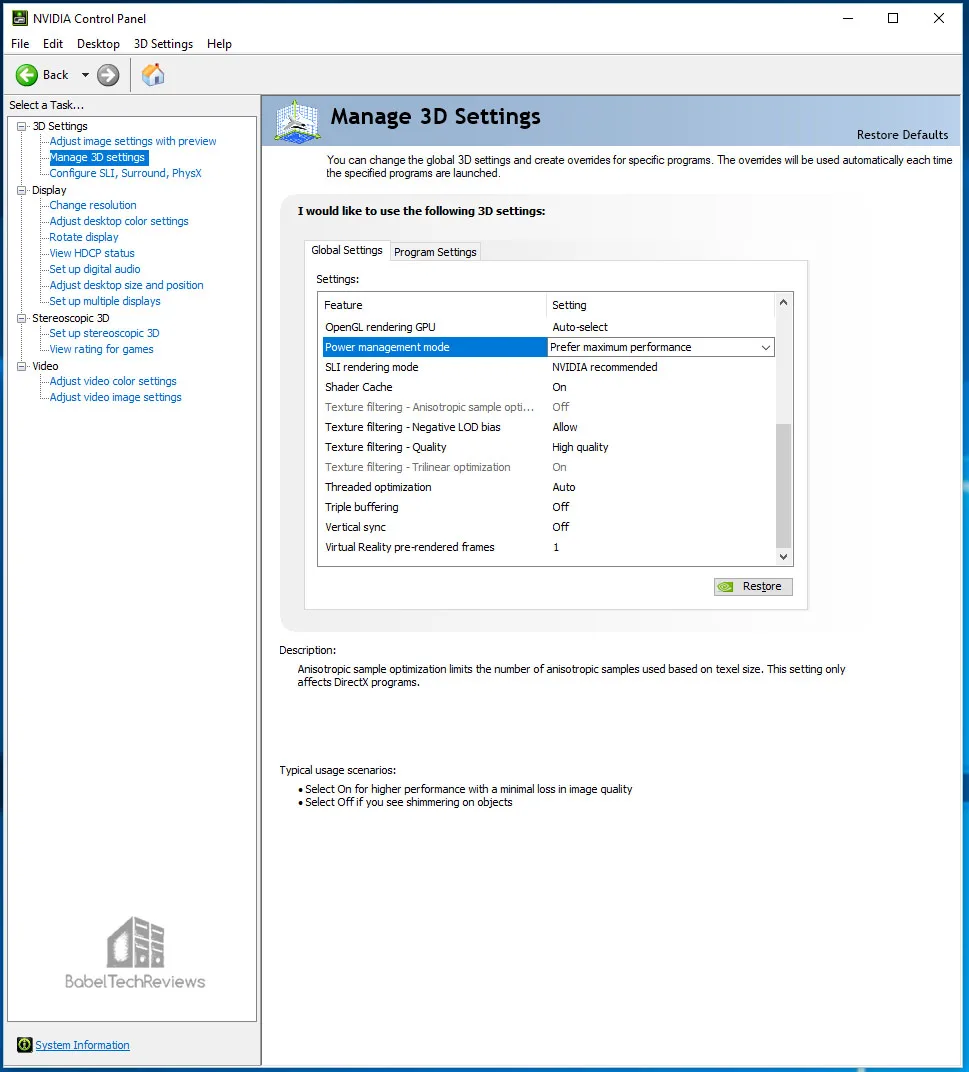
- Nvidia’s GeForce 390.77 WHQL drivers were used. High Quality, prefer maximum performance, single display.
- VSync is off in the control panel.
- AA enabled as noted in games; all in-game settings are specified with 16xAF always applied. All games are DX11 except as noted.
- All results show loading time in seconds.
- Highest quality sound (stereo) used in all games.
- Windows 10 64-bit Home edition.
- Latest DirectX
- All games are patched to their latest versions at time of publication.
- MSI’s Afterburner, latest version.
- HD Tach
- HD Tune
- AS SSD
- ATTO
- Crystal Disk Mark
PC Game level/loading suite
- Fallout 4
- Grand Theft Auto V
- Call of Duty WW II
- Project CARS 2
- Ashes of the Singularity: Escalation (DX12)
- Deus Ex Mankind Divided (DX12)
- DOOM (Vulkan)
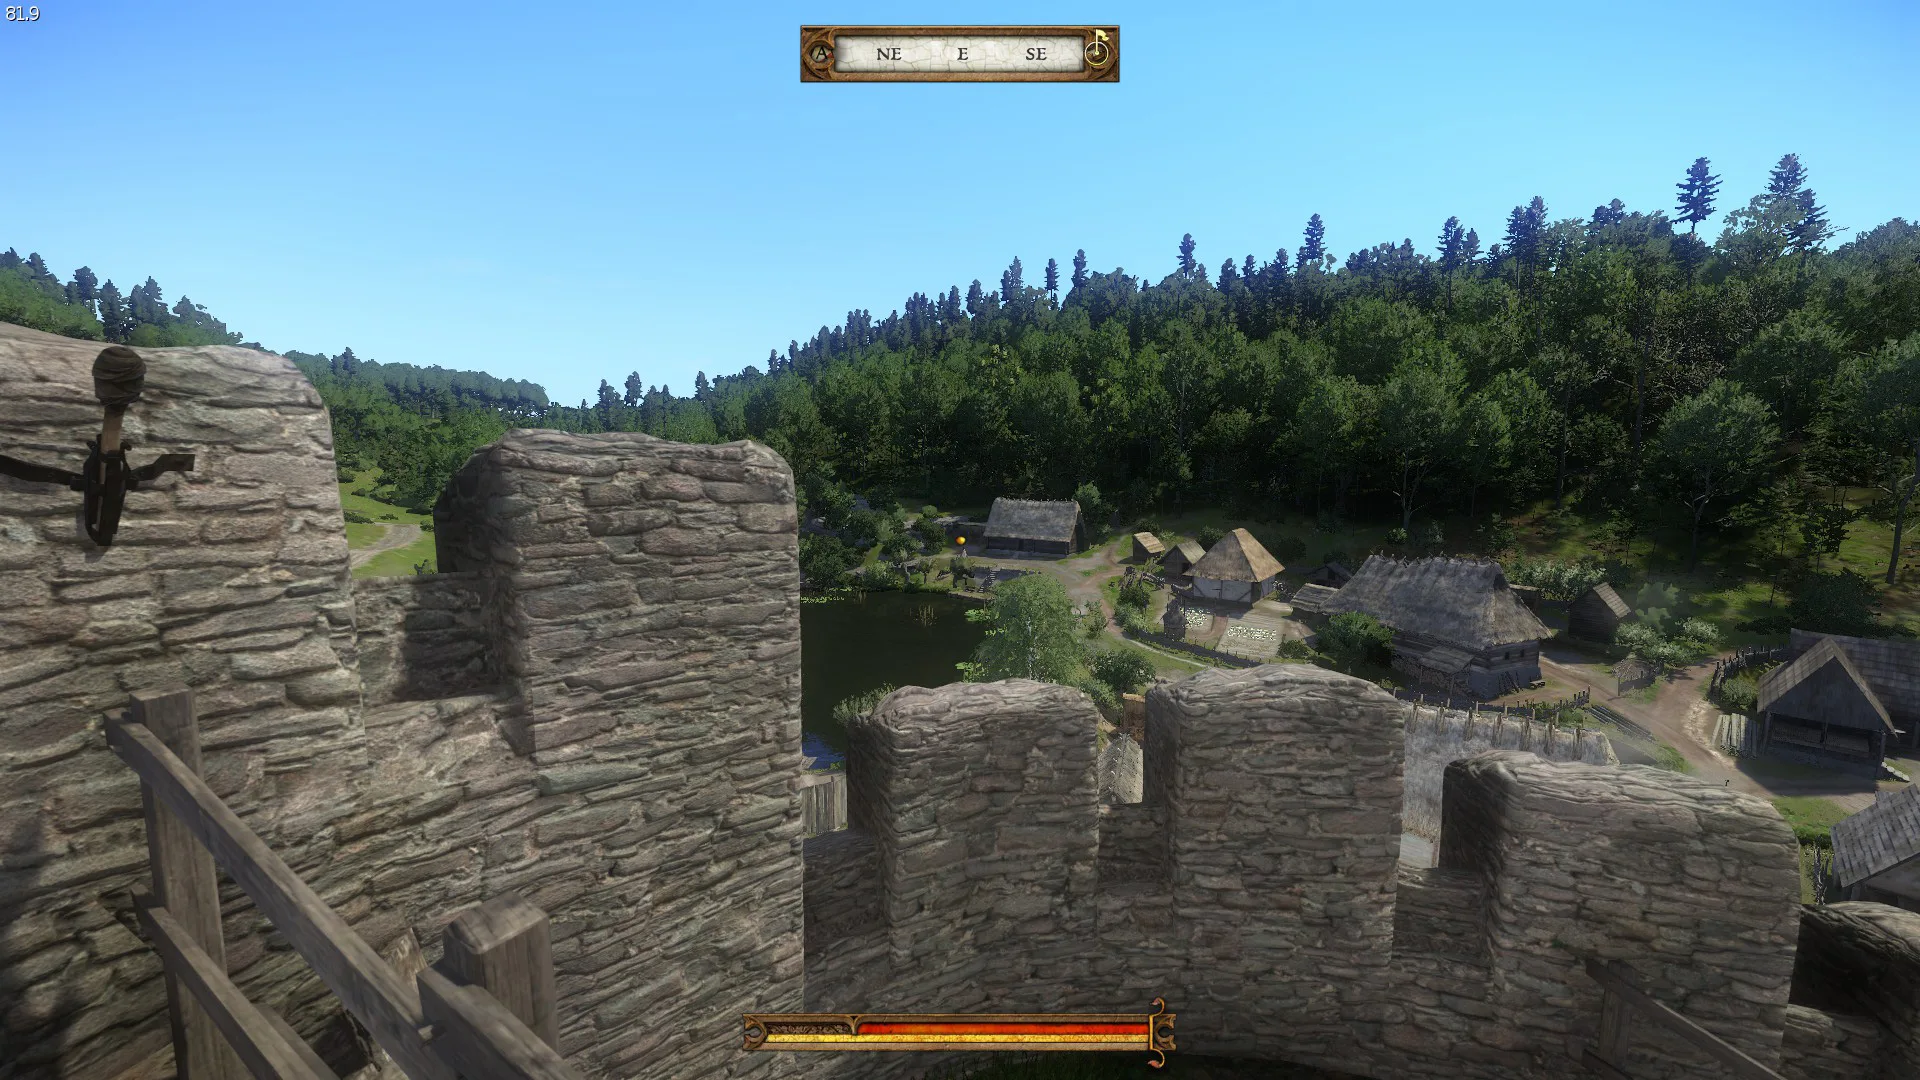
- Kingdom Come: Deliverance
- World of Warcraft (PC Mark 8)
- Battlefield 3 (PC Mark 8)
Synthetic Benching Suites
- SiSoft Sandra 2017
- PC Mark 10
- PC Mark 8
Nvidia Control Panel settings:
We used MSI’s Afterburner to set the power and temp limits to their maximums.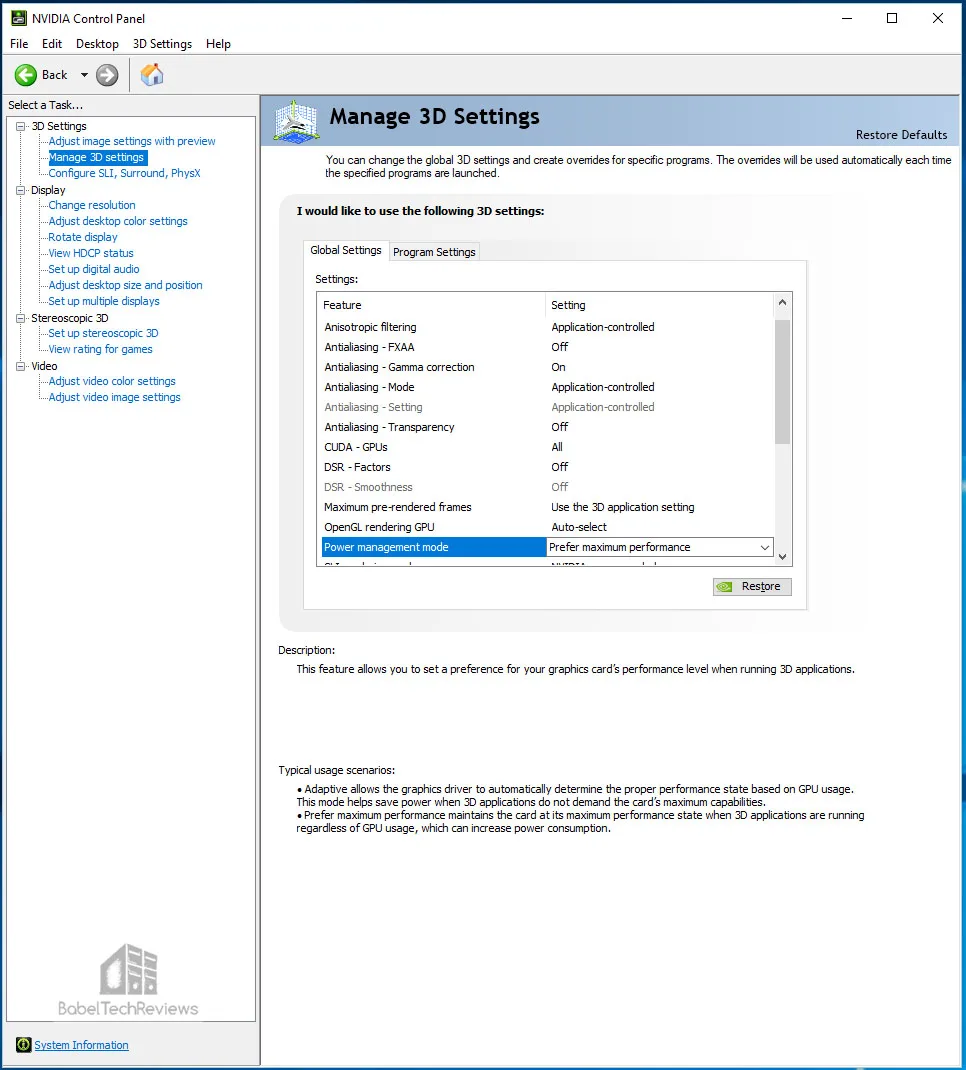
Let’s head to our benching results.
Benchmarking the Team Group 480 GB SSD
Since we used our benching PC with Windows installed on the 480 GB SSD and both 240 GB SSDs, but not installed on the 2TB SSHD or the 1.92 TB SSD, it is not possible to give exact comparisons. And benchmarking SSDs is not an exact science as there is some variability between runs, but together with the real world and synthetic tests, it will be possible to get a good idea of relative performance across all 5 drives.
First, we will will look at synthetic benchmarks to highlight the differences between our drives.
PCMark 8 & 10 (Futuremark)
Futuremark is well-respected as a developer and publisher of PC benchmark applications for nearly two decades. Although PCMark are synthetic tests, they provide a good measure of system performance. PCMark 10 is Futuremark’s seventh major update to the PCMark series. PCMark 10 is developed for Windows 10 and it builds upon the PCMark 8 platform for a complete package of vendor-neutral and easy-to-use benchmarks for home or office environments.
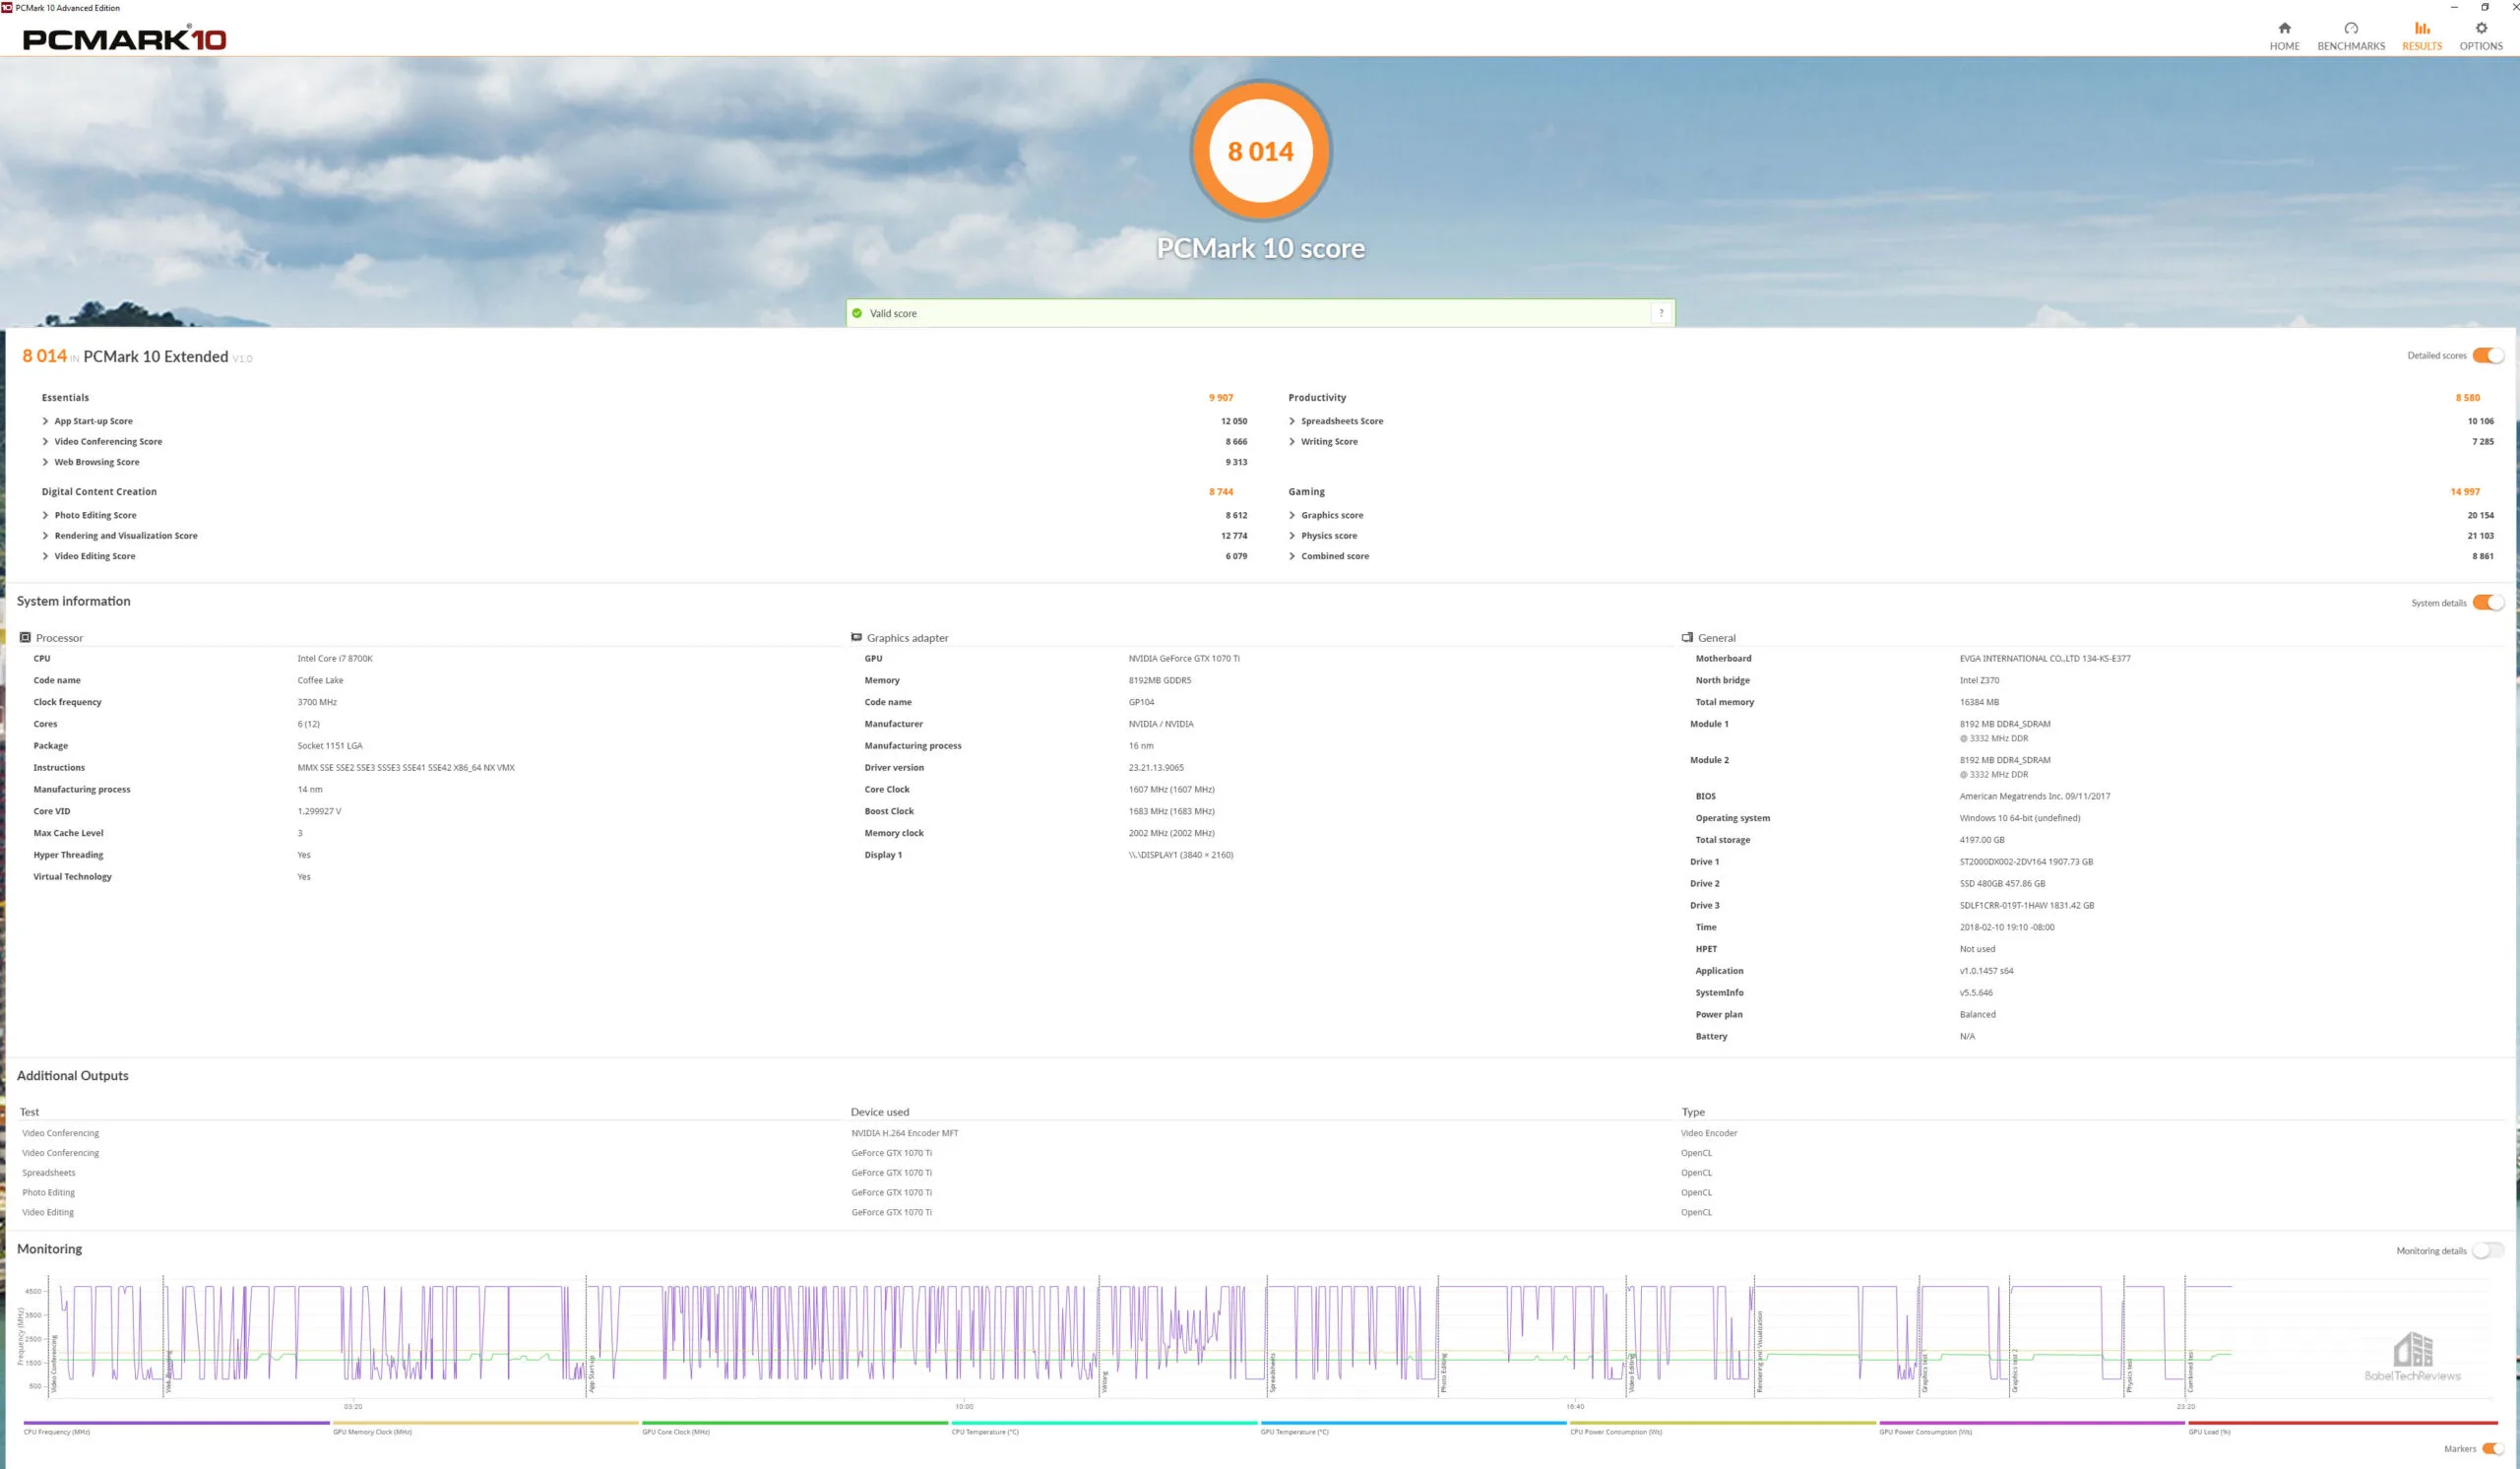
In comparison to PC Mark 8, PC Mark 10 is missing key elements including detailed storage testing, and it is not possible to test attached drives as with the earlier suite. We hope that Futuremark updates 10 as they promised. We benchmark using the Extended settings.
The Team Group 480 GB SSD scores a respectable 8014.
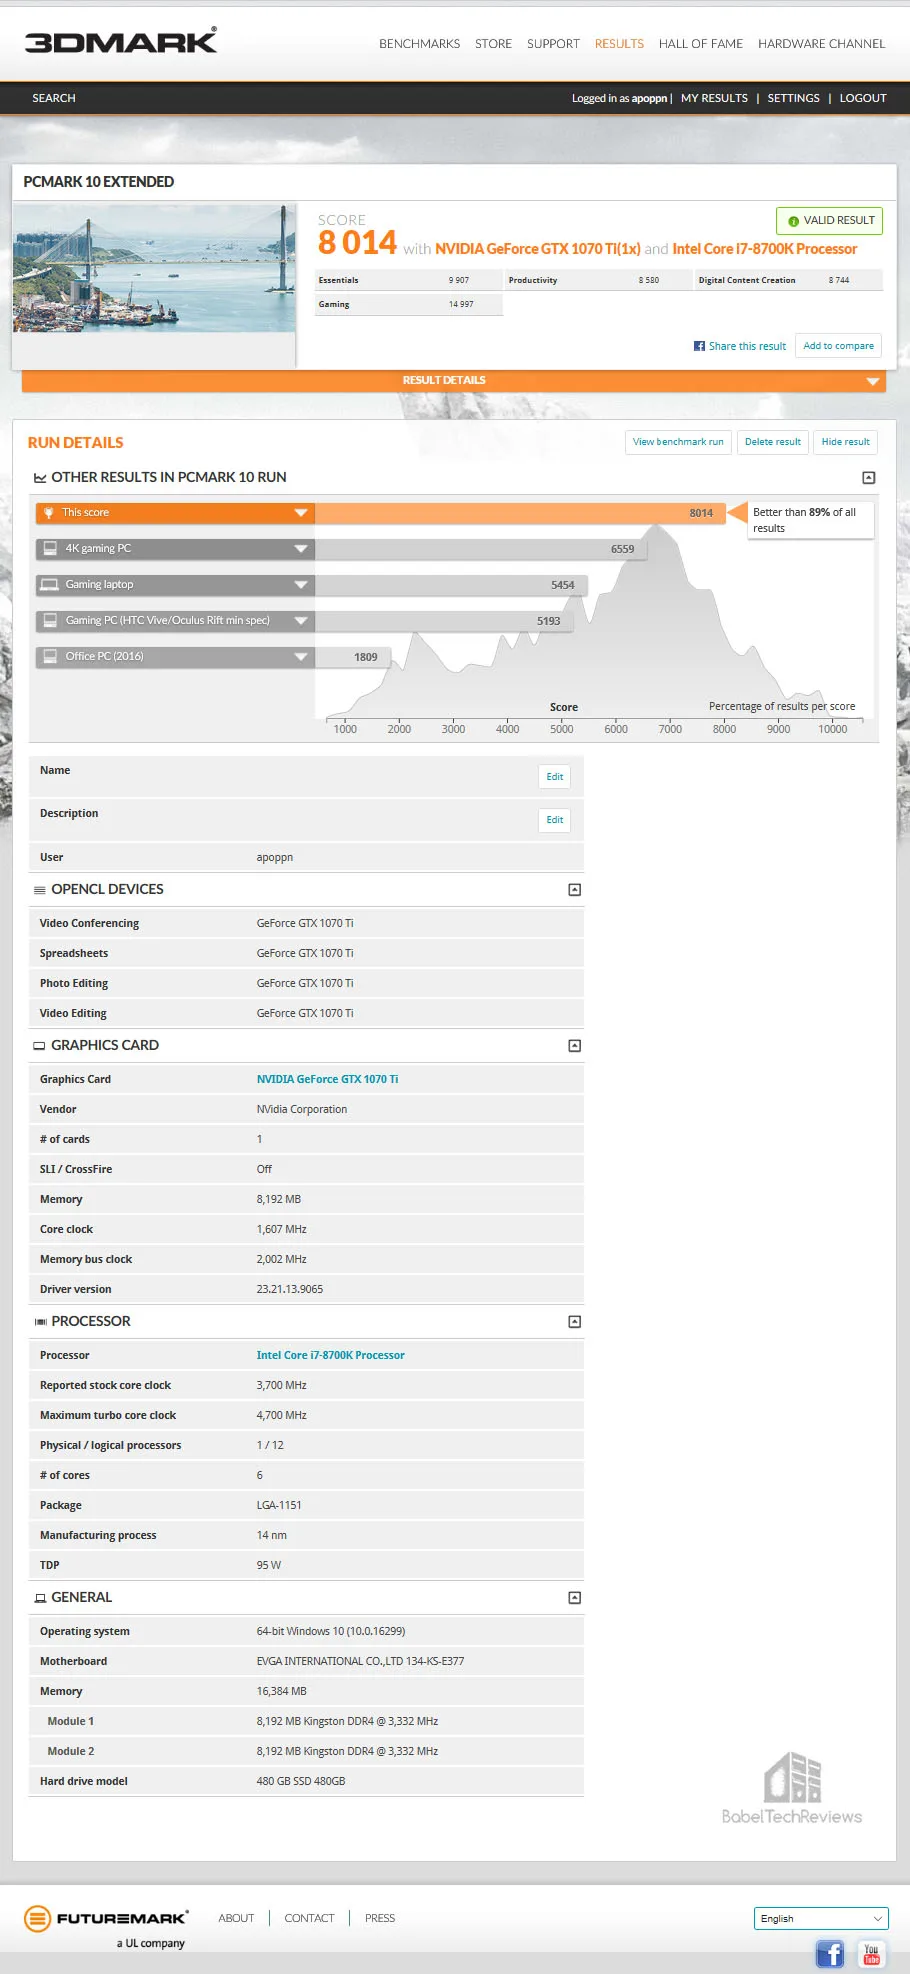
 Here is the same test validated online.
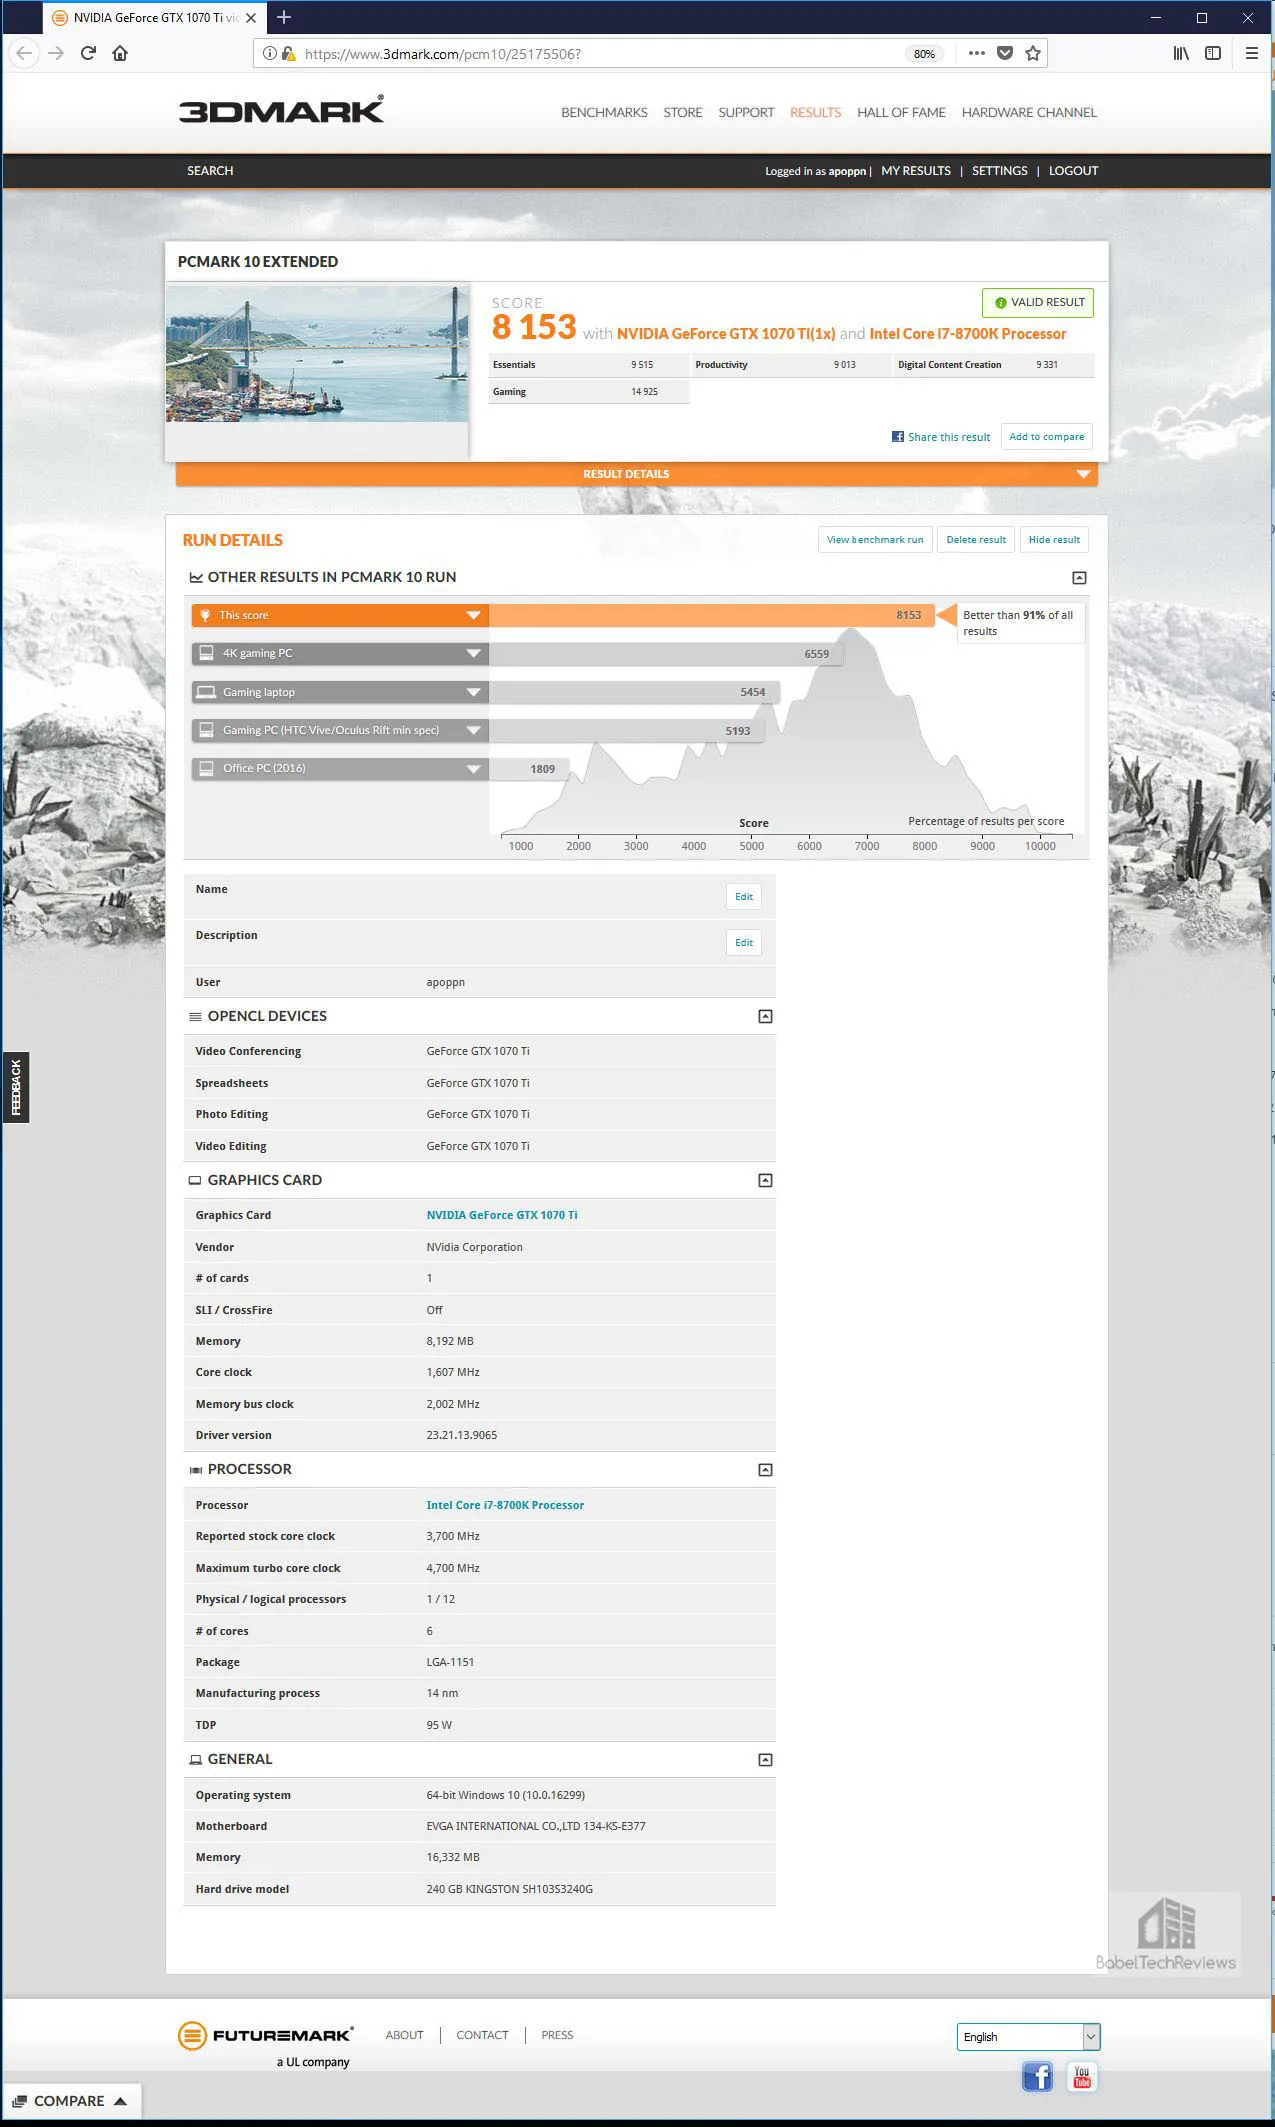
The 240 GB HyperX SSD (Brown) scores 8153 and here is the online validation.
The 240 GB HyperX SSD Blue was Kingston’s flagship HyperX SSD a few years ago by virtue of its faster memory, but it actually scores less than its less expensive cousin at 7959.
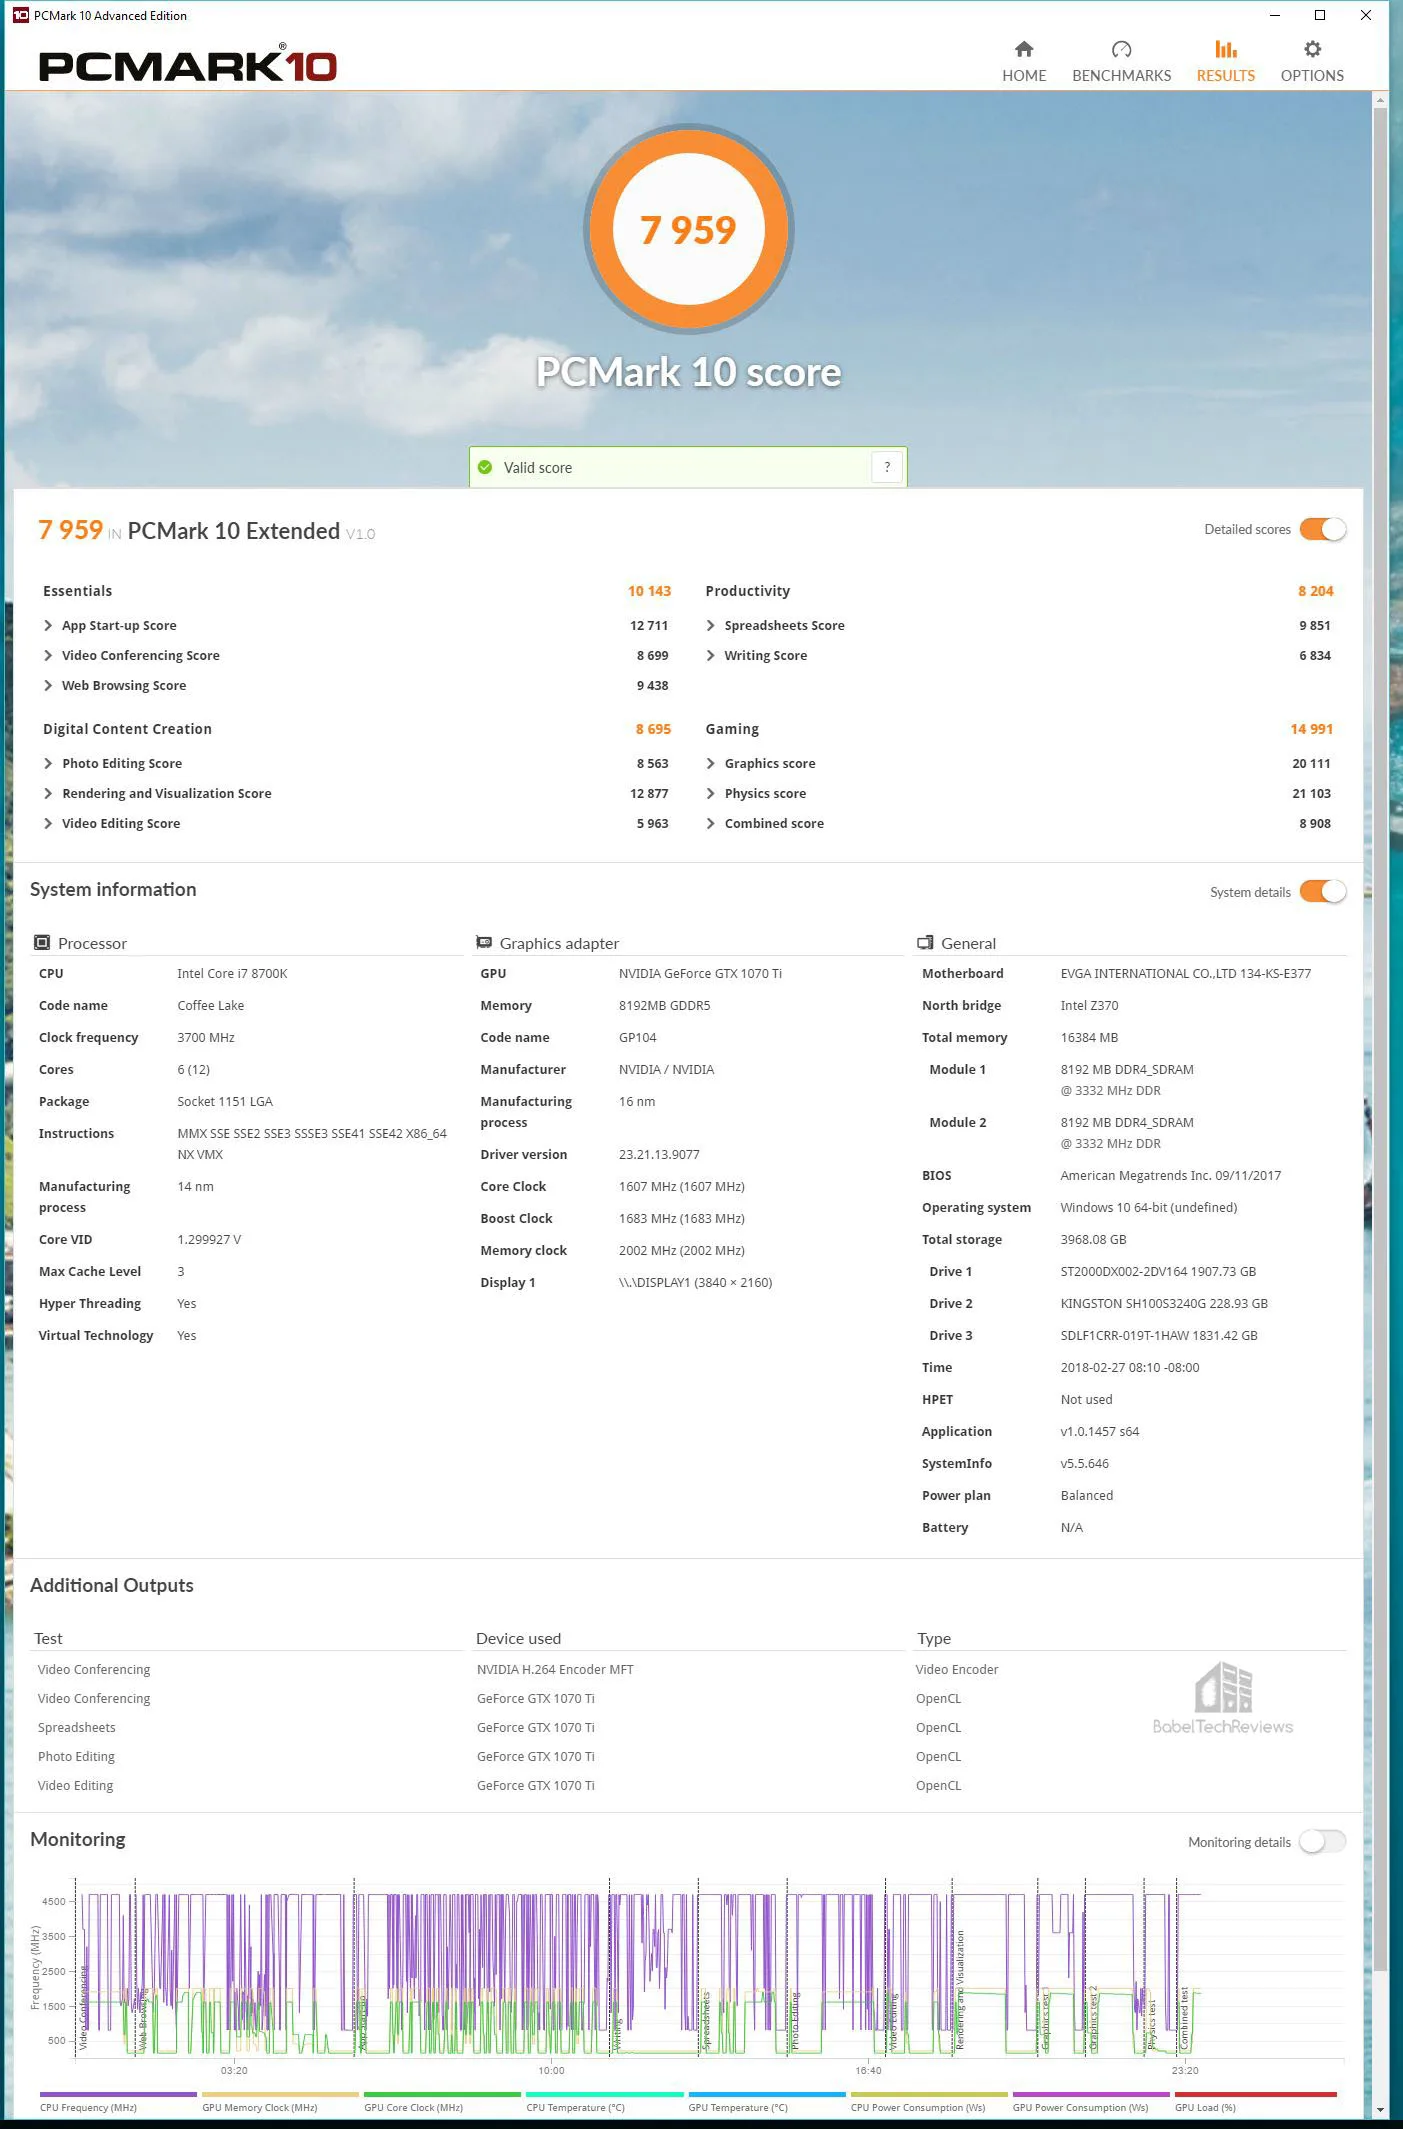
Here is the online verification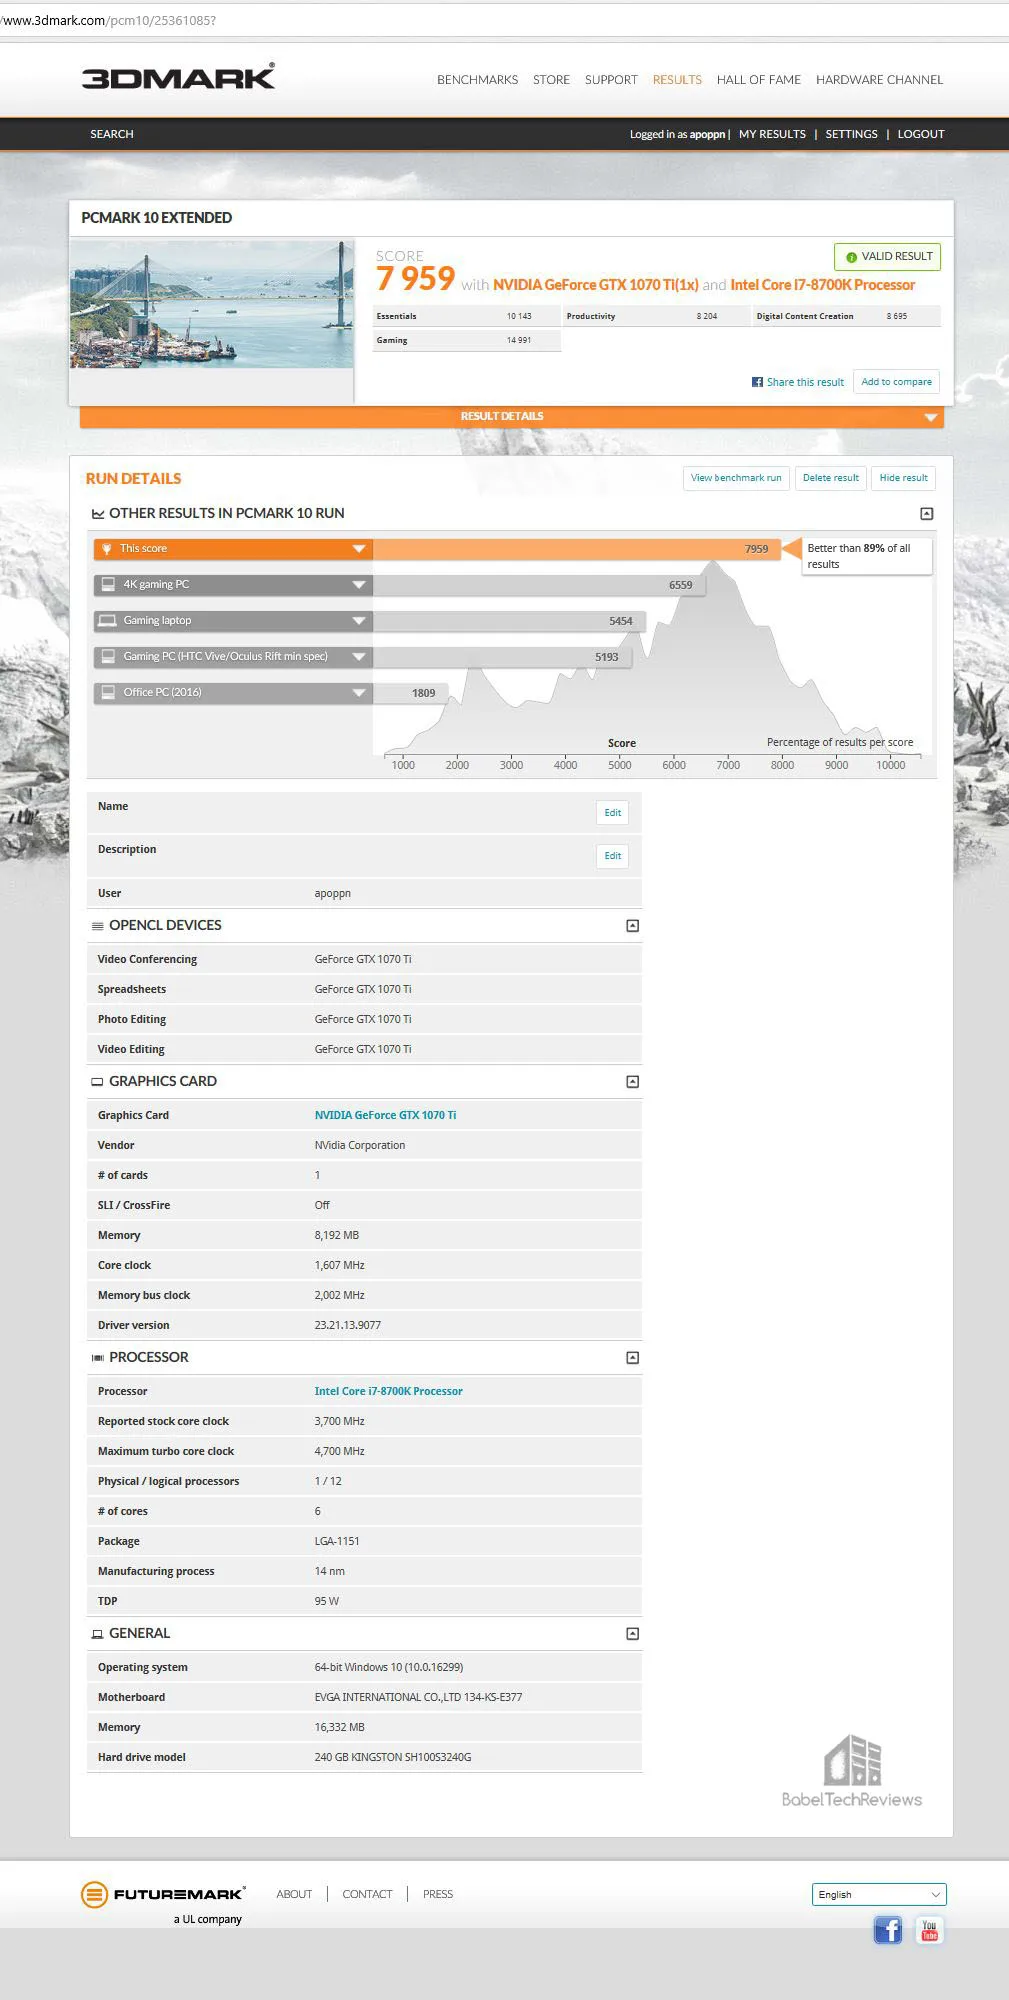
Neither the 2 TB SSHD nor the 1.92 SSD are set up with Windows installed so we default to a much better storage test in PC Mark 8.
PCMARK 8
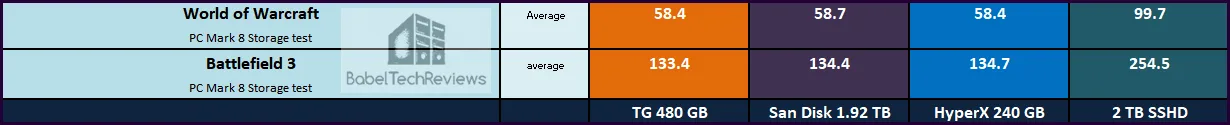
PCMark 8 has an excellent storage test which actually uses real world timed benchmarks which include loading World of Warcraft and Battlefield 3 as well as timing how long it takes to load Adobe apps.
Here is the Team Group 480 GB SSD storage test with 4960 or 255.07 MB/s bandwidth.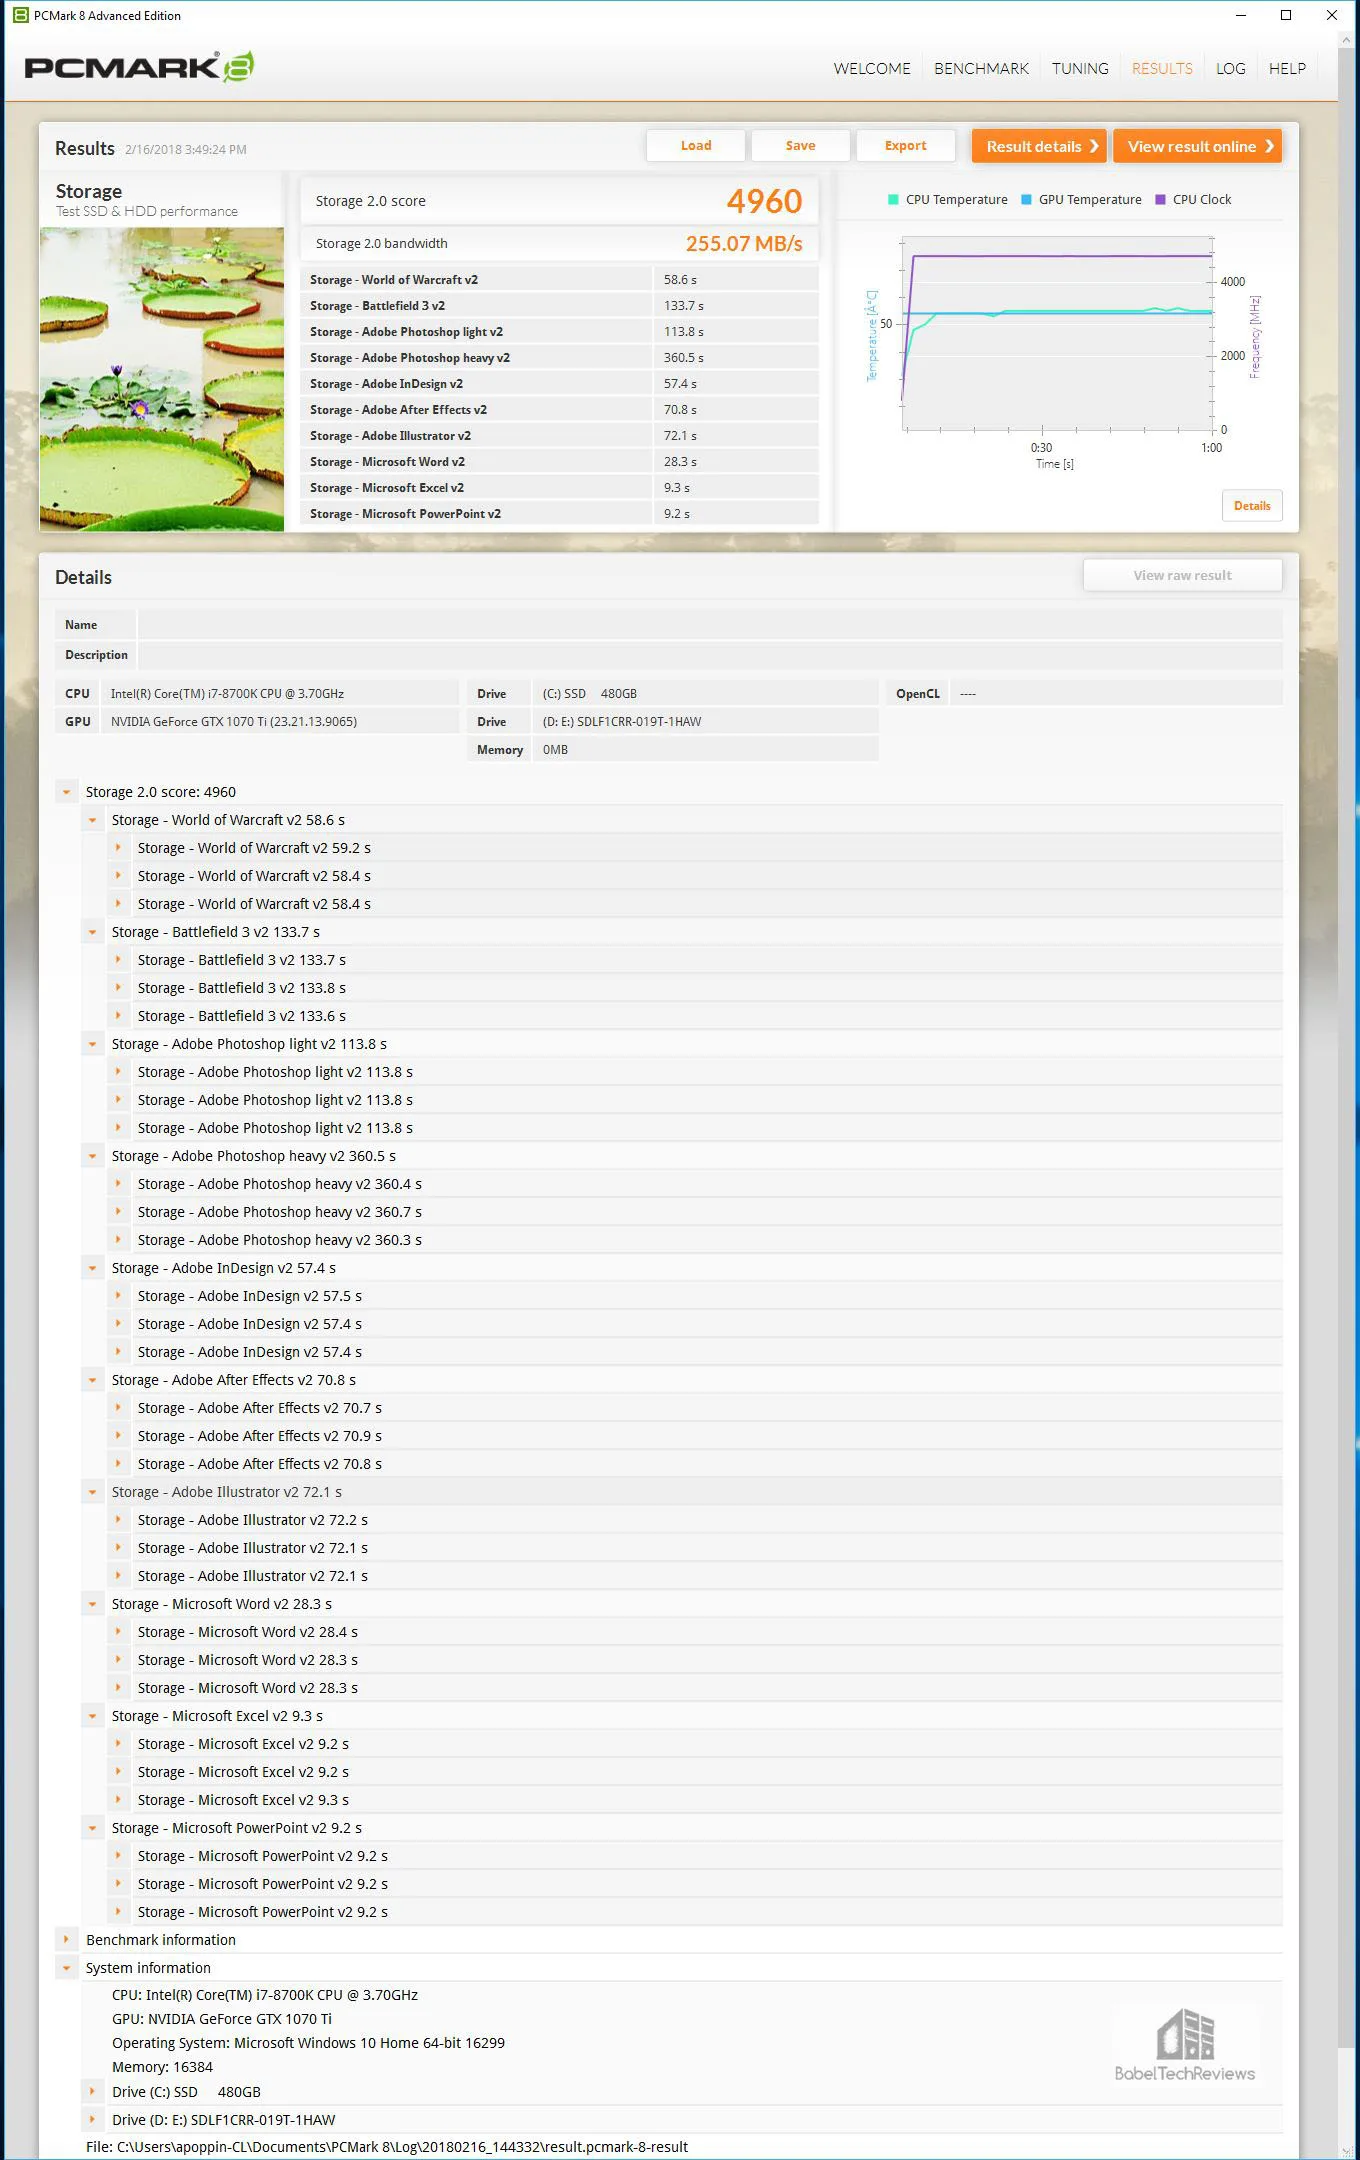
Here is the TG 480 GB online storage test summarized, and most importantly for a gamer, it took 58.4 seconds to load World of Warcraft and 133.4 seconds for Battlefield 3 to load.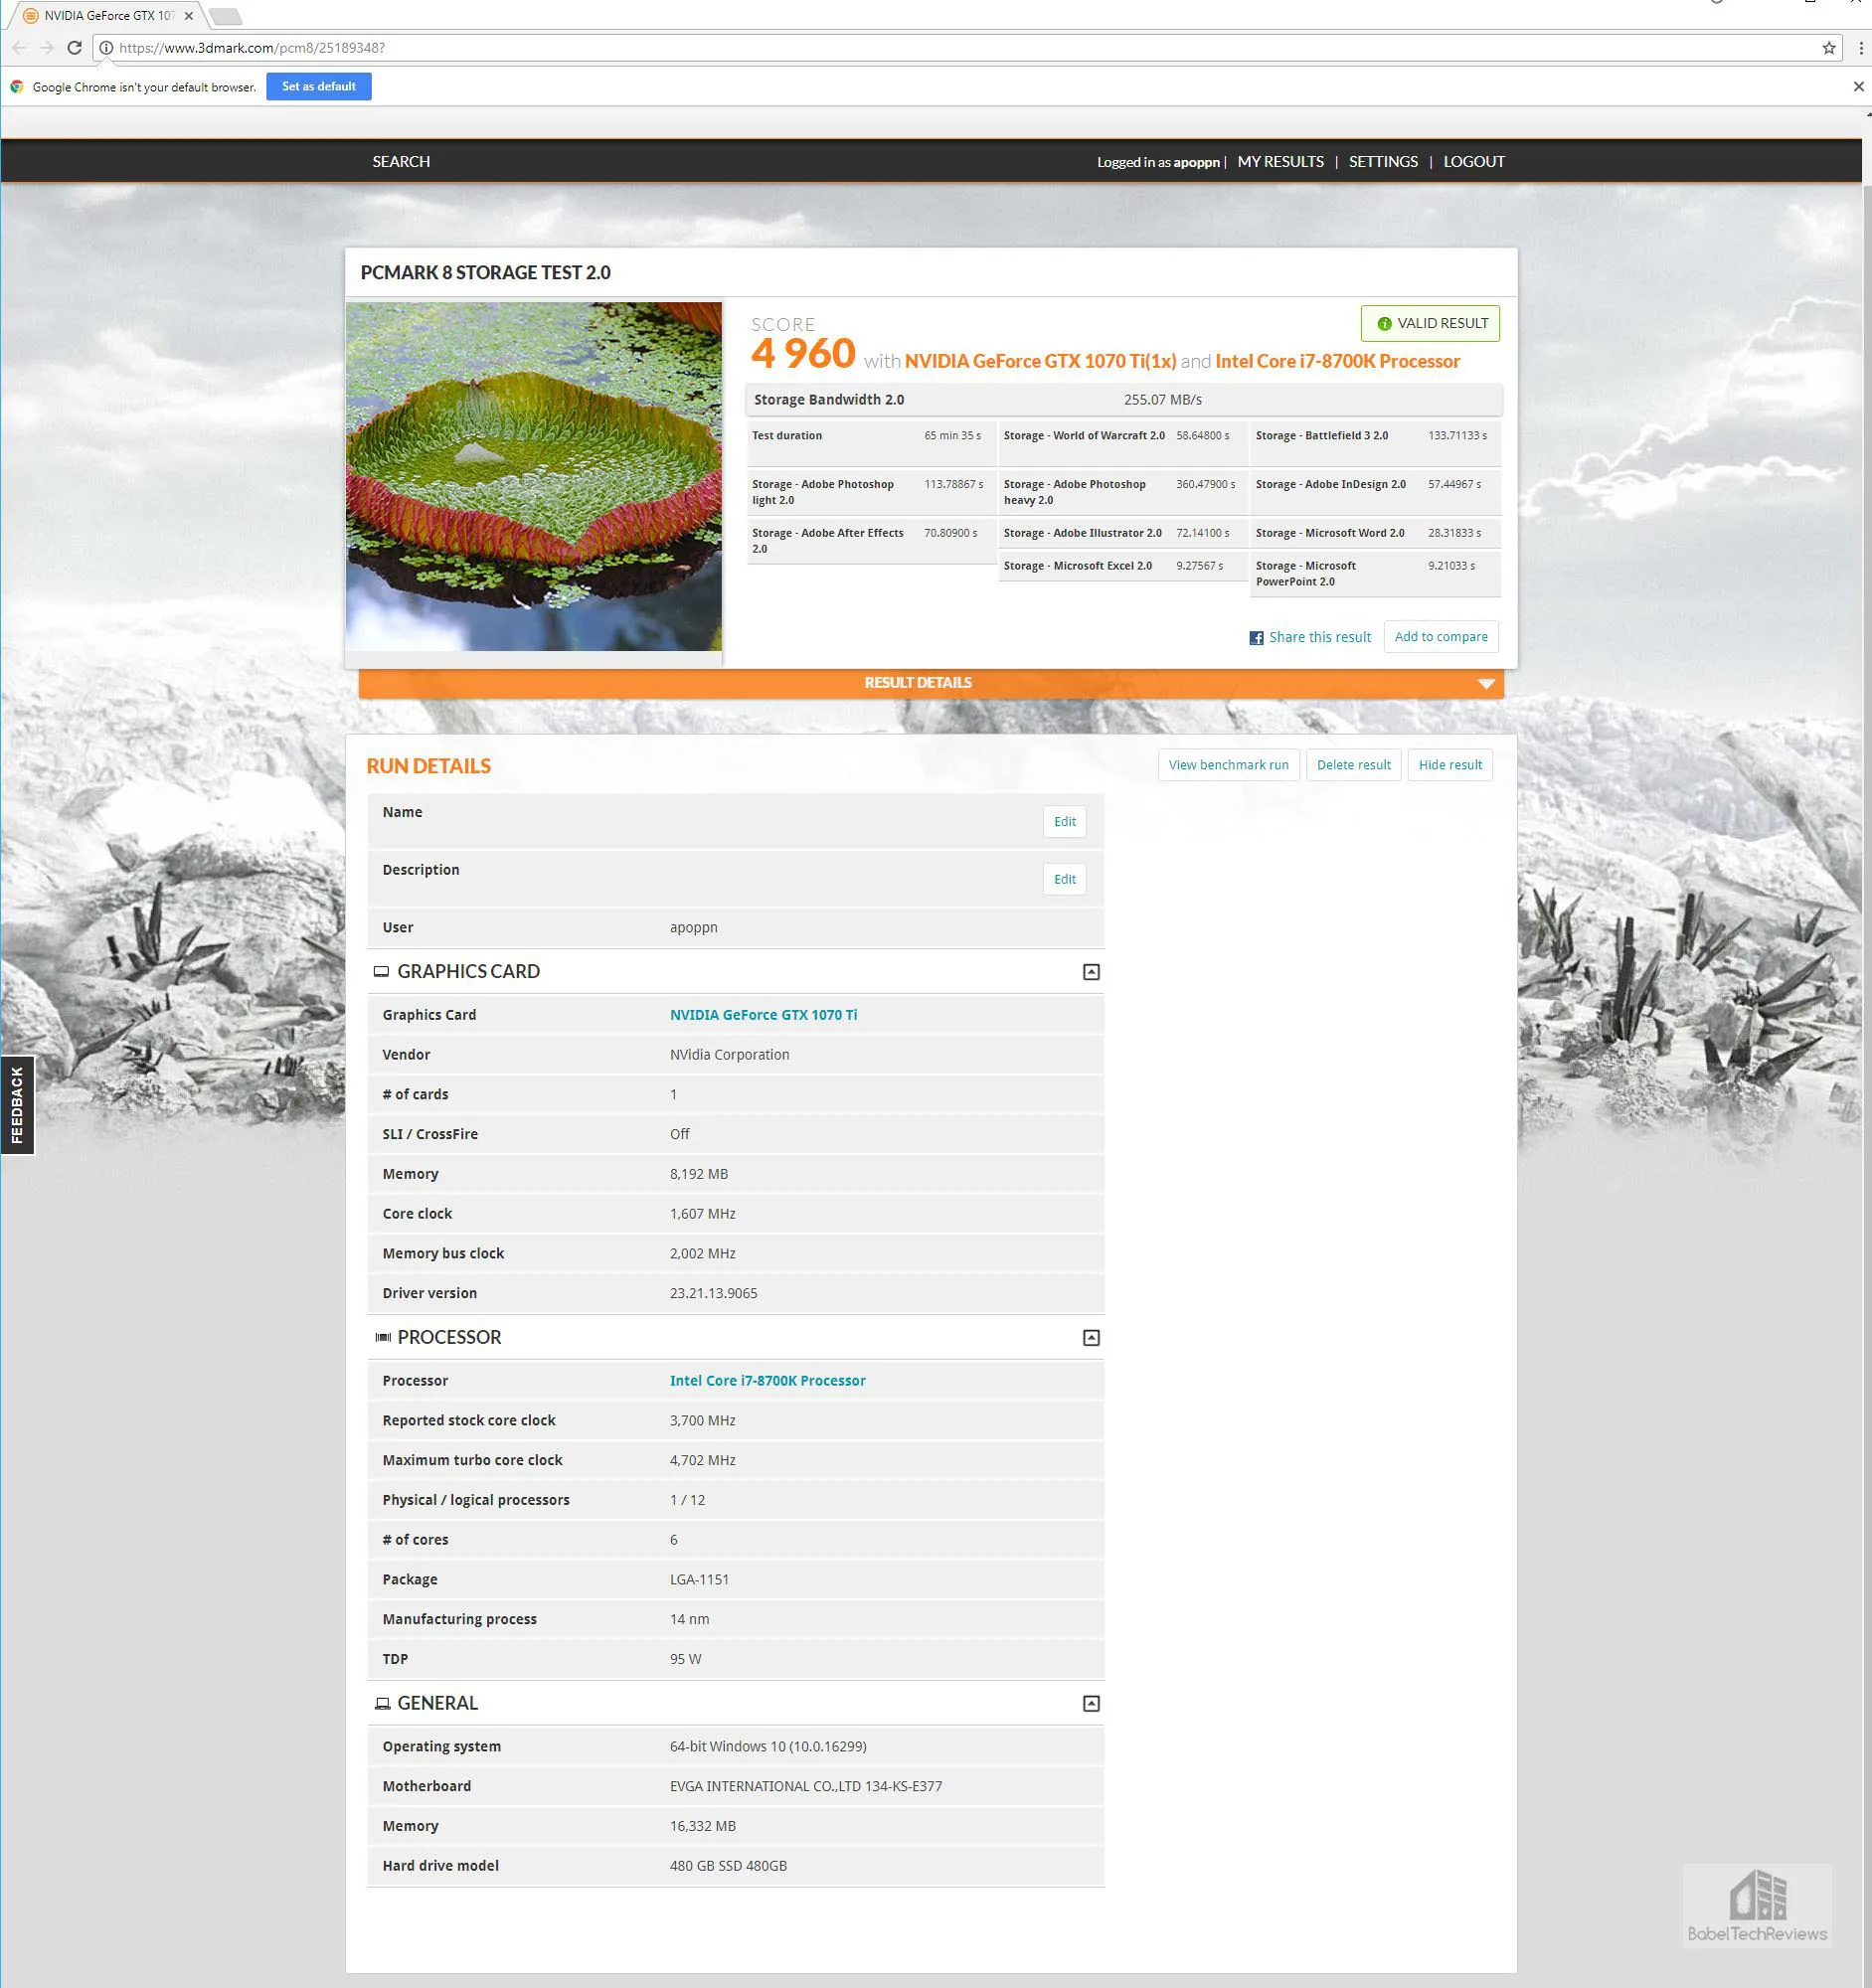
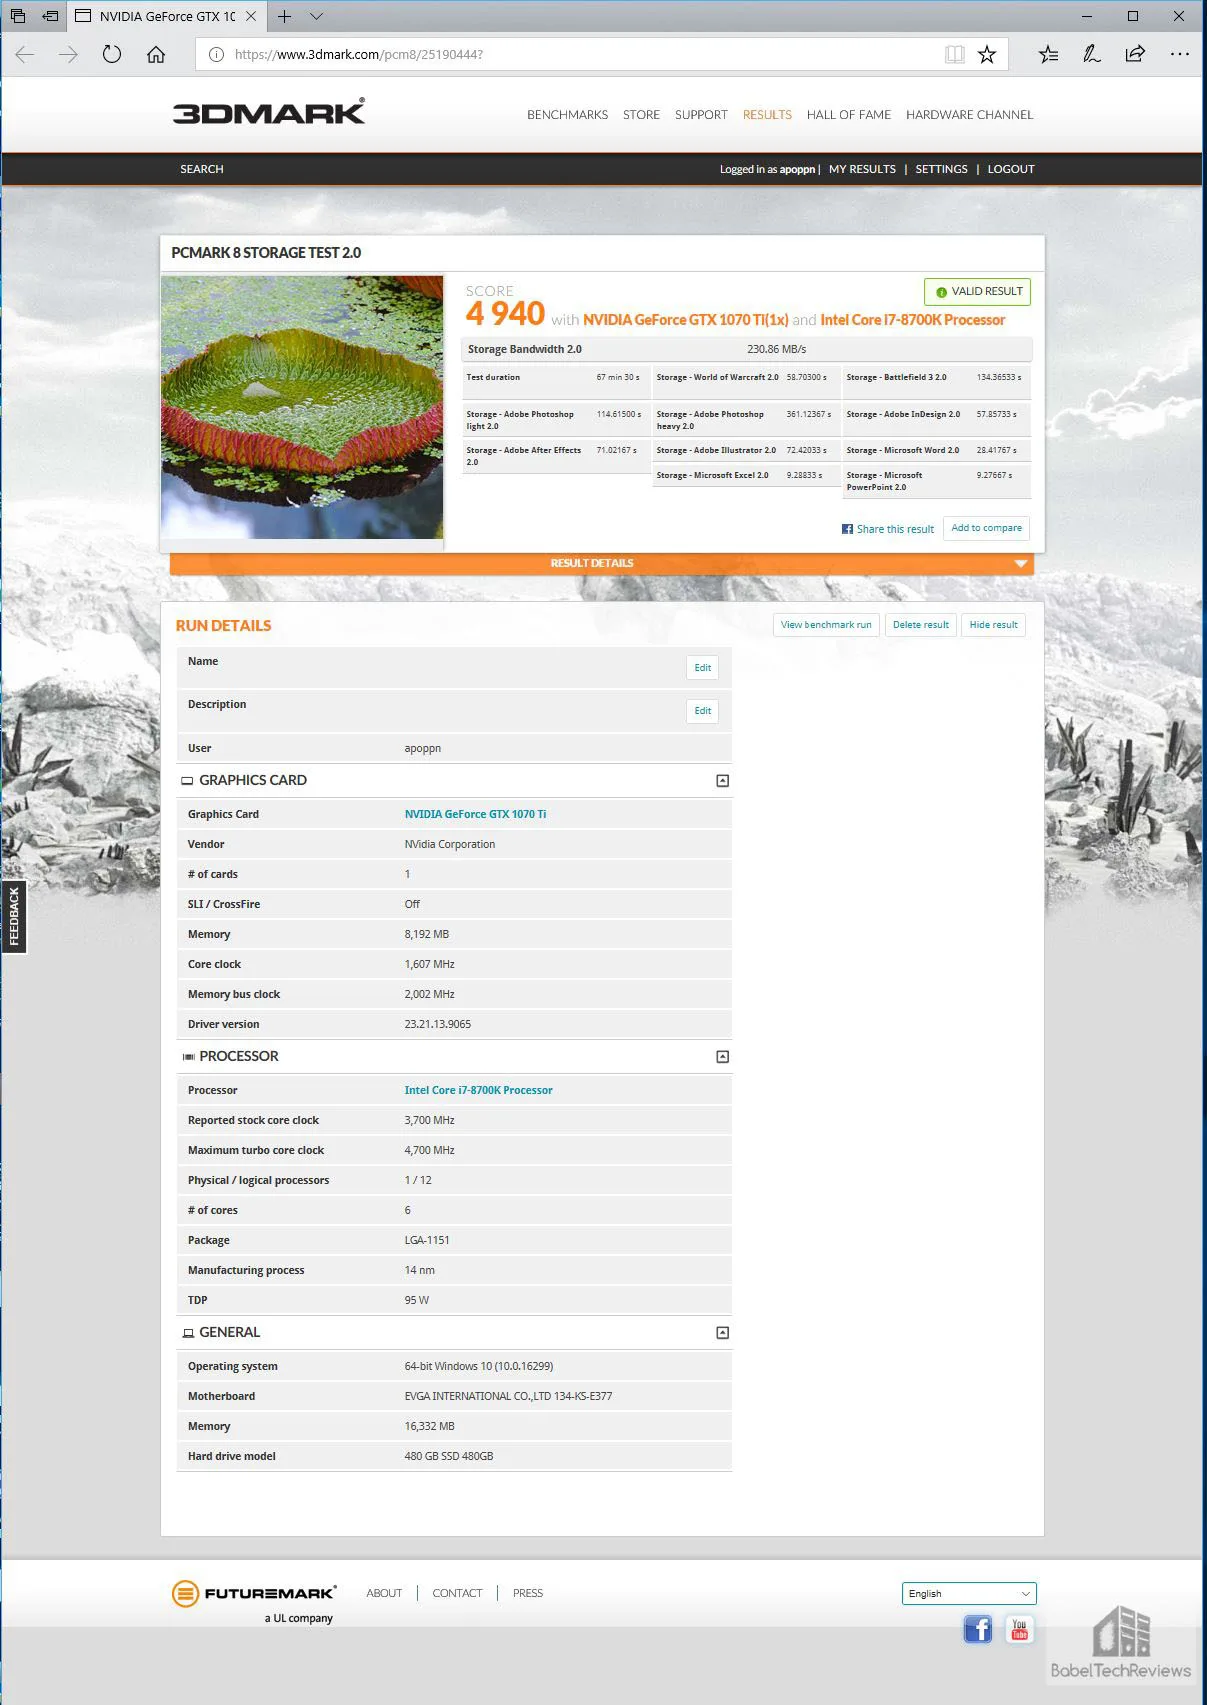
Here is the SanDisk 1.92 GB SSD storage test scoring 4940 and 230.86 MB/s bandwidth.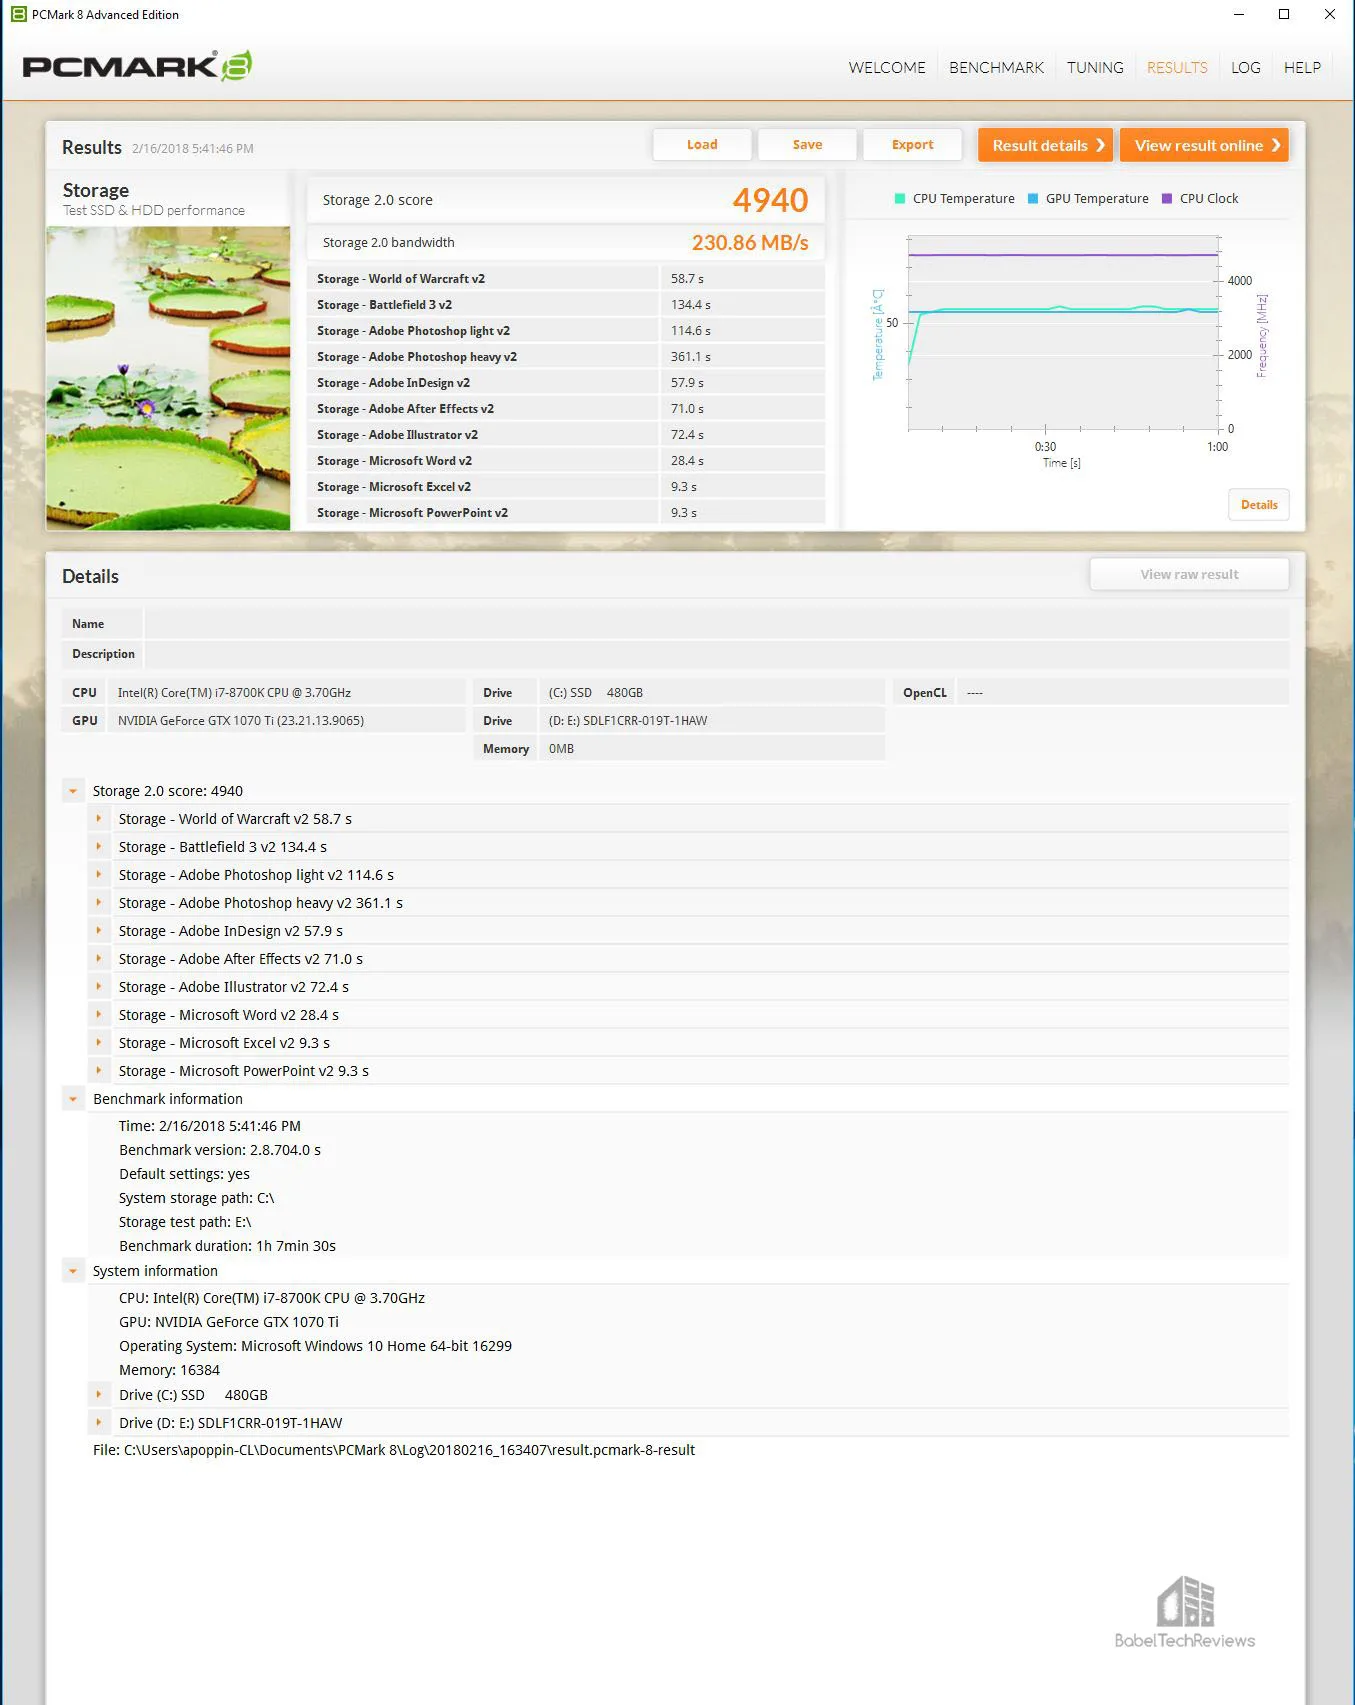
Here is the 1.92 GB SanDisk SSD online storage test summarized, and most importantly for a gamer, it took 58.7 seconds to load World of Warcraft and 134.4 seconds for Battlefield 3 to load.
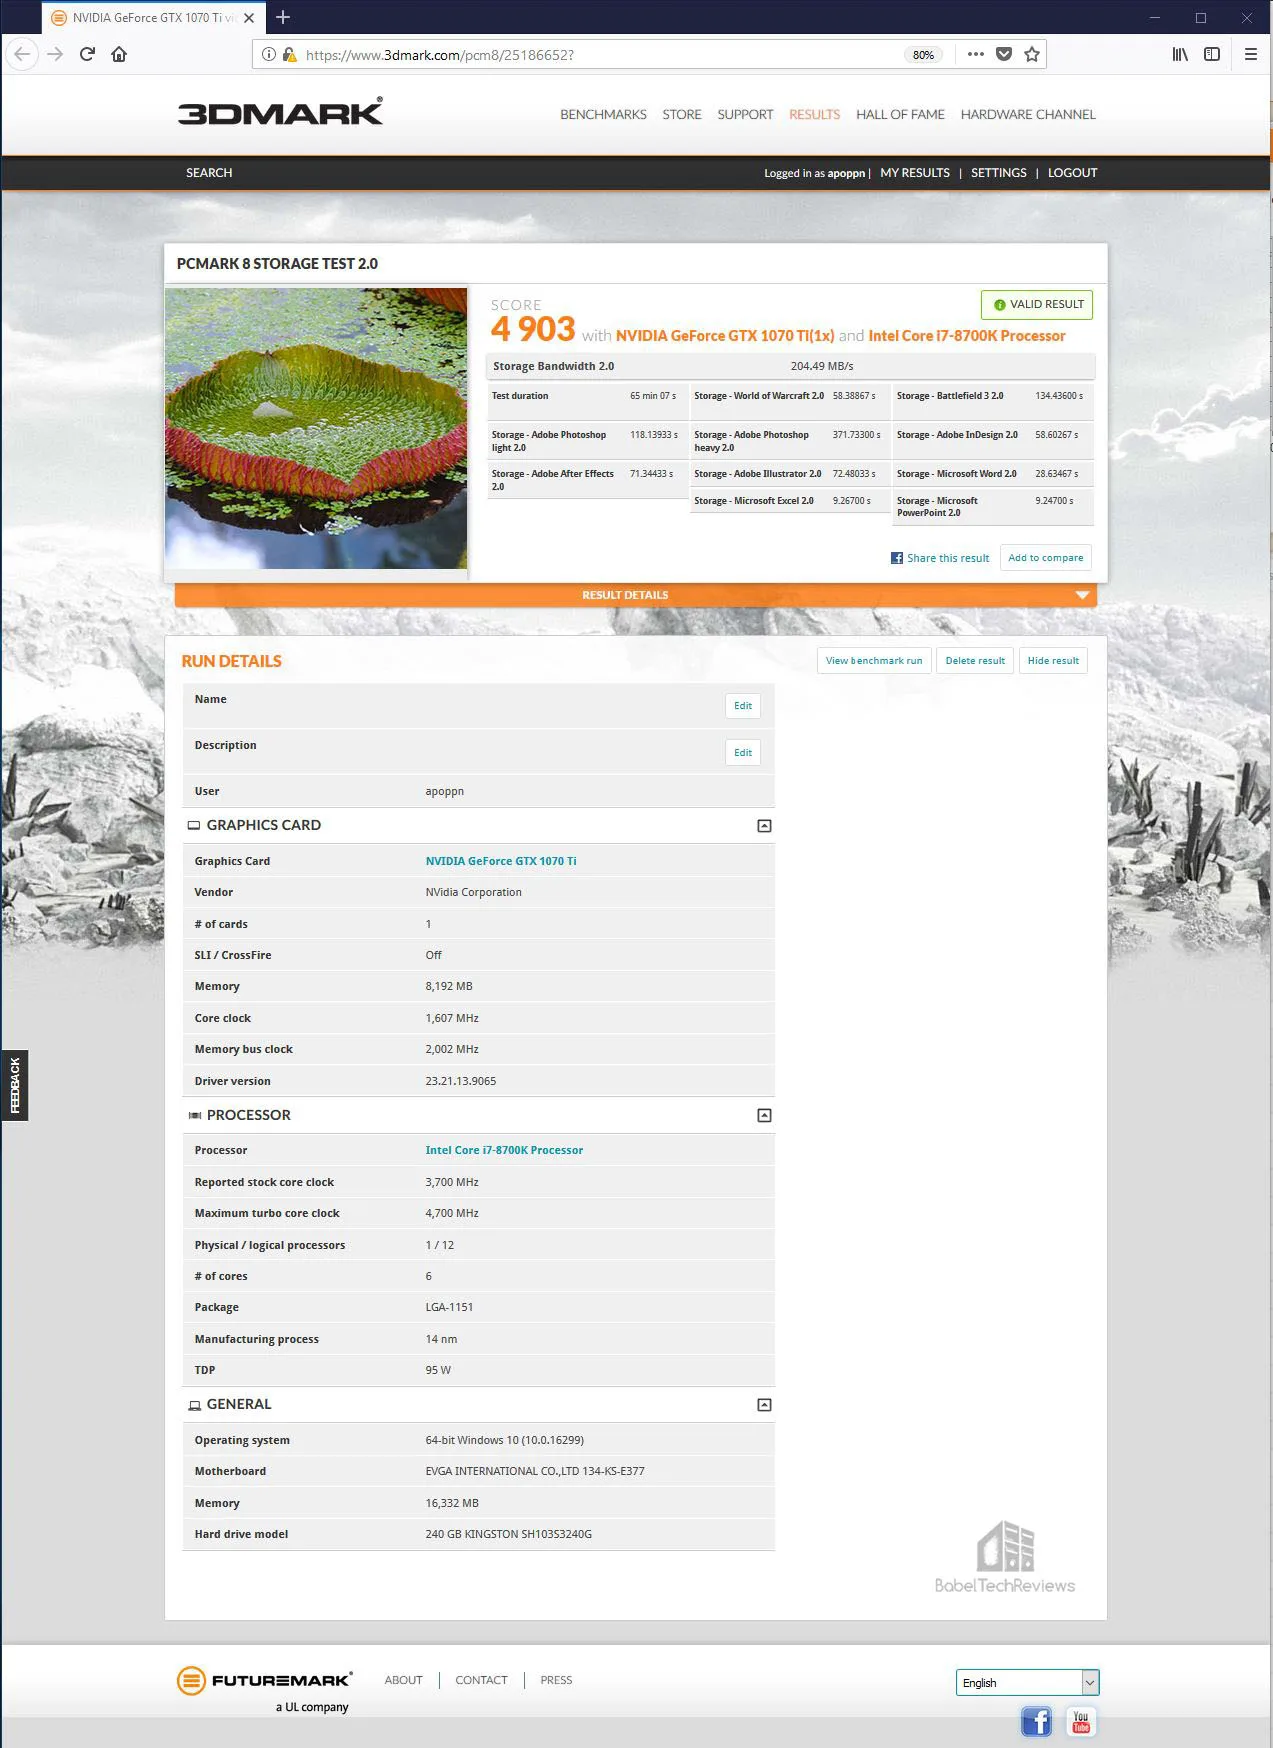
Here are the 240 GB HyperX (brown) SSD storage test scoring 4903 and 204.49 MB/s bandwidth.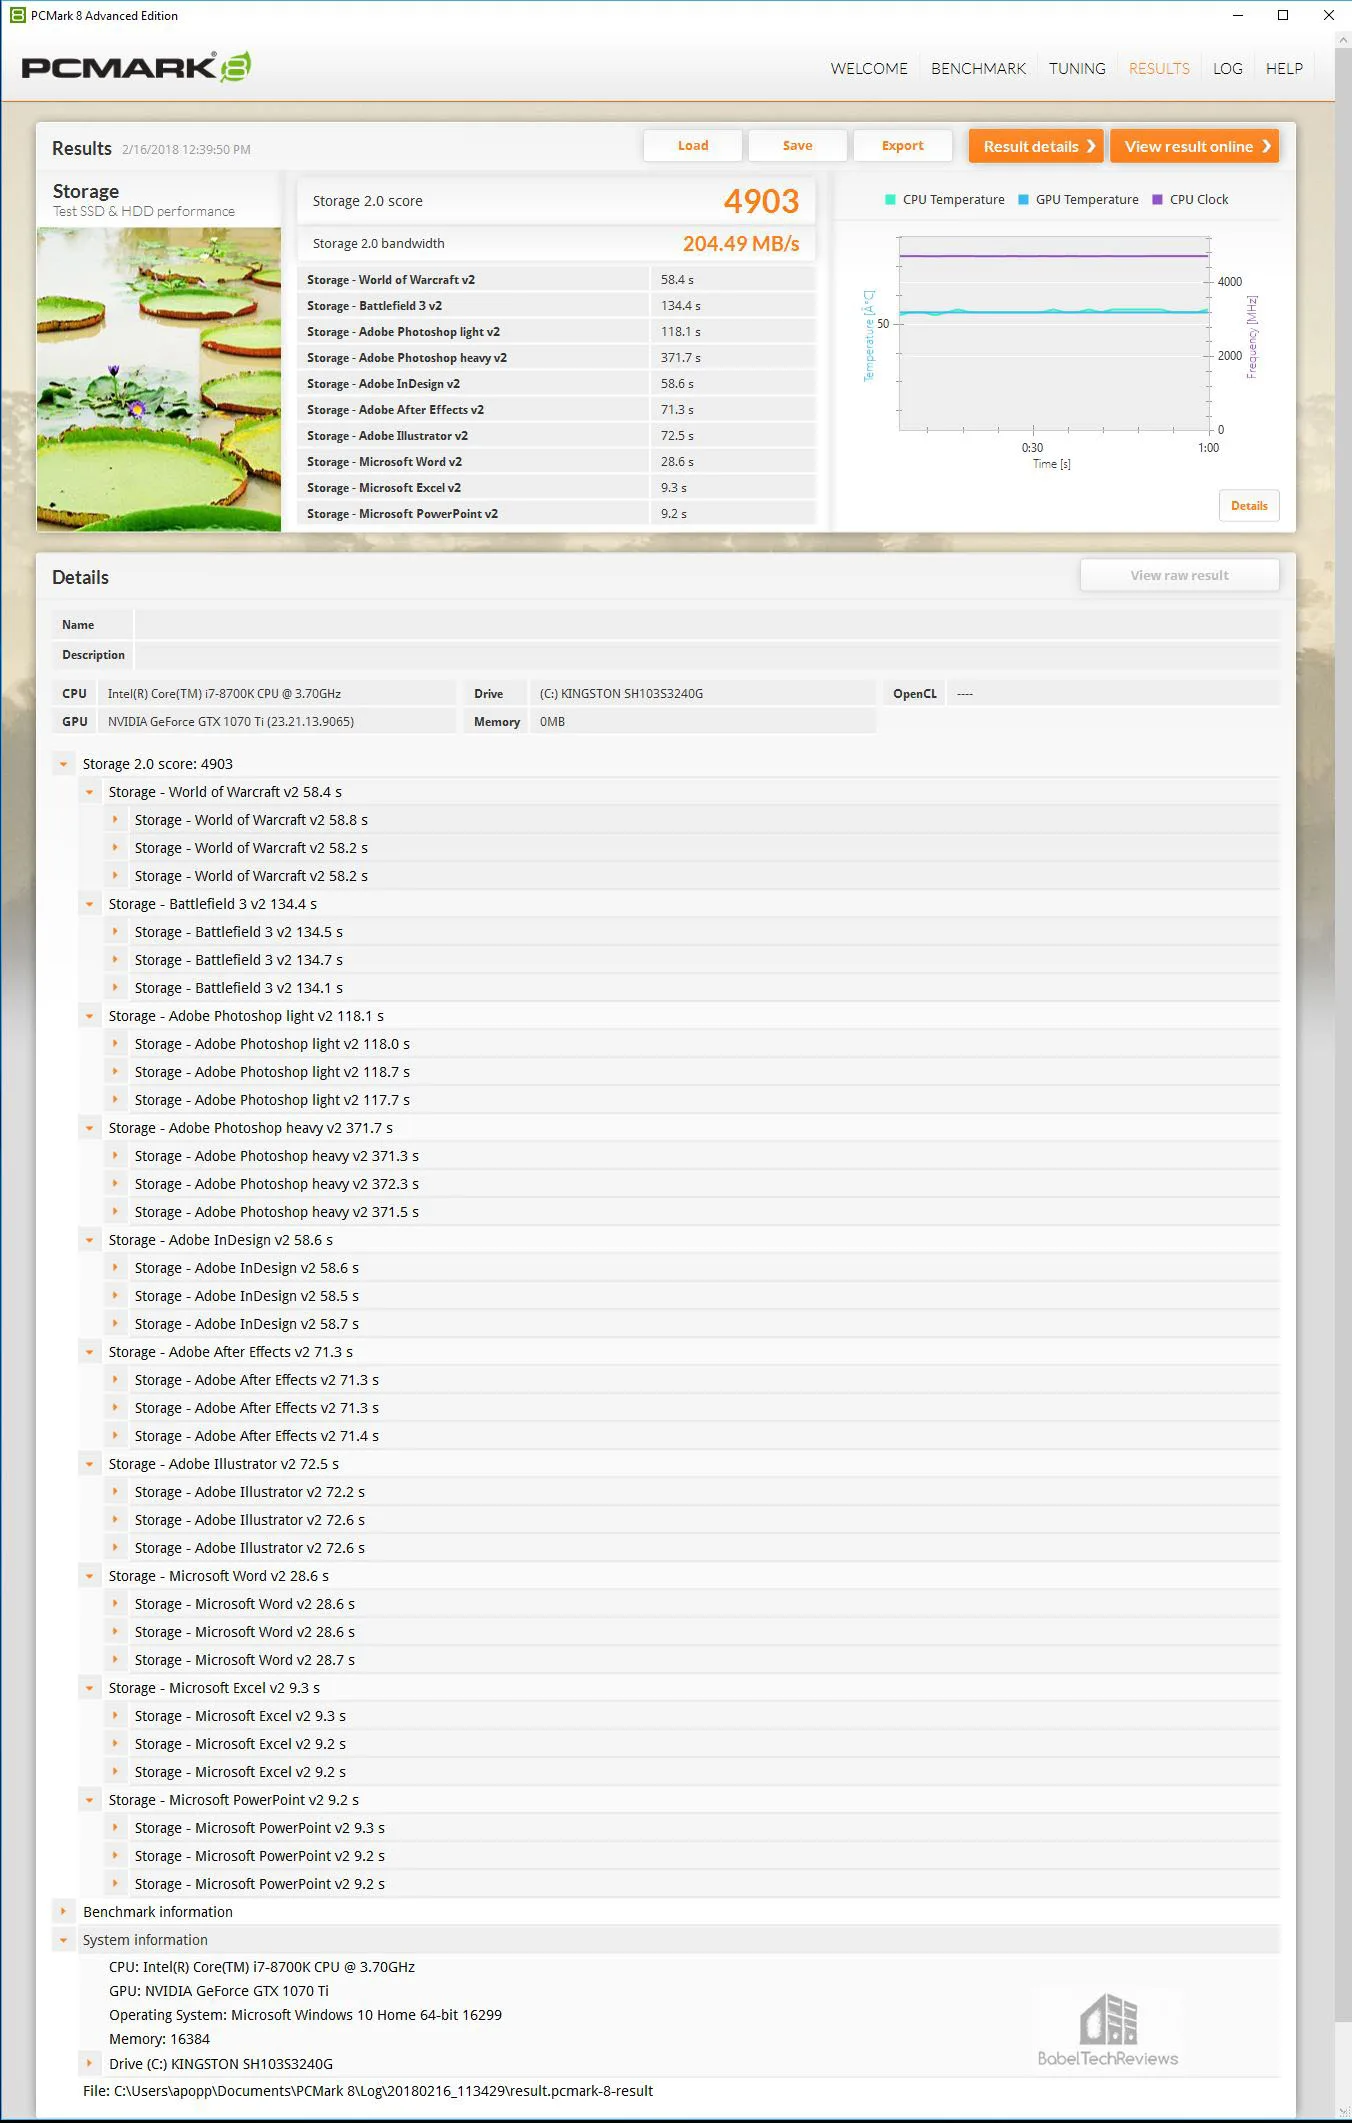
Here are the HyperX online storage test results summarized, and most importantly for a gamer, it took 58.4 seconds to load World of Warcraft and 134.4 seconds for Battlefield 3 to load.
Here are the 240 GB HyperX SSD Blue storage test scoring 4902 and 204.51 MB/s bandwidth.
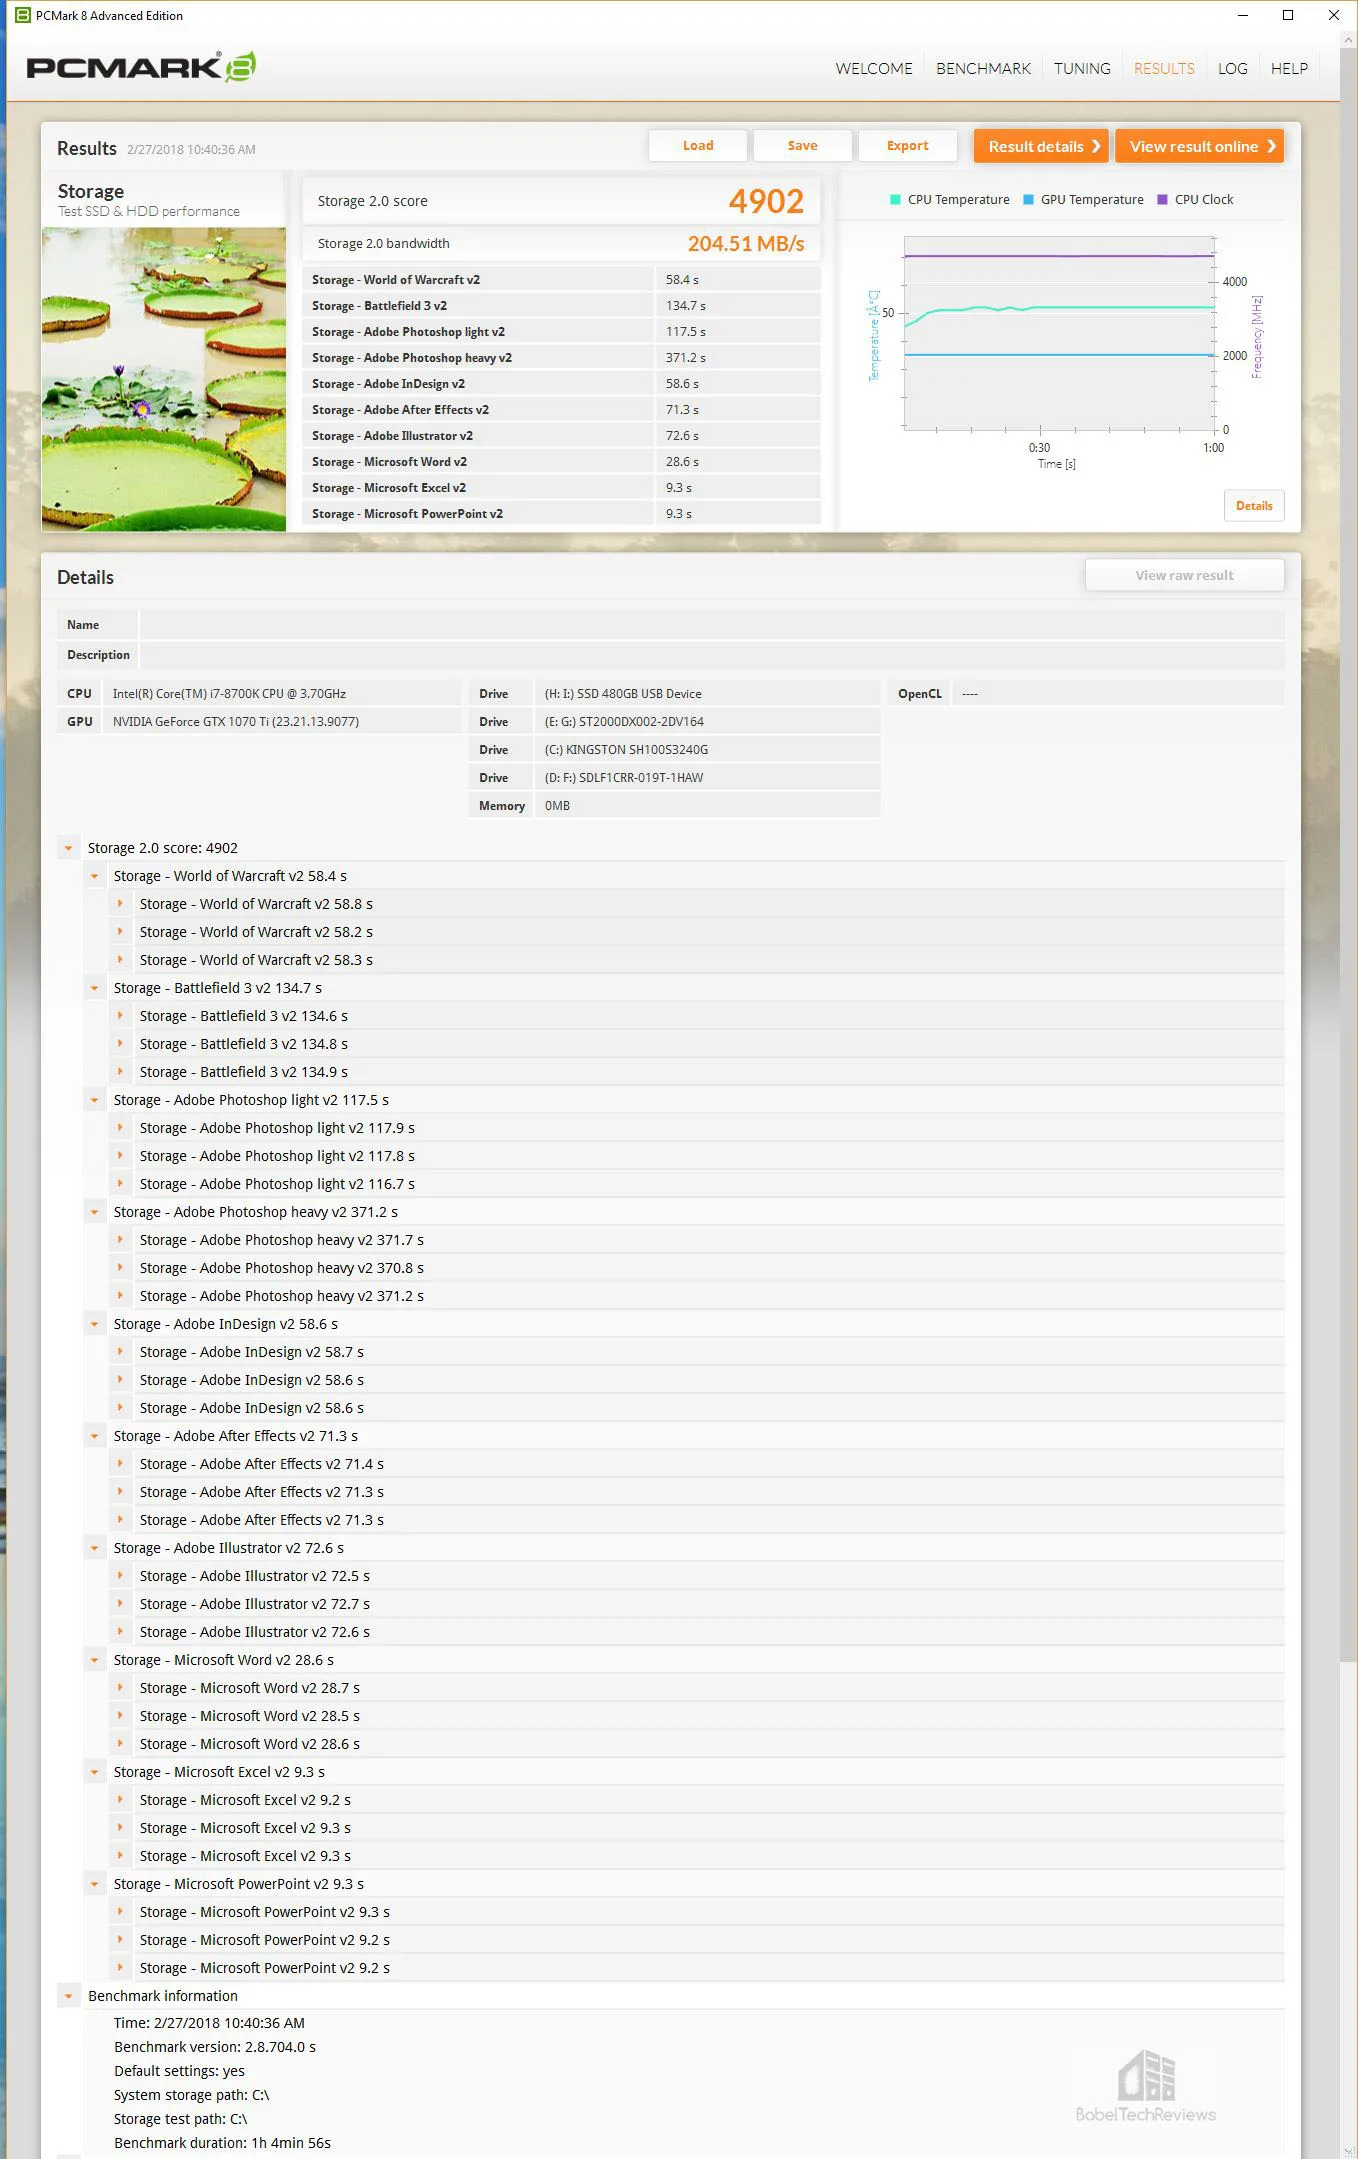
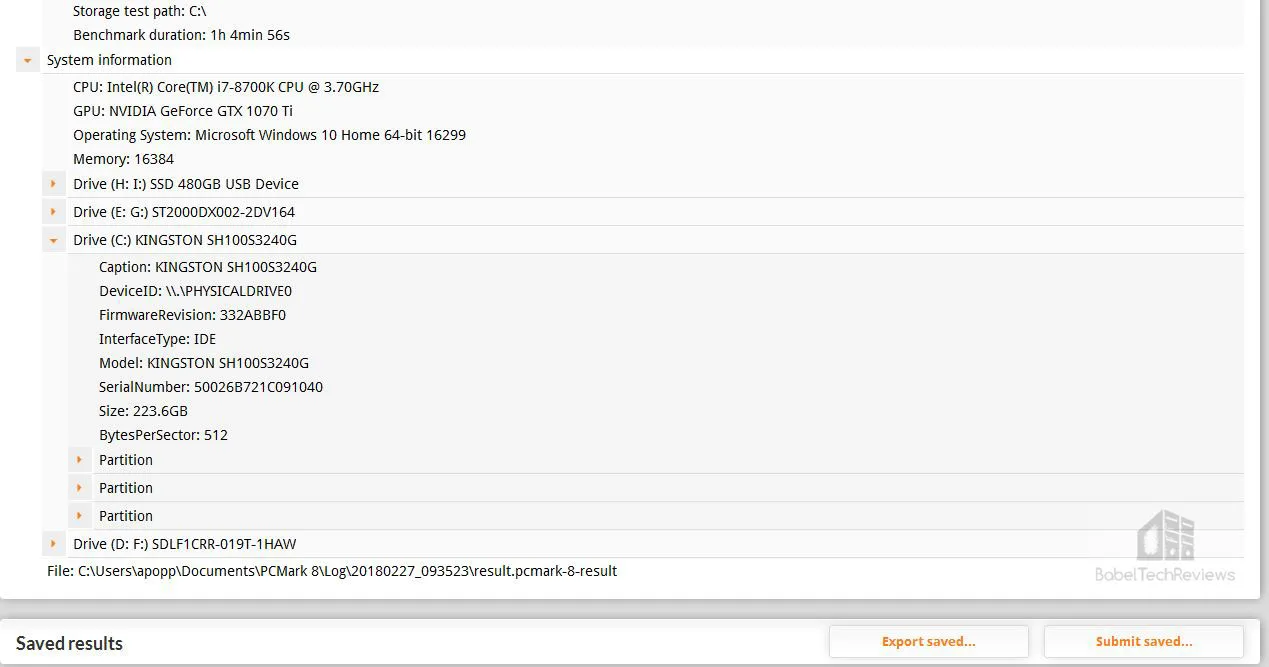 Here are the HyperX Blue online storage test results summarized, and most importantly for a gamer, it took 58.4 seconds to load World of Warcraft and 134.7 seconds for Battlefield 3 to load.
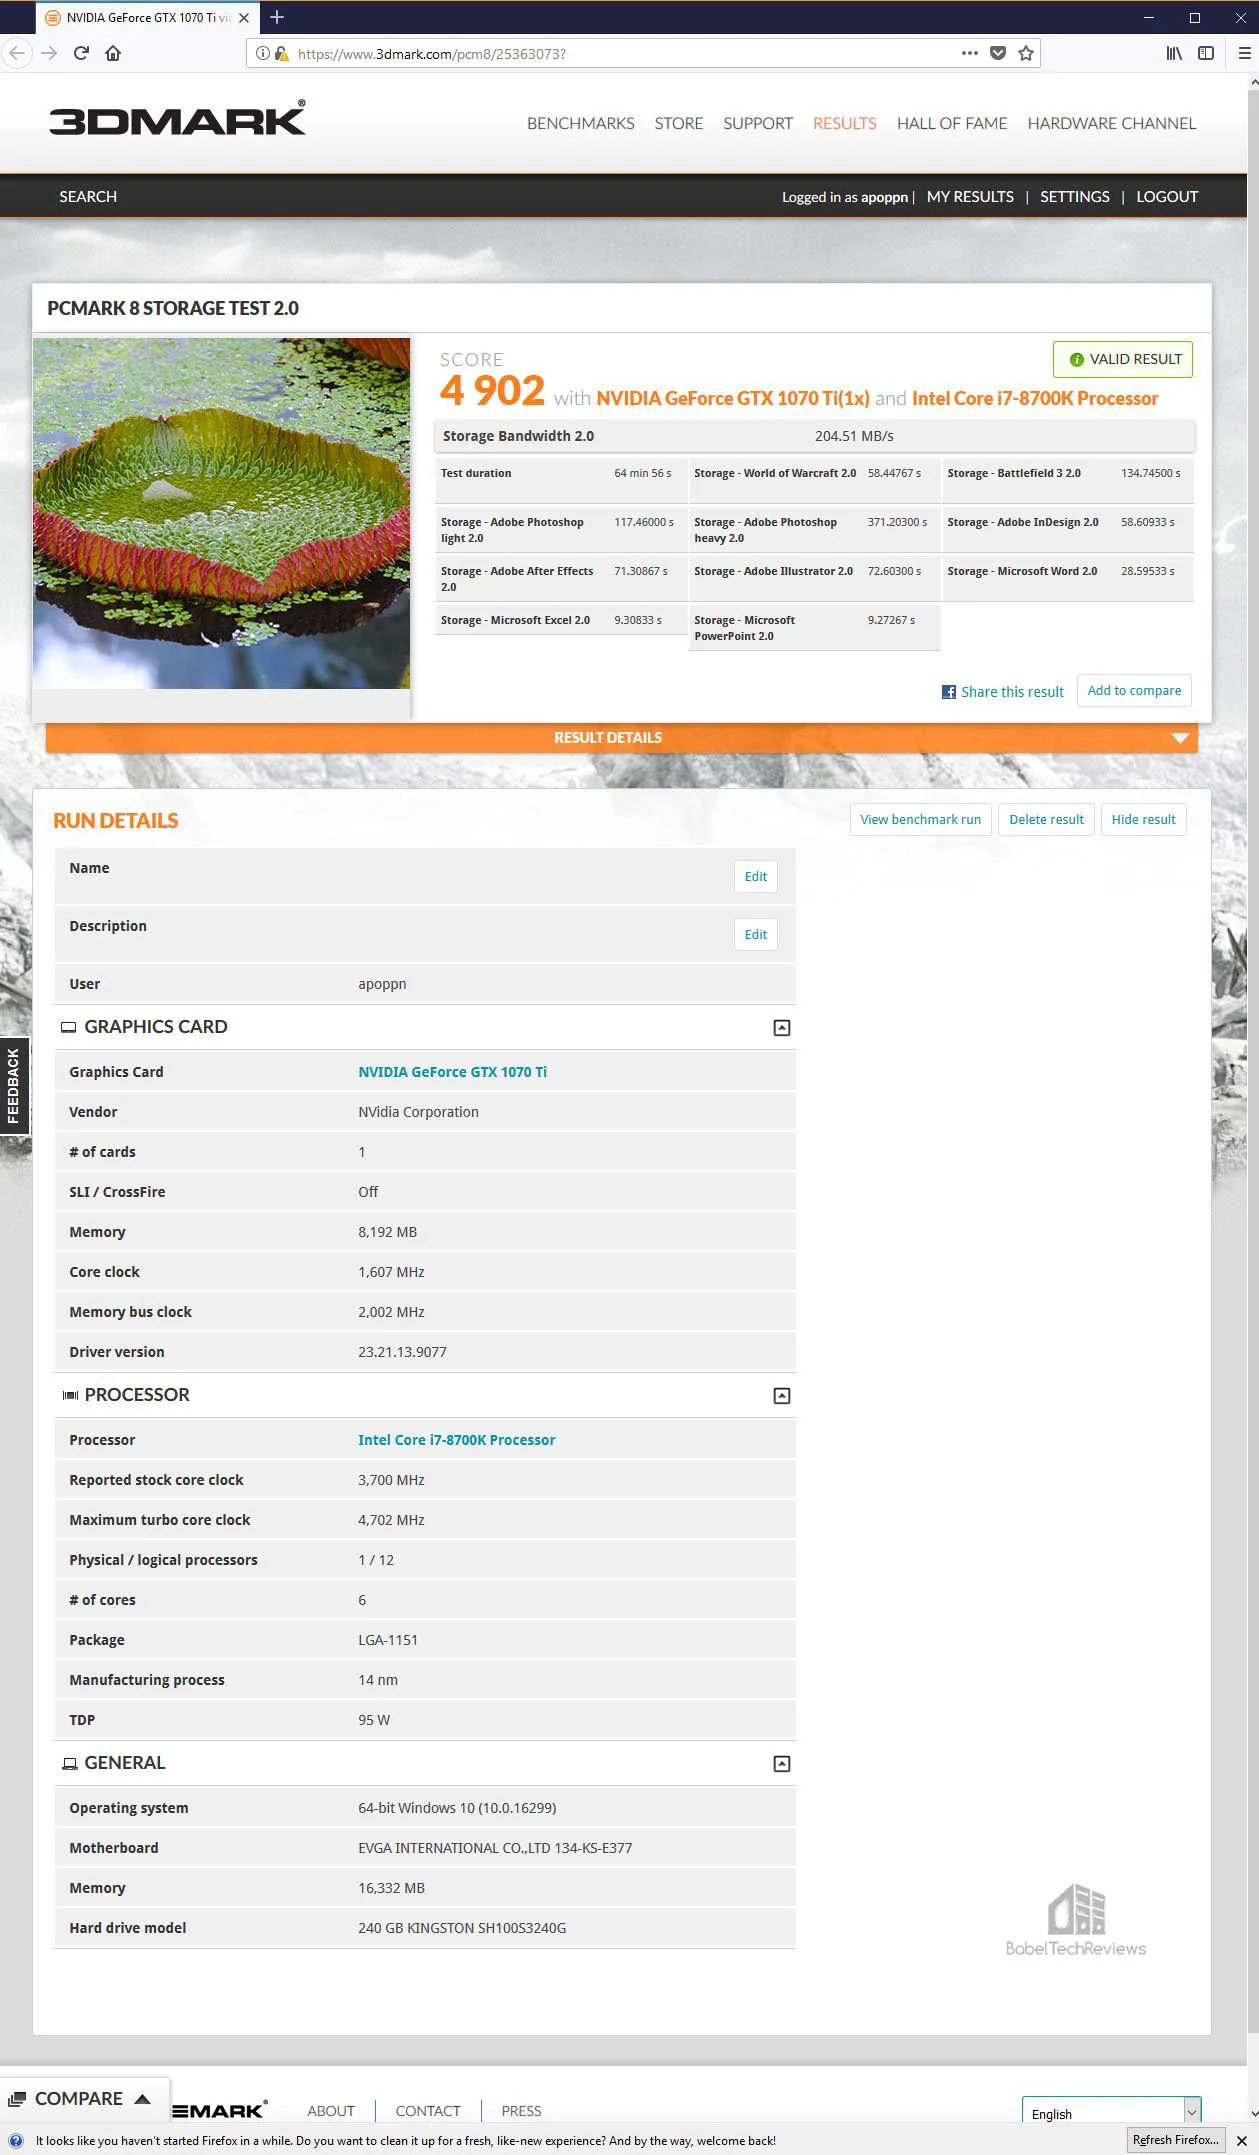
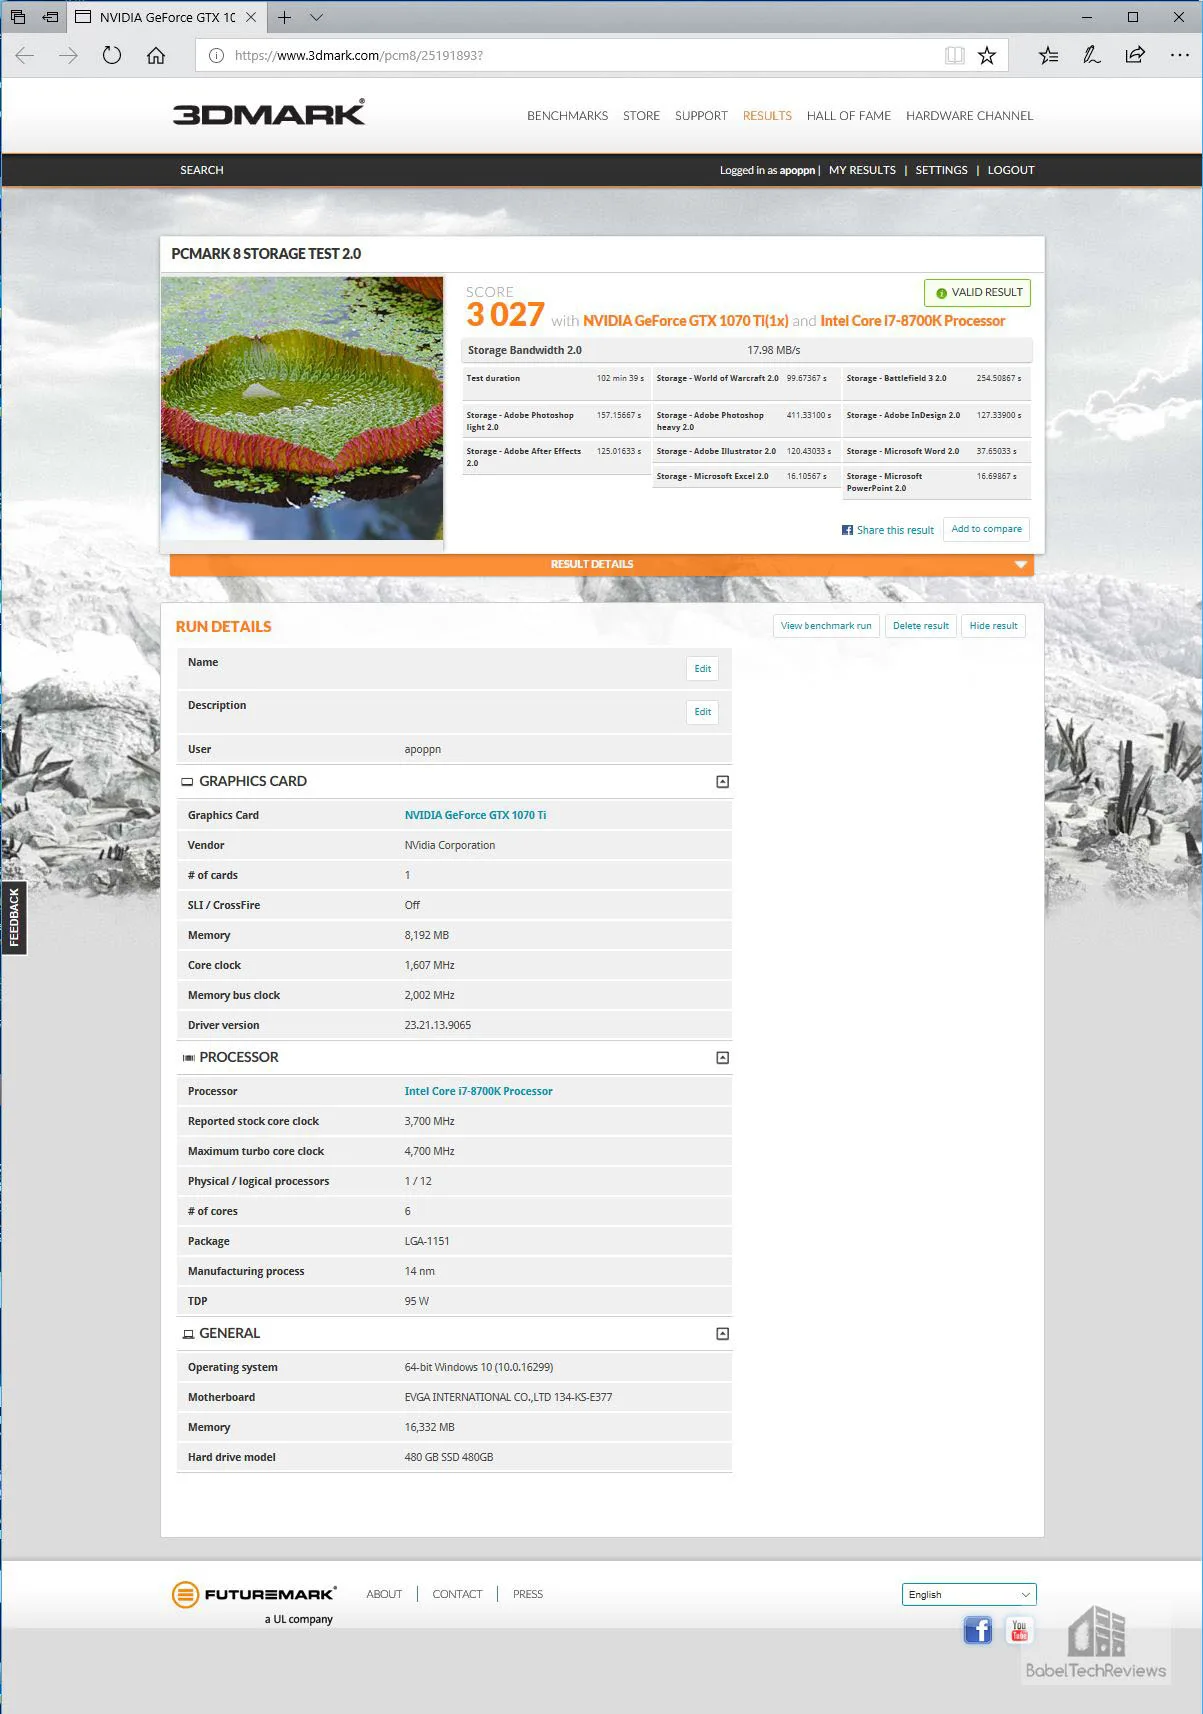
Here are the 2 TB SSHD storage test results scoring 3027 and 17.98 MB/s bandwidth.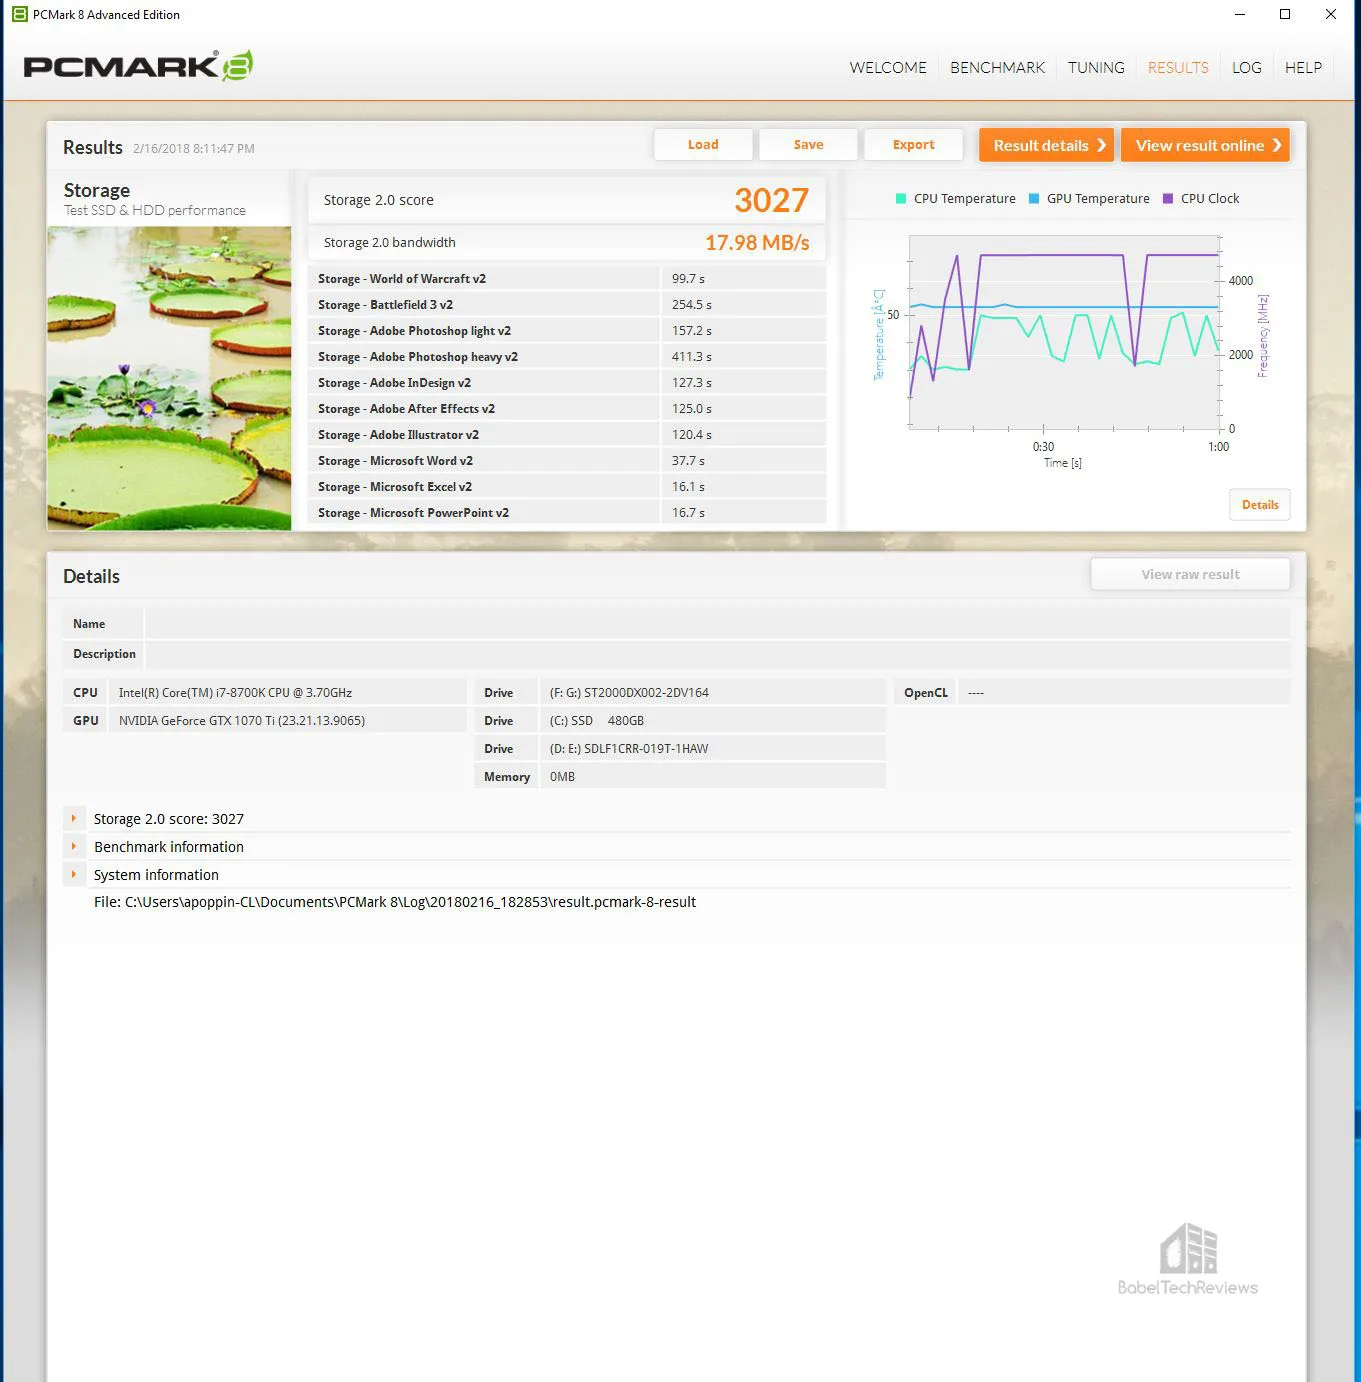
Here are the 2TB FireCuda SSHD online storage test results summarized, and most importantly for a gamer, it took 99.7 seconds to load World of Warcraft and 254.5 seconds for Battlefield 3 to load.
Here is the comparative loading times chart for World of Warcraft and for Battlefield 3 which is also included in the main Game/Level Loading chart.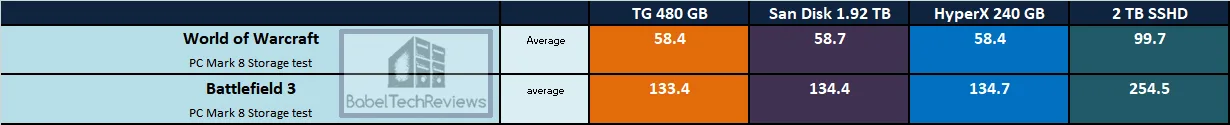
It’s clear that for loading games and apps, the SSD is significantly faster than any HDD or SSHD. A SSHD only takes advantage of repeated loading of levels or games and after 2 or 3 loads, it will set up more quickly, approaching SSD speeds.
SiSoft Sandra 2017 (SP4)
Before we get to gaming, we want to see exactly where drive performance results differ, and there is no better tool than SiSoft’s Sandra 2017. SiSoftware Sandra (the System ANalyser, Diagnostic and Reporting Assistant) is an complete information & diagnostic utility in one complete package. It is able to provide all the information about your hardware, software and other devices for diagnosis and for benchmarking. In addition, Sandra is derived from a Greek name that implies “defender” or “helper” – a PC Wonder Woman.
There are several versions of Sandra 2017, including a free version of Sandra Lite that anyone can download and use. It is highly recommended! SiSoft’s Sandra 2017 SP4 is the very latest version, and we are using the full engineer suite courtesy of SiSoft, with quite a few improvements over earlier versions of Sandra. It will benchmark and analyze all of the important PC subsystems and even rank your PC and make recommendations for improvements.
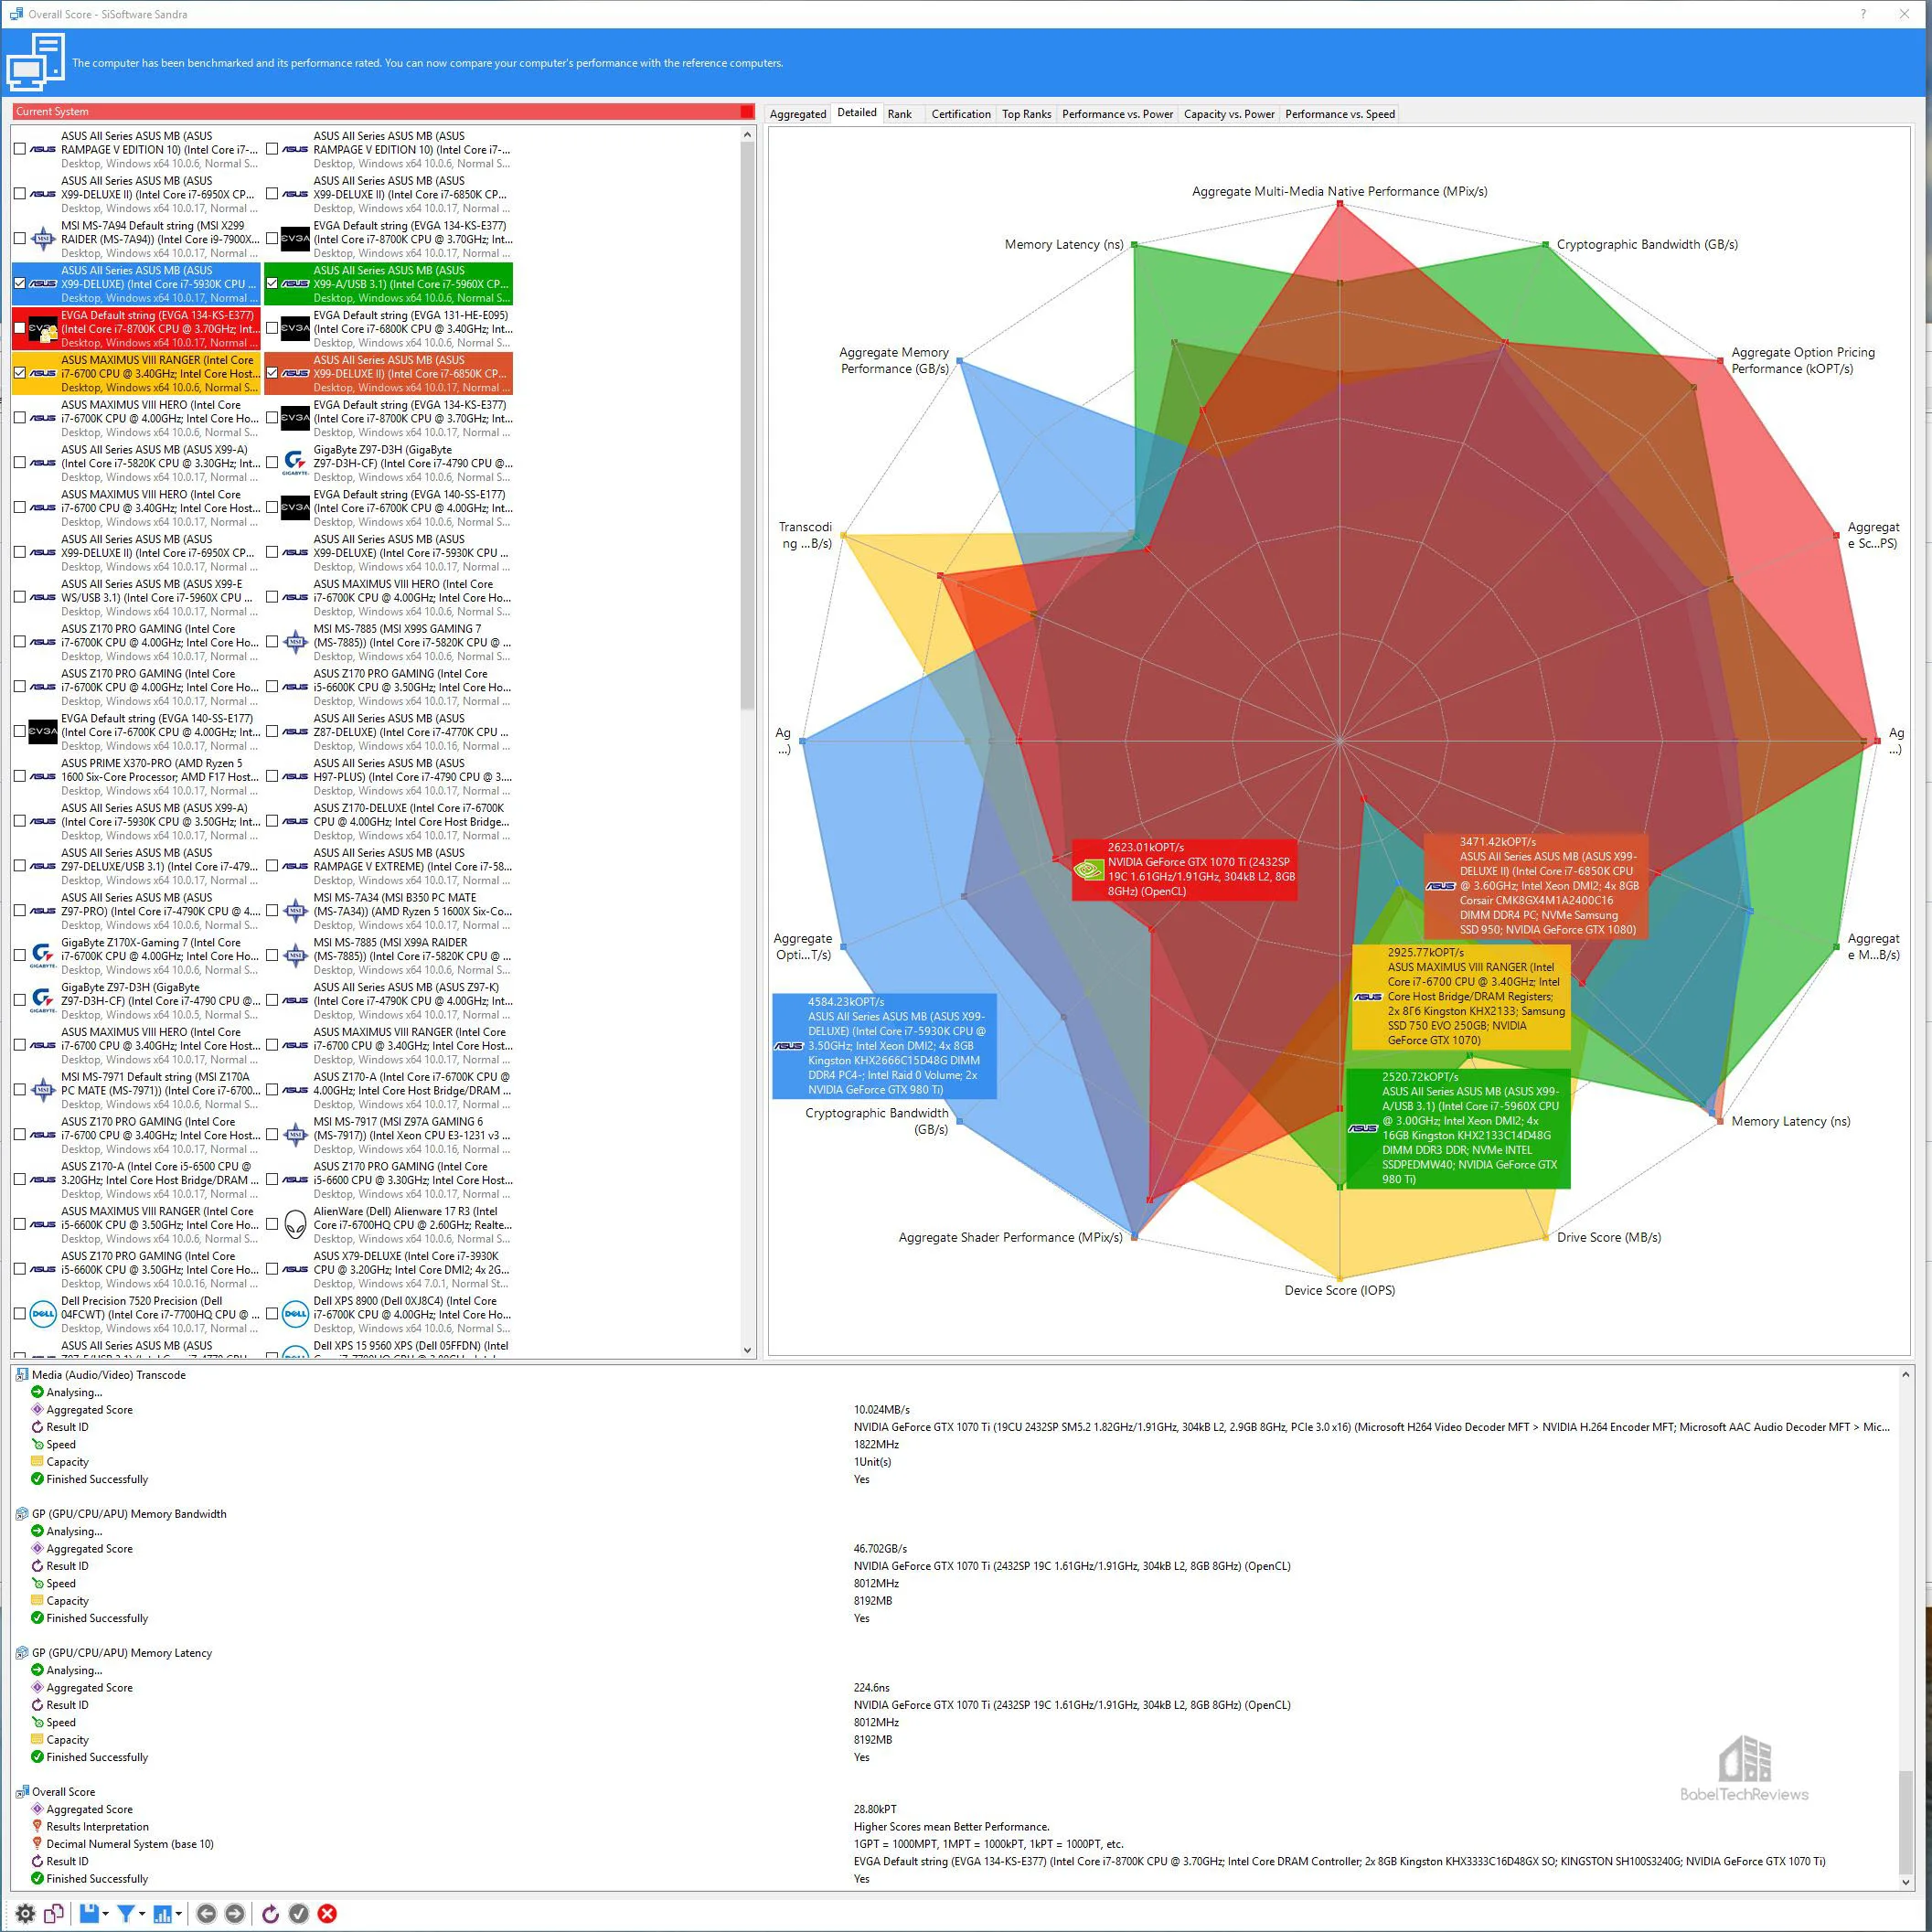
First we run the very latest full Sandra benchmark suite and then follow up with the 3 disk benchmarking tests. Here is the chart summarizing the results of our 5 drives
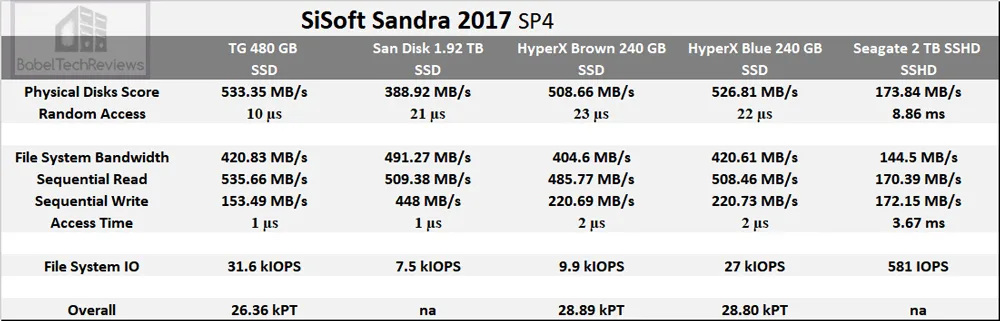
The Team Group 480 GB SSD performance sits close to the other SSDs, and it is solidly faster than any HDD or SSHD.
CrystalDiskMark is a HDD benchmark utility for your hard drive that enables you to measure sequential and random read/write speeds. Here are some key features of “CrystalDiskMark”:
- Measure sequential reads/writes speed
- Measure random 512KB, 4KB, 4KB (Queue Depth=32) reads/writes speed
First up is the Team Group 480 GB Drive. It easily exceeds its rated speeds of 470 MB/s Read and 420 MB/s Write.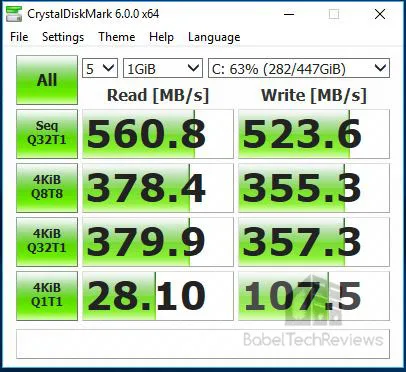
The SanDisk 1.92 GB SSD is a bit slower than the Team Group SSD.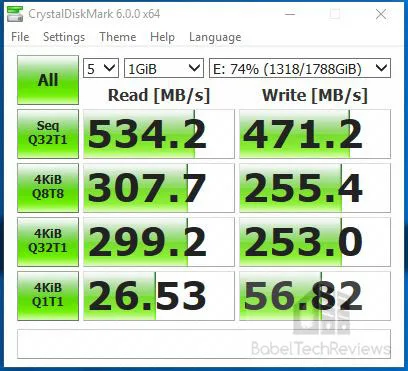
240 GB HyperX SSD Brown score high in Read speeds, but much lower in Write.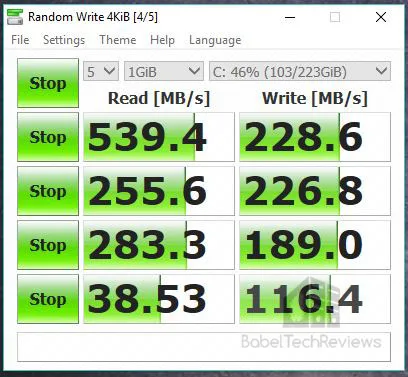
The 240 GB HyperX SSD Blue is faster than the brown, but its Write speeds are below the newer 3D NAND SSDs.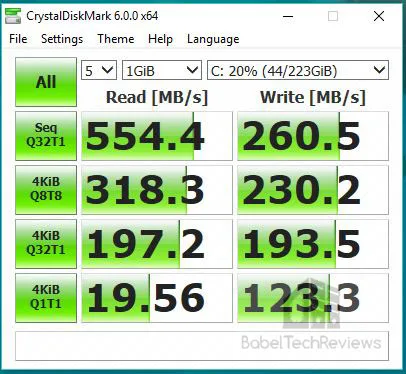
The 2 TB SSHD Reads significantly slower than any SSD although its Write speed is close to that of the older SSDs for the first test only.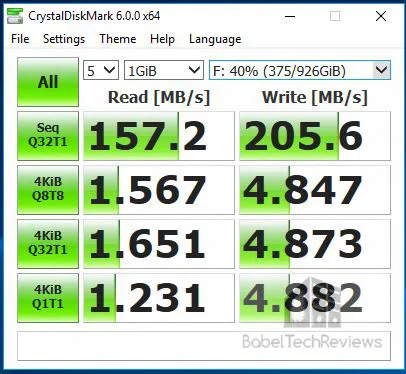
Let’s look at our next synthetic test, HD Tune. Most of these standalone synthetic tests are older and they don’t represent real world performance.
HD Tune
HD Tune is a hard disk utility which has the following functions:
- Benchmark measures the performance of:
- Transfer Rate
- Access Time
- CPU Usage
- Burst Rate
- Random Access test
- Write benchmark
- Hard Disk information which includes partition information, supported features, firmware version, serial number, disk capacity, buffer size, transfer mode
- Hard Disk Health
- S.M.A.R.T. Information (Self-Monitoring Analysis and Reporting Technology)
- Power On Time
- Error scan
- Temperature display
The Team Group 480 GB is up first as usual with 372.5 MB/s average Transfer Rate: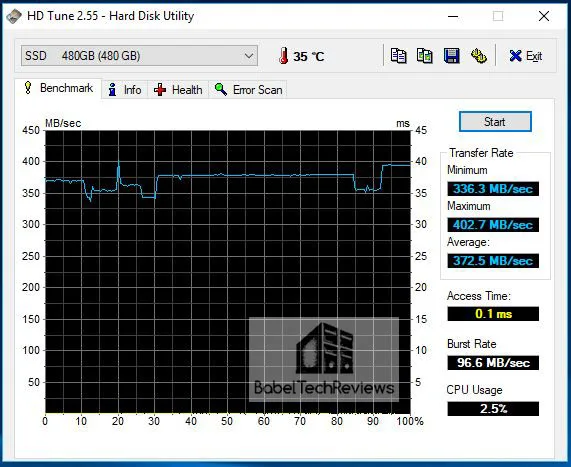
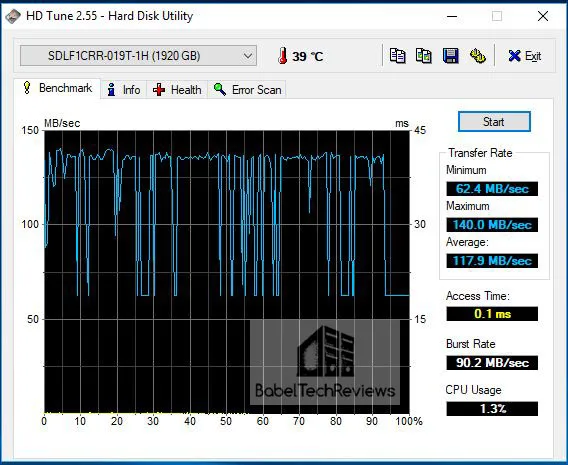
The 1.92 GB SanDisk SSD shows a much lower Transfer Rate of 117.9 MB/sec average on this old test that clearly do not represent its performance.
The 240 GB HyperX SSD (brown) manages 358.0 MB/sec Transfer Rate.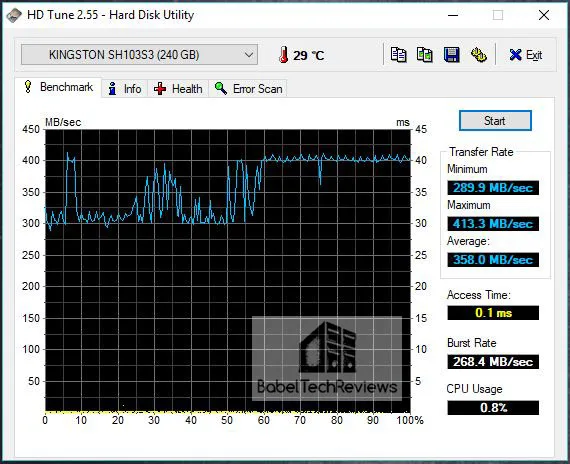
The 240 GB HyperX SSD Blue comes out slower than the brown with a 313.0 MB/sec Transfer Rate even though it is a faster SSD
The 2 TB SSHD does pretty well with a 173.7 MB/sec Transfer Rate, and from this test, one would think it is faster than the 1.92 TB SSD. It is not.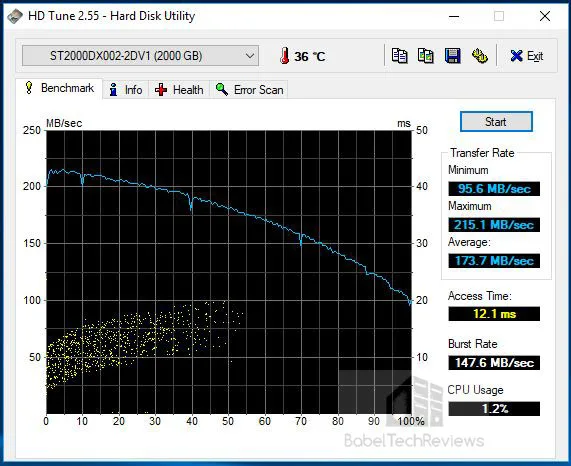
This test is rather ancient, and we would recommend using the latest version of HD Tune (which is not for any commercial use) which shows rather different results for the SanDisk SSD.
Next we benchmark using AS SSD.
AS SSD
AS SSD is especially designed for Solid State Drives (SSD). This tool contains synthetic and practice tests. The synthetic tests determine the sequential and random read and write performance of the SSD without use of the operating system caches. In Seq-test the program measures how long it takes to read and write a 1 GB file.
In the 4K test, read and write performance for random 4K blocks are determined. The 4K-64-thrd test are similar to the 4K procedure except that the read and write operations on 64 threads are distributed as in the usual start of a program. In the copying test, two large ISO file folders are created, programs with many small files, and a games folder with small and large files. These three folders are copied by the OS copy command with the cache turned on. AS SSD gives an overall “score” after it runs the benchmarks.
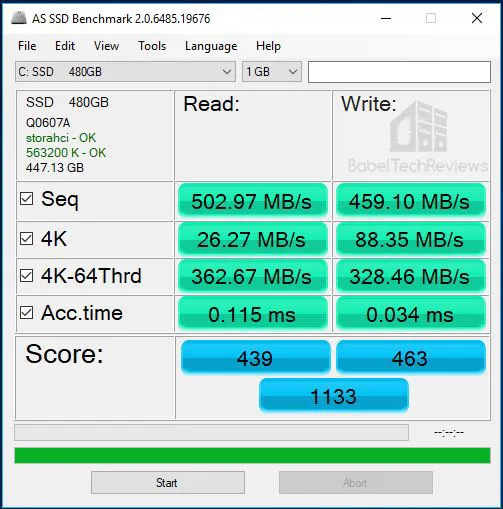
First we display the Team Group 480 GB results – it exceeds its expected Read and Write speeds and it scores 1133.
The 1.92 TB SanDisk SSD manages a score of 875.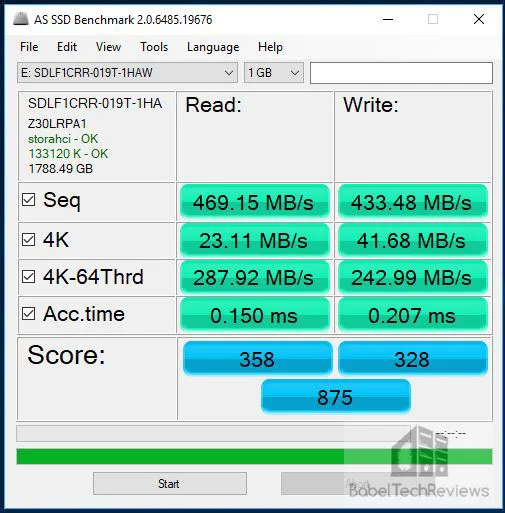

The 240 GB HyperX SSD Blue only manages 706.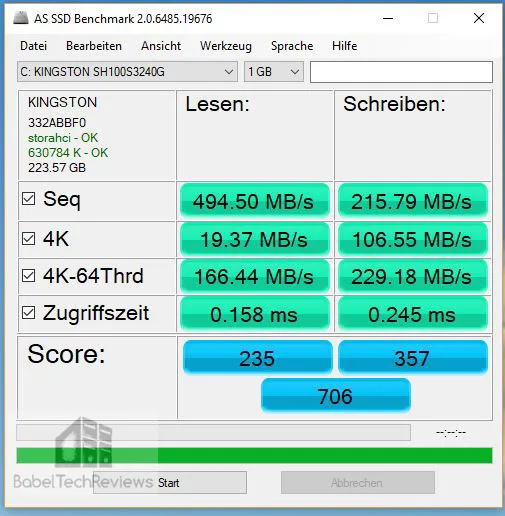
The 2TB SSHD can only score 49.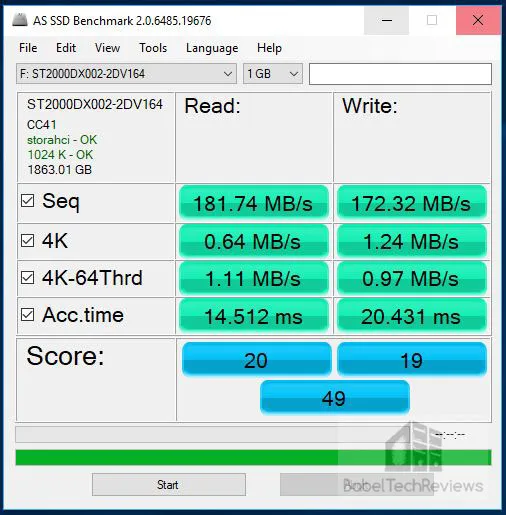
The SSHD or HDD tests appear to take forever with AS SSD and they score very low compared to any SSD. The older HyperX SSDs score lower in the Write tests than do the newer SSDs. On to HD Tach.
HD Tach is a low level hardware benchmark for random access read/write storage devices including for SSDs and HDDs. HD Tach uses custom device drivers and low level Windows interfaces to determine the physical performance of the device. It is no longer supported and needs to be run in compatibility mode for Windows 7.
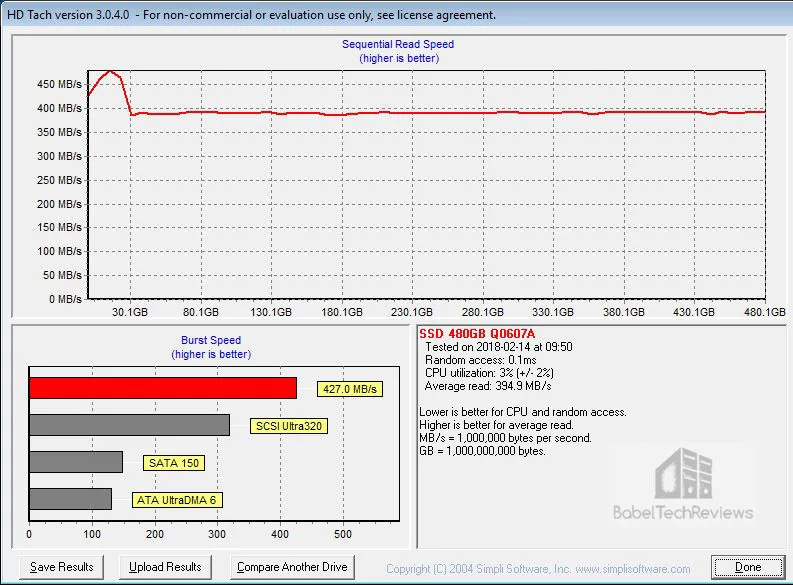
The Team Group 480 TB SSD averages 394.9 MB/s Read.
The 1.92 GB SanDisk SSD averages 121.5 MB/s Read. It is an older synthetic test.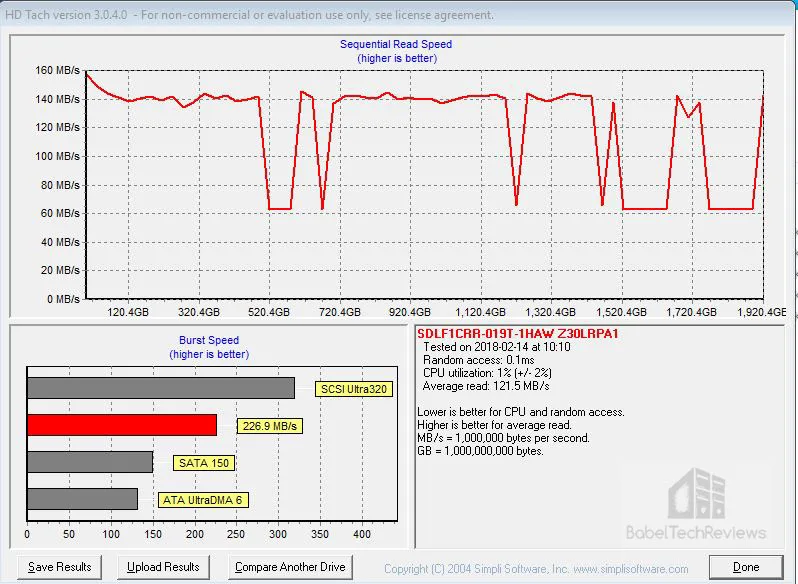
The 240 GB HyperX SSD Brown gets 372.3 MB/Sec Read.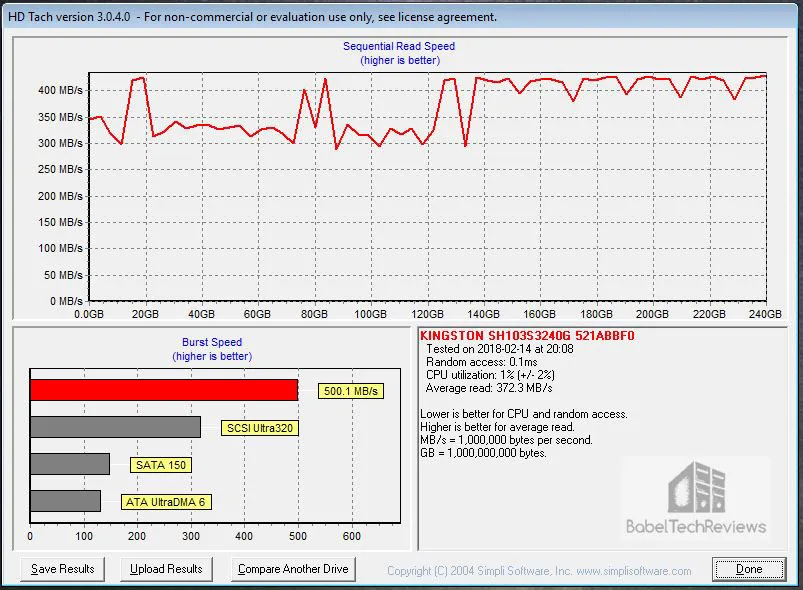
The 240 GB HyperX SSD Blue scores 344.9 MB/sec.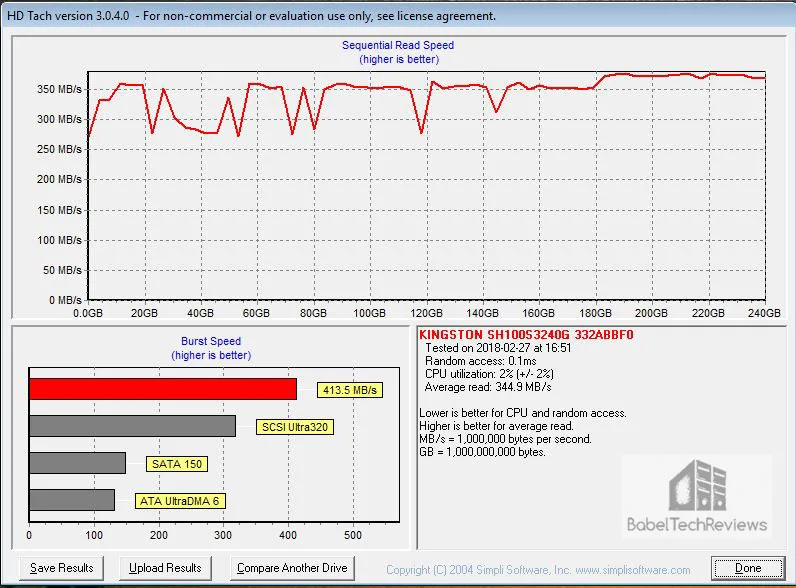
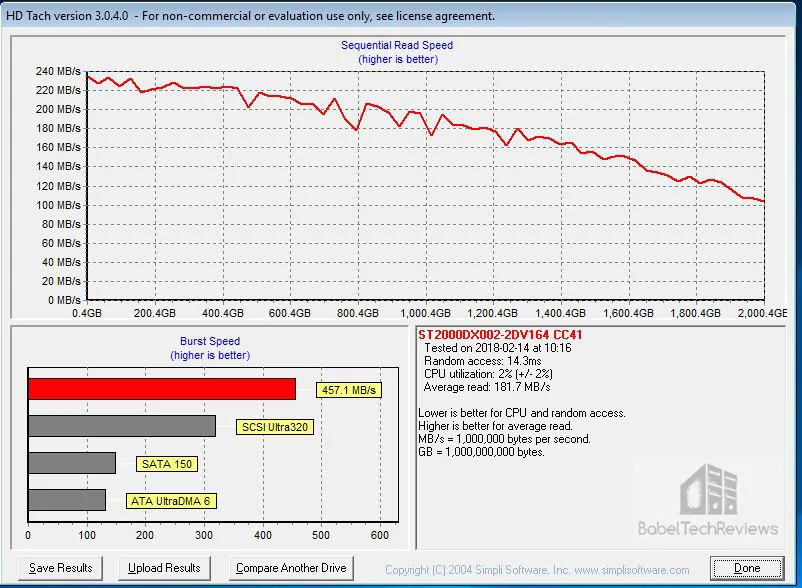
The 2 TB SSHD manages 181.7 MB/second Read.
Enough of the synthetics! Let’s look at game and game level loading times.
The Game/Level Loading Time Results
Unfortunately, our results are very difficult to measure precisely but it is easy to see that generally SSDs perform similarly with regard to loading times and they are miles ahead of any HDD or even SSHD which requires loading the same level or program over and over to get quicker. The 240 GB HyperX SSD that we tested loading times on is the standard (brown) drive which sets up games and levels no slower than the Blue drive.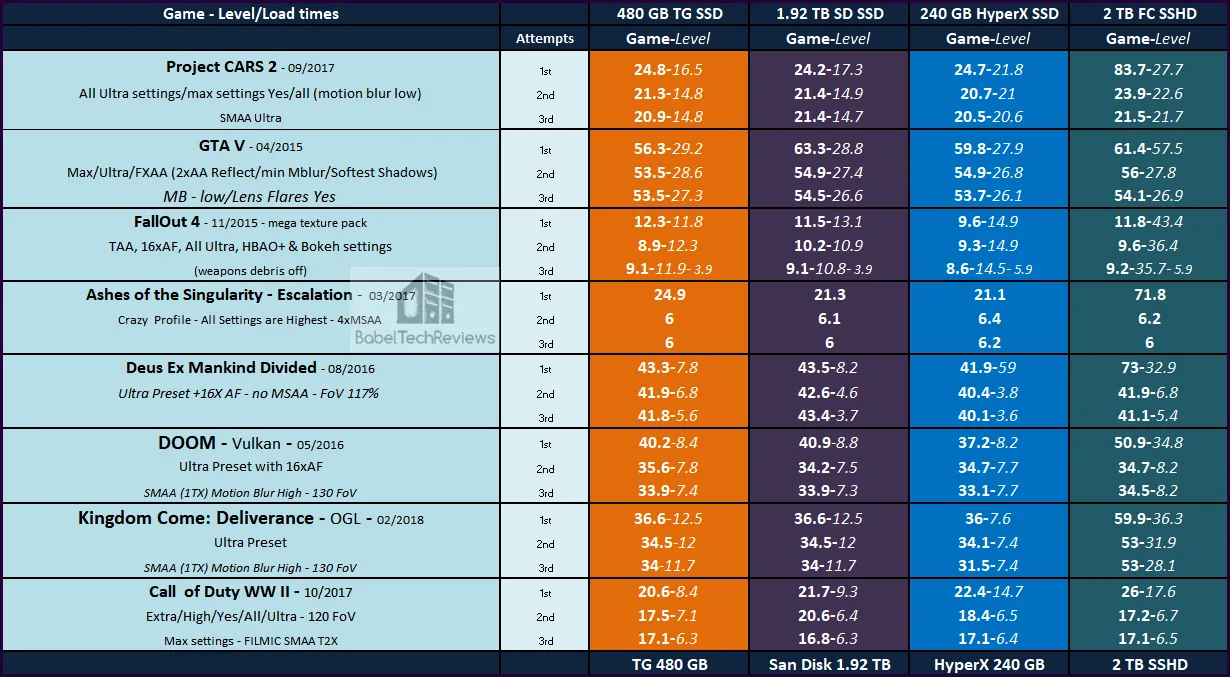
Playing Kingdom Come: Deliverance for over 12 hours the first day made us switch to a SSD which loaded levels much faster than from the SSHD. This game is a poster child for using a SSD over a HDD where the player is often saving 20 seconds every time they load a level or reload a saved game. 
On the other hand, there are games like Grand Theft Auto V which load slowly and almost painfully, and occasionally the SSHD beats a SSD. Other games like Fallout 4 and Call of Duty WW II load pretty quickly from any kind of storage drive. However, generally games load significantly faster from a SSD than from a HDD and a SSHD only starts to show it’s strengths when the same game or level is reloaded several times.
Until devs start to target SSDs for game storage, or perhaps after consoles move away from hard disk drives, we will no longer see SSDs held back from achieving the game loading performance they are capable of. Until then, even the NVMe PCIe SSDs which are significantly faster than the SATA III SSDs, are not worth the price premium they command for gamers unless they are just looking to perhaps shave an additional second off of loading times.
It looks like our Team Group 480 GB SSD is a keeper! It exceeds Team Group’s published minimum Read and Write speeds and it is our fastest SSD. We will continue to use our pair as boot drives and to keep Windows Store games on. Games that take advantage of SSDs and load more quickly are mostly kept on the 1.92 TB San Disk SSD, and games like GTA V and FallOut 4 reside on the 2 TB SSHD for now.
Let’s head for our conclusion.
Conclusion
SSD technology is still improving and again it seems that pricing on 500 GB drives are dropping. SSD technology has become much more accessible to the regular consumer again and it appears that gamers need more capacity than the 120 GB to 250 GB drives offer as games are getting very large.
If a gamer wants to keep his currently played games on a SSD, it appears that 480 GB is becoming the new minimum size, and for $99 when on sale, the Team Group LTE 480 GB SSD delivers in spades. It easily exceeds its specifications and can hang with some of the faster SSDs of the last generation, and with the SSDs of the current generation for gamers. There is generally little loading time difference between SSDs, and they are all much faster than either HDDs or SSHDs.
It is not mandatory to have a SSD if you use your PC only for gaming. Games do not perform better on a SSD as developers target the HDD for optimizing game performance. But there is the matter of waiting. Some games take significantly longer to load from a HDD or SSHD than they do from a SSD. If a gamer wants to get right back into the game, then a SSD will definitely improve immersion and decrease frustration as it did for us with Kingdom Come: Deliverance.
It is a matter of valuing ones time compared to the $100 one can spend on a medium-capacity SSD. And the 480 GB Team Group SSD is a good performing SATA III SSD for $128 which is its regular price.
Pros
- The SSD is of a magnitude faster than the mechanical hard drive in almost every way.
- Team Group’s 480 GB SSD is good bang for buck at $100-$128 for a 480 GB SATA III drive
- TRIM support and garbage collection keeps your drive “like new”. The Team Group LITE drives also offer advanced wear-leveling technology.
- 3-year warranty stand it out from the generic “SSD crowd”.
- The SSD is extremely light compared to our other 4 SSDs, and it would be great as a HDD replacement in a notebook
Cons
- Color. Some may not like the shiny bronze. But it is hidden inside your PC anyway.
This has been quite an enjoyable exploration comparing our other four drives with the Team Group 480 GB SSD. The performance of this drive is very good as a stand-alone SATA SSD, and if you can find it for $100 on sale, it is highly recommended for gamers!

The Verdict: Good Value
We are giving the Team Group L5 LITE 3D SSD our BTR “Good Value” Award as it is light, compact, and performs well, while being functional and easy to install and use! Diminished loading times are a big plus for gamers, and most SSDs load games similarly fast compared with HDDs. At $128, it is at a competitive price, and when it goes on sale for $99, it’s a must buy in our opinion. We purchased two of them and they save significant time loading games for our benchmarking.
Next up, Final Fantasy XV releases for Windows on Tuesday and we plan to bring you a full game review as well as a performance and IQ evaluation using 20 video cards. It’s preloaded and we have played through Chapter 1.
Happy Gaming!