Overclocking the RTX 2080 with Precision X1 vs. Overclocking the GTX 1080 Ti with Afterburner
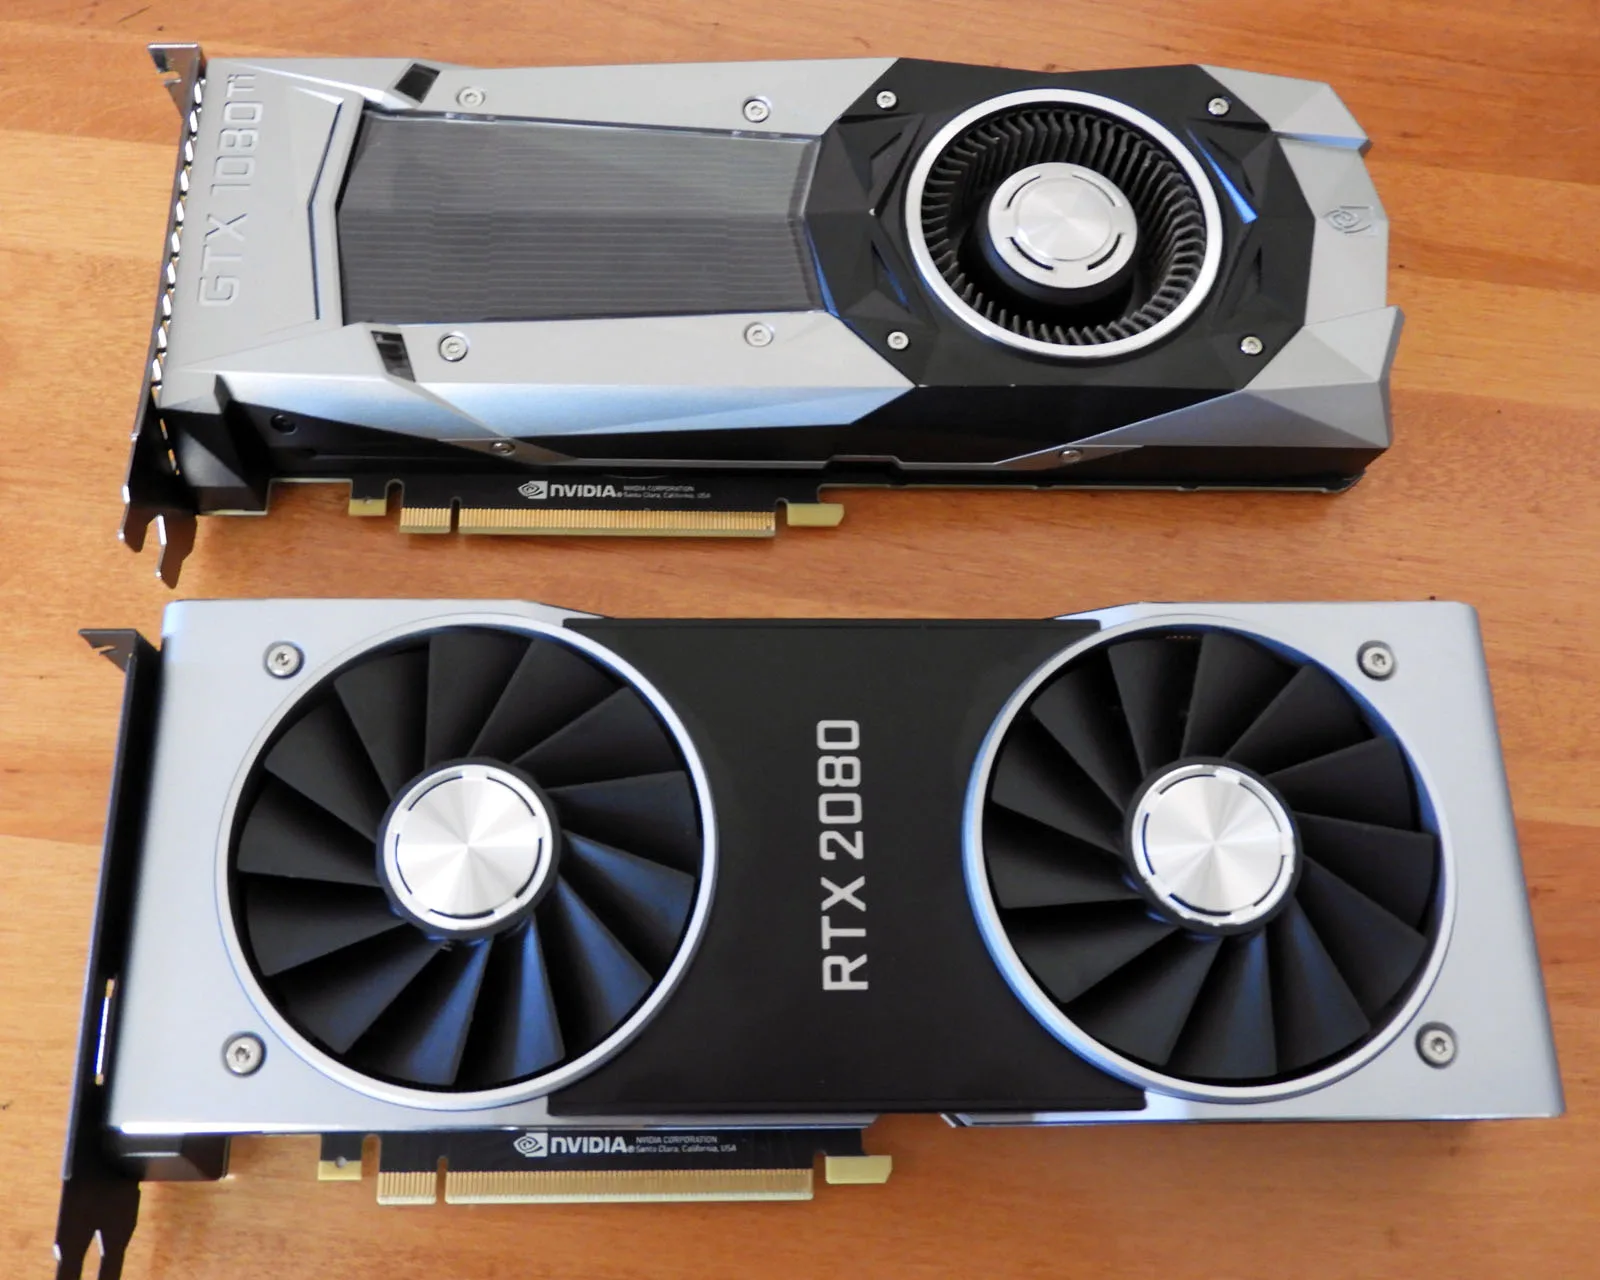
We evaluated the RTX 2080 Founders Edition (FE) using our benchmark suite of 36 games last week and concluded that it is faster than the GTX 1080 Ti. We now test the RTX 2080’s overclocked performance using EVGA’s new Precision X1 scanner compared with our overclocked GTX 1080 Ti FE’s performance using MSI’s Afterburner.
Our launch review focused on overclocking the RTX 2080 Ti, and we were only able to spend a few minutes overclocking the RTX 2080 with Precision X1’s scanner. During a 20 minute scan, it automatically overclocked our RTX 2080‘s core by +115 MHz, and then we added +700 MHz offset to its memory for a very preliminary overclock.
Today, we present our final RTX 2080’s stable overclocked performance using EVGA’s latest public beta of Precision X1. EVGA’s Precision X1 has been released to the public featuring NVIDIA’s Turing scanner for a fast and accurate semi-automatic way to overclock by fully unlocking the new RTX GPU’s Boost 4.0.
Let’s get right to the test configuration, and then to our overclocking methods, and finally to the 36-game overclocked results and conclusion.
Test Configuration – Hardware
- Intel Core i7-8700K (HyperThreading and Turbo boost is on to 4.7 GHz for all cores; Coffee Lake DX11 CPU graphics).
- EVGA Z370 FTW motherboard (Intel Z370 chipset, latest BIOS, PCIe 3.0/3.1 specification, CrossFire/SLI 8x+8x), supplied by EVGA
- HyperX 16GB DDR4 (2×8 GB, dual channel at 3333 MHz), supplied by HyperX
- RTX 2080 8 GB Founders Edition, stock FE clocks, supplied by NVIDIA
- GTX 1080 Ti 11 GB Founders Edition, stock clocks, supplied by NVIDIA
- 2 x 480 GB Team Group SSDs – one for AMD, and one for NVIDIA
- 1.92 TB San Disk enterprise class SSD
- 2 TB Micron 1100 enterprise class SSD
- Seasonic 850W Gold Focus power supply unit
- EVGA CLC 280mm CPU water cooler, supplied by EVGA
- Onboard Realtek Audio
- Genius SP-D150 speakers, supplied by Genius
- EVGA DG-77, mid-tower case supplied by EVGA
- LG 43″ HDR 4K TV
- Monoprice Crystal Pro 4K
Test Configuration – Software
- NVIDIA’s GeForce 411.63 WHQL drivers used for overclocking both cards. 399.24 is used for the GTX 1080 Ti stock clock results and launch drivers 411.51 were used for the RTX 2080. The drivers used are functionally identical in gaming performance except for specific bug fixes. See Control Panel image below.
- VSync is forced off.
- AA enabled as noted in games; all in-game settings are specified with 16xAF always applied
- Gaming results show average frame rates in bold including minimum frame rates shown on the chart next to the averages in a smaller italics font. Some OCAT captured minimums are given in frame times and expressed in ms
- Highest quality sound (stereo) used in all games.
- Windows 10 64-bit Home edition. All DX11 titles were run under DX11 render paths. DX12 titles are generally run under the DX12 render path unless performance is worse than with DX11. Three games use the Vulkan API.
- Latest DirectX
- All 36 games are patched to their latest versions at time of publication.
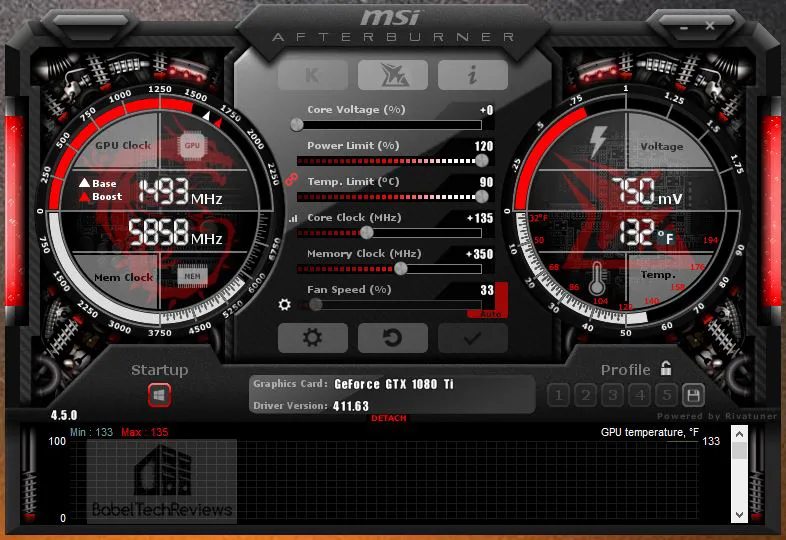
- MSI’s Afterburner 4.5.0, used to adjust the GTX 1080 Ti and to set temp and power limits to maximum.
- Precision X1 0.2.6 public beta version for RTX 2080 settings and for overclocking
- OCAT, latest version
- Fraps, latest version
36 PC Game Benchmark Suite & 2 Synthetic Tests
Synthetic
- Firestrike – Basic & Extreme
- Time Spy DX12
DX11 Games
- Grand Theft Auto V
- The Witcher 3
- Fallout 4
- Watch Dogs 2
- Just Cause 3
- Rainbow Six Siege
- Battlefield 1
- Resident Evil 7
- For Honor
- Ghost Recon Wildlands
- Mass Effect: Andromeda
- Prey
- DiRT 4
- Project CARS 2
- Middle Earth: Shadow of War
- Assassin’s Creed Origins
- Destiny 2
- Call of Duty WW II
- Star Wars: Battlefront II
- Final Fantasy XV
- Far Cry 5
- The Crew 2
DX12 Games
- Tom Clancy’s The Division
- Ashes of the Singularity: Escalation
- Hitman
- Rise of the Tomb Raider
- Deus Ex Mankind Divided
- Gears of War 4
- Civilization VI
- Sniper Elite 4
- Total War: Warhammer II
- Forza 7
- Shadow of the Tomb Raider
Vulkan Games
- DOOM
- Wolfenstein: The New Colossus
- Strange Brigade
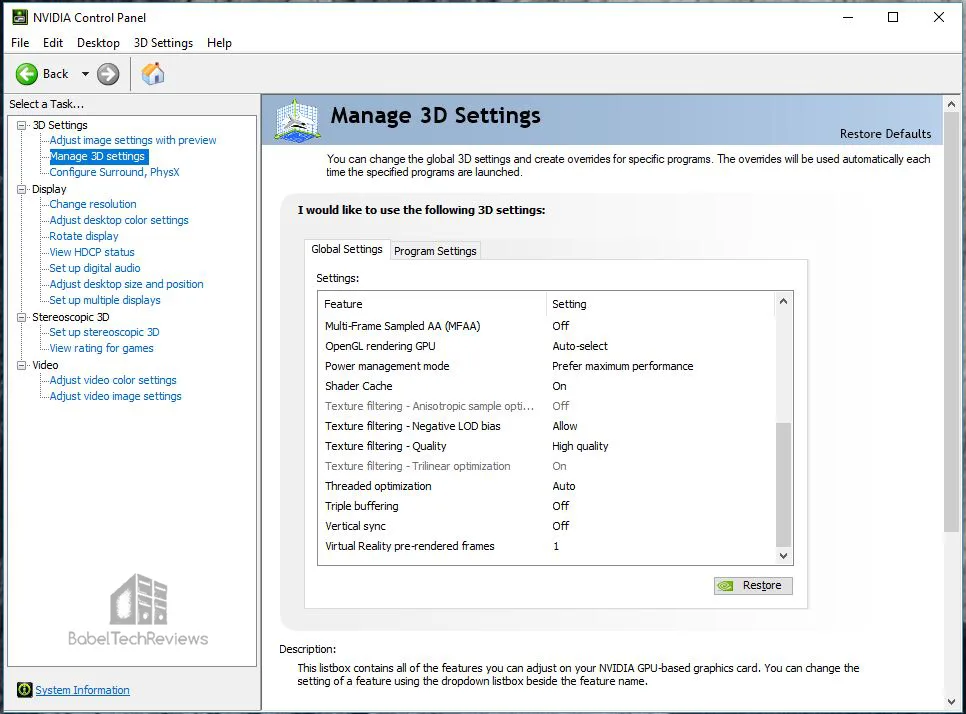
NVIDIA Control Panel settings:
Here are the NVIDIA Control Panel settings.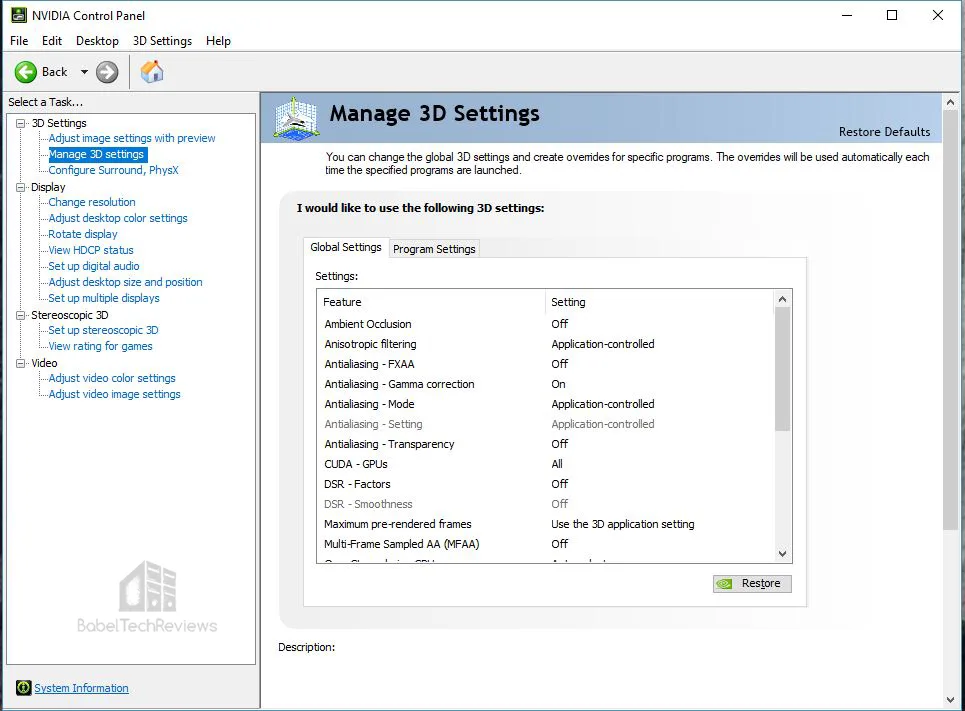
We used MSI’s Afterburner for the GTX 1080 Ti to set its power and temperature limits to maximum since Precision X1 is not yet set up for Pascal. We used Precision X1’s automatic scan as well as its manual settings to overclock the RTX 2080.
By setting the Power Limits and Temperature limits to maximum for each card, they do not throttle, but they can each reach and maintain their individual maximum clocks. This is particularly beneficial for high-power cards like the GTX 1080 Ti and the RTX 2080
Let’s check out overclocking next.
Overclocking with EVGA’s Precision X1
Precision X1 is still in beta and yet it offers these features which implement all of the capabilities of GPU Boost 4.0.
EVGA Precision X1 Key Features:
- Brand new GUI that is faster and easier to use.
- Real-Time wattage monitoring (on supported EVGA graphics cards).
- Full support for GeForce RTX graphics cards (GTX support coming soon)
- RGB LED Control supporting graphics cards and/or NVLink Bridge.
- LED Sync that syncs with other EVGA RGB components.
- Dynamically set independent voltage/frequency points for ultimate control.
- New OC Scanner for finding the best stable overclock.
- On-Screen-Display (OSD) shows your system vitals at a glance.
- GPU Clock, Memory Clock and Voltage Control.
- Custom fan control and fan curve.
- Profiling system allowing up to 10 profiles with hotkey.
- In game screenshot function.
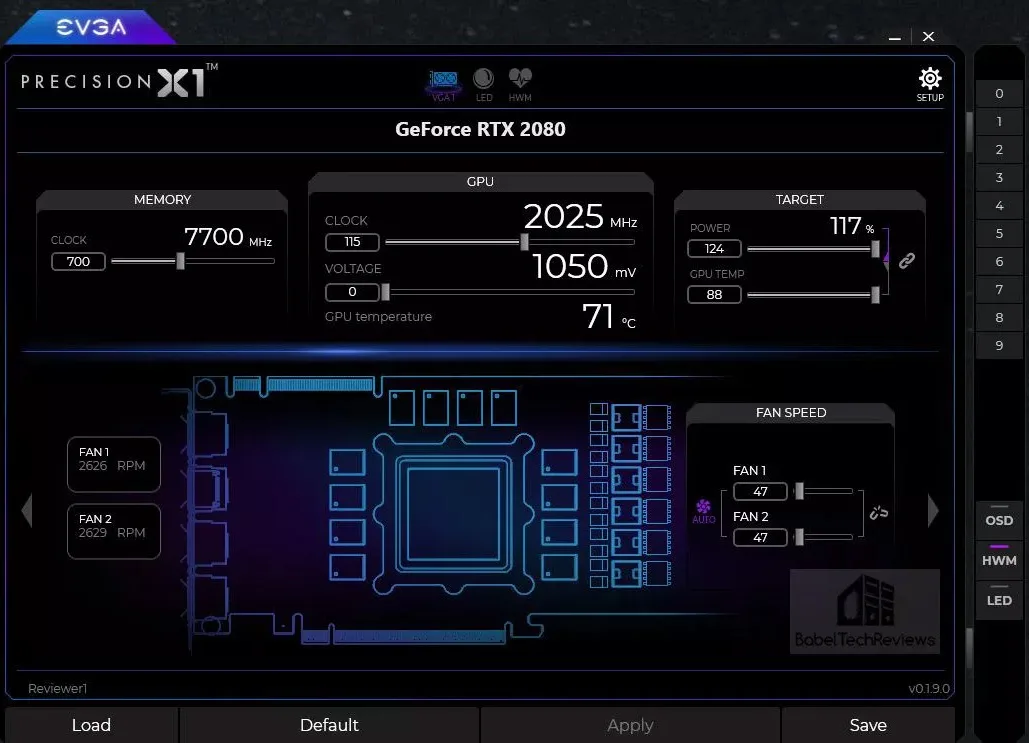
Precision X1 uses an integrated scanner that is vastly improved over Precision XOC for Pascal. The new OC Scanner adjusts the entire frequency curve, at every single voltage/frequency point, and it gives an overclocking “score”. The score is the average of every single voltage/frequency curve.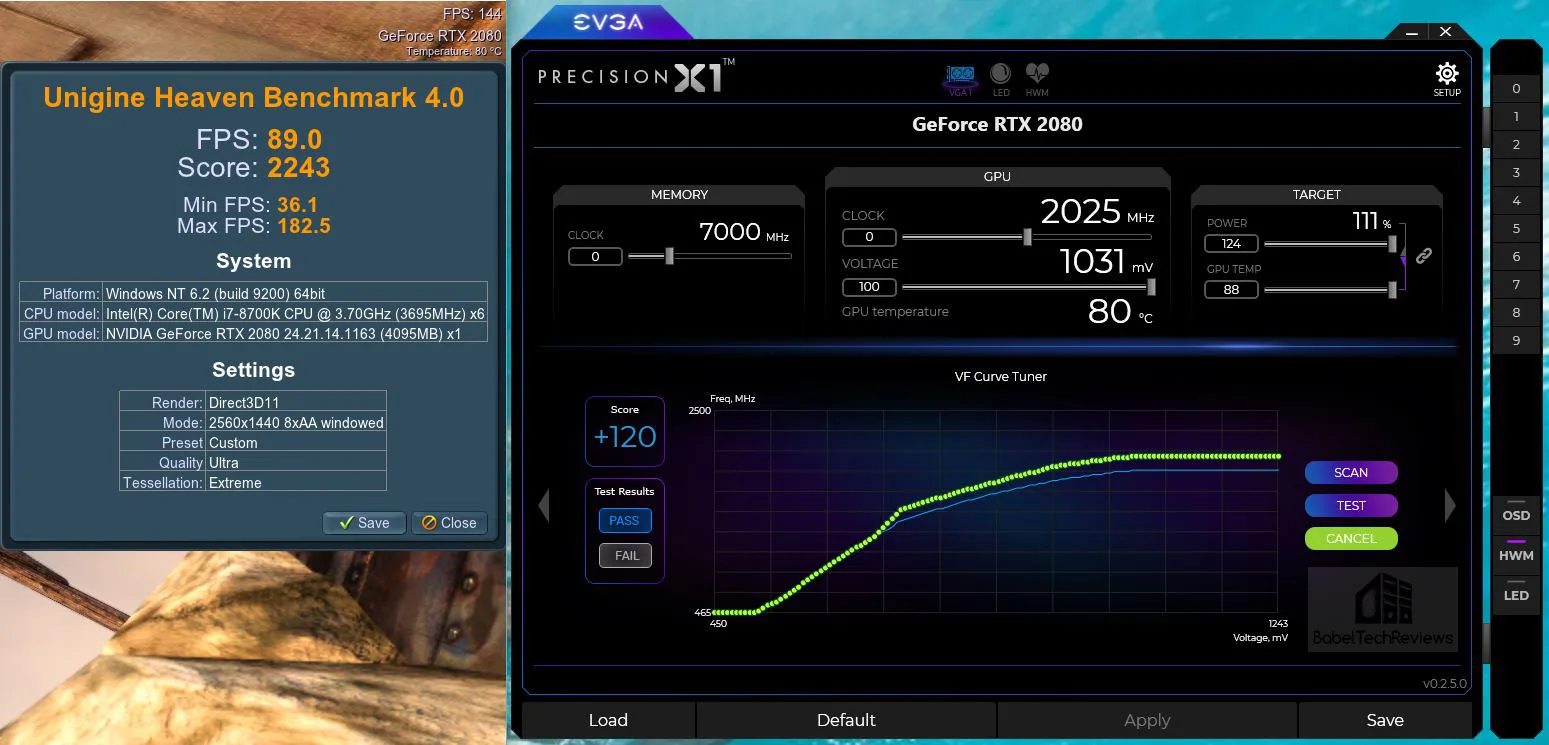
Above is the maximum score the Precision X1 scan could achieve. Note that we set the power and temperature targets to maximum and also moved the voltage slider to maximum – that “120” score is the offset. It passed. Just hit ‘Apply’ and the overclock is set in about 20 minutes. Of course, we didn’t stop there but wanted to see if we could get a higher manual overclock. Read on.
UI (User Interface)
There are several modes which even allow you fine control over setting fan speeds – even to setting their speeds individually. However, we are going to concentrate on overclocking and primarily on the automatic scanner.
Manual Mode
Although the Precision X1 scan worked to give us a 120 score which translates to a +120 MHz offset with a steady boost of 2025 MHz, we tried for higher. But first we wanted to test out the performance by running at default running with looped Heaven 4.0. We got a boost of 1875 MHz and 84.6 FPS in the benchmark.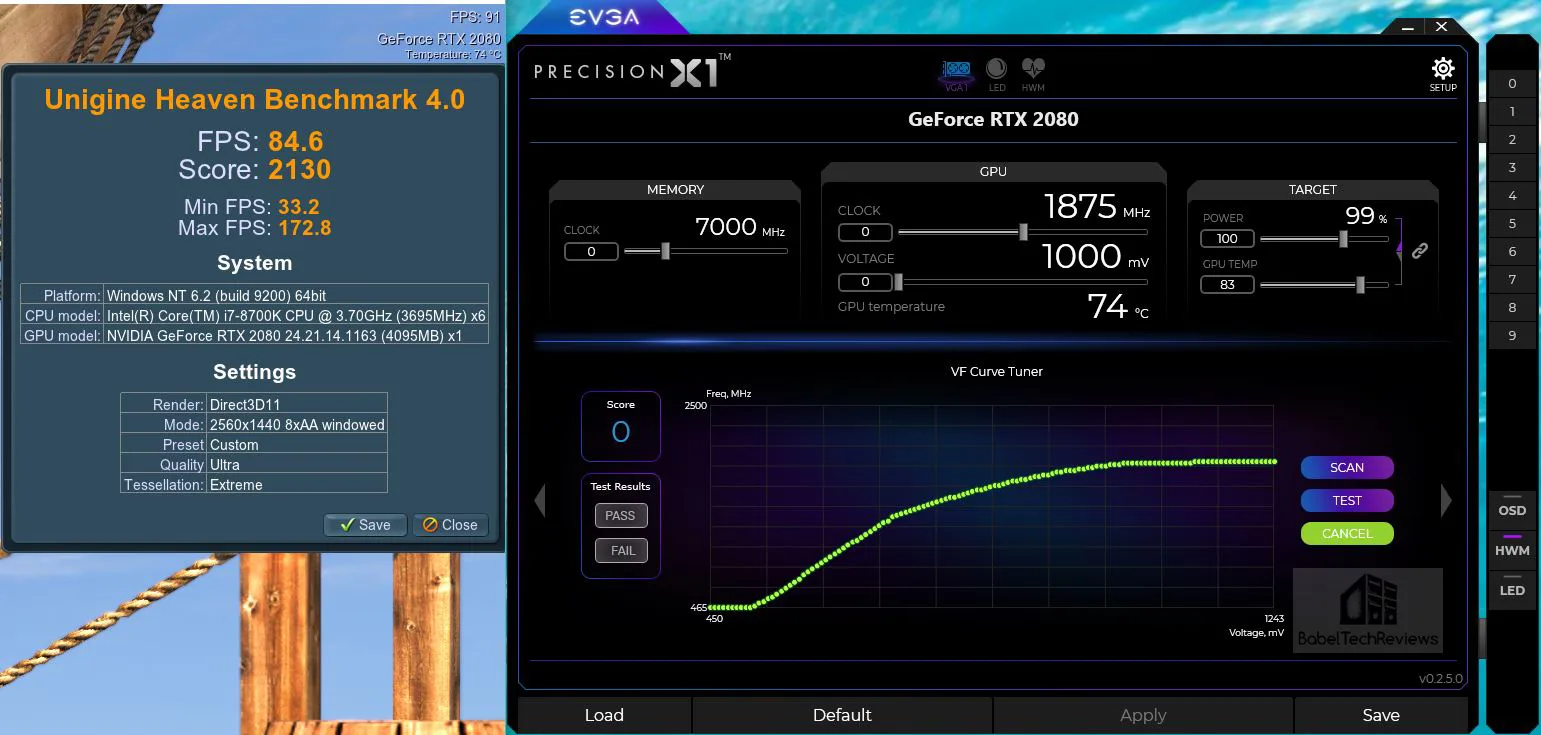
Next we run the automatic scan with stock voltage and get a score of +107 with a Boost of 2010 and get 88.5 FPS in our benchmark.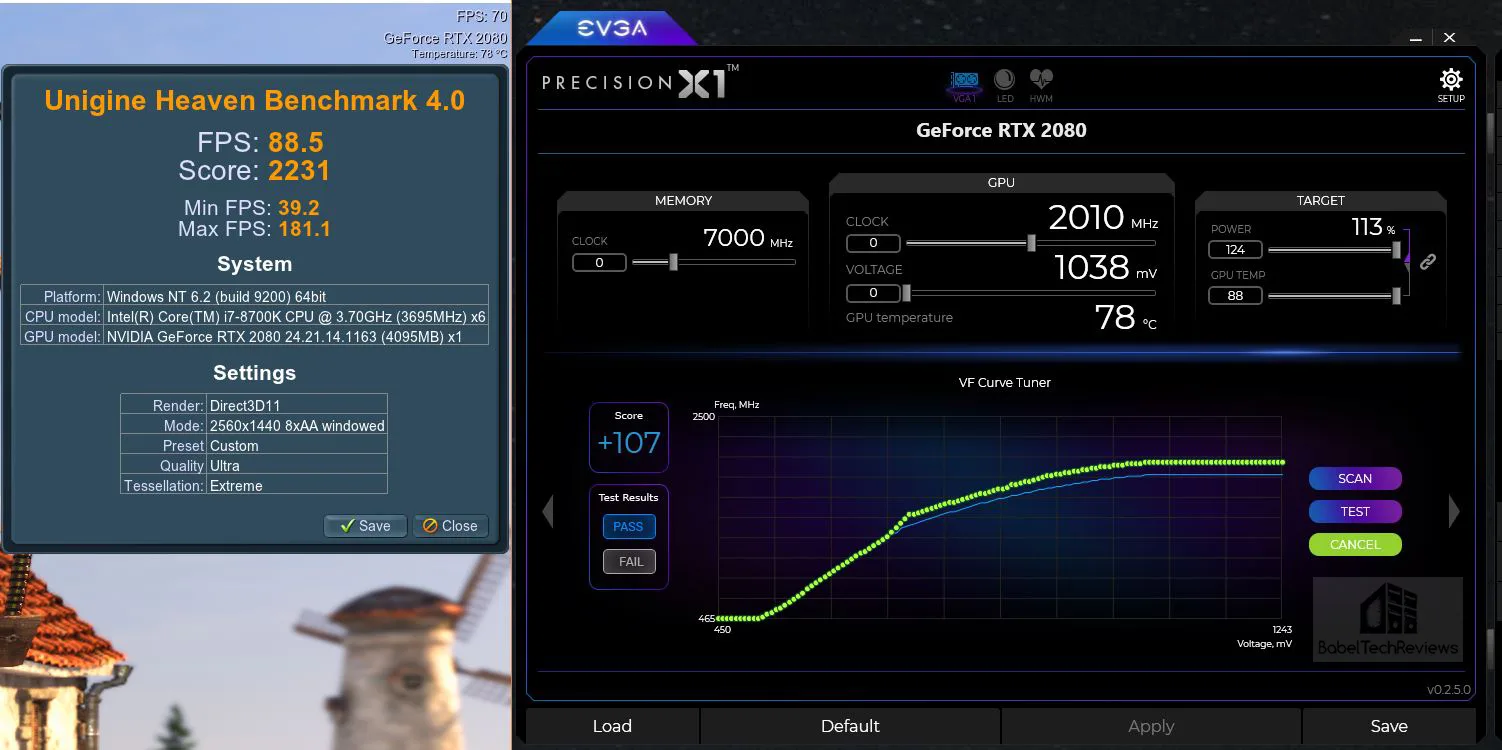
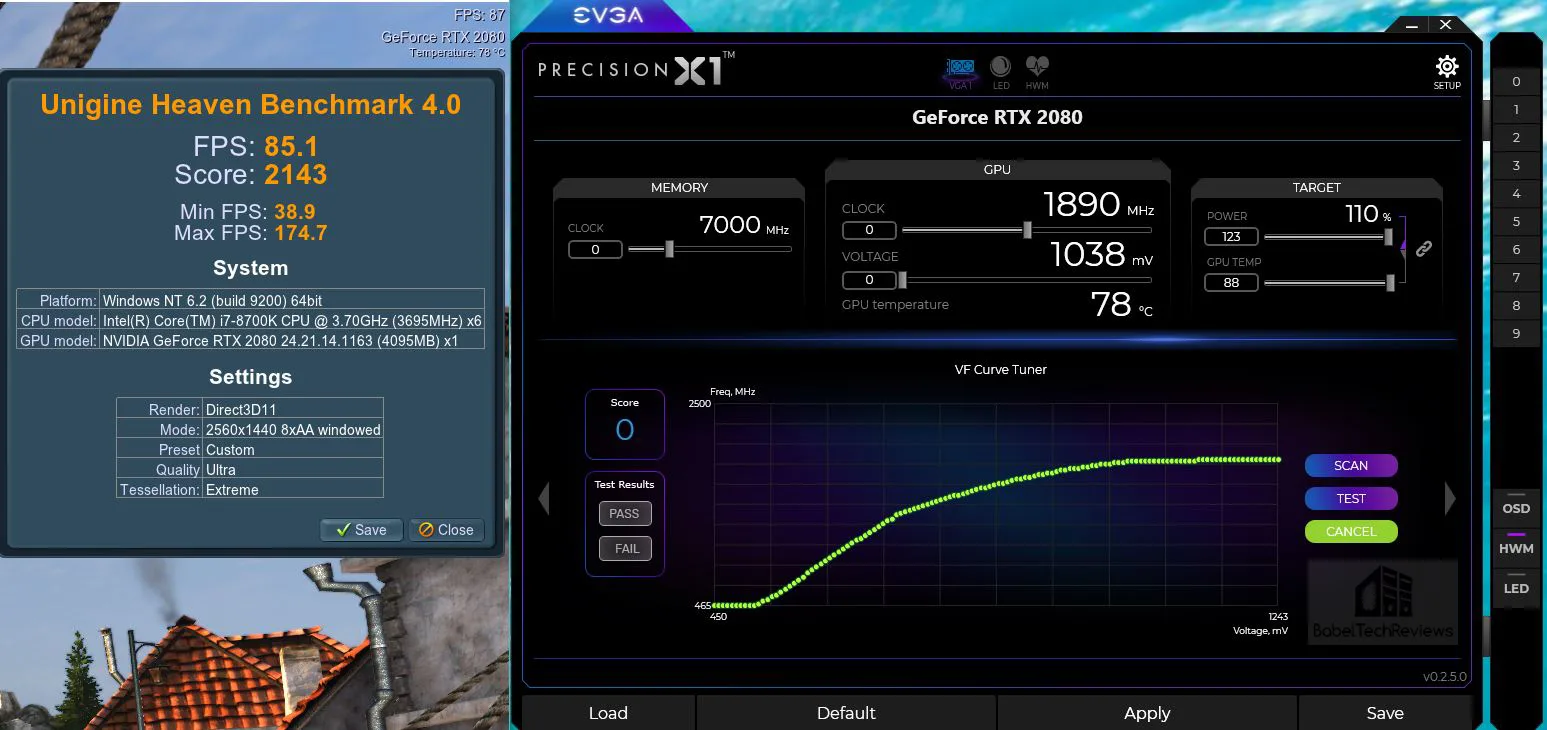
So we tried a manual scan next and added 120 MHz offset to the core but left our voltage at default. We get an identical score to the automatic scan.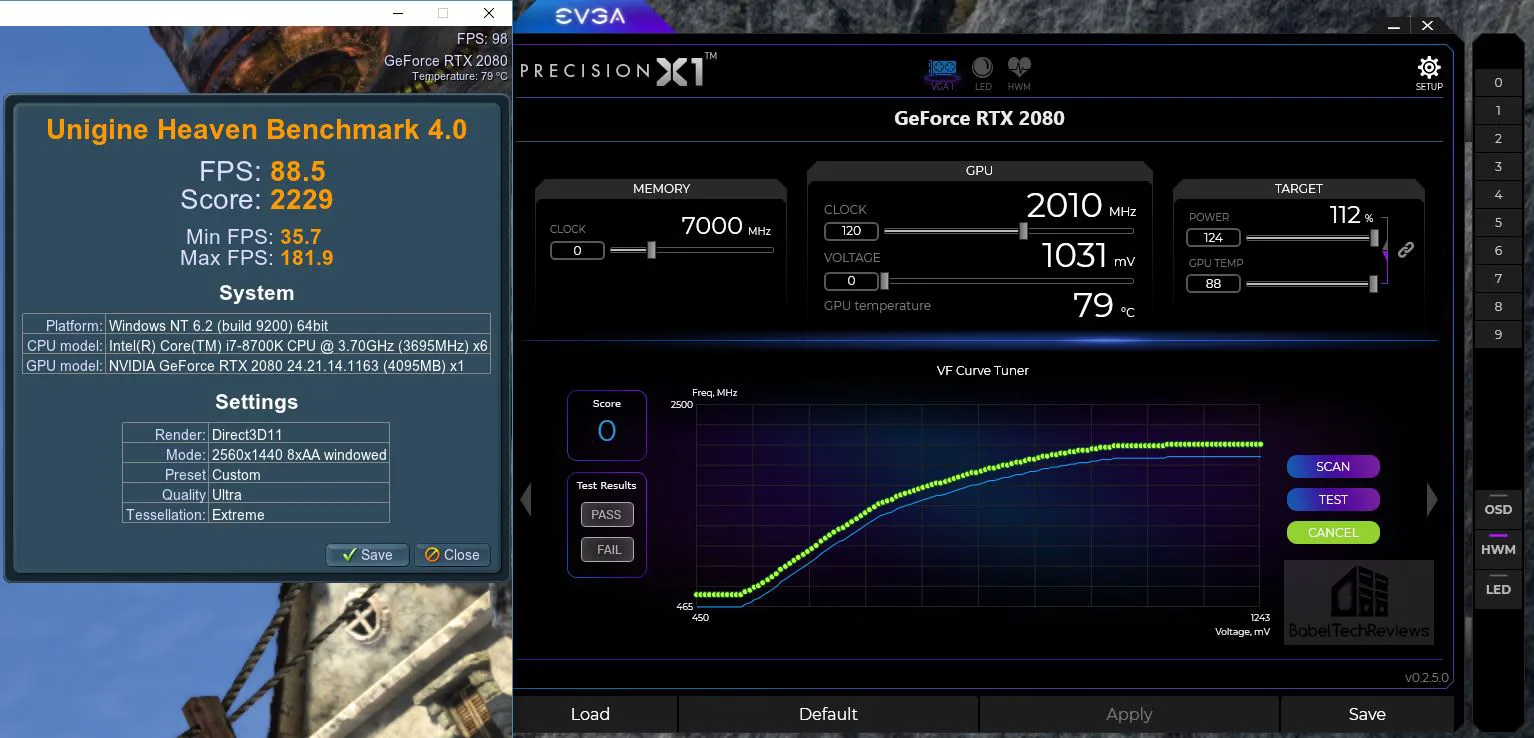
Next, we run the automatic scan with maximum voltage and see that our score has increased from 107 to 120 and we hit a boost of 2025 MHz with an increased score to 89 FPS. During the automatic scan, it never crashes to desktop or locks up, but if an unstable clock is set, it resets itself and moves on. It’s a great time saver over manually overclocking.
Now we overclock manually to our highest stable maximum core frequency. 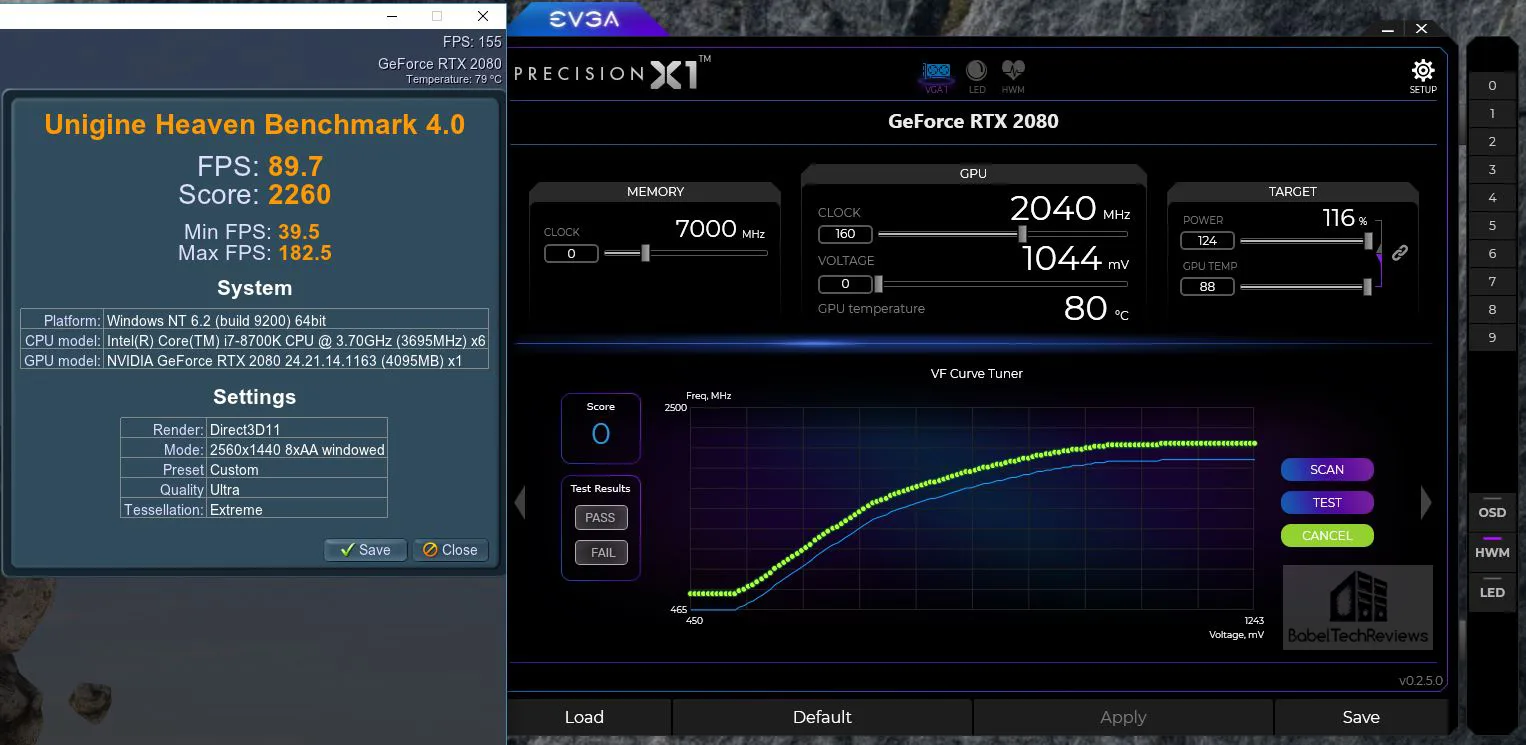 We managed +160 MHz offset with or without the voltage increased, but it turned out to be unstable in just a few games so we dropped our clocks back to a +140 MHz offset as stable across our entire benchmark suite.
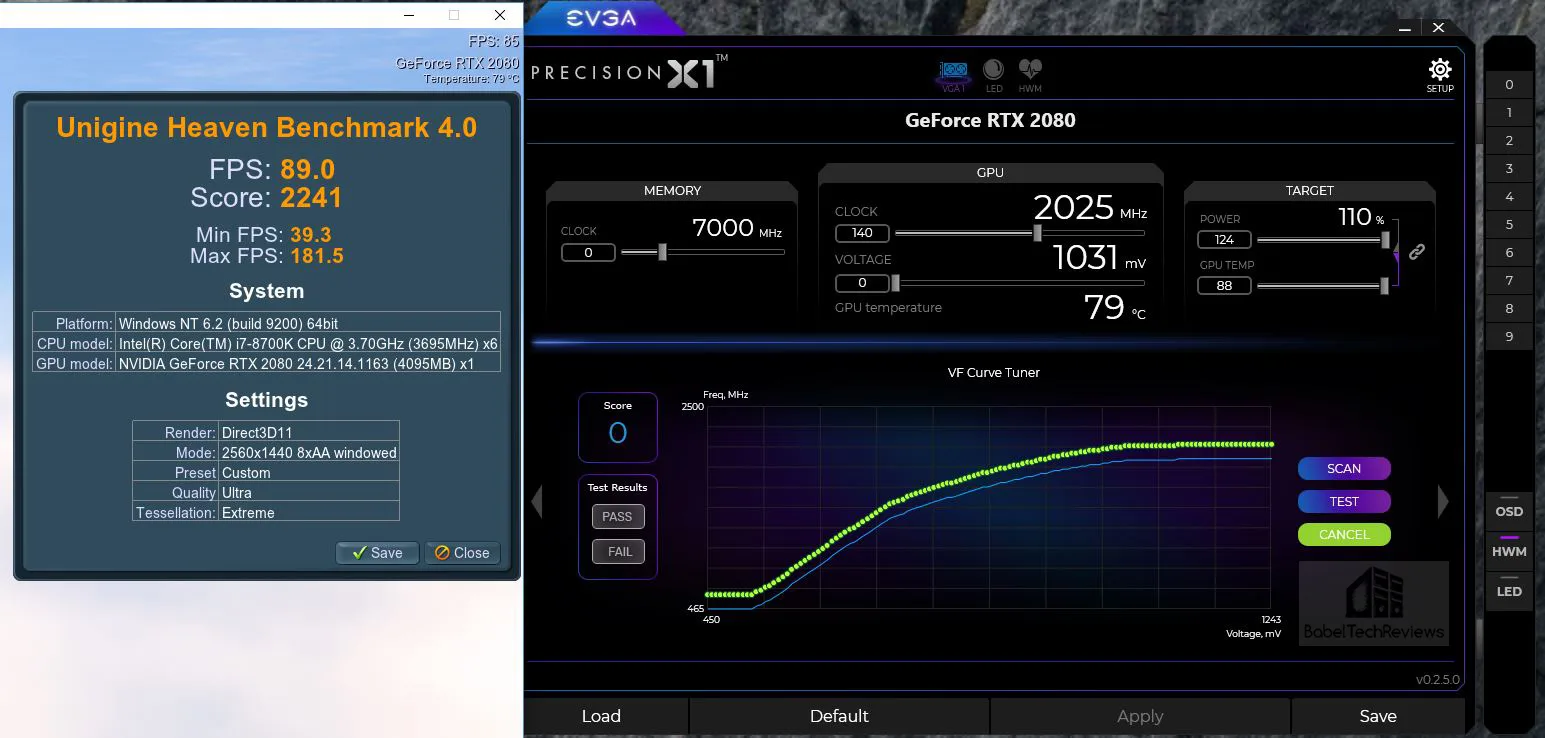 What a surprise! – our manual overclock of +140 MHz offset matches the automatic scan of 120 score that Precision 1X achieved. In some cases the score is not identical to the offset, and a higher manual offset needs to be used to match the Precision X1’s score.
The Precision X1’s overclock scanner adjusts the entire curve, at every single voltage/frequency point, so the results may vary from setting it manually. The score is the average of every single voltage/frequency curve that the scan tests during its approximately 20 minute run.
After the manual overclock is set, hit “Test” to make sure the overclock is stable. We passed at +160 MHz, and were stable for most of our games, but not all.
We overclocked the GDDR6 memory next and got 620 MHz offset which was stable for most of our games. Overclocking the memory also gives some performance gains and our maxed out Heaven 4.0 benchmark managed 92.5 FPS with the core boosting to 2040 MHz.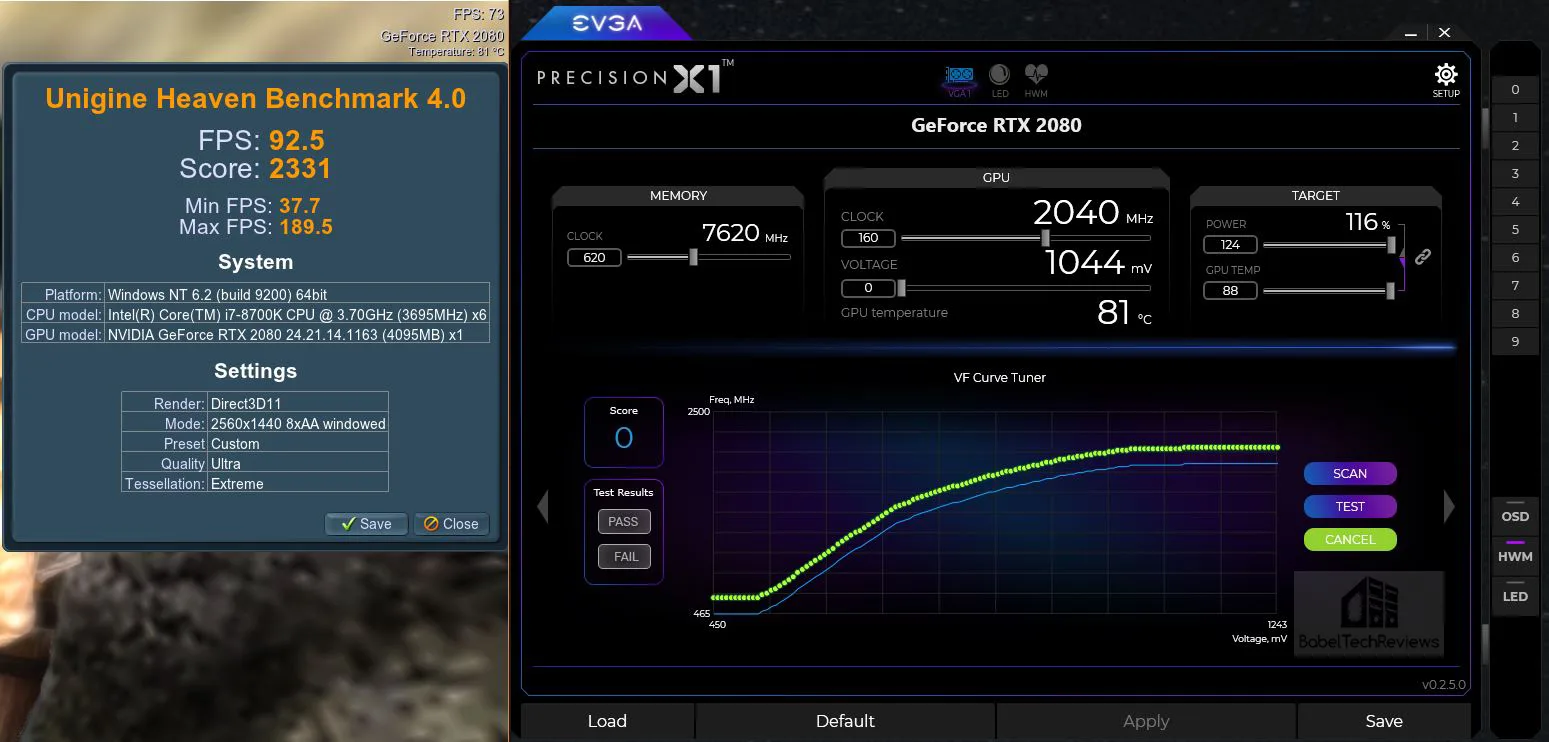 Our manual overclock turned out to be unstable in a few games, so we settled on a final conservative overclock of +140 MHz offset to the core and +590 MHz offset to the memory for a solid RTX 2080 overclock with a steady Boost 4.0 of at least 2025 MHz.
At maximum overclock, temperatures peaked at around 81 degrees with no throttling, and noise was never an issue with the dual-fan RTX 2080 Ti FE. In contrast the GTX 1080 Ti FE’s fan would ramp up noticeably as temperatures increased, and it is a louder card since it is a blower design.
We are unsure if our maximum overclock of +160 MHz offset to the core is actually unstable or if there are some driver issues at play with the new Turing card. In particular, we noticed that Total War: Warhammer II has issues with running it’s benchmark and there is a huge hitch at the beginning; Rainbow 6: Siege repeats a second or two of the benchmark at its beginning so the reported minimums are unreliable (we used Fraps); and Grand Theft Auto V also has some issues running its benchmark that we didn’t see with the GTX 1080 Ti.
Overall our impressions of Precision X1 are excellent regarding its ability to automatically test and set a very decent overclock quickly. However, it is beta software and there still are some rough edges. It rarely locked up but it doesn’t always save its settings after a reboot, so the user needs to check the settings each time they start or restart Windows. One feature we would love to have added as an update to Precision X1 is an automatic scanner to overclock the GDDR6.
Overclocking the GTX 1080 Ti
We overclocked the GTX 1080 Ti last in our review versus the overclocked Titan Xp. “We were able to add 150 MHz to the core and a 500 MHz offset to the memory … with the result that we reached a steady 1999 MHz core and 6000 MHz (12000 MHz) memory clocks.”
Time and electromigration have not been particularly kind to our GTX 1080 Ti Founders Edition. It has been our primary test and gaming card for two years and it can no longer achieve the same overclock. Our current stable overclock allows for +135 MHz offset to the core and +350 MHz offset to be added to the memory with its unlocked core voltage maxed out.
We are pitting a moderately overclocked GTX 1080 Ti FE against an overclocked RTX 2080 FE to see how well each of them scale in games, and to compare relative gains made from overclocking each card. There are faster GTX 1080 Tis which overclock better, and also better overclocking RTX 2080s.
This evaluation should give a rough idea of how well these Turing and Pascal GPUs scale with overclocking and how they compare with each other, especially considering that they are in a similar price range.
Let’s check the performance results of 36 games with our games at stock and overclocked speeds using the Founders Editions of the RTX 2080 versus the GTX 1080 Ti.
The Summary Chart & Conclusion
Here are the summary charts of 36 games and 2 synthetic tests. The highest settings are always chosen and the settings are listed on the charts. All benches were run at 2560×1440, and at 3840×2160.
Game performance results show average framerates and higher is always better. Minimum framerates are next to the averages in italics and in a slightly smaller font. A few games benched with OCAT show average framerates, but the minimums are shown in frametimes that are expressed in ms where lower numbers are better.
The first column represents stock RTX 2080 performance which should be compared with the GTX 1080 Ti’s results in the fourth column. The overclocked RTX 2080 results are presented in the second column which should be compared with the overclocked GTX 1080 Ti results in the third column. “Wins” for stock values are expressed in yellow text, and overclocked wins are presented in orange. If both cards are equal, each set of results are given in colored text.

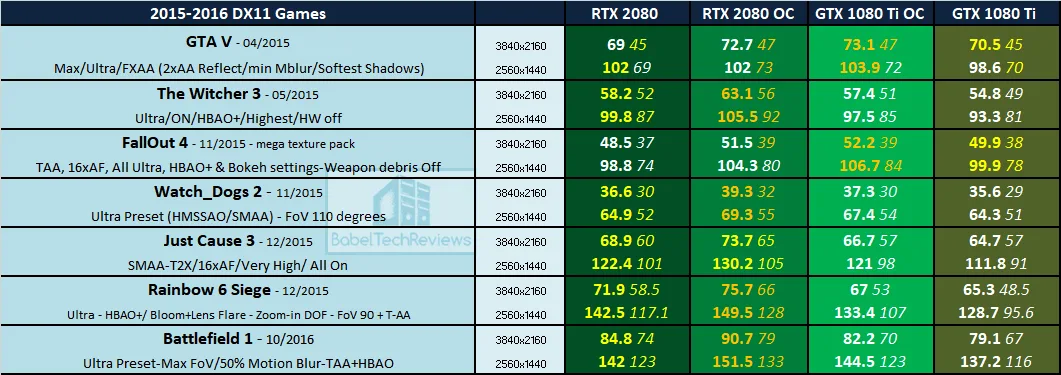
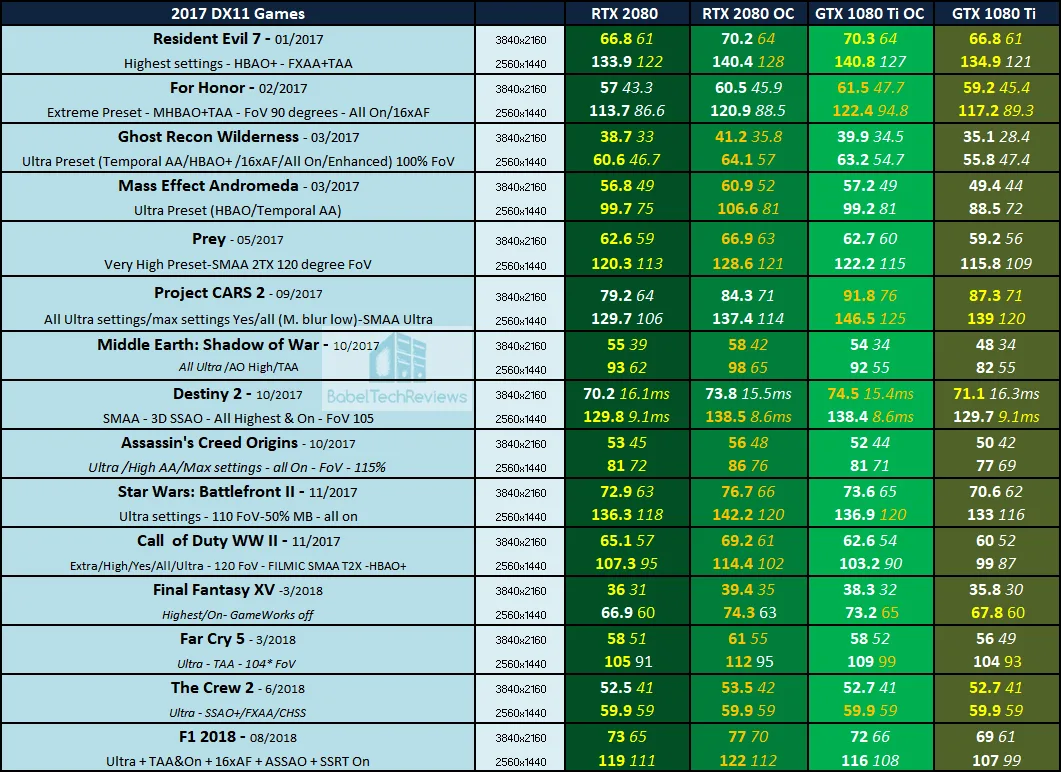

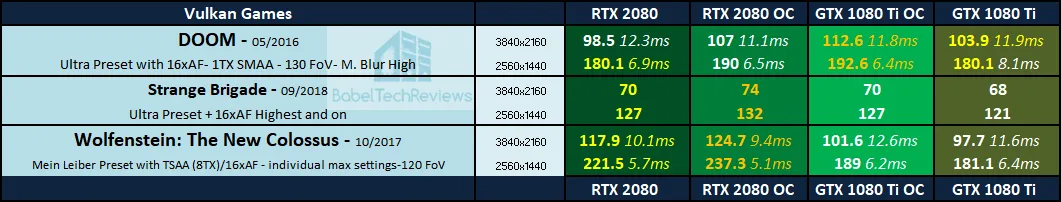
We generally see good scaling with our maximum overclock of each card over stock settings. In some cases, the framerate increase makes a difference to the playability of some of the games. Overall, the RTX 2080 gains a few more “wins” than the GTX 1080 Ti does from overclocking, and the Turing card remains faster than our Pascal card overall.
Let’s head to our conclusion
Conclusion:
We would highly recommend overclocking the RTX 2080 with Precision X1. Overclockers will enjoy its new features which fully unlock Turing’s GPU Boost 4.0, and auto overclocks are a lot easier to set than manually. Our manual overclock took a couple of hours to find and it was barely faster than the automatic scan which found stability in less than 20 minutes!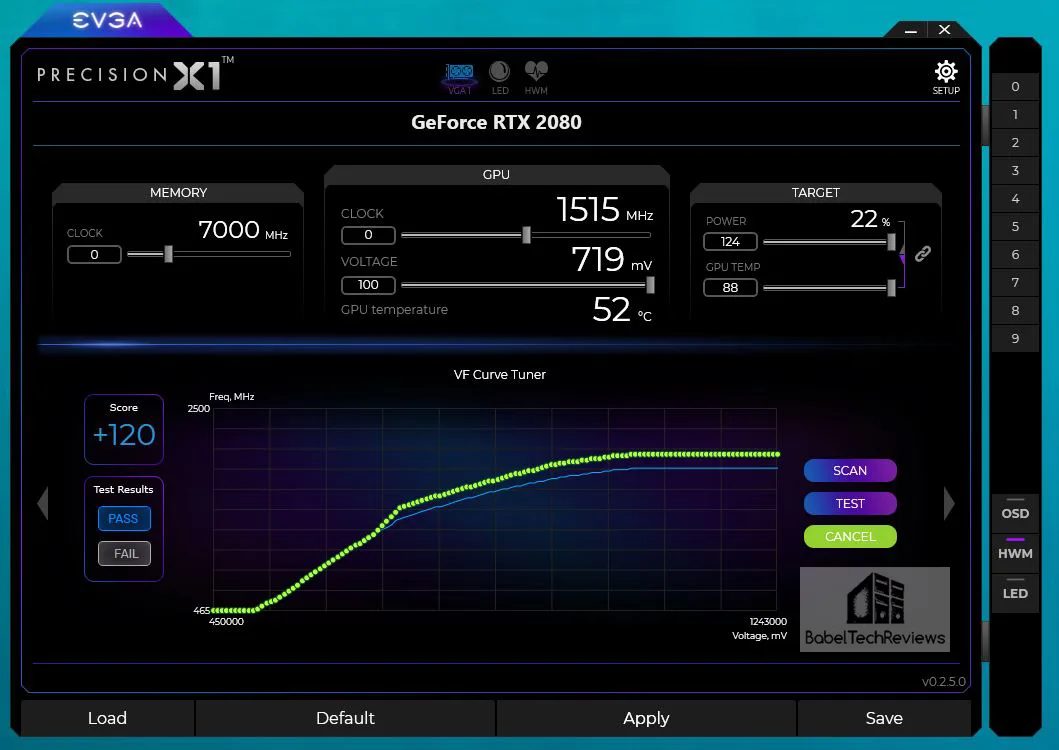
Compared with the original buggy beta Precision XOC that was released with Pascal, the beta Precision X1 for Turing GPUs is stable and we had very few issues with it. It’s recommended for all overclockers as a great beginning – or end – for any overclock which can also be fine-tuned manually.
For several games in our benching suite, overclocking either card brought noticeable gains, sometimes making a difference in having more fluid performance especially in borderline situations.
The Verdict
We find that the Founders Edition of the RTX 2080 overclocks and scales very well and it maintains its overall performance advantage over the GTX 1080 Ti at stock speeds or overclocked. We like this new and powerful Turing RTX card and we look forward to testing out its new anti-aliasing features with DLSS and with ray tracing in games. If the RTX 2080 is priced similarly to the GTX 1080 Ti, we would highly recommend it over the older generation card.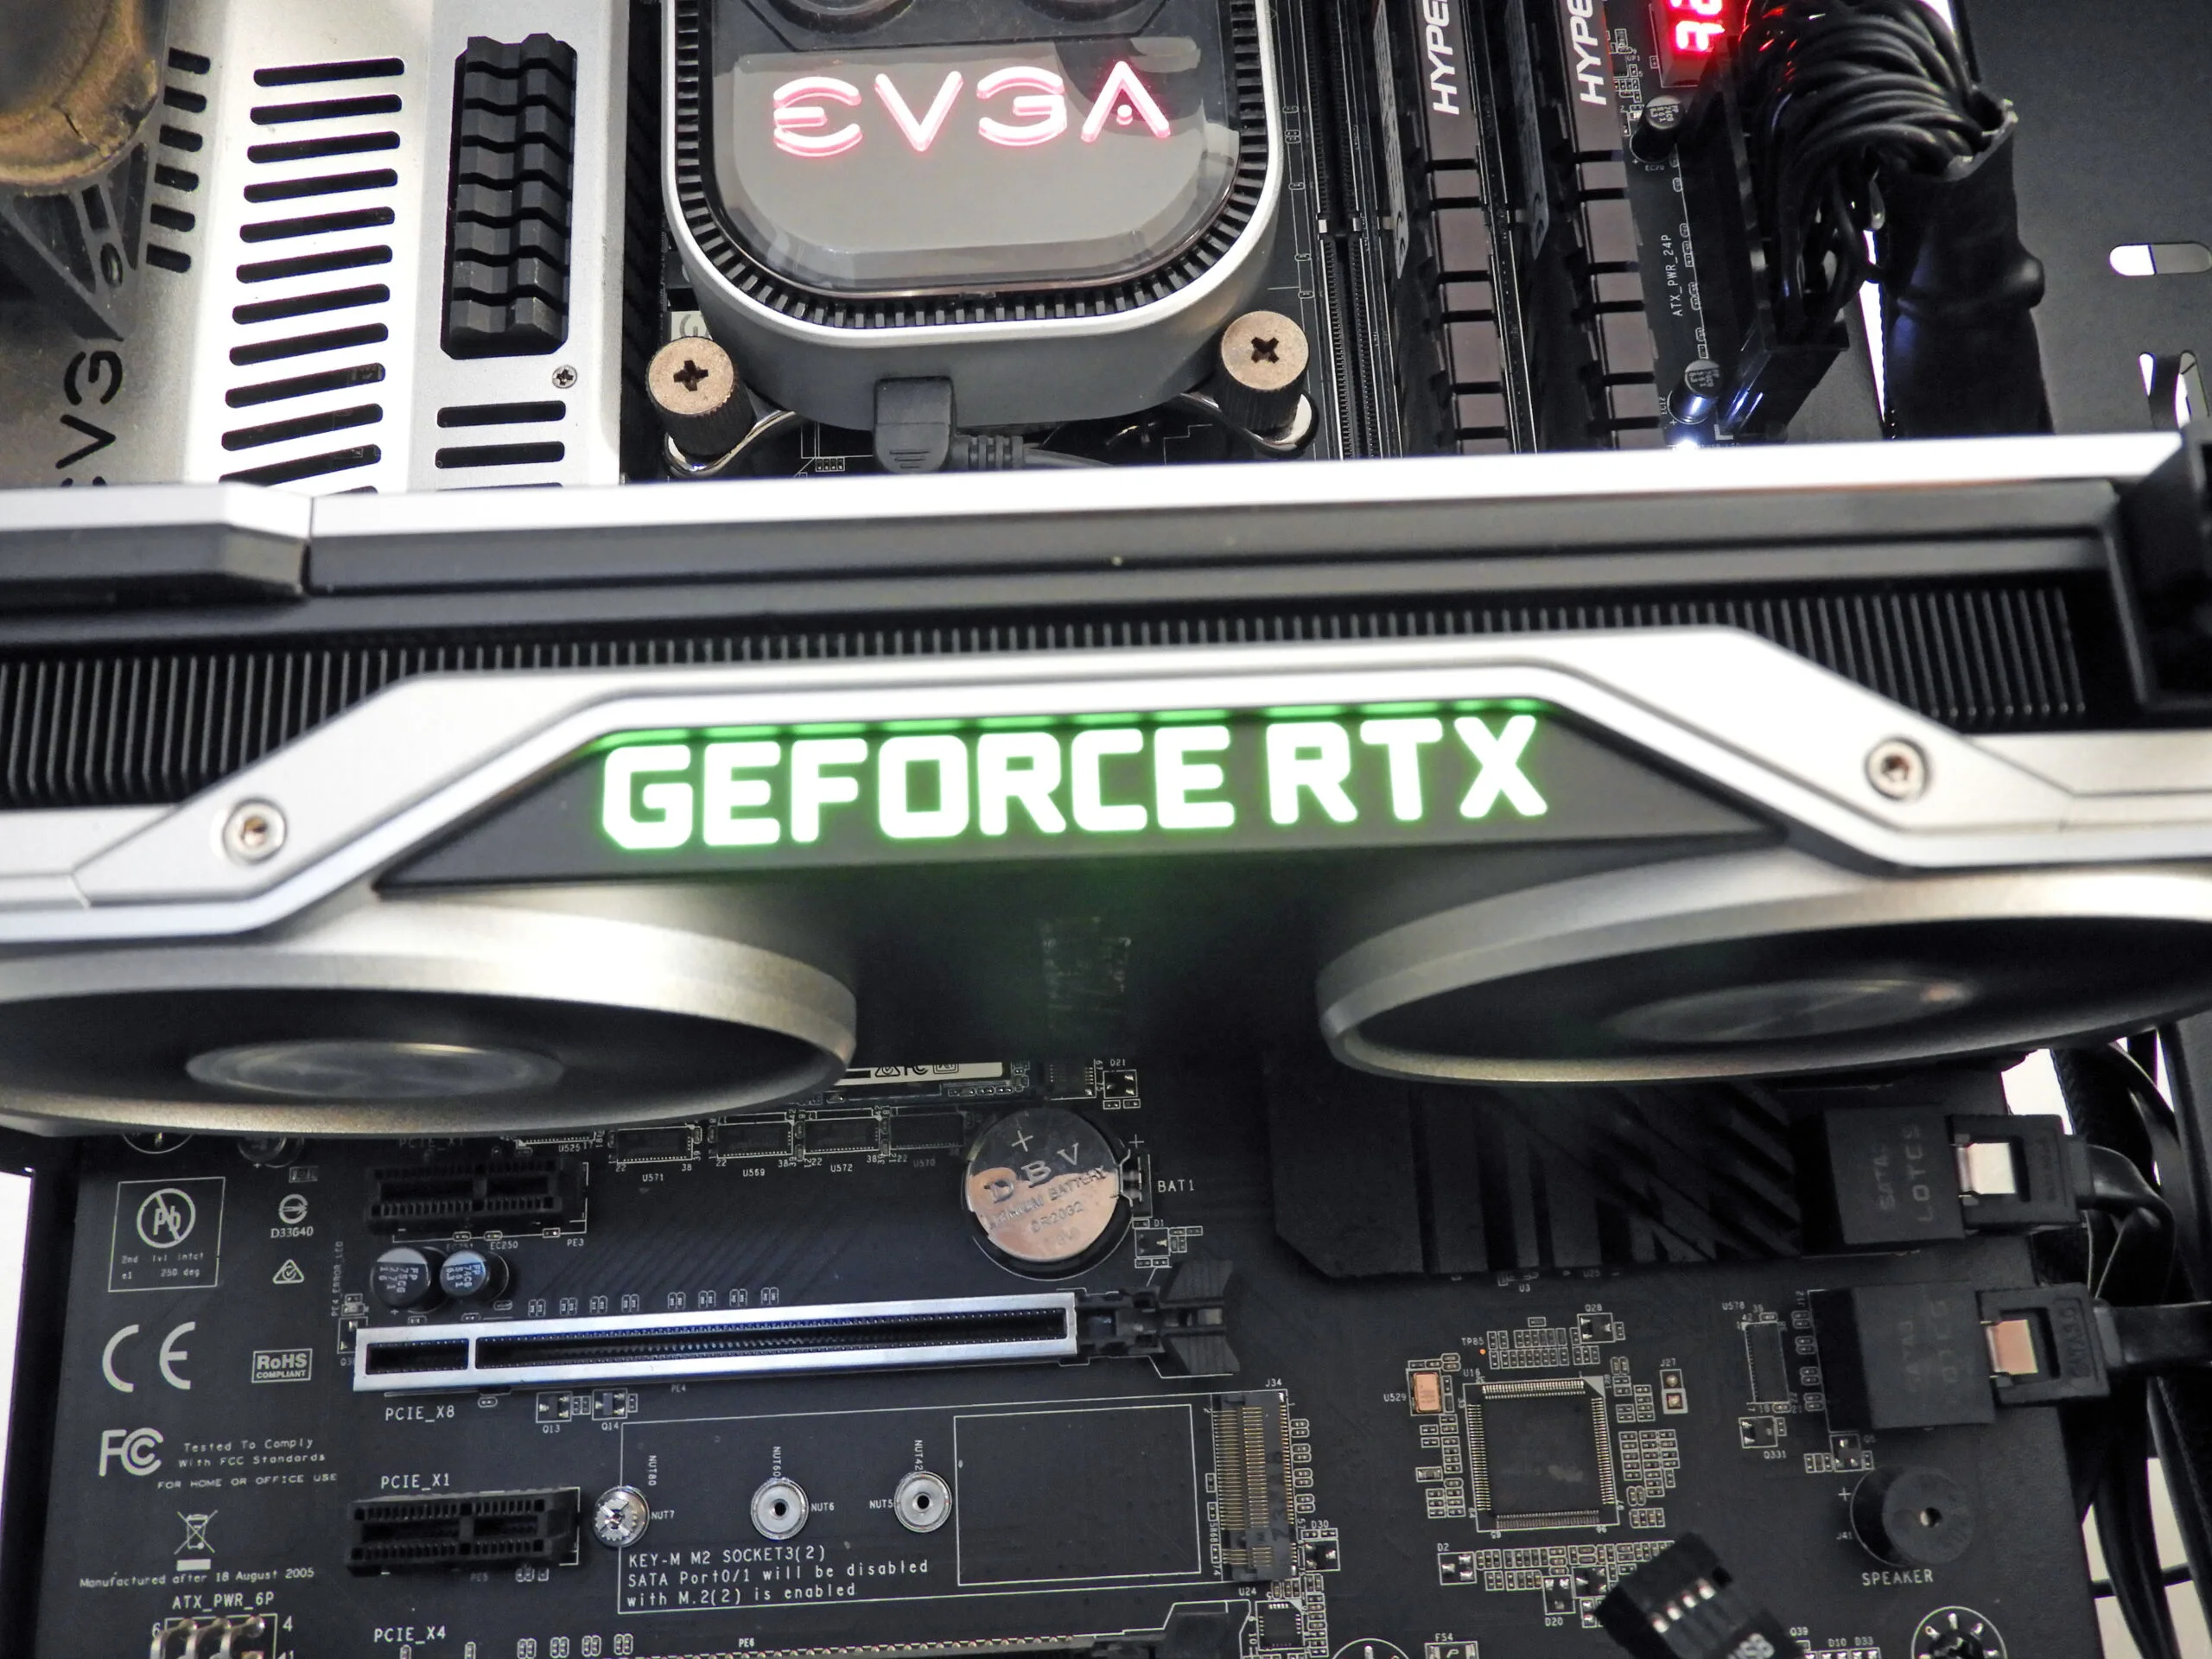
We have a lot of interesting upcoming evaluations planned for our readers. Next up is the Vive Pro benchmarked by FCAT-VR using the RTX 2080 Ti and RTX 2080 and compared with the GTX 1080 Ti, GTX 1080, and Vega 64.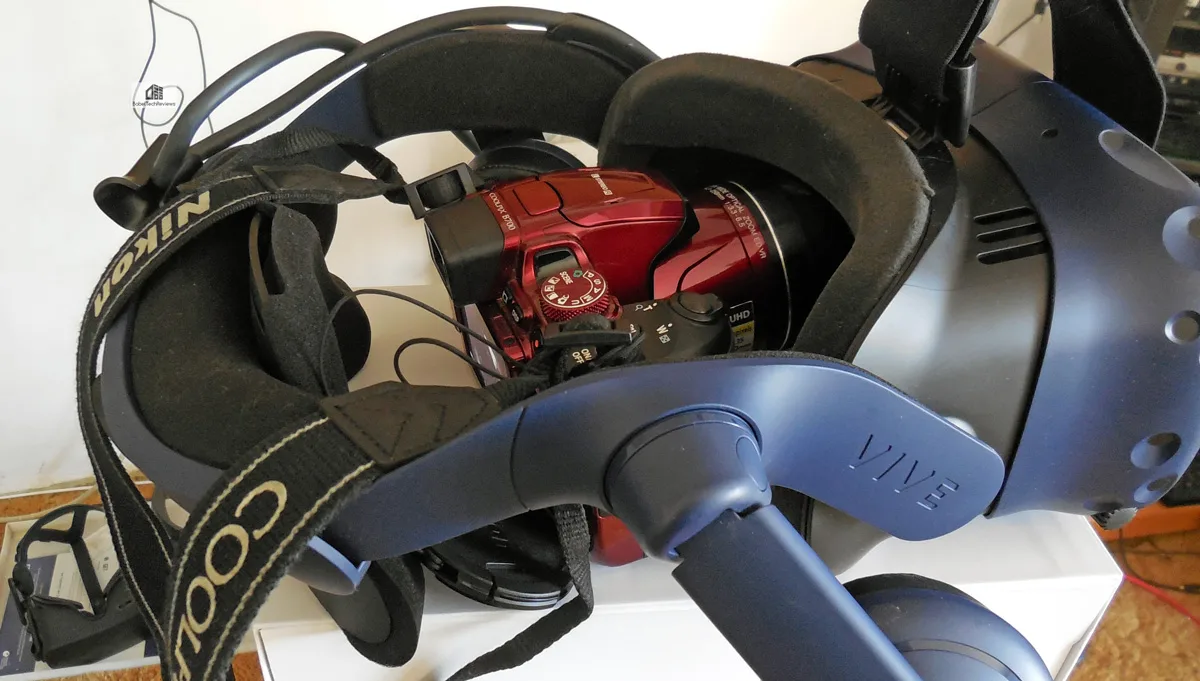
Happy gaming!