Overclocking Showdown: the Red Devil RX 6900 XT versus the RTX 3090 Founders Edition (Part 3)
This overclocking showdown is the final follow-up to the two Red Devil RX 6900 XT reviews last week versus the RTX 3090 Founders Edition (FE). Today, we have optimized our overclocks with all performance options set to their highest limits to get the most performance from each card.
At stock, the Red Devil $1139/1179 RX 6900 XT trades blows with the $1499 RTX 3090 FE in rasterized games although it is slower overall. The Red Devil 6900 XT also provided a better VR experience than the RX 6800 XT although its performance again fell short of the RTX 3090 FE’s VR performance. This time, we will overclock the each card as far as they will go to see where they stand in relation to each other when manually overclocked.
Overclocking the Red Devil RX 6900 XT
The Red Devil version of the RX 6900 XT is factory overclocked 90MHz higher than the reference version at 2250MHz using the OC BIOS. According to its specifications, the Red Devil RX 6900 XT boost can clock up to 2340MHz out of the box. We benched it using out of the box settings at its default Power Limit setting of 280W and looped Heaven 4.0 in a 1440P window at max settings to load the GPU to 98%.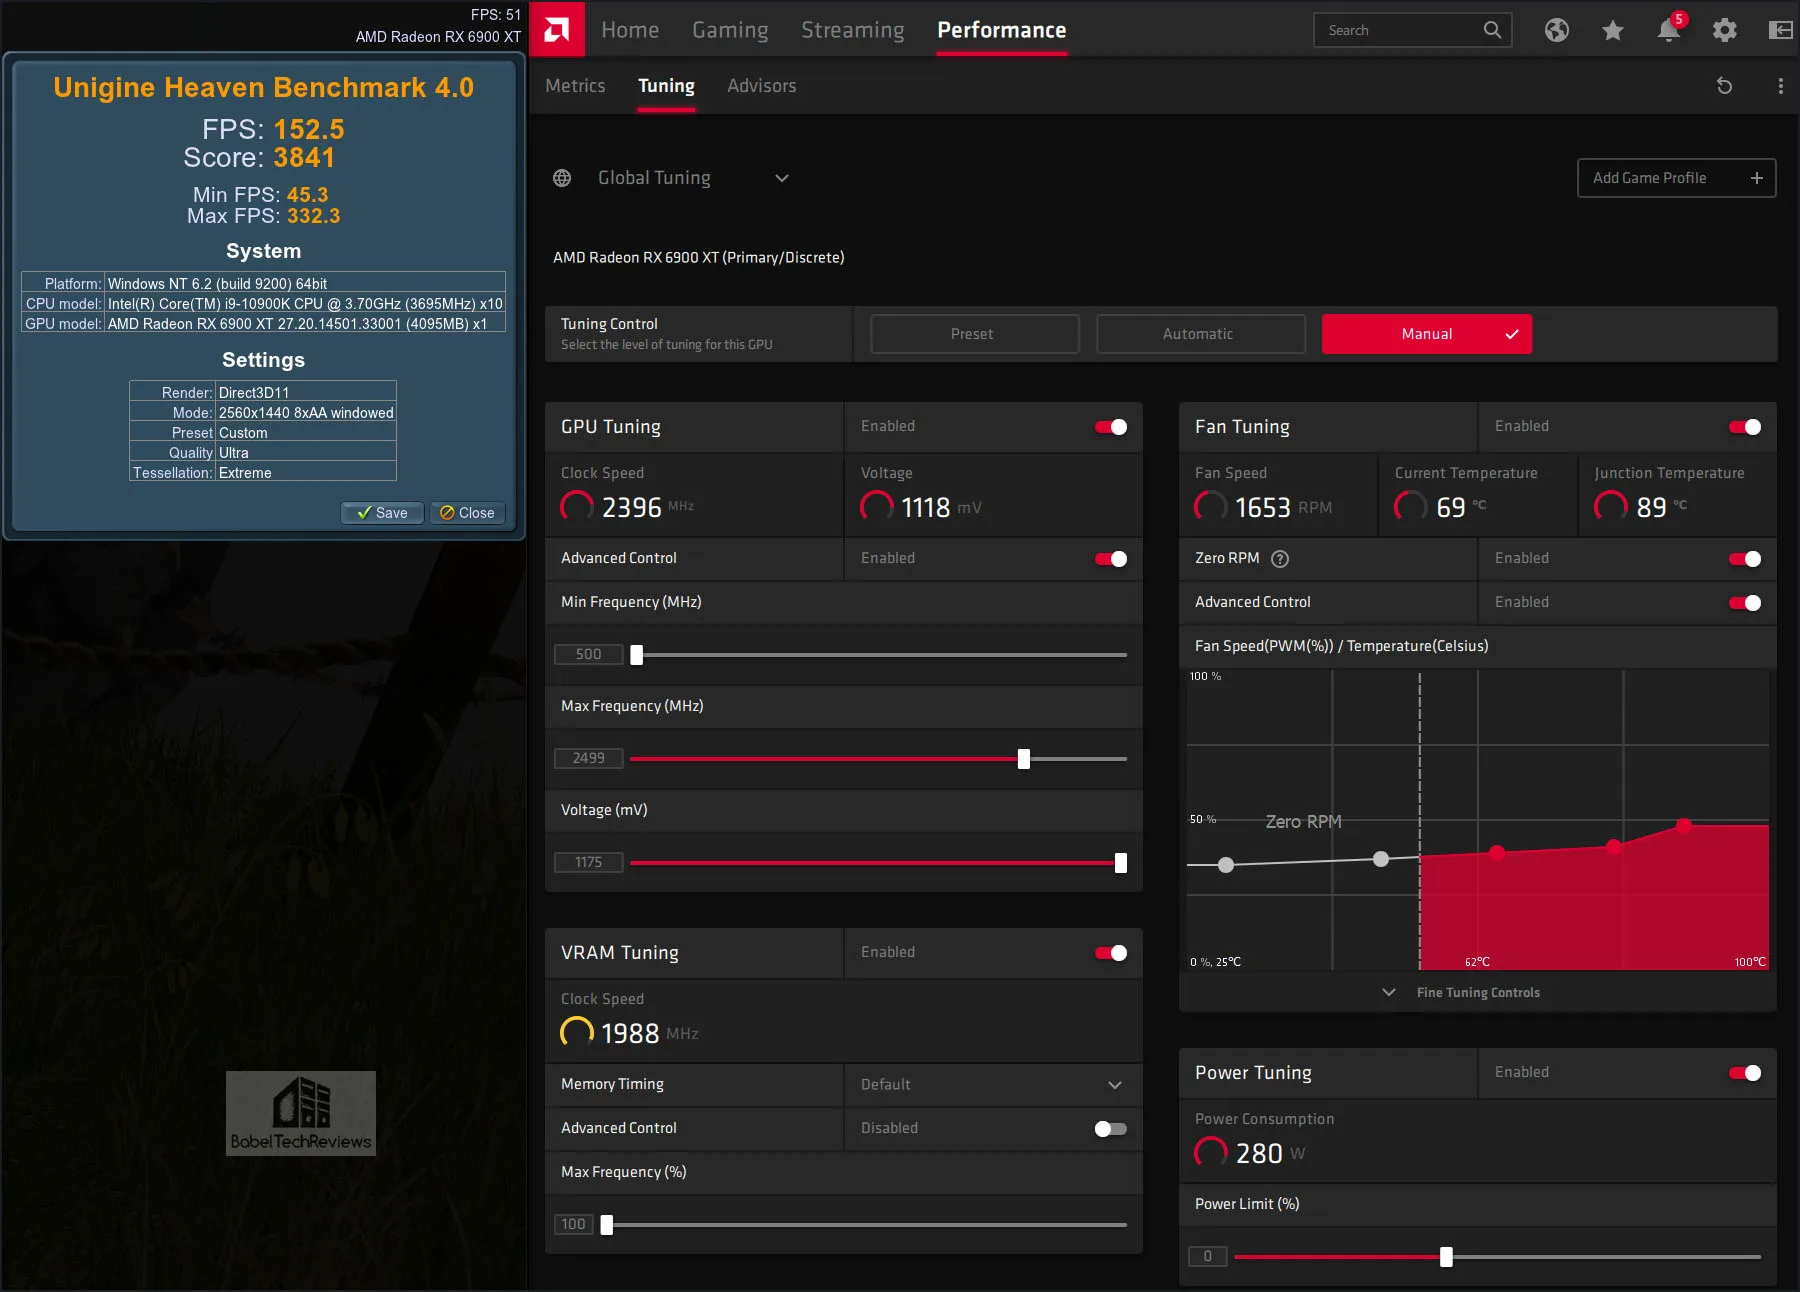
We generally see it boosting even higher than its rated specs, and it generally settles in above 2380MHz with peaks above 2400MHz. Increasing the Power Limit to its maximum (320W) we see a small increase in performance.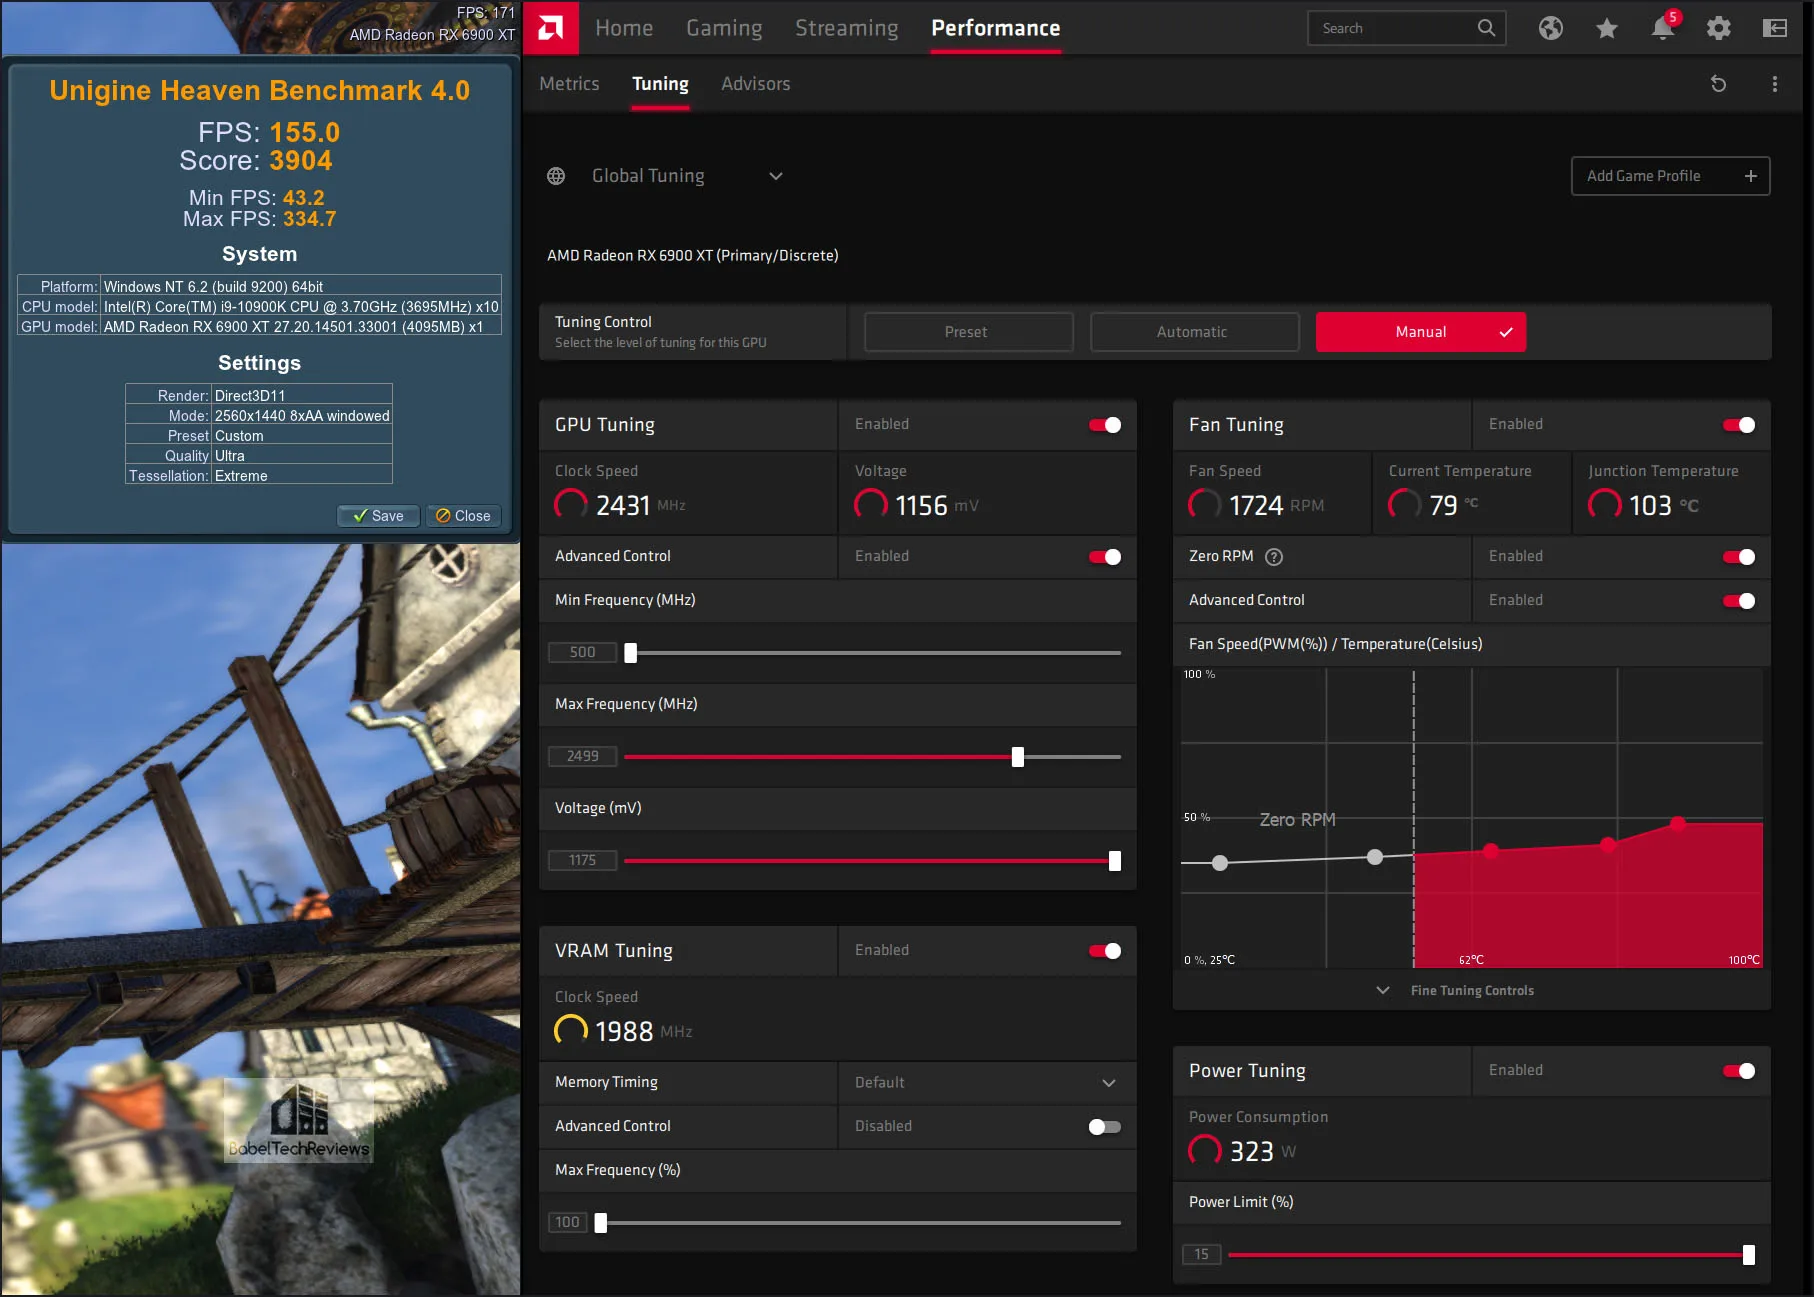
It will boost about 35MHz higher with a maxed out Power Limit slider, and we tested its 320W performance compared with out of the box 280W performance using synthetic benches which are sensitive to overclocking and also very accurate.
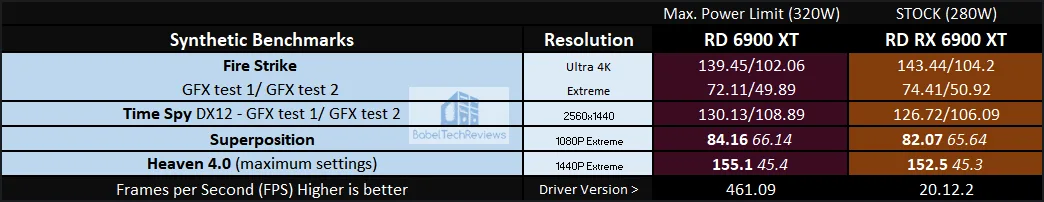
There is approximately a 1-3% performance increase with 40W added, so some enthusiasts may prefer to undervolt rather than overvolt their Red Devil depending on their preferences.
This isn’t much performance additional performance to be gained either with the RTX 3090 that gains about 2-5% by increasing its power limit. But we want to see how a maximum core and memory overclock will increase the Red Devil’s performance without consideration for the power usage.
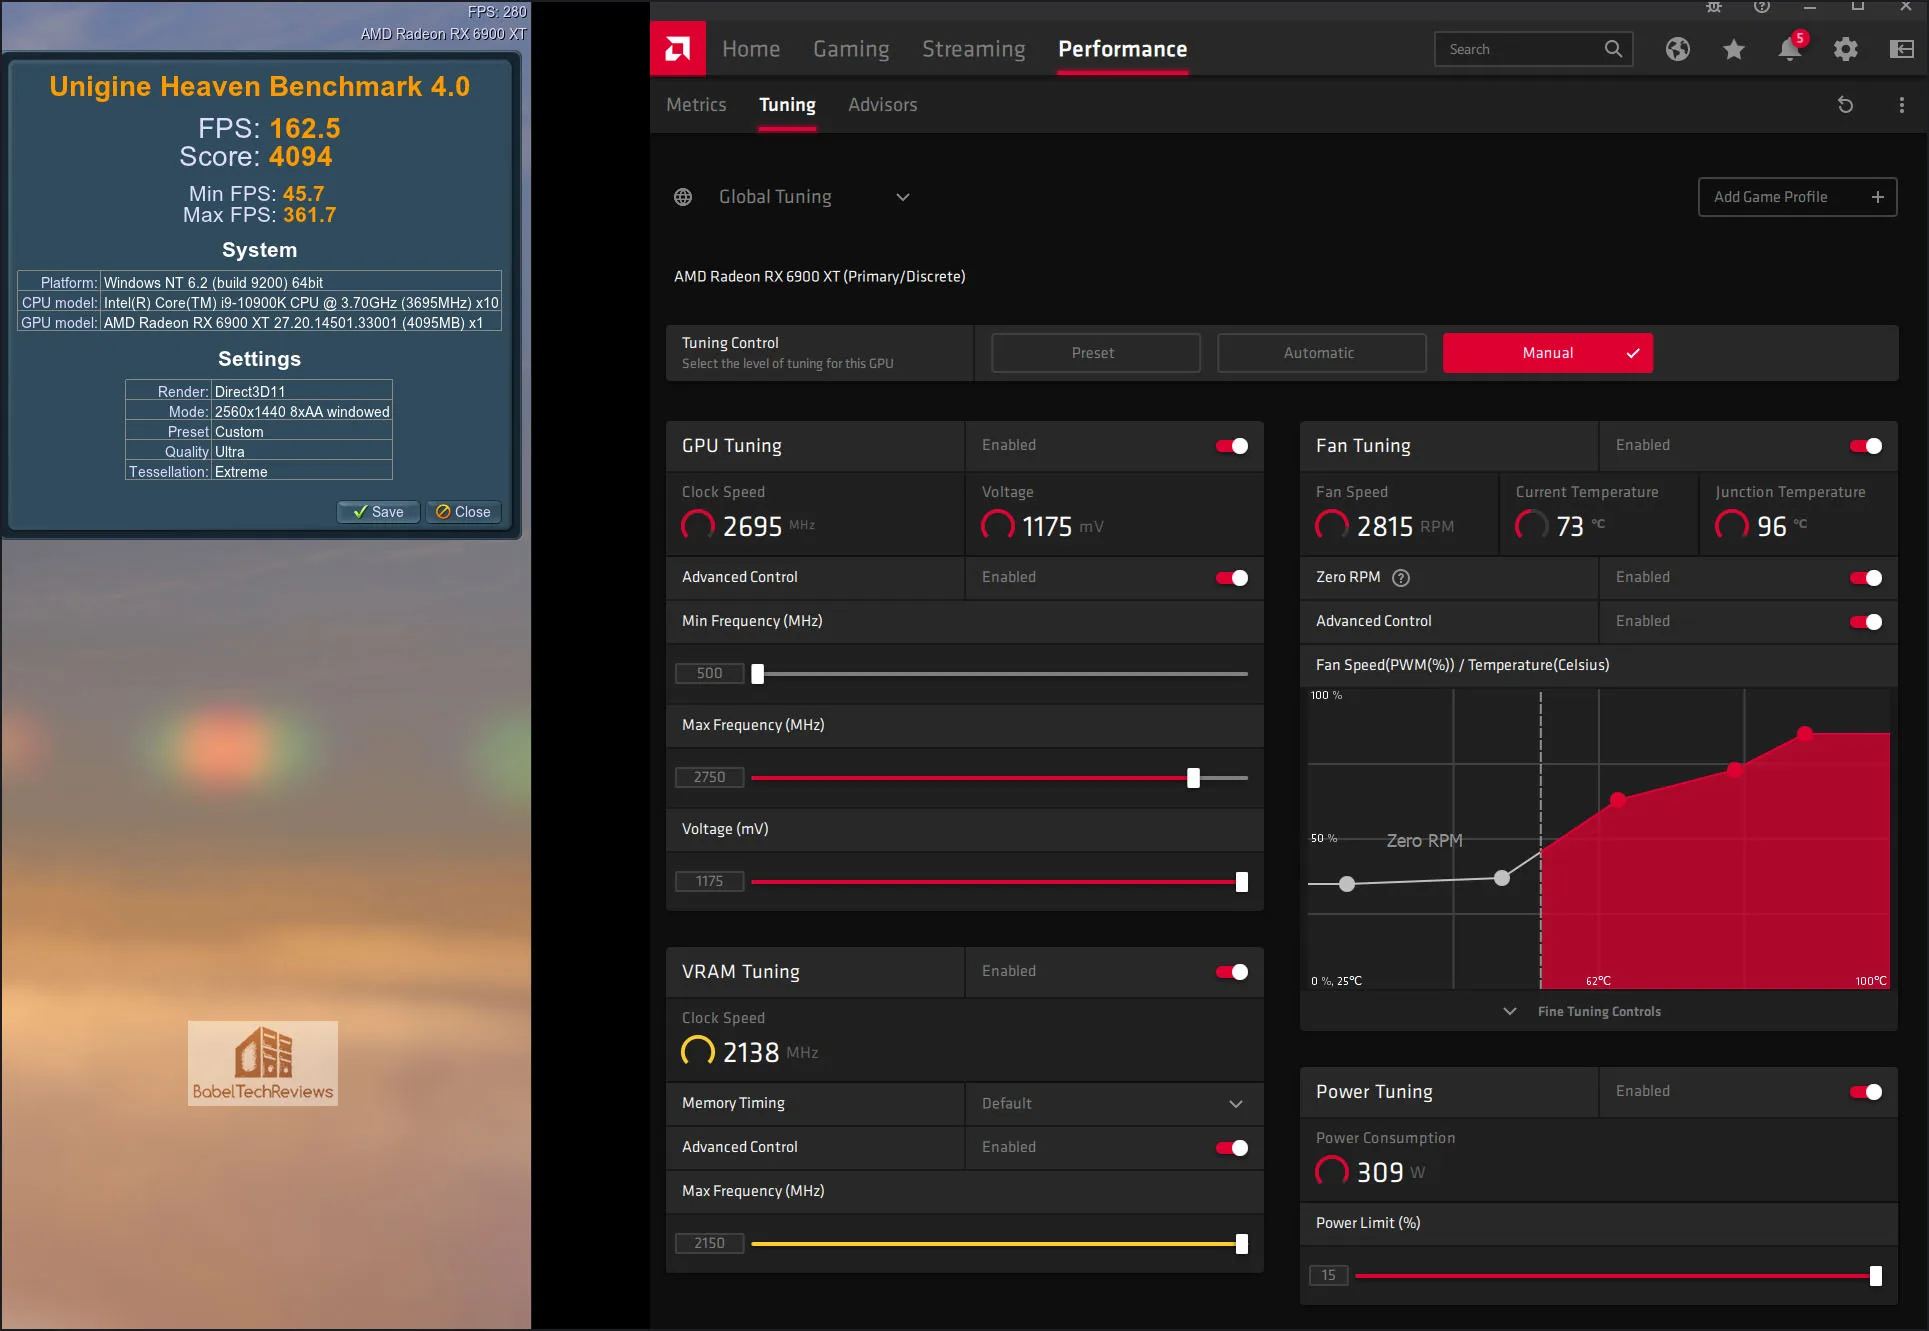
We maxed the Power Limit, added the maximum voltage, maxed the memory OC slider to the right to add 7% more frequency, and moved the Max Frequency slider to 2750MHz after testing each +25MHz increment between 2600 and 2800MHz. Each increase in the maximum core frequency increased performance slightly which we confirmed as we looped Heaven 4.0. We were stopped dead at 2775MHz when the PC locked up.
We were disappointed with the performance increases until we also increased the fan profile to keep the GPU below 74C. Although, the fans started to become more audible, the performance stabilized and the GPU no longer throttled. With a cooler running GPU, the core clocks stayed relatively steady just below 2700MHz which is about 250MHz above the default Red Devil core clocks and the voltage pegged at 1175mV as the card consistently drew more than 300W, peaking above 320W.
Before we compare the Red Devil’s overclocked performance with the RTX 3090 FE, let’s look at its chief competitor’s overclock.
Overclocking the RTX 3090 FE
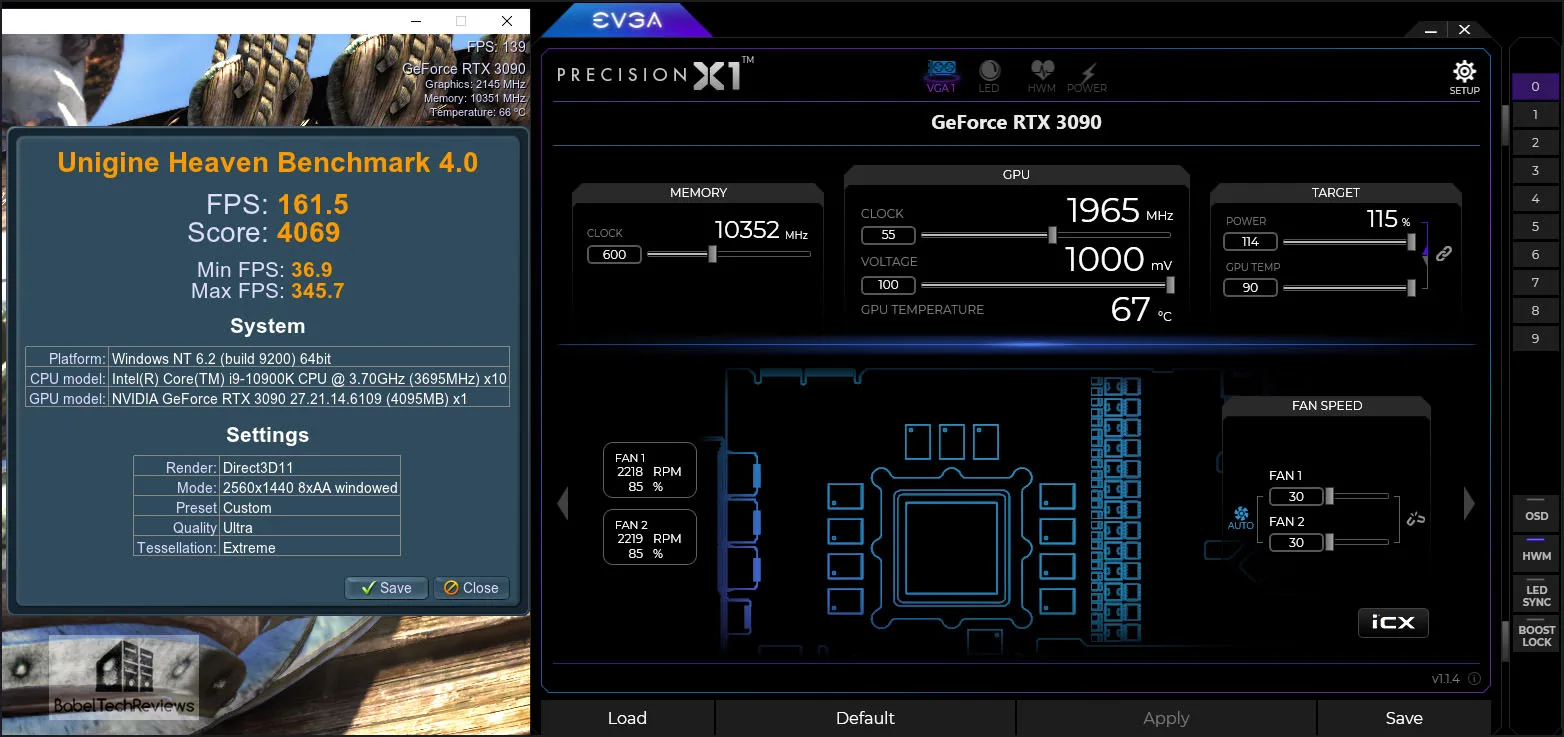 We devoted a separate evaluation to the RTX 3090 which you can read here. After testing multiple combinations further, our RTX 3090’s final stable overclock for this review to achieve the highest overall performance adds +55 MHz offset to the core and +600 MHz to the memory to perform above 1950MHz
The RTX 3090 FE is power-limited, and to achieve a higher overclock will take more voltage than what adding .1mV can deliver. But before we compare the RTX 3090 at stock and overclocked with the Red Devil RX 6900 XT, please check out our testing platform and configuration.
Test Configuration – Hardware
- Intel Core i9-10900K (HyperThreading/Turbo boost On; All cores overclocked to 5.1GHz/5.0Ghz. Comet Lake DX11 CPU graphics)
- EVGA Z490 FTW motherboard (Intel Z490 chipset, v1.9 BIOS, PCIe 3.0/3.1/3.2 specification, CrossFire/SLI 8x+8x), supplied by EVGA
- T-FORCE DARK Z 32GB DDR4 (2x16GB, dual channel at 3600MHz), supplied by Team Group
- Red Devil RX 6900 XT 16GB, stock and overclocked, on short term loan from PowerColor
- RTX 3090 Founders Edition 24GB, stock and overclock, on loan from NVIDIA
- 1TB Team Group MP33 NVMe2 PCIe SSD for C: drive
- 1.92TB San Disk enterprise class SATA III SSD (storage)
- 2TB Micron 1100 SATA III SSD (storage)
- 1TB Team Group GX2 SATA III SSD (storage)
- 500GB T-FORCE Vulcan SSD (storage), supplied by Team Group
- ANTEC HCG1000 Extreme, 1000W gold power supply unit
- BenQ EW3270U 32? 4K HDR 60Hz FreeSync monitor
- Samsung G7 Odyssey (LC27G75TQSNXZA) 27? 2560×1440/240Hz/1ms/G-SYNC/HDR600 monitor
- DEEPCOOL Castle 360EX AIO 360mm liquid CPU cooler
- Phanteks Eclipse P400 ATX mid-tower (plus 1 Noctua 140mm fan) – All benchmarking and overclocking performed with the case closed
Test Configuration – Software
- GeForce 461.09 for the RTX 3090
- Adrenalin 2020 Edition 20.12.2 drivers used for the Red Devil RX 6900 XT
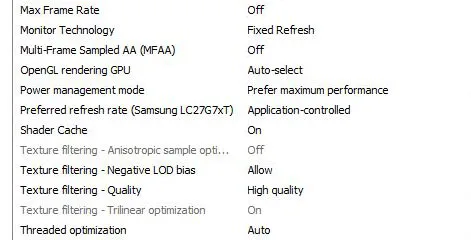
- High Quality, prefer maximum performance, single display, set in the NVIDIA control panel.
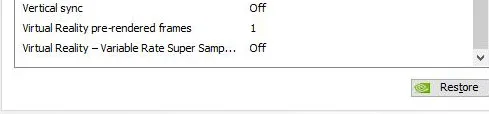
- VSync is off in the control panel and disabled for each game
- AA enabled as noted in games; all in-game settings are specified with 16xAF always applied
- Highest quality sound (stereo) used in all games
- All games have been patched to their latest versions
- Gaming results show average frame rates in bold including minimum frame rates shown on the chart next to the averages in a smaller italics font where higher is better. Games benched with OCAT show average framerates but the minimums are expressed by frametimes (99th-percentile) in ms where lower numbers are better.
- Windows 10 64-bit Pro edition; latest updates v2004. DX11 titles are run under the DX11 render path. DX12 titles are generally run under DX12, and multiple games use the Vulkan API.
- Latest DirectX
- Precision X1
- Wattman
Games
Vulkan
- Ghost Recon: Breakpoint
- Wolfenstein Youngblood
- World War Z
- Strange Brigade
- Rainbow 6 Siege
DX12
- Horizon Zero Dawn
- Tom Clancy’s The Division 2
- Metro Exodus
DX11
- Total War: Three Kingdoms
- Far Cry New Dawn
Synthetic
- TimeSpy (DX12)
- 3DMark FireStrike – Ultra & Extreme
- Superposition
- Heaven 4.0 benchmark
NVIDIA Control Panel settings
Here are the NVIDIA Control Panel settings.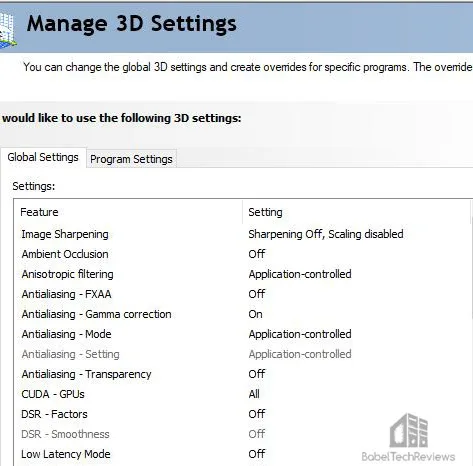
We used Precision X1 to set the GeForce card’s power and temperature limits to maximum and used Wattman for the Radeon.
AMD Adrenalin Control Center Settings
All AMD settings are configured so that all optimizations are off, Vsync is forced off, Texture filtering is set to High, and Tessellation uses application settings. All Navi and Navi 2 cards are capable of high Tessellation unlike earlier generations of Radeons.
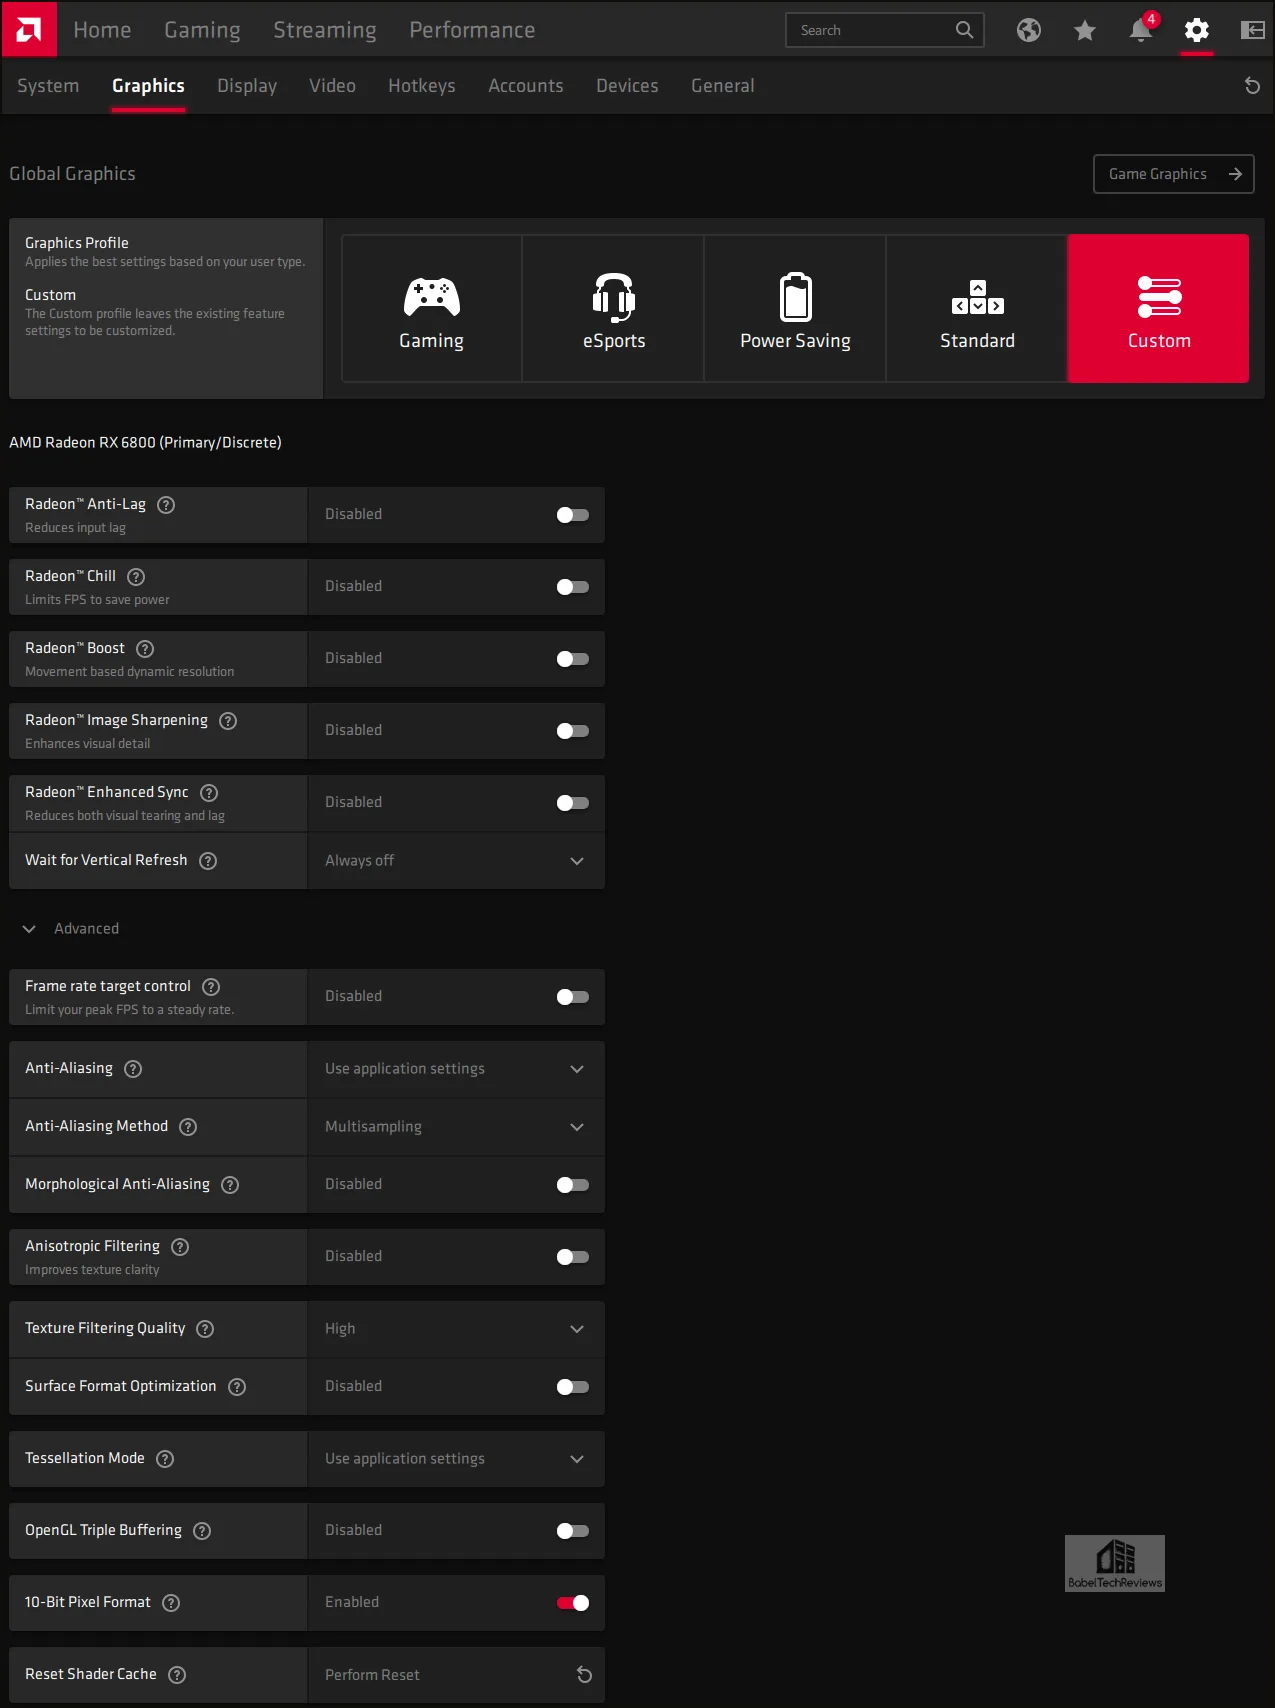
Anisotropic Filtering is disabled by default but we always use 16X for all game benchmarks.
Let’s overclock both of our cards to their maximum and check out their performance.
Performance summary charts
Below is the summary chart of 10 games and 3 synthetic tests. The highest settings are always chosen and DX12 was picked above DX11 where available. Specific settings are listed on the performance charts. The benches were run at 1920×1080, 2560×1440, and at 3840×2160.
All results, except for the synthetic benchmarks show average frame rates and higher is always better. Minimum frame rates are shown when they are available next to the averages but they are in italics and in a slightly smaller font. The Red Devil RX 6900 XT’s stock results are in the first column and its overclocked results are in the second column, while the third column represents the overclocked RTX 3090’s results with its stock-clocked results in the fourth column.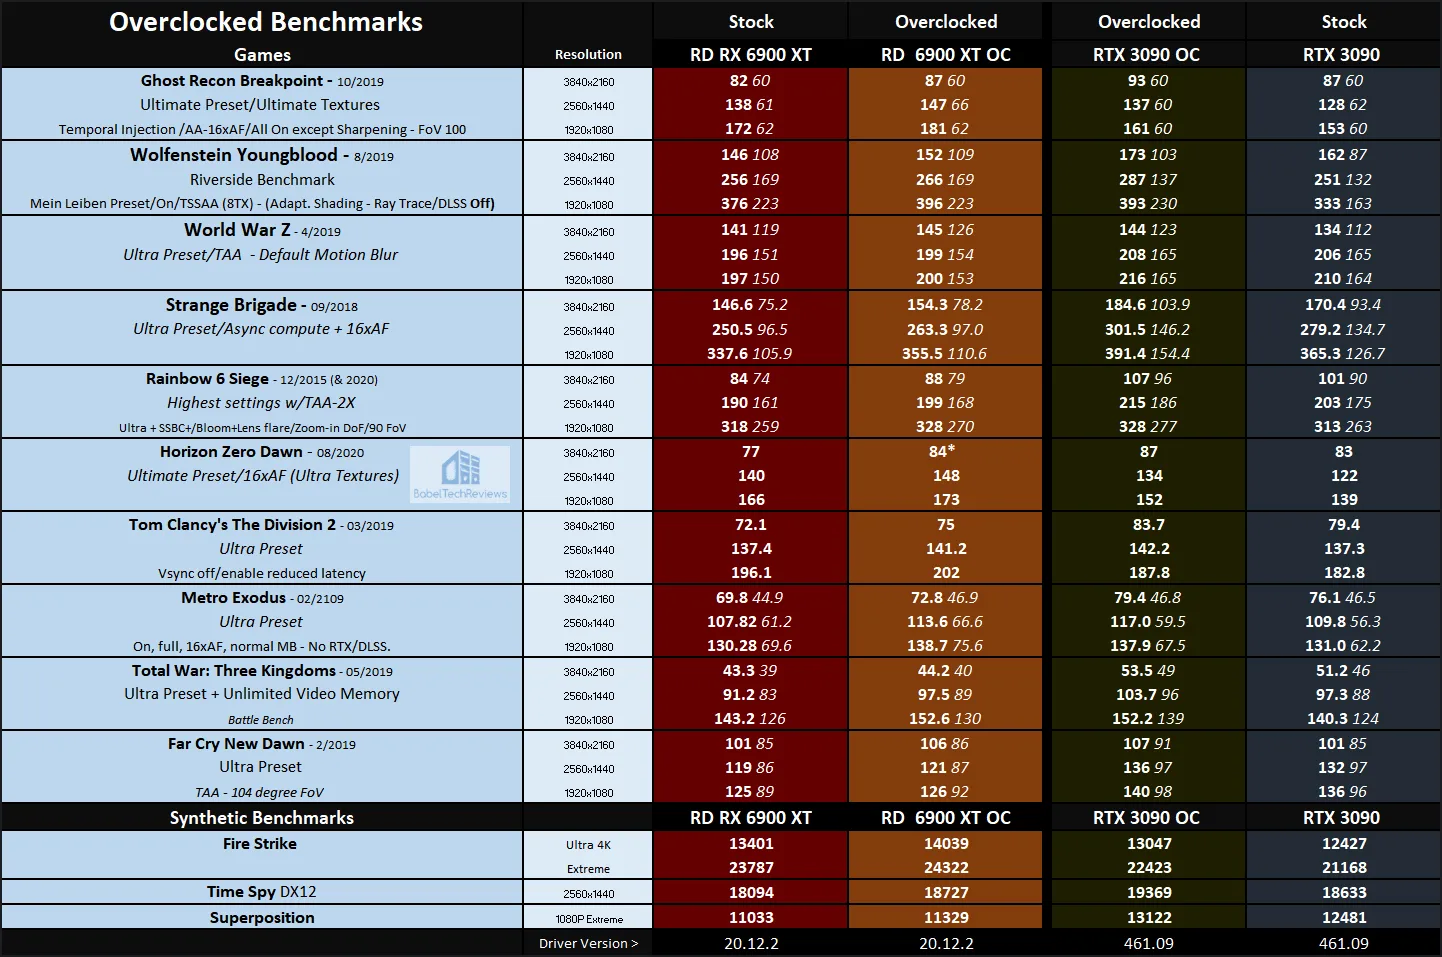
There isn’t much change in the overall ranking by overclocking both cards although each card scales decently. Horizon Zero Dawn gave inconsistent benching results at 4K (between 77 and 84 FPS) which may still indicate some throttling for the Red Devil. Although both cards are constrained by their respective power limits and tiny voltage increases, the Red Devil is an aftermarket card that should not be so power-limited.
PowerColor claims that their Red Devil can handle 400W, but is limited to 320W which means a lot of performance is left on the table by AMD’s lockdown. It is possible to circumvent this power limit with overclocking tools like MorePowerTools, but we have not tested it as our sample had to be returned to PowerColor in working condition after two weeks of intensive benchmarking.
Let’s head to our conclusion.
Conclusion
This has been quite an interesting exploration for us, evaluating the overclocked $1139/$1179 Red Devil RX 6900 XT versus the overclocked $1499 RTX 3090 FE. The Red Devil is a slower card, but it also costs about $350 less. We are very disappointed that the Red Devil’s voltage and power limit has been locked down, but the blame for this lays with AMD for an illogical decision for their partner cards – not with PowerColor who would love to be able to allow enthusiasts to push their card much harder.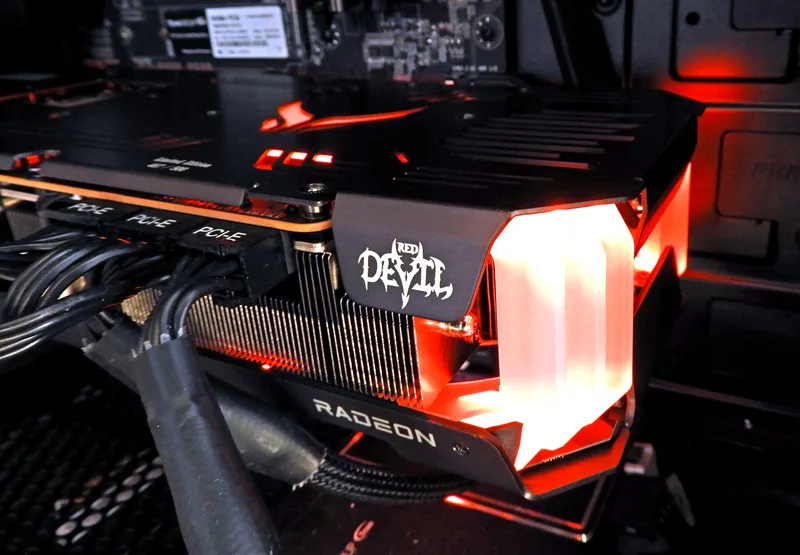
PowerColor has taken the RX 6900 XT GPU and over-engineered it with a 16 Phase design versus the 11+2 Phase VRM design on the reference design. Red Devils are over-spec’d in order to deliver the best stability and overclocking headroom. It’s not only capable of using well over 400W, and by having the best VRMs, it will run cooler and last longer than any reference version
The Red Devil is the equivalent of a Ferrari – and AMD has forcibly installed a limiter on it. This is a poor decision by AMD foisted on their partners and we respectfully disagree with them. We really like the Red Devil and will continue to recommend it as among the very best of the AIB RX 6900 XTs, and a great choice for AMD gamers.
Next week, we will return to benching Virtual Reality (VR). Sean has sent us a Reverb G1 Pro for evaluation to compare with a Reverb G2 that Hewlett Packard is also sending us for evaluation versus the Vive Pro. And Sean is working on his Assetto Corsa: Competizione review also.
Rodrigo’s next review is a GeForce 461.09 driver performance analysis using Ampere and Turing, and his following feature review will cover Windows 10 ‘Game Mode’, On vs. Off. Stay tuned to BTR!
Happy Gaming!
Comments are closed.