Measuring the RTX 2080 Ti’s Power Draw with its RTX Cores Enabled versus Idle
(updated 12/20/2018 1 AM PT)
This updated evaluation will attempt to compare the RTX 2080 Ti’s power draw with its RTX cores enabled versus sitting idle. Since Battlefield V has been released using DXR for reflections and Final Fantasy XV has been released with DLSS, we will measure the total system power draw by comparing identical benchmark runs with these RTX features turned on versus off.
We have no way to isolate the RTX 2080 Ti’s power draw from the rest of the system, so we use a Kill-A-Watt meter to measure the Wattage of our total system power draw. 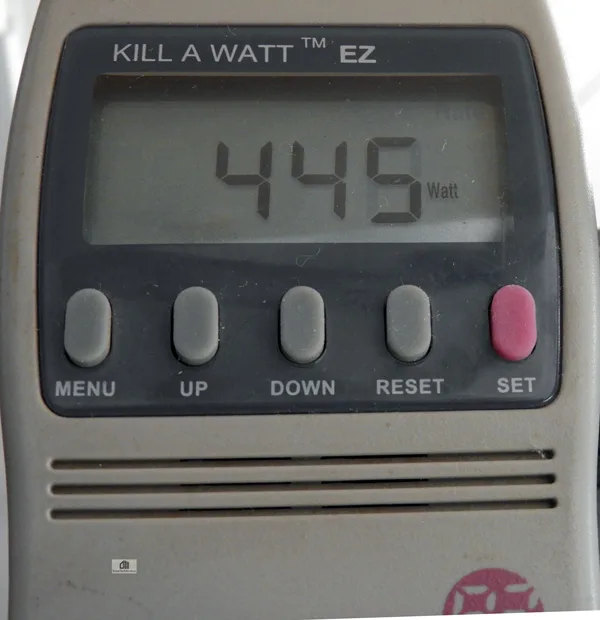 First, we will run our maxed-out Ultra 4K Battlefield V reflections benchmark with DXR disabled so that the RTX 2080 Ti’s RTX cores will sit idle, and we will measure our overall system power draw. We will then follow-up with an identical run using Ultra DXR enabled so that the RTX cores are working, and we will again measure our overall power draw. We will compare the results of multiple runs with DXR on versus off to see what we get. Finally, we will post a representative video running our benchmark to compare the total system power draw with DXR on versus off.
We will do the same thing with Final Fantasy XV with DLSS enabled versus disabled using TAA instead to see if we can get an idea of how much extra power draw – if any – the RTX 2080 Ti uses when its Tensor cores are working versus when its cores are sitting idle.
Let’s check out our our RTX power draw comparison and the conclusion after we check out our test configuration on the next page.
Test Configuration – Hardware
Hardware
- Intel Core i7-8700K (HyperThreading and Turbo boost are on to 4.7GHz for all cores; Coffee Lake DX11 CPU graphics).
- EVGA Z370 FTW motherboard (Intel Z370 chipset, latest BIOS, PCIe 3.0/3.1 specification, CrossFire/SLI 8x+8x), supplied by EVGA
- HyperX 16GB DDR4 (2x8GB, dual channel at 3333 MHz), supplied by HyperX
- RTX 2080 Ti Founders Edition, 11GB, stock settings, supplied by NVIDIA
- 480 GB Team Group SSD
- 1.92 TB San Disk enterprise class SSD
- 2 TB Micron 1100 SSD
- Seasonic 850W Gold Focus power supply unit
- EVGA CLC 280mm CPU water cooler, supplied by EVGA
- Onboard Realtek Audio
- Genius SP-D150 speakers, supplied by Genius
- EVGA DG-77, mid-tower case supplied by EVGA
- Monoprice Crystal Pro 4K
- Kill-A-Watt meter
Test Configuration – Software
- GeForce Game Ready 417.35 WHQL drivers.
- VSync is forced off.
- AA enabled as noted in games; all in-game settings are specified
- Highest quality sound (stereo) used in both games.
- Windows 10 64-bit Home edition latest version 1809.
- Latest DirectX
- Battlefield V is patched to its latest version at the time of posting.
- Final Fantasy XV is patched to its latest version at the time of posting.
- MSI Afterburner
- Battlefield V, press review copy supplied by NVIDIA
- Final Fantasy XV, press review copy supplied by EA/NVIDIA
NVIDIA Control Panel settings
Here are the NVIDIA Control Panel settings.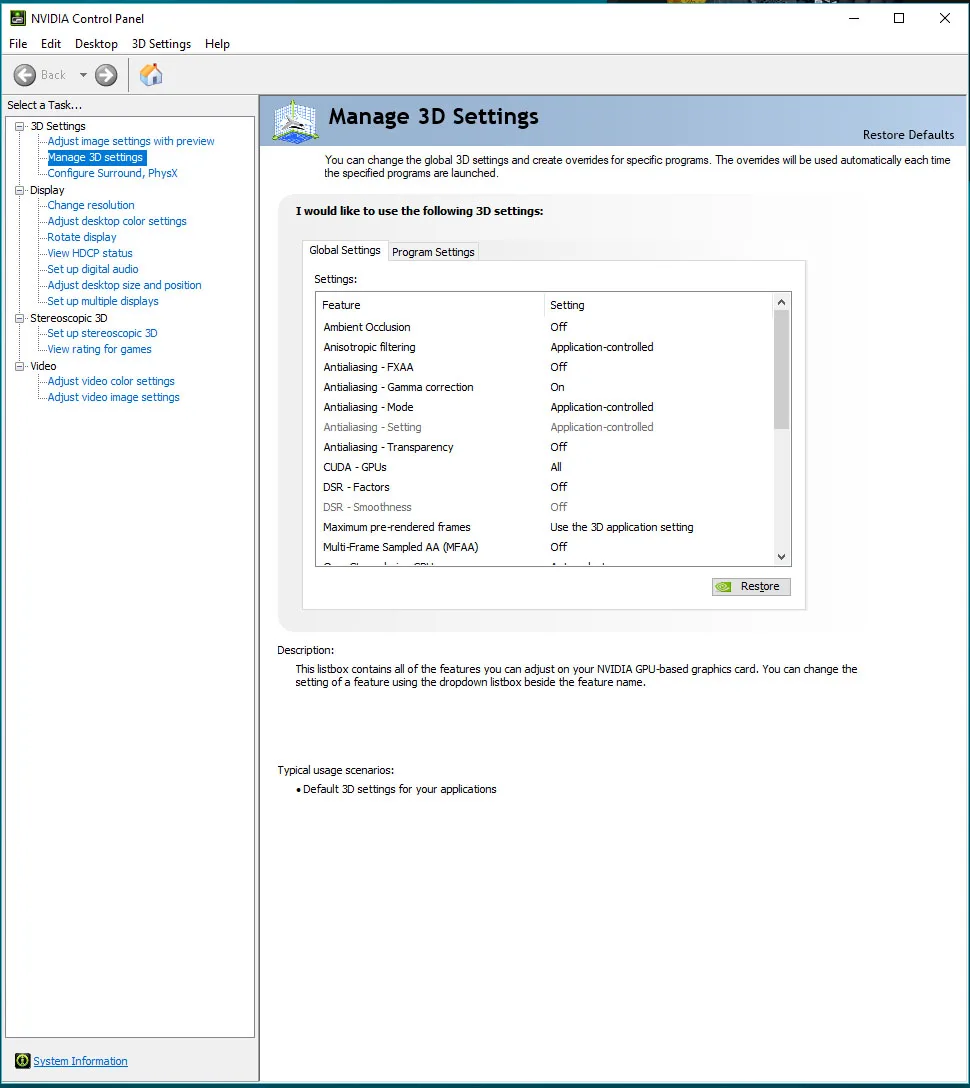
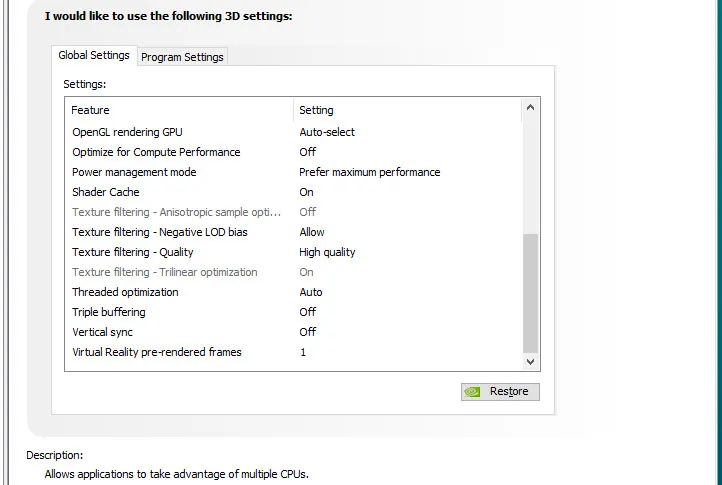 We used MSI’s Afterburner to set the highest Power and Temperature targets. By setting the Power Limits and Temperature limits to maximum for our RTX 2080 Ti, it does not throttle, but it will reach and maintain its maximum clock.
The Settings
Battlefield V Settings
For the first test, Battlefield V is benchmarked with everything on and with ultra settings at 3840×2160, including using ultra DXR ray tracing when we enable DXR. The framerates are left uncapped at 200 FPS.
For the second test, Battlefield V is benched at 1920×1080 with the same settings, but the framerates are limited to 60 FPS using the built-in frame limiter. In this second test, the power draw will be lower than at 3840×2160, but the RTX 2080 Ti will be producing the same framerates with DXR on and with DXR off.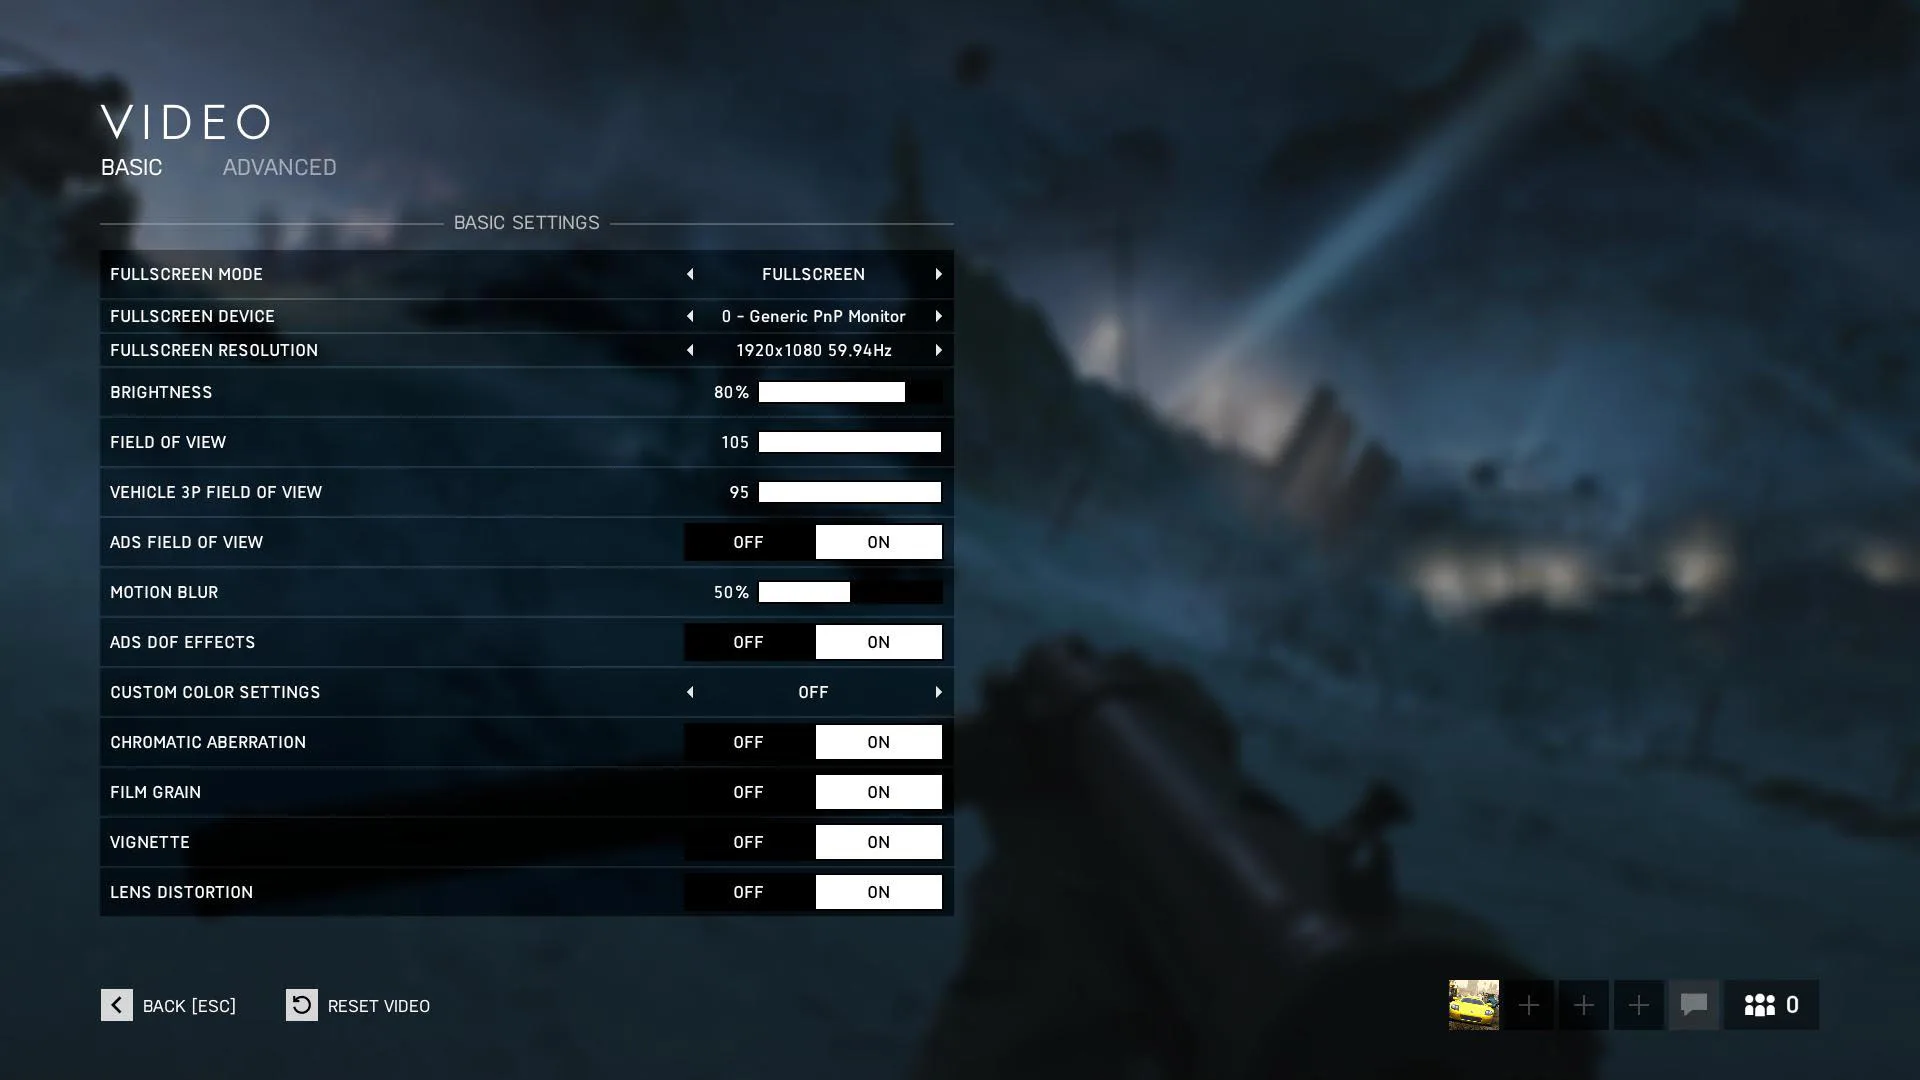
The only setting that is changed between runs in each test is the DXR Enabled setting – On or Off.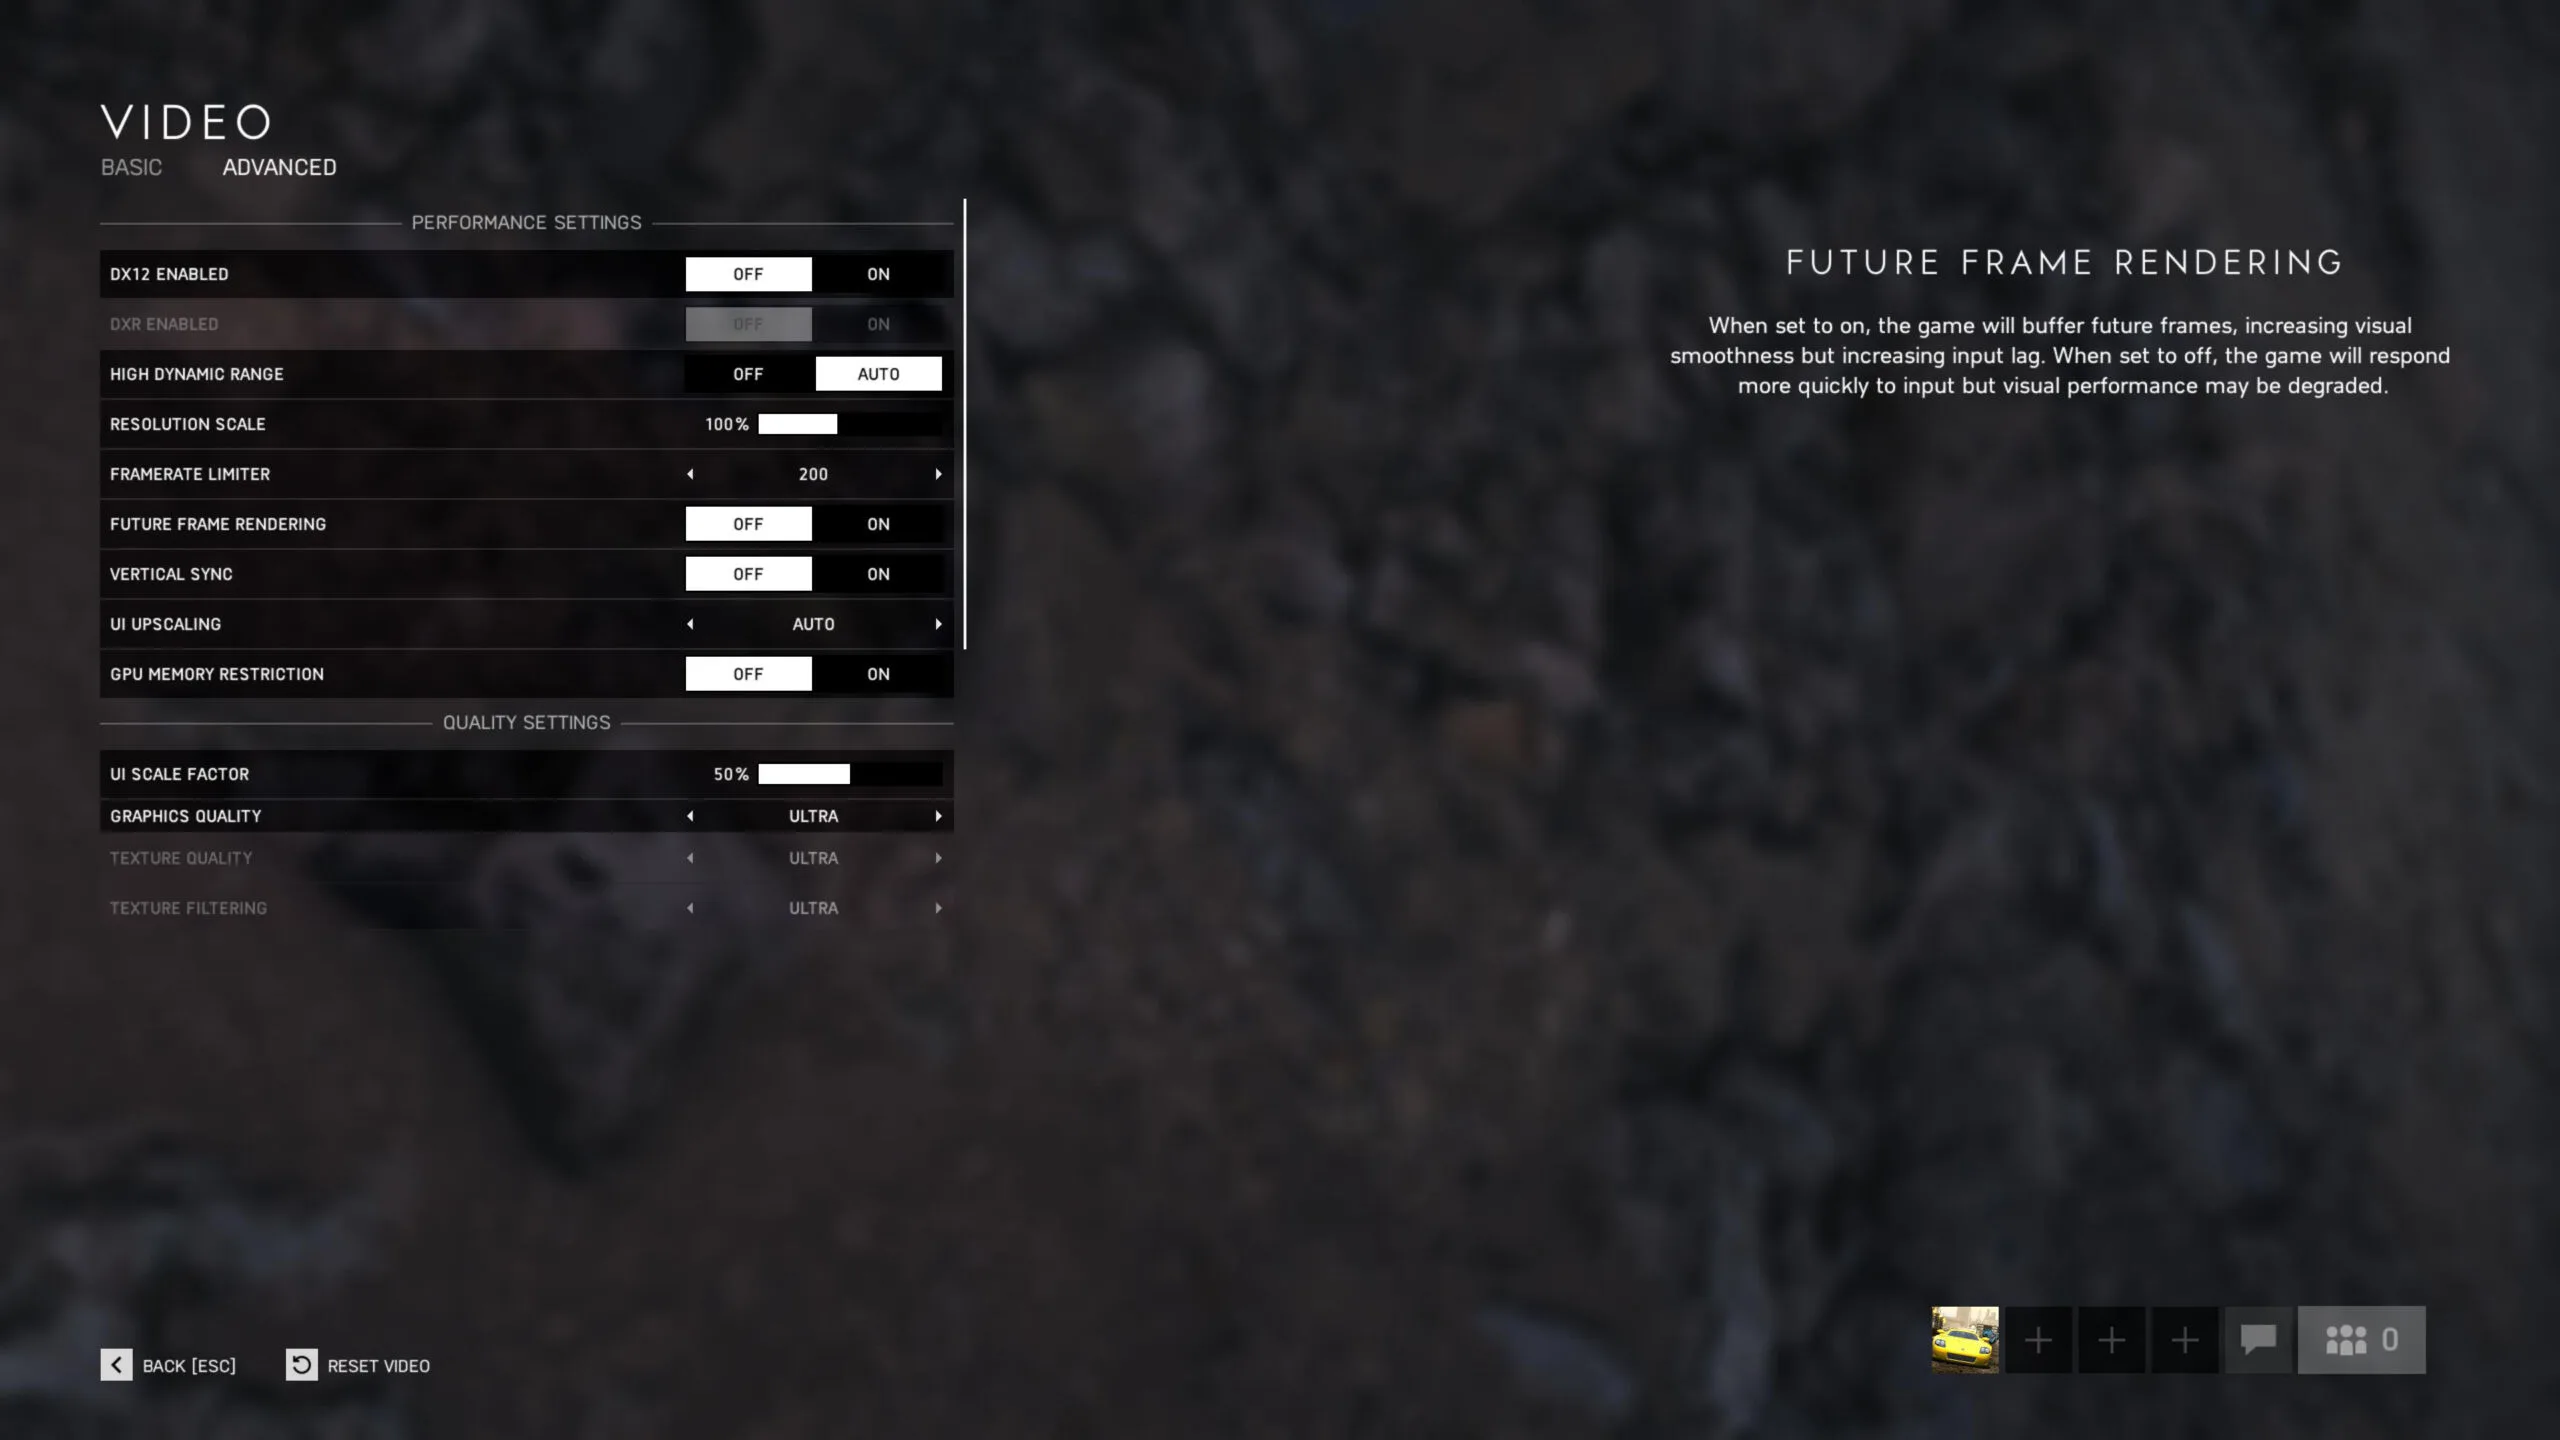
Final Fantasy XV Settings
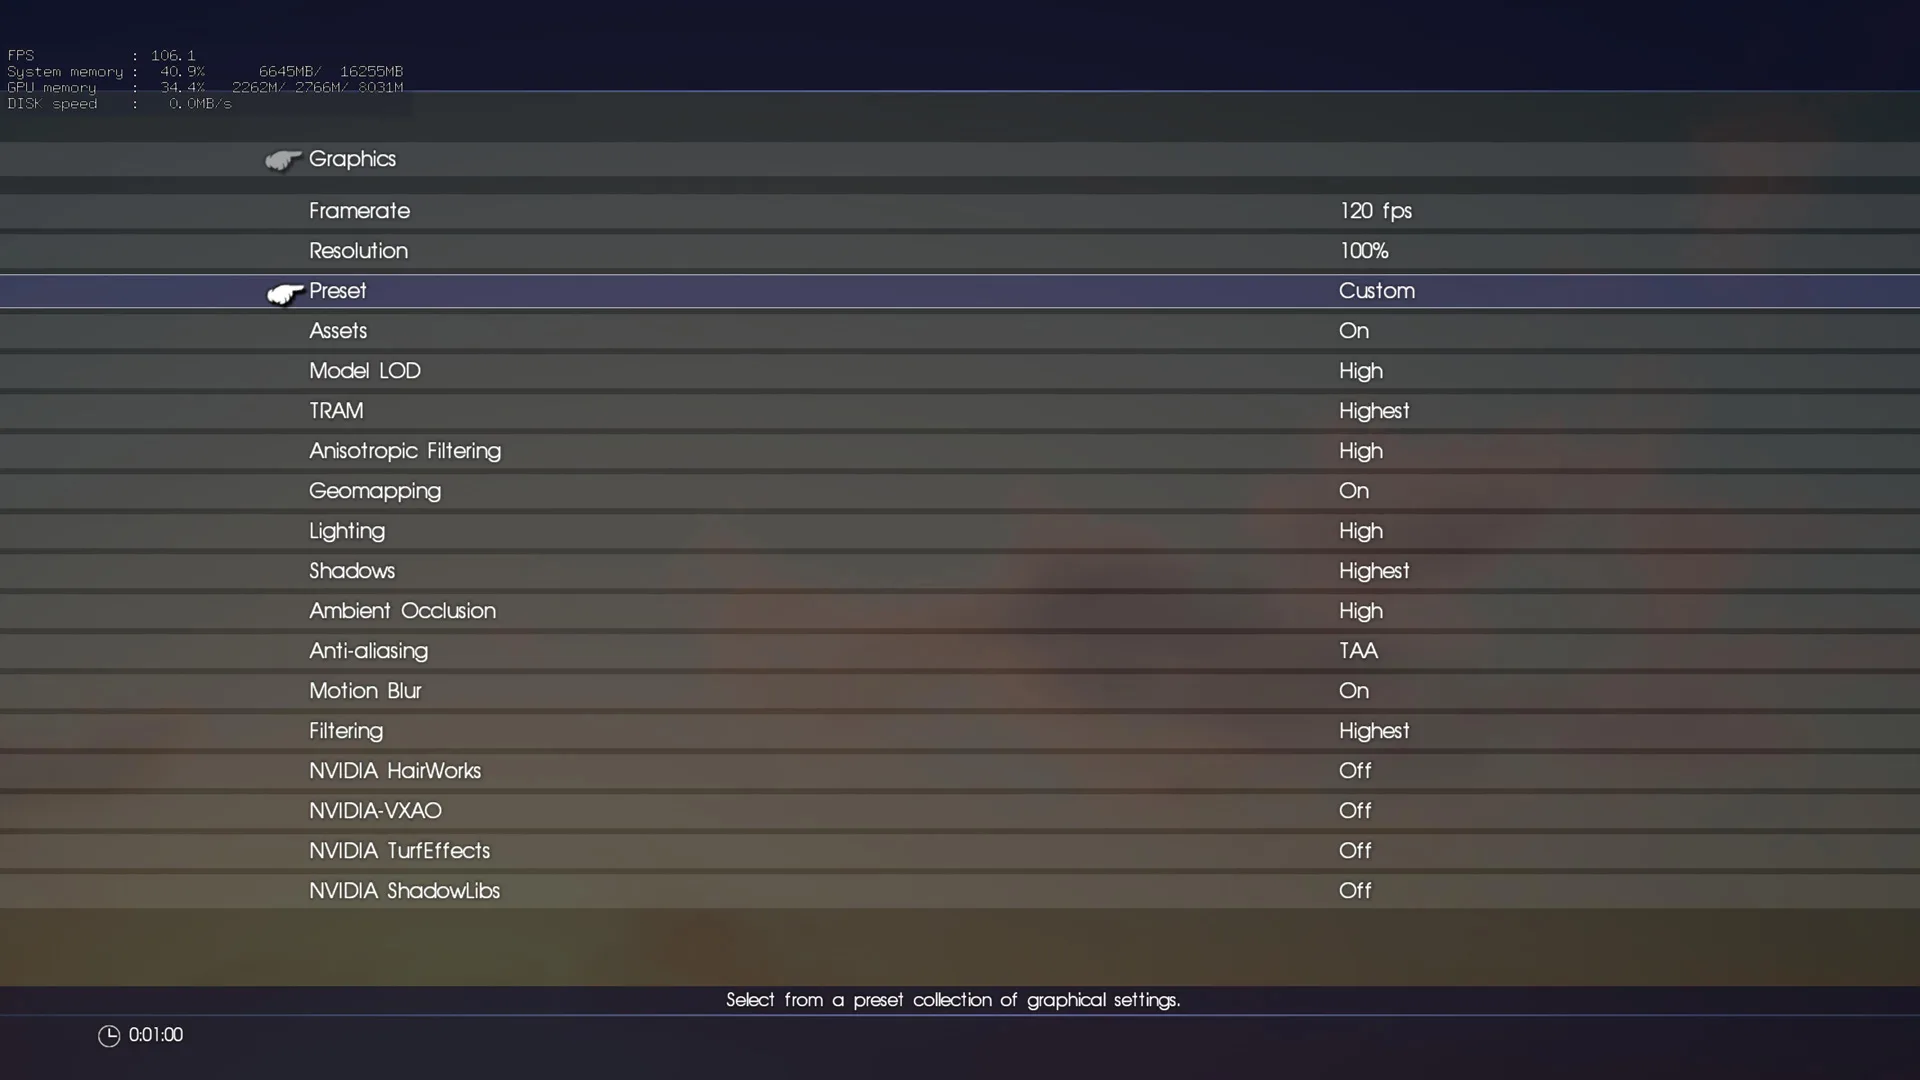
Final Fantasy XV is benchmarked at 3840×2160 with everything on and with all of its Highest settings, but with the GameWorks effects off. The only option changed is from DLSS to TAA, and the total system power draw is measured for each benchmark run and compared. The first test allows the framerate to reach 120 FPS.
For the second test, Final Fantasy XV is benched also at 3840×2160 with the same settings, but the framerates are limited to 30 FPS using the built-in frame limiter. The RTX 2080 Ti will be producing the same framerates with DLSS and with TAA.
Let’s measure the overall system power draw of Battlefield V and Final Fantasy XV with the RTX 2080 Ti’s RTX features on versus off, and then head for our conclusion.
Battlefield V – DXR On versus Off
For the first test at 3840×2160, running with ultra DXR on used less total system power than running with ultra DXR off by as much as 15 Watts because the framerates being produced were lower with DXR enabled.
Here is our representative benchmark which is a good average of many runs with DXR on versus off. The average framerates produced with DXR off was 147.6 FPS. With DXR on, the framerate dropped to 85.5 FPS.
Using the same Battlefield V benchmark at 1920×1080, but with the framerates now limited and locked to 60 FPS for both DXR on and for DXR off, we see a much higher power draw when the Turing RTX cores are being used. The peak power system draw of the RTX 2080 Ti was 335 Watts with DXR on, but 235 Watts when DXR was off. That means that about 110 Watts more peak system power was being used with DXR on compared with off.
Our peak CPU temperatures did not vary much with DXR on versus off although it was a bit higher (perhaps 2-3 degrees more) with DXR on which likely means that the CPU was drawing more power. But it seems reasonable to assume that much of the power draw may be attributed to the active RTX 2080 Ti Turing RTX cores when DXR is enabled.
Final Fantasy XV – DLSS On versus TAA
Using our very demanding Final Fantasy V benchmark using the highest settings at 3840×2150 to compare total system power draw using DLSS versus using TAA, we found very little difference in the total system power draw between using either of these two methods of anti-aliasing with the framerate capped to 120 FPS.
When the framerates were capped to 30 FPS, the total system draw with DLSS peaked at 330W while it was 30W higher with TAA at 360W. CPU core peak temperatures remained close, but this time they tended to be 1-2C higher with TAA than they were with DLSS.
Let’s check out our conclusion.
Updated Conclusion (12/20/2018 7:30 AM PT)
When the framerates are the same, it appears that the RTX 2080 Ti’s Turing RTX cores use more power when DXR is enabled in Battlefield V although the CPU probably plays a minor part in drawing extra power. However, in Final Fantasy XV when using DLSS, the RTX 2080 Ti may draw a bit less power than when using TAA.
No sweeping generalization can be made from this short evaluation with only two games. Every single game performs differently power-wise. In these two games, RTX is used generally to represent the specialized Turing cores of the RTX 2080 Ti that differentiate it from previous GeForce generations. Battlefield V uses RTX cores for ray tracing and Final Fantasy V uses Tensor cores responsible for DLSS.
If you want to see DXR and DLSS for yourself in action, you will need a Turing RTX GeForce video card. We hope to revisit this power draw comparison of the RTX cores working versus sitting idle when other games are released that use these features.
Just Cause 4 has become BTR’s latest benchmark number 38 even though it is still in real need of patching, and we are also working on adding Overwatch to our regular benchmark suite as game number 39. Stay tuned. BTR has more reviews and evaluations coming up shortly including a HyperX SSD review and also another Retro video card series review next week.
Happy Holidays, and Happy Gaming!
