Introduction
AMD continues to push the boundaries with its latest offering, the Ryzen 7 9850X3D. AMD is essentially competing with itself as it has held the title of the “world’s fastest gaming processor” since the first 3D V-Cache-equipped 5800X3D released in 2022. One year later, the 7800X3D advanced AMD’s performance lead. The second-generation 3D V-cache-equipped 9800X3D, which released in late 2025, offered another significant performance leap.
The 9800X3D only held the gaming title for four months until AMD’s flagship 16-core Ryzen 9 9950X3D was released which edged it out, and now the 9850X3D aims to take it back. This comprehensive review pits the 9800X3D against the 9850X3D, and versus the 9950X3D in various scenarios to help you understand their capabilities and determine which might be the best fit for your needs. These processors are standards in computing innovation, designed to cater to the most demanding users, from professional creators, to AI users, to hardcore gamers.
Processor Overview
- AMD Ryzen 9 9950X3D: The flagship model costs $699.99 and boasts 16 cores and 32 threads, making it a powerhouse for gaming and professional applications. With a base clock of 4.3 GHz and a boost up to 5.7 GHz, coupled with 128MB of L3 cache, the 9950X3D is designed for maximum performance, including intensive multitasking and heavy-duty content creation.
- AMD Ryzen 7 9800X3D: As a slightly less robust option with an MSRP of $479.99, the 9800X3D features 8 cores and 16 threads. It sports a base clock of 4.7 GHz and can boost up to 5.2 GHz. With 96MB of L3 cache, it is tailored more towards gaming, where single-core performance often takes precedence, but it also holds its own in lighter content creation applications.
- AMD Ryzen 7 9850X3D: Identical in architecture to the 9800X3D, with an MSRP of $499.99, the 9850X3D also features 8 cores and 16 threads. It sports the same base clock of 4.7 GHz as the 9800X3D, but can now boost up to 5.6 GHz. Essentially, it is a higher-binned chip for $20 more.
Please refer to our Battle of the Titans: AMD Ryzen 9 9950X3D vs Ryzen 7 9800X3D in-depth performance analysis for all the details which we expand on here by including the Ryzen 7 9850X3D. We have added many more games, workstation, content creation, AI, and updated benchmarking programs.
3D V-Cache, Software Enhancements, and Memory Requirements
AMD has always considered DDR5 6000 CL28 the “sweet spot” for performance for its 9000X3D series CPUs. This is in contrast to the competition’s desktop CPUs which require the highest-clocking memory for maximum performance. Since last November, the price of DDR5 has tripled and even quadrupled in price due to market conditions, making high-clocking memory unaffordable.
We noted this recent statement from AMD: “Thanks to 2nd Gen 3D V-Cache™ technology, high-frequency memory is not required. Across an average of 30+ games, the FPS difference between DDR5-4800 and DDR5-6000 was <1%.” This applies to all 9000X3D CPUs and gives AMD’s platform a huge advantage over their competition.
Although the performance delta has always been small because of the 3D V-Cache, we noticed a performance improvement by using the chipset drivers and updated BIOS/firmware AMD provided for our MSI Carbon X870E motherboard. We have included game performance comparisons between DDR5 6000 and the same memory at 4,800MT/s to verify AMD’s claim.
In our review of the 9950X3D and 9800X3D we noted its ability to stay cool under stress, maintaining its maximum boost clocks at temperatures below 85°C. However, the 9850X3D runs much cooler, and under the most intense stress testing, it never even reached 80C!
Although the Precision Boost 2 algorithm is the same, the 9850X3D performs a little differently than the 9800X3D. It reaches 5600MHz only in lightly threaded scenarios with a gradual decline as it reaches a full multi-core workload, and generally settles to just above 5400MHz. In contrast, our 9800X3D reaches 5200MHz in all scenarios and maintains those clocks until it hits its thermal limit.
AMD encourages overclocking with the Ryzen 9000X3D CPUs. Precision Boost Overdrive (PBO) is recommended for optimal power efficiency and performance across both multi-threaded and single-threaded applications.
Users can manually fine-tune performance through Curve Optimizer and Curve Shaper within the BIOS, which provides detailed control over performance variables at different temperature and frequency ranges.
For all three CPUs, we set PBO to Advanced, set to motherboard, and used -0.3mV in the BIOS Curve Optimizer. In addition, we disabled SVM (Secure Virtual Machine) mode. The Ryzen 9800X3D, 9850X3D, and 9950X3D possess identical configurations, which suggest little benefit from overclocking. By simply reducing the voltage by -30mV using PBO, the CPUs are able to operate cooler, enhancing their efficiency and longevity. For those who wish to extract every bit of performance from their processors, the cool-running 9850X3D looks like an overclocker’s dream.
Employing low-latency DDR5 6000 MHz CL28 RAM, configured to a Command Rate of 1T via the EXPO settings, we probably achieved close to 99% of the 9850X3D’s potential performance without any need for manual overclocking. We also set the Infinity Fabric to 2000MHz for all three CPUs with a Command Rate of 1T, and 1:1:1 for MCLK:UCLK:FCLK.
For enthusiasts with extremely deep pockets who want to push their hardware to the limit, opting for DDR5 8000 MHz memory with a Command Rate of 2T can offer slight performance gains. However, it remains unofficially recognized by AMD and may void the CPU’s warranty, as indicated in the AMD BIOS overclocking disclaimer.
System Specifications
Hardware
- Ryzen 7 9850X3D/9800X3D/Ryzen 9 9950X3D (9850X3D & 9950X3D supplied by AMD)
- MSI Carbon Wi-Fi X870E motherboard E7E49AMSI.1A7N1 BIOS — PBO -0.3mV, TDP 85C, SVM disabled
Chipset version 7.10.06.944 - 2x16GB G.SKILL Trident Z5 Neo DDR5 6000 CL28-36-36-96 EXPO, supplied by AMD (For gaming and 3DMark)
- 2x48GB CORSAIR VENGEANCE DDR5 6000 CL28-36-36-76 EXPO, supplied by CORSAIR (for all other applications except gaming and 3DMark)
- Crucial T705 Gen5 NVMe 2TB SSD (14,500/12,700MBps)
- Lexar NM1090 PRO Gen5 NVMe 2TB SSD (14,000/13,000MBps)
- RTX 5090 Founders Edition, supplied by NVIDIA
- Super Flower Leadex SE 1200W 80+ Platinum Power Supply Unit
- DeepCool Castle 360EX AIO
- CORSAIR 5000D case
- ROG SWIFT PG259QN 360 Hz/1080p for games
- LG C1 120 Hz/4K for all other applications
Software
- Windows 11 Professional 64-bit 2025 2H2
- Nvidia WHQL 591.73 GRD for games / WHQL 591.73 Studio driver for Apps. All drivers, games and apps updated
- UL 3DMark Professional, courtesy of UL
- UL Procyon Suite, courtesy of UL
- UL PCMark 10 Professional, courtesy of UL
- SPEC Workstation 4.0
- SPECviewperf 1.5
- PugetBench for DaVinci Resolve, courtesy of Puget Systems and Resolve
- AIDA64 Engineer, courtesy of FinalWire
- 7zip
- Blender Benchmark
- Cinebench 2024
- Corona Benchmark
- CPUZ Benchmark
- GeekBench CPU
- GeekBench AI
- Handbrake
- JetStream 2
- KeyShot CPU benchmark
- LLM Studio v03.39 – OpenAI gpt-oss 20b and 120B models
- LuxMark v3.1 and v4.0
- MLPerf Client 1.5
- Novabench
- PassMark Performance Test
- V-Ray CPU Benchmark
- Y-cruncher
- 17 games at 1080p
Gaming Performance Summary Chart & 3DMark
The primary purpose of the Ryzen 7 9850X3D is for high-end gaming. Here are the summary charts of seventeen games which are generally accepted as CPU-intensive. The highest settings were chosen, and the settings are listed on the charts.
Whenever possible, we used Quality DLSS which internally upscales from 720p to 1080p, typically increasing CPU usage by reducing the rendering load on the GPU. Upscaling allows it to produce more frames, which demands more from the CPU, but we did not use Frame Generation which shifts the burden back onto the GPU.
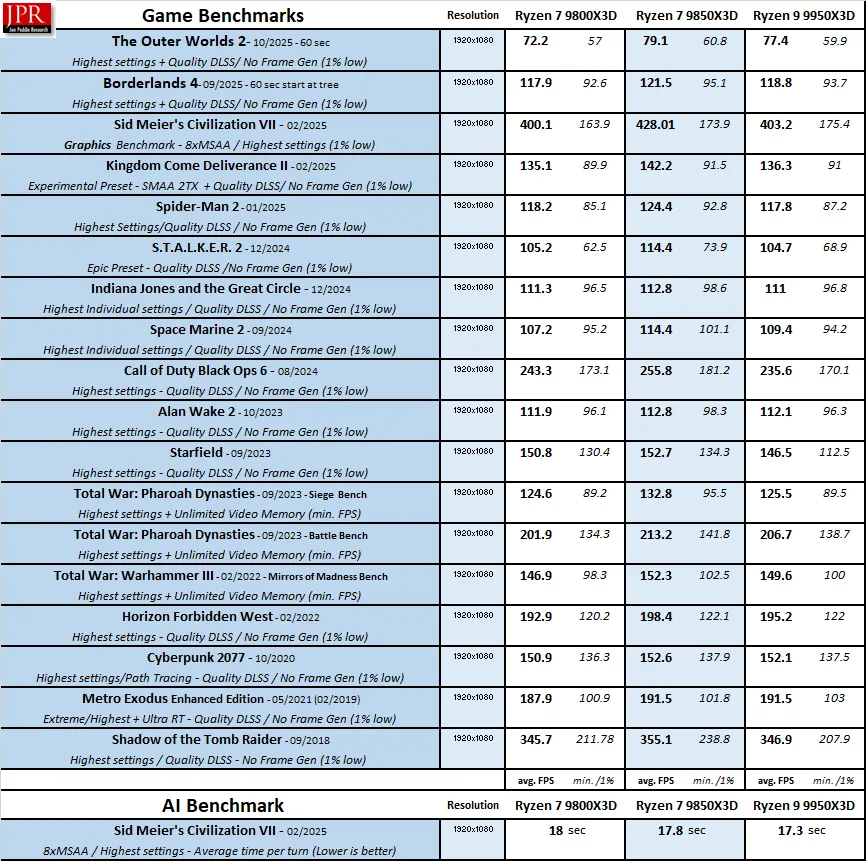
We see that the 9850X3D has convincingly taken back the performance crown from the 9950X3D, and generally is around five percent faster than the 9800X3D where the CPU is the primary limiting factor. Of course, multiple games that we tested showed very little performance uplift as they appear to depend more on the GPU even with the maximum settings we used.
DDR5 6000 vs DDR5 4800
We tested AMD’s claim that the performance difference between DDR5 6000 and DDR5 4800 was very small by benchmarking six games using the 9850X3D.
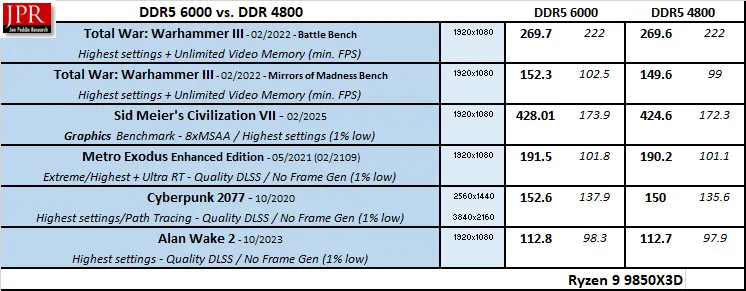
The performance differences varied from zero percent to under two percent. However, we used the same memory which ran at CL28-36-36-96, only dropping the frequency from 6000MT/s to 4800MT/s. Using very high latency DDR5 4800 may have an additional negative impact on performance.
The second generation 3D V-Cache used for 9000 series X3D processors minimizes the performance impact of using slower memory, unlike with Intel platforms that require very expensive fast memory for maximum gaming performance.
3DMark
Besides gaming benchmarks, 3DMark uses a specialized CPU profile test that uses from one to the maximum number of CPU threads available to give the average simulation time per thread.
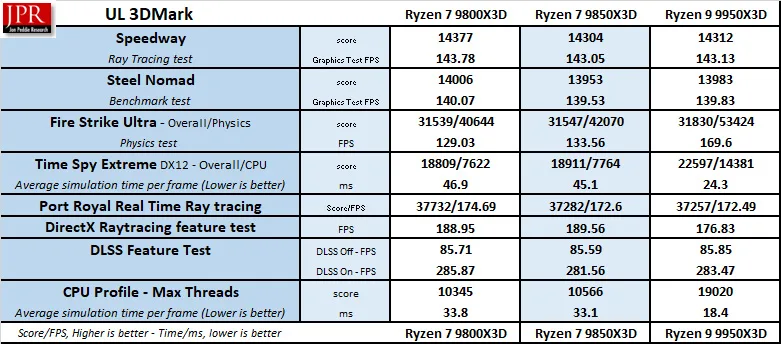
There is not a lot of difference between the three processors as most of the tests are GPU-dependent, so let’s move on to non-gaming synthetic benchmarks specifically designed to test memory and CPU performance.
Synthetic Benchmarks
AIDA64 v8.20.2100 Engineer
AIDA64 is an important industry tool for benchmarkers. Its memory bandwidth benchmark measures the maximum available memory data transfer bandwidth, and the CPU tests are designed to test CPU performance. AIDA64’s benchmark code methods are written in Assembly language, and they are well-optimized. We use the Engineer’s full version of AIDA64, courtesy of FinalWire. AIDA64 is free to try and use for 30 days.
The AIDA64 Memory Latency benchmark measures the typical delay from when the CPU reads data from system memory. Memory latency time means the time is accurately measured from the issuing of the read command until the data arrives in the integer registers of the CPU. It also tests Memory Read, Write, and Copy speeds.
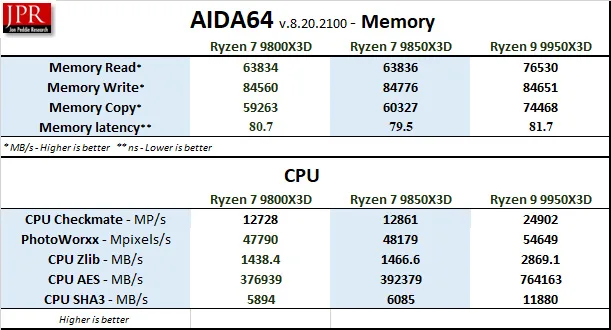
The 9850X3D’s memory latency is the lowest of the three CPUs, and it beats the 9800X3D in all the CPU benchmarks. Of course, when 16 cores are utilized, the 9950X3D excels.
CPU-Z
CPU-Z benchmark is a quick synthetic test found in the CPU-Z utility to measure a CPU’s single- and multi-thread performance, providing a relative score to compare against other CPUs.
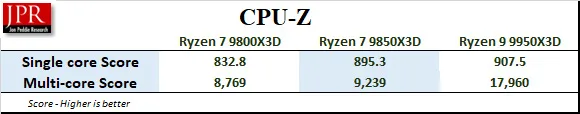
It is included only for a rough comparison.
PassMark Software’s PerformanceTest tool
PassMark Software’s PerformanceTest tool tests all aspects of a platform’s performance although we are most interested in the CPU score.
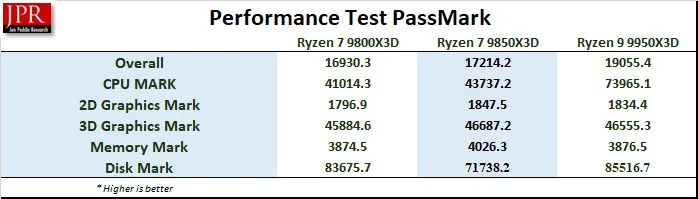
The 9850X3D is faster than the 9850X3D in the CPU and overall tests.
Novabench
Novabench is a very quick synthetic benching utility that also gives multiple scores that may be compared with other platforms online. These are the overall and CPU scores
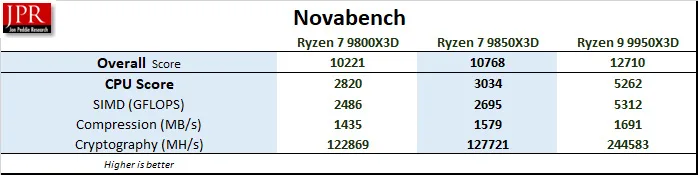
The 9850X3D again scores higher than the 9800X3D.
JetStream 2
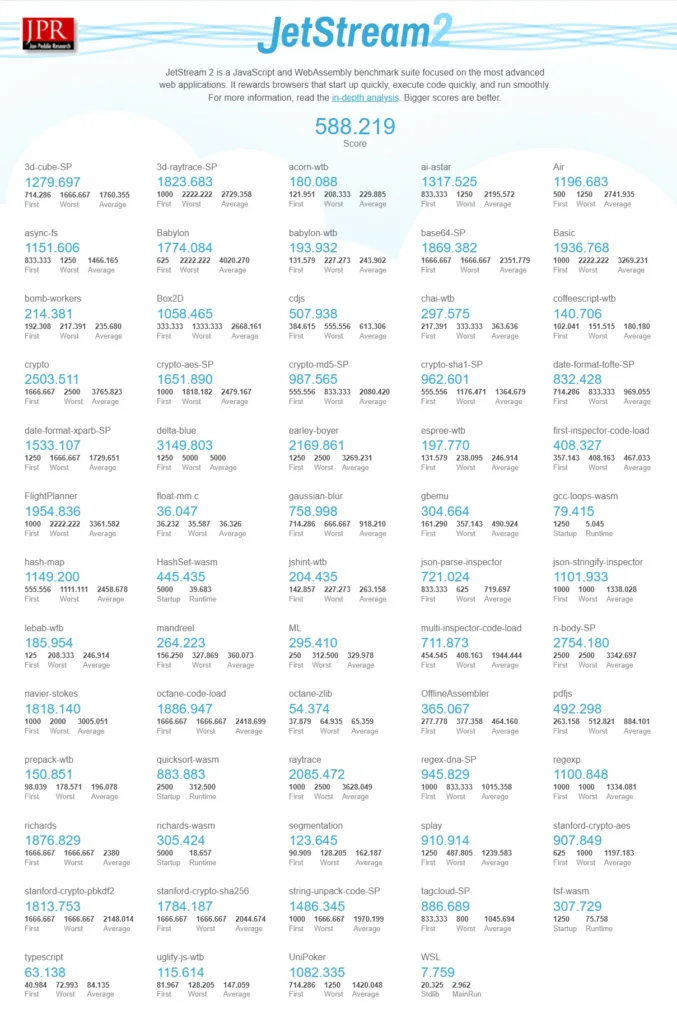
JetStream 2.2 serves as a comprehensive benchmark suite for JavaScript and WebAssembly, designed to test the performance of web browsers in handling advanced web applications. Running primarily on the CPU, it assesses how quickly browsers can start up, execute code, and maintain smooth operations, providing a clear indication of browser efficiency.
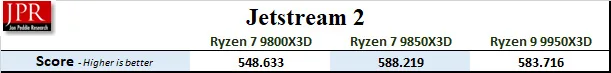
The 9850X3D scores the highest.
7-Zip benchmark
The 7-Zip built-in benchmark is a synthetic benchmark that tests LZMA and LZMA2 algorithms compression/decompression and gives a rating in GIPS (giga or billion instructions per second), which is calculated from the measured speed.
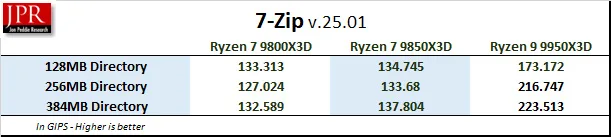
The faster clock speeds of the 9850X3D allow it to surpass the 9800X3D’s performance. However, when more cores are utilized, the 9950X3D is superior.
Y-cruncher
Y-cruncher is a synthetic benchmark that tests the raw computational power of a system by calculating Pi, pushing the CPU and RAM to their limits. It is a free test that is fully multi-threaded. We chose the 1-, 2.5-, 5-, and 10-billion digit tests, and kept it running only in RAM with no swapping to disk allowed to really stress the CPU.
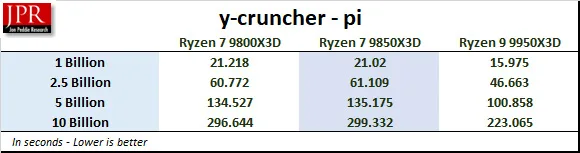
Surprisingly, the 9800X3D is slightly faster than the 9850X3D.
Let’s leave synthetic benchmarks behind and move on to more real-world-scenario benchmarking.
Real-World and Hybrid Benchmarks
Geekbench 6 CPU and Geekbench AI Benchmarks
GeekBench 6 is a well-established CPU benchmarking program that runs a series of tests and times how long the processor takes to complete the tasks.
Both Geekbench and Geekbench AI are hybrid benchmarks straddling a line between synthetic and real-world testing. It simulates real-world scenarios and tasks, including machine learning, yet focuses on practical workloads.
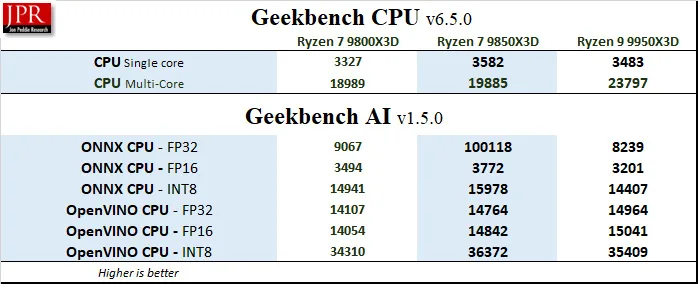
The 9850X3D is the fastest CPU in the single-core tests and also in the AI benchmarks.
Blender 4.5.0 Benchmark
Blender is generally considered a real-world benchmark because it renders three files of 3D models and scenes that are based on professional production tasks.
We used the very latest version of the Blender 4.5.0 benchmark, which primarily measures CPU performance in rendering production files. Higher is better, as the benchmark automatically renders a scene multiple times and gives the results as samples per minute. The benchmark may be downloaded from here.
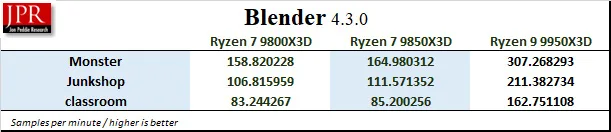
The 9850X3D is faster than the 9800X3D by virtue of its faster clocks. Again, the 9950X3D is the fastest because it utilizes all 16 cores.
LuxMark Benchmark
LuxMark is a GPU benchmark using the LuxCore renderer, which is an open-source ray-tracing renderer used for visual effects and architectural applications. These two benchmarks are relevant for evaluating workstation graphical rendering capabilities, where accurate light simulation is crucial. It measures OpenCL performance, and it is based on Intel Embree. Although narrow in scope since rendering is only one part of the workflow, it’s useful for comparing workstation performance.
We used the older 3.1 version and the newest 4.0 (Alpha). Each version offers 3 separate tests, and we chose the most complex scenes to give our test systems a real workout.
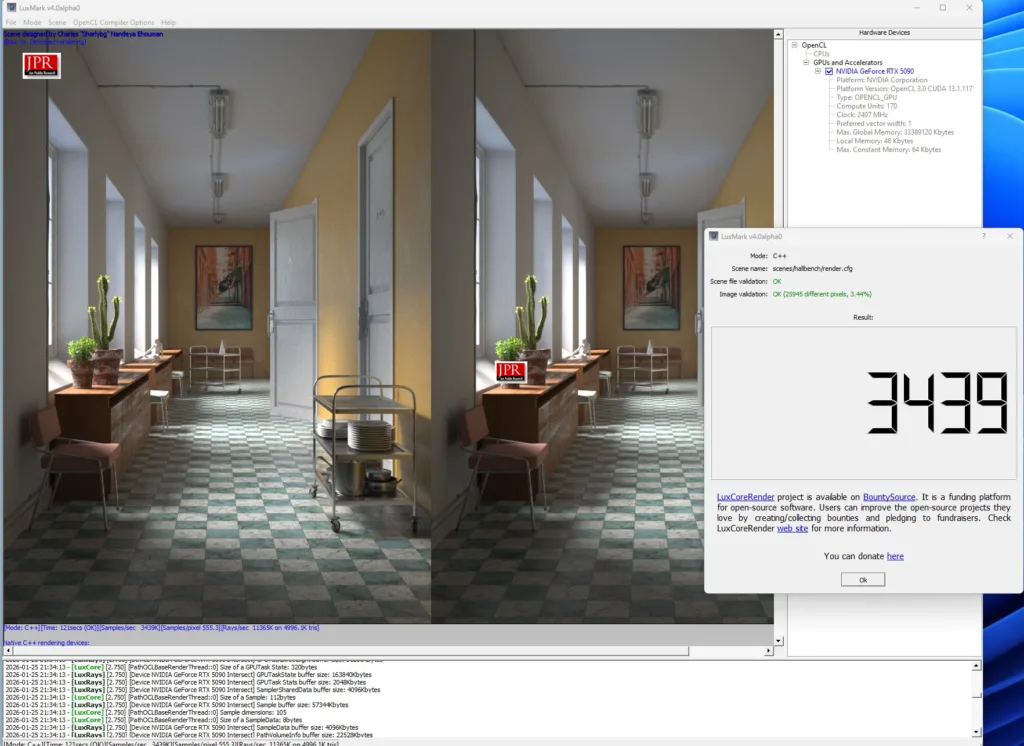
Below are the LuxMark benchmark results for each platform.
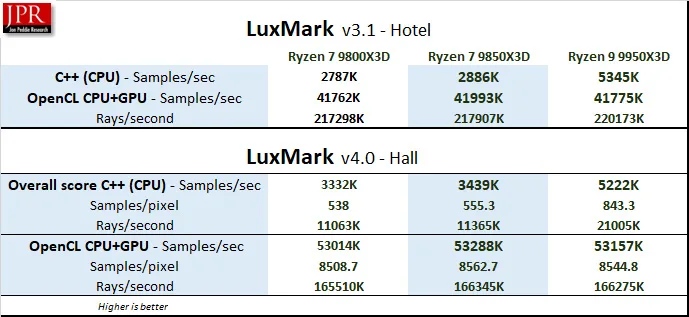
The 9850X3D performs better than the 9800X3D although 9950X3D’s extra cores give it a significant advantage in using the LuxCore Renderer.
Cinebench 2024
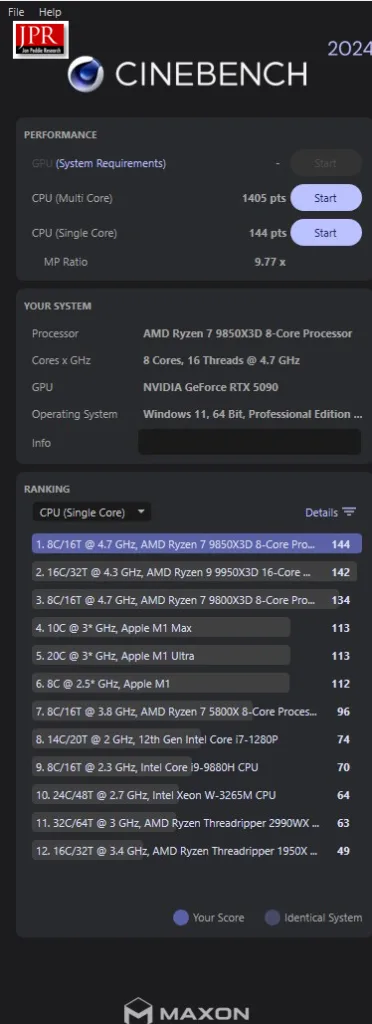
Cinebench 2024 is based on MAXON’s professional 3D content creation suite, Cinema 4D. Cinebench uses real-world rendering tasks from the Redshift engine. It provides scores for multi-core and single-core CPU (as well as GPU) accurately and automatically, and is an excellent tool to compare CPU performance.
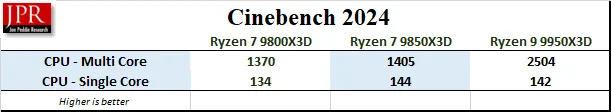
The 9850X3D scored higher than either competing CPU in the single-core test.
Corona CPU Benchmark
Chaos Corona is professional rendering software that offers photorealistic rendering capabilities, primarily used by architects and designers. The Corona Benchmark is a free benchmark built on the Corona 10 rendering core that assesses your system’s performance by rendering a 60-second scene.
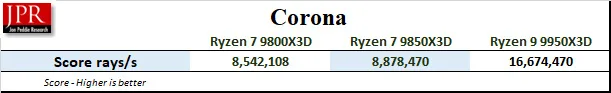
The 9950X3D always leads when a rendering engine is heavily multi-threaded, but the 9850X3D performs well ahead of the 9800X3D.
KeyShot CPU Benchmark
KeyShot software uses both the CPU and GPU for 3D rendering and animation. It is used by designers and engineers to create photorealistic images, animations, and interactive visuals from 3D models. We chose the CPU benchmark.
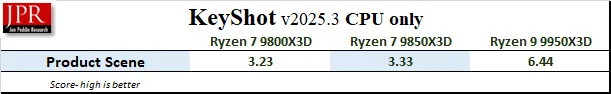
The 9850X3D edges out the 9800X3D by virtue of its higher clock speeds but cannot come close to the speed of AMD’s flagship 16-core CPU.
V-Ray CPU Benchmark
The V-Ray benchmark is a real-world benchmark that uses the V-Ray rendering engine to test a system’s performance. The benchmark uses the same technology that visual effects and design professionals use for their projects. We chose the CPU benchmark.
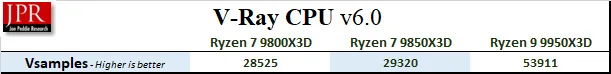
Just like with KeyShot, the 9050X3D is faster than the 9850X3D, but when the software can use more than eight cores, it gives a significant advantage to the 9950X3D.
PCMark 10 Professional Edition
PCMark 10 generates multiple tests that use real-world timed benchmarks. They include web browsing, video group chat, photo, batch, video editing, music, video tests, and even mainstream gaming. PCMark 10 offers three primary test suites, and we chose the Extended suite. We use the Professional Edition courtesy of UL.
In the summary below, we are focusing primarily on the photo and video editing benchmarks. UL’s Procyon Office benchmark suite has largely superseded PCMark 10, but we don’t have the full versions of Adobe’s Lightroom or Photoshop.
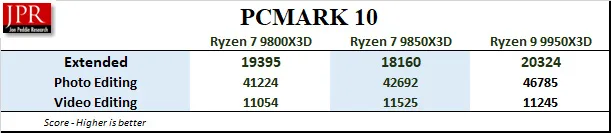
We cannot explain the overall score, however, the 9850X3D scores higher than the 9800X3D in the photo and video editing sub-tests, so we will focus on Procyon’s Office Productivity benchmark suite next.
Procyon Suite
UL’s Procyon benchmark suite is another hybrid approach using a combination of real-world applications and simulated workloads to measure performance. Procyon Office tests real-world tasks within Microsoft Office, while the AI Inference Benchmarks use common machine-learning tasks to measure performance.
Procyon Office
The Procyon Office Productivity Benchmark employs user-installed Microsoft Office apps to measure PC performance for office productivity work.
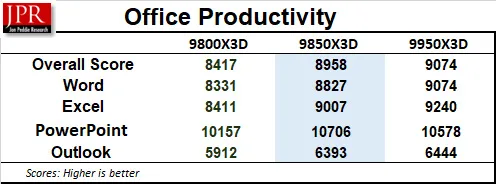
In every Office Productivity benchmark, the 9850X3D scores higher than the 9800X3D.
Procyon AI Computer Vision Benchmark
The Procyon AI Computer Vision Benchmark measures how AI inference engines perform. We used the Windows Machine Learning, Float 32 benchmark.
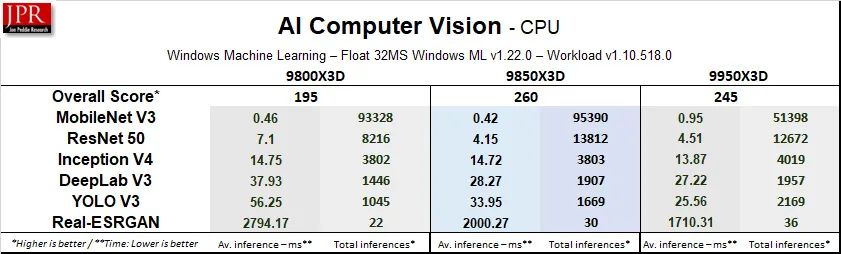
By virtue of its higher clock speeds, the 9850X3D pulls ahead of the other two CPUs.
UL Procyon AI Image Generation benchmark
The UL Procyon AI Image Generation benchmark measures inference performance for Stable Diffusion models. We used both Sable Diffusion and the more demanding Stable Diffusion XL (FP16) workload. It primarily runs on the GPU, but we included it for completeness.
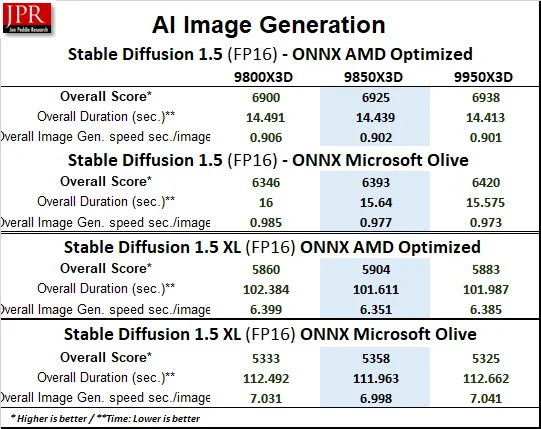
Because AI Image Generation runs on the GPU, there isn’t a lot of difference between the results although the 9850X3D beats the 9800X3D and trades blows with the 9950X3D.
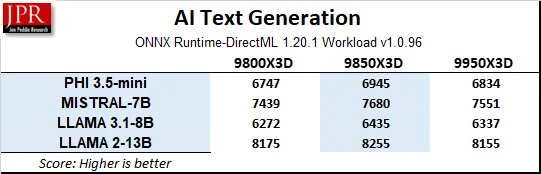
Procyon AI Text Generation Benchmark
The Procyon AI Text Generation Benchmark tests AI performance with multiple AI large language models (LLM). They run primarily on the GPU, but the higher clock speeds of the 9850X3D allow it to perform faster than the other two CPUs.
With synthetic and hybrid workloads complete, we now transition to fully real-world application benchmarks, beginning with Handbrake.
Fully Real-World Benchmarks
Handbrake
Handbrake, a well-regarded codec testing tool, effectively measures video streaming and decoding performance, utilizing common codec settings such as H.264 (x264), 60 fps, constant frame rate (CFR), AAC stereo audio, and decomb filtering. This makes it an excellent benchmark for evaluating how well a system handles video processing tasks.
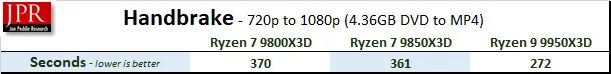
Handbrake is highly multi-threaded and takes full advantage of the 9950X3D’s sixteen cores. For having eight cores, the 9850X3D performs well and edges out the 9800X3D.
PugetBench for DaVinci Resolve
Unlike many benchmarks that isolate final rendering, PugetBench for DaVinci Resolve evaluates the entire creative workflow — from timeline playback to rendering and export. It runs directly atop DaVinci Resolve, pulling data from real in-app performance. We used the full version of Blackmagic Design’s DaVinci Resolve for testing.
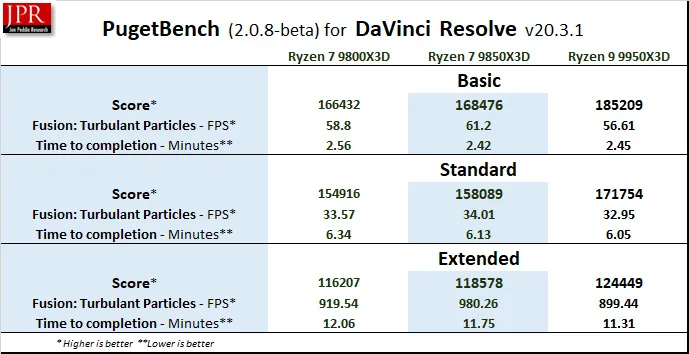
In every run, the 9850X3D was faster than the 9800X3D but it was eclipsed by the 9950X3D.
SPECworkstation 4.0 Benchmarks
The SPECworkstation 4.0 benchmarks are based on professional applications, most of which are in the CAD/CAM or media and entertainment fields. All these benchmarks are free except for vendors of computer-related products and/or services.
SPECworkstation 4.0 is the latest Standard Performance Evaluation Corporation’s (SPEC) freestanding benchmark that does not require ancillary software. It measures GPU, CPU, storage, and all other major aspects of workstation performance based on actual applications and representative workloads. Version 4.0 also features a category of tests focusing on AI workloads, and has updated many others over the older version.
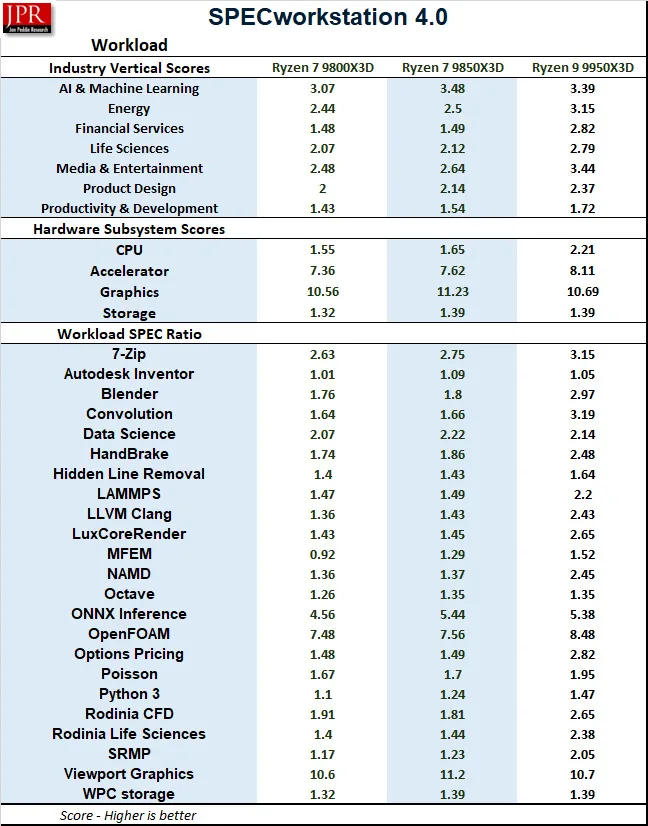
The 9950X3D generally edges out the 9800X3D and does very well against the 9950X3D in workstation tasks.
SPECviewperf 15
SPECviewperf 15 was also completely revamped over the 2020 version. It simulates professional application workloads, requiring significant system resources to load and manipulate large datasets before being rendered by the GPU.
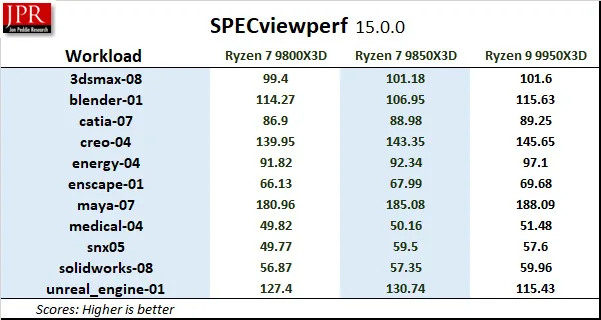
The 9850X3D is an excellent performer in this benchmark suite.
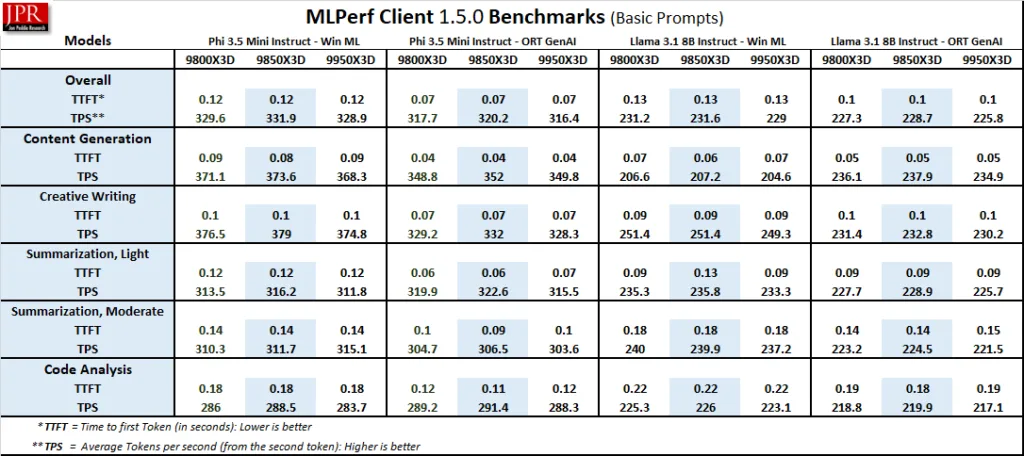
MLPerf Client 1.5 (LLM and AI Inference Testing)
The LLM tests in MLPerf Client v1.5 make use of multiple different language models and are also considered real-world benchmarks. Recently updated, it now features Windows ML support for improved GPU/NPU performance, expanded platforms, and experimental power/energy measurements.
The basic benchmark measures and compares Code analysis, Content generation, Creative writing, as well as Light and Moderate Summarization measurements.
Below are the MLPerf Client 1.5 benchmark basic results using four models.
In addition, there are extended prompt tests available.
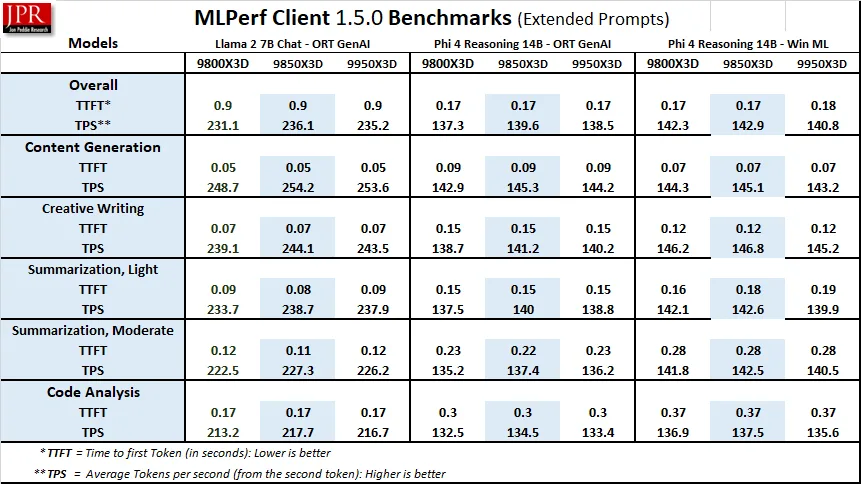
Finally, the more demanding Experimental benchmarks were run.
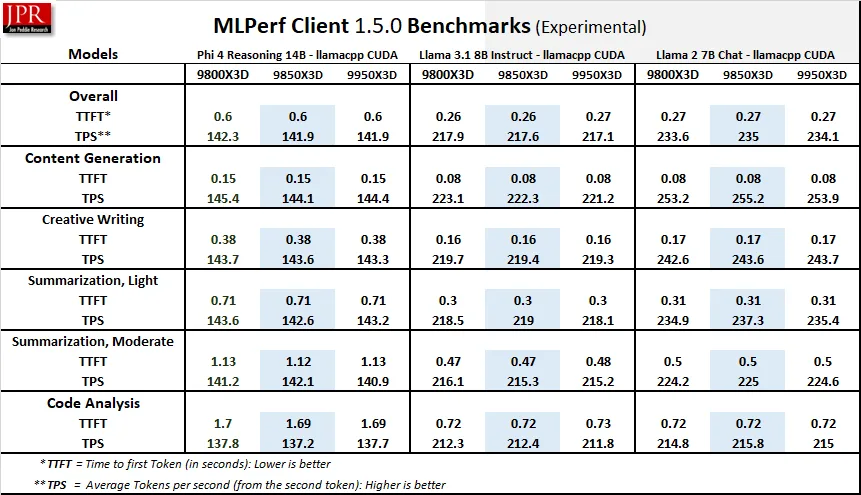
Since most of these AI models run primarily on the GPU, there isn’t a lot of performance variation between the CPUs. Finally, we look at LM Studio results.
LM Studio
LM Studio is a very powerful open-source desktop application that brings the capabilities of LLMs directly to local PCs without requiring a connection to the cloud. It’s a platform for downloading, running, and experimenting with a very large variety of open-source LLMs. It is perfect for users who want privacy and full control of their data.
When we downloaded the 63GB OpenAI/gpt-oss-120b model, we ran into this message: “Partial GPU Offload Possible.”
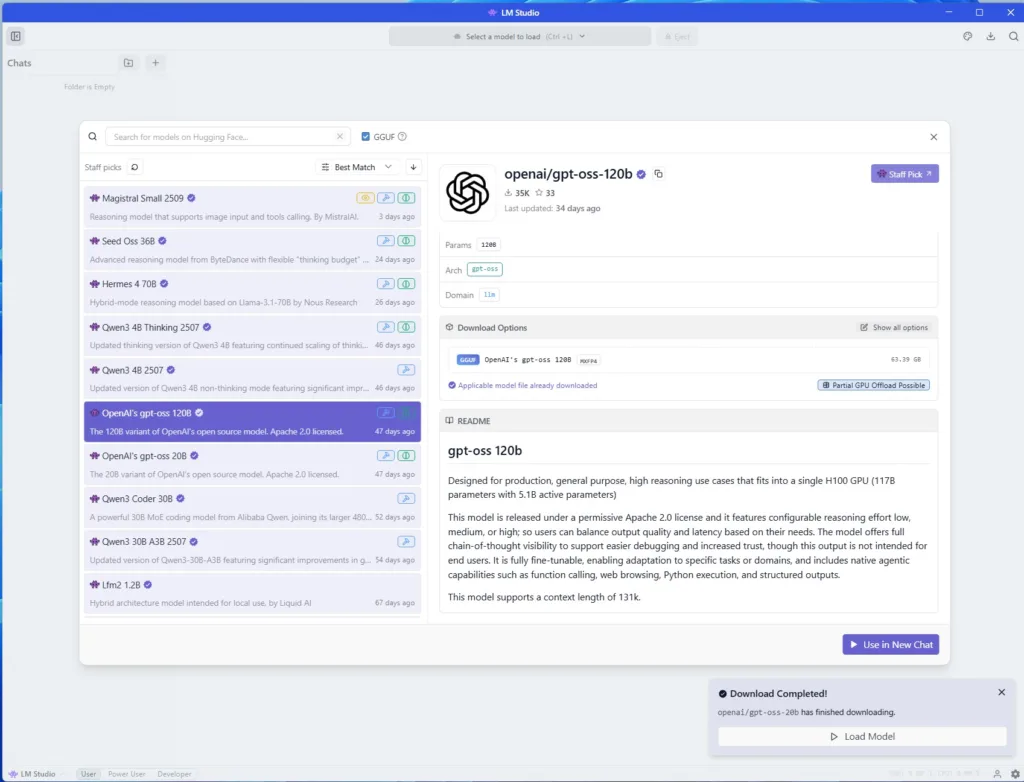
The 120 billion parameter model is so large that it cannot fit into the 32GB VRAM of the RTX 5090, and the differences between CPU speeds and system memory capacity become more apparent than with using smaller models. We actually need 96GB of system RAM just to load this model, plus we need to offload KV Cache to the CPU or the tokens per second responses drop to a crawl.
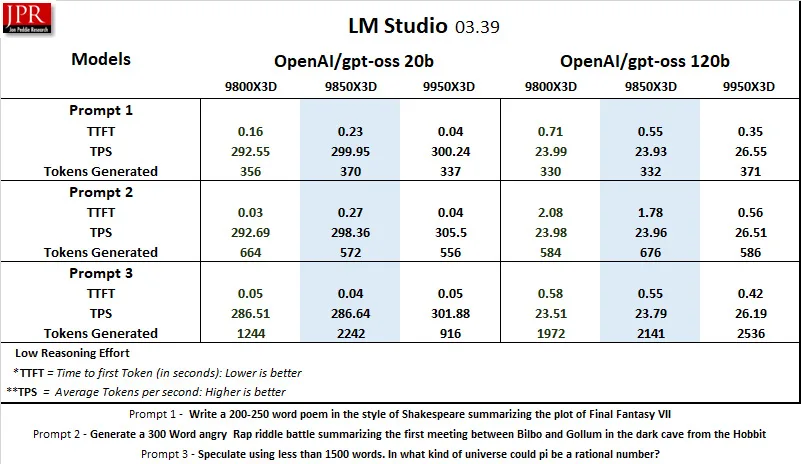
The 16-core 9950X3D excels with the 20 billion parameter model, although the 9850X3D performance is satisfactory and generally is a little faster than the 9800X3D.
Let’s head to our conclusion.
Conclusion and Verdict
The Ryzen 7 9850X3D is the new king of gaming CPUs — bar none. On the other hand, the Ryzen 7 9950X3D stands out as the best option for both high-end gamers and those seeking the highest performance for demanding creative, workstation, and AI uses, showcasing AMD’s continuous leadership in advancing CPU technology.
It is not likely that the 9850X3D’s +400MHz boost clocks will compel any but the most hardened overclockers to upgrade from a 9800X3D, but for only $20 more, it is a much more attractive purchase for gamers upgrading from an older CPU. It not only runs cooler than the 9800X3D, but is faster in almost all of the games and apps we tested.
We recommend that 9000 series X3D owners upgrade to the latest BIOS and chipset drivers supporting the 9850X3D to take full advantage of AMD’s continued efforts to fine-tune their platform.
Because of today’s outrageous memory pricing, it is a real advantage to be able to use lower frequency memory like DDR5 4800 and expect only a very slight performance disadvantage in gaming versus running at the sweet spot DDR5 6000 memory speeds. This is in contrast to the competitor’s platform which requires expensive high frequency RAM to achieve maximum performance.
The Ryzen 7 9850X3D is part of the evolution underscoring AMD’s relentless pursuit of pushing the boundaries of what is possible with modern CPU technology.
We are proud to present the BTR Editor’s Choice Award to the AMD Ryzen 7 9850X3D in recognition of its outstanding performance winning the world’s fastest gaming processor crown!