The $849.99 TUF GAMING RTX 4070 Ti OC Edition Gaming Performance
We recently received an ASUS TUF GAMING RTX 4070 Ti OC Edition 12GB from Nvidia and we have been testing it for the past ten days by using 19 PC games plus hybrid and non-synthetic benchmarks. This time, there will be no production nor distribution of Founder Edition models for its RTX 4070 Ti GPU (AD104) by Nvidia, and AIBs will be the only ones assembling and distributing custom models of this Ada Lovelace GPU. Although these GPUs arrive with multiple new features, including DLSS 3, this review will focus mainly on testing raw performance, not upscaling.
Our Plan
Nvidia touted the RTX 4070 Ti as a card delivering an outstanding efficient performance that can be up to 3x faster than the RTX 3090 Ti in specific games which offers a tremendous upgrade for GTX 1080 Ti or RTX 2080 users. Although for this review, we have not been able to use those same Pascal, Turing, and Ampere GPUs, we have been able to compare our RTX 4070 Ti versus an RTX 3080 (Ampere micro-architecture, 2nd RTX generation) and RTX 2080 Ti (Turing micro-architecture, 1st RTX generation).
We think comparing the RTX 4070 Ti’s performance against two iconic cards from Nvidia’s previous two RTX generations of GPUs may be worth it for Turing or Ampere users considering an upgrade to Ada Lovelace.
The RTX 4070 Ti features 7680 CUDA Cores, 40 Shader TFLOPS, 93 RT-TFLOPS, 641 Tensor FLOPS, and 12GB of GDDR6X memory, so we will see how it performs and compare with raster games and ray-tracing/DLSS games. We will focus on RTX 4070 Ti raw performance as well as consider whether the new RTX 4070 Ti TUF GAMING OC Edition at $850 delivers a good value as an upgrade from the RTX 3080 that launched at $700 MSRP two years ago and from the RTX 2080 Ti which launched at $1000 MSRP four years ago.
Features & Specifications
Key Features from ASUS
- Dedicated 3rd generation ray tracing cores (60)
- Dedicated 4th generation Tensor cores (240)
- NVIDIA DLSS 3 support
- Game Ready and Nvidia Studio drivers
- Nvidia GeForce Experience
- Nvidia Broadcast
- Nvidia G-Sync
- Nvidia GPU Boost
- PCI Express Gen 4
- Microsoft DirectX 12 Ultimate support
- Support for Vulkan RT APIs, Vulkan 1.3, and OpenGL 4.6
- HDCP 2.3 support
- DisplayPort 1.4a support: up to 4K at 240Hz or 8K at 60Hz with DSC, HDR
- HDMI 2.1a support: up to 4K 240Hz or 8K 60Hz with DSC, Gaming VRR, HDR
Specifications
Nvidia’s MSRP price for RTX 4070 Ti GPUs is $799, and ASUS’s price for the RTX 4070 Ti TUF GAMING OC Edition is $849.99. This is approximately $50 over Nvidia’s MSRP price for a quality well-cooled tri-fan custom model with a factory GPU overclock of 120 MHz over the Nvidia reference 2610MHz boost clock.
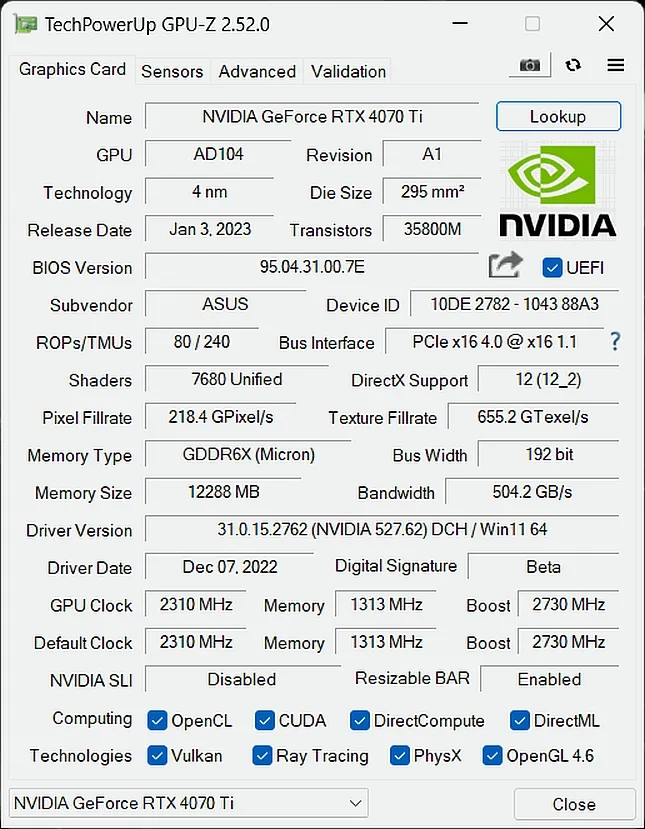
According to GPU-Z, the RTX 4070 Ti TUF GAMING OC has the same default GPU clock of 2310MHz and boost GPU clock of 2730MHz – 120MHz higher than the reference – using both VBIOS modes, so the only difference between VBIOS modes is the fan curve.
We will show GPU-Z data and test the card using the Performance VBIOS mode only, as the factory overclock doesn’t change between VBIOS modes, and the card is silent under full-load when in Performance Mode, so it is not worth having higher GPU temperatures with slightly worse performance.
Below is the advanced general information on the RTX 4070 Ti TUF GAMING OC reported by the GPU-Z tool.
As you can see from the GPU-Z screenshots above, you can even increase both power and temperature limits to some degree, so there is still some room for GPU overclocking, but not very high or extreme, at least without taking other risky modding procedures.
The Test Bed
We benchmark with CapFrameX and FrameView tools on a recent install of Windows 11 Pro Edition 22H2, at 2560×1440 and 3840×2160, using an Intel Core i9-12900K with stock clocks and 32GB of T-FORCE XTREEM ARGB WHITE DDR4 3600MHz memory on an ASUS PRIME Z690-P D4 motherboard. All games and benchmarks are the latest versions, and we use the latest GeForce Game-Ready 527.62 press drivers for games and hybrid and non-synthetic tests. The games tested, display driver, settings, and hardware are identical except for the GPUs we compare.
Let’s see the unboxing and take a closer look at this graphics card.
A Closer Look at the ASUS TUF GAMING RTX 4070 Ti OC Edition 12GB
Packaging
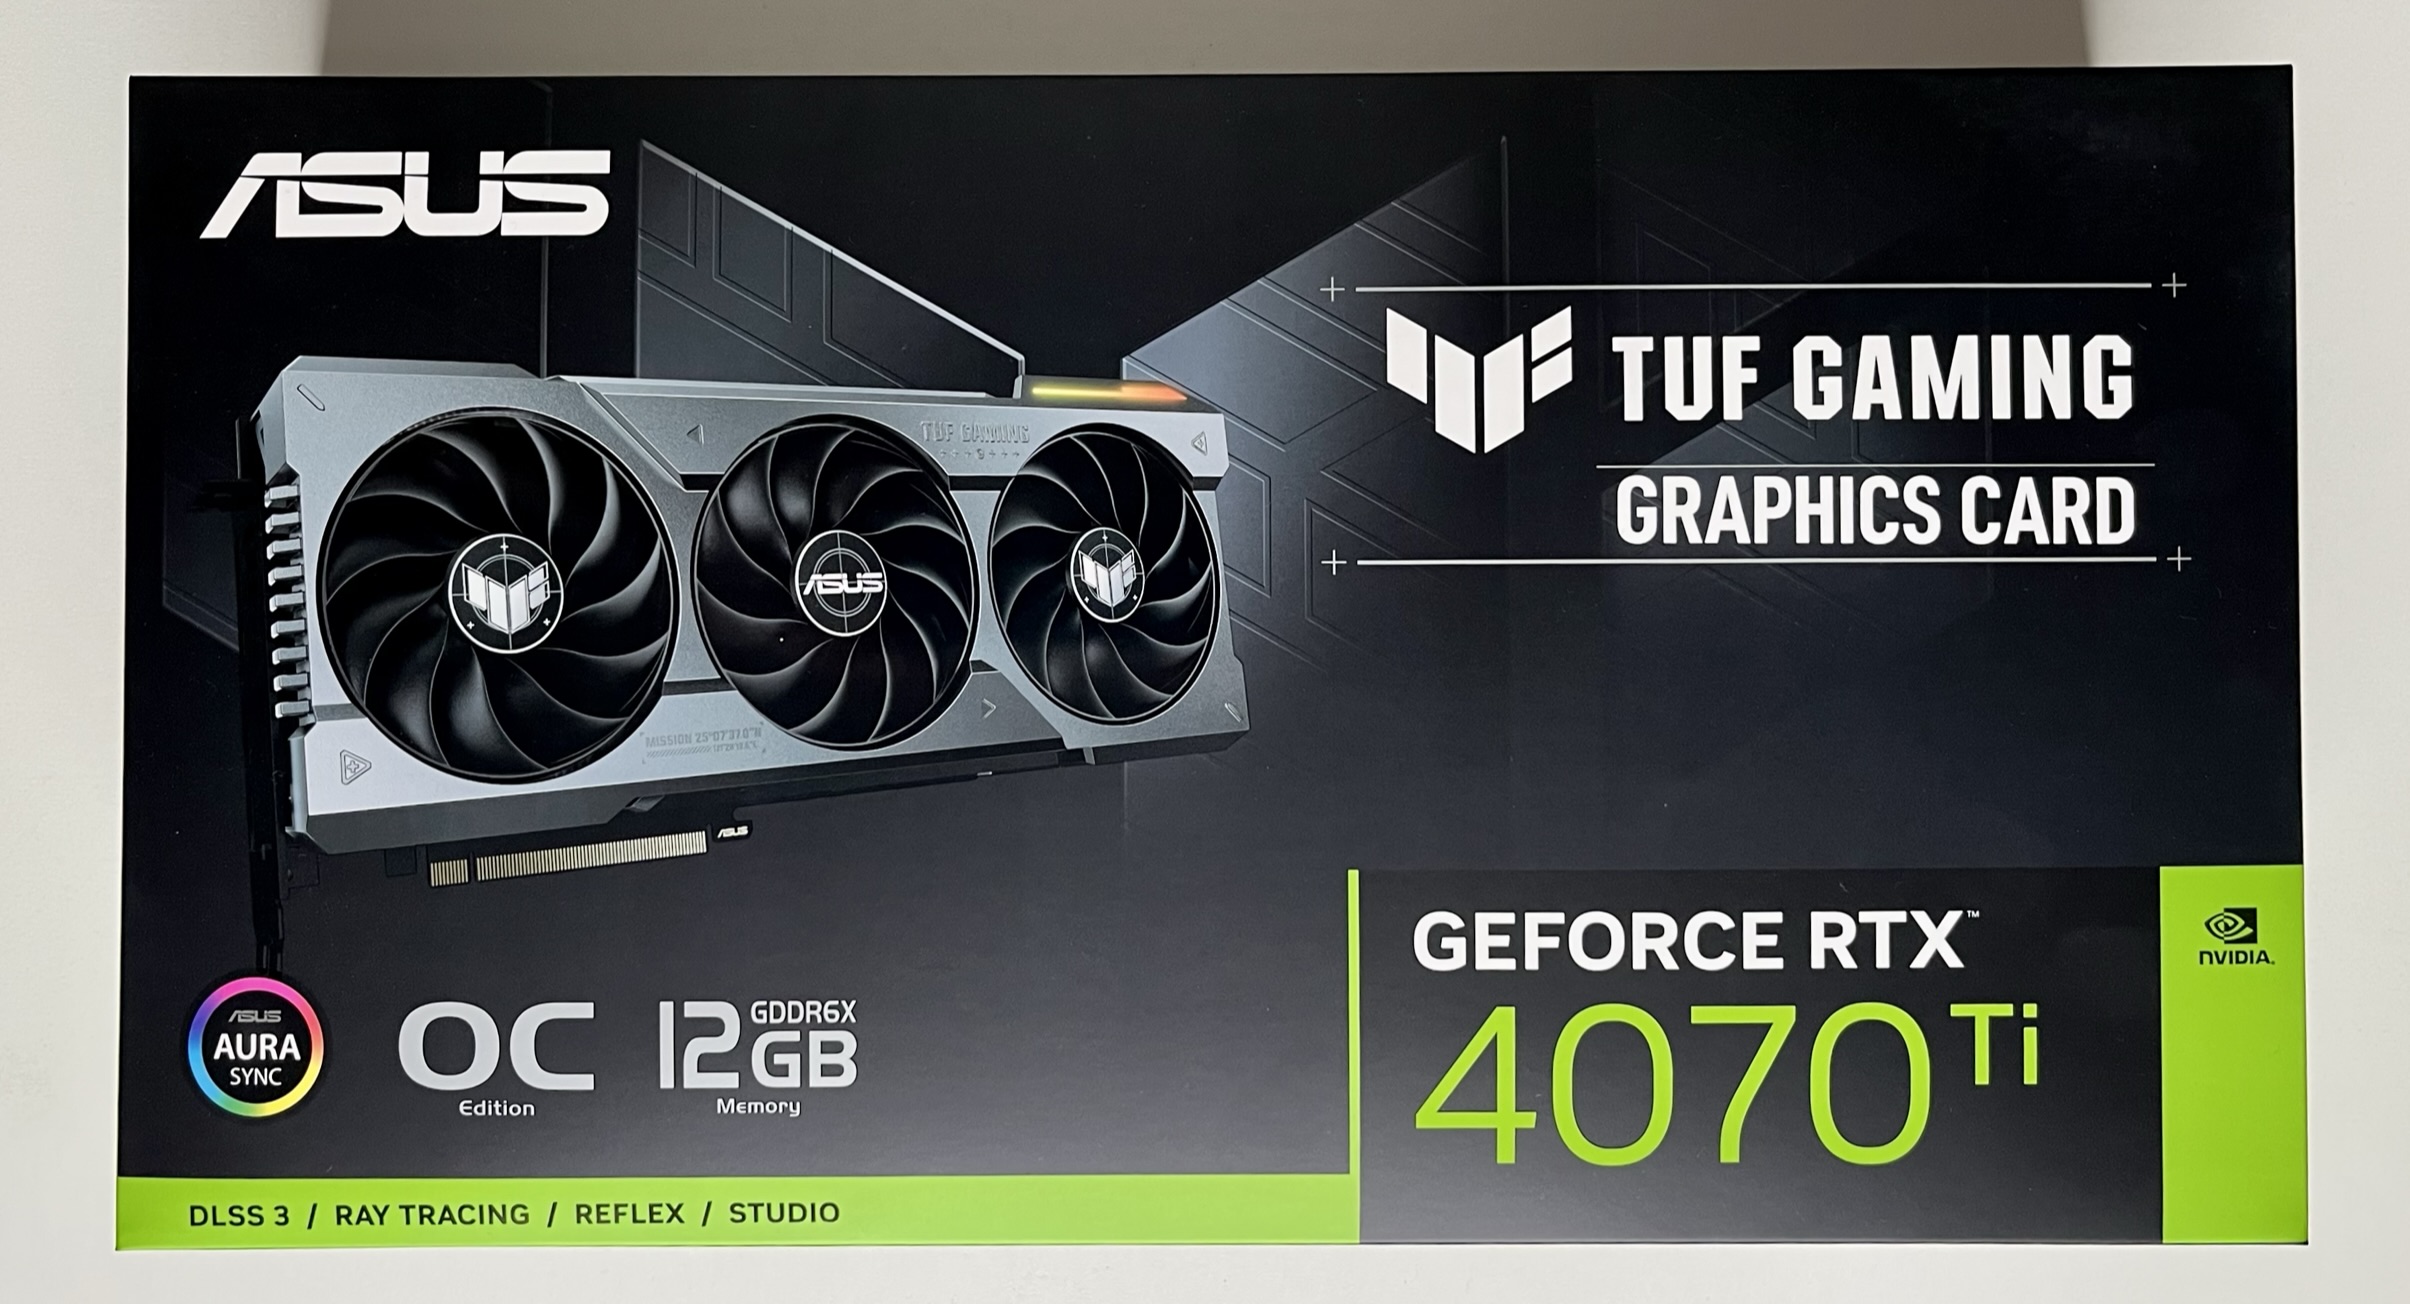
The box cover highlights the graphics card image, adding the TUF GAMING logo, the GeForce RTX GPU name, and references to AURA SYNC, OC Edition, 12GB of GDDR6X memory, and DLSS3, ray tracing, Reflex, and Studio.
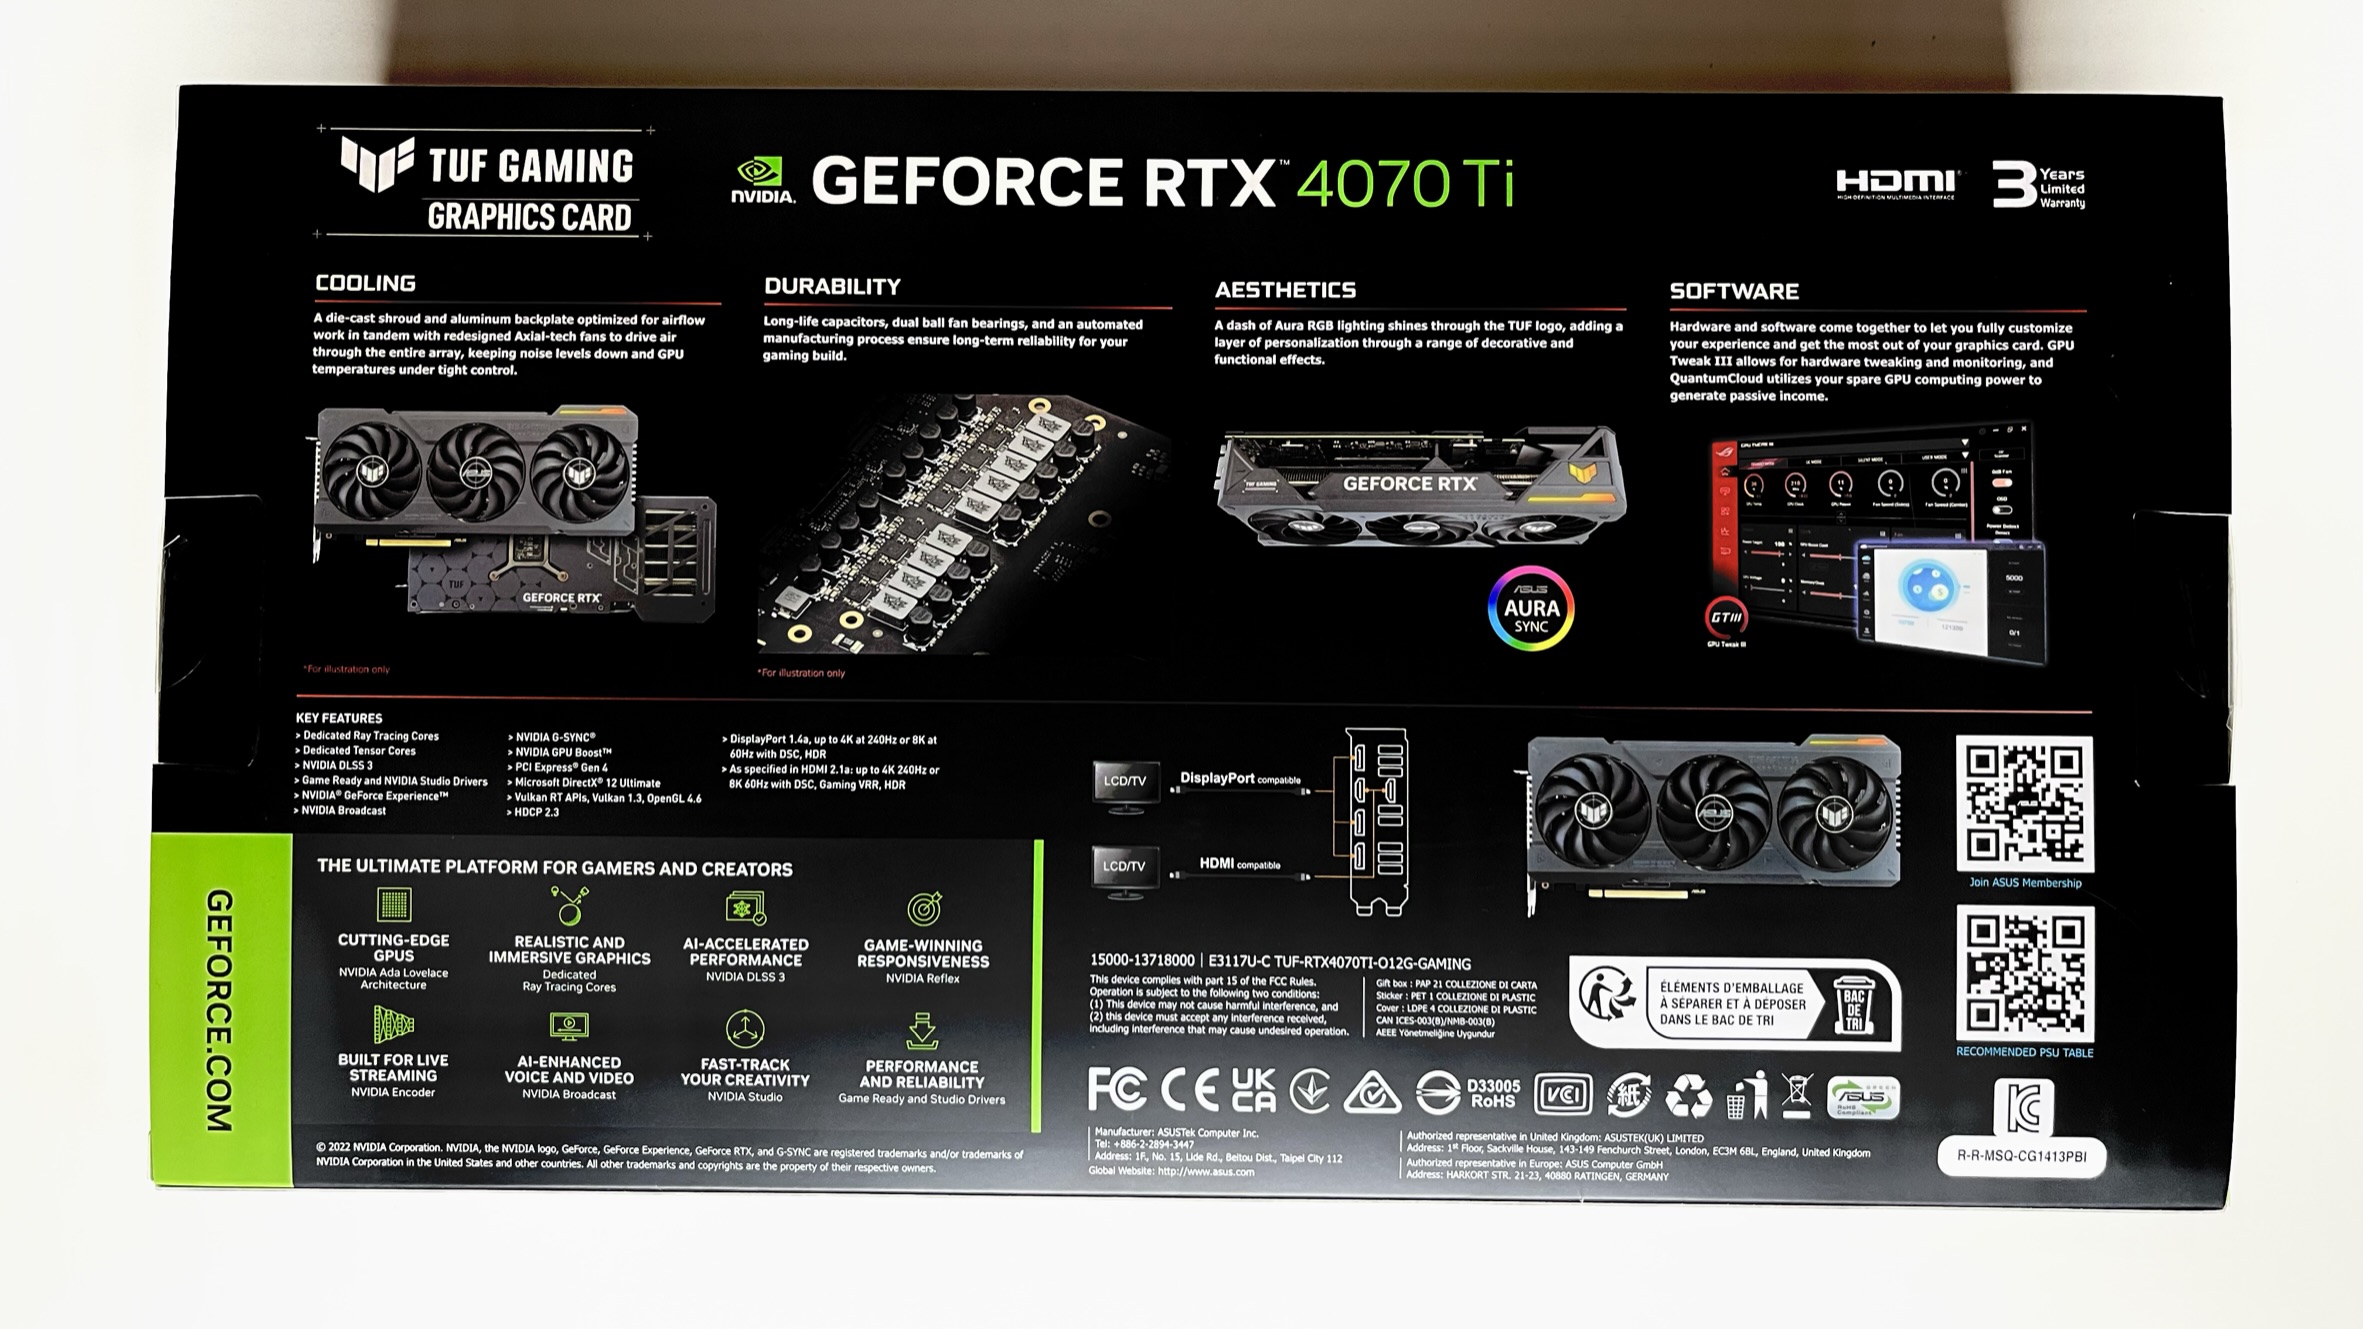 The back of the case touts the strengths of this model in terms of cooling, durability, aesthetics, and ASUS software. It also includes a list of key features like its dedicated ray tracing and tensor cores, PCI-E Gen 4, Display Port 1.4a, HDMI 2.1a, and HDCP 2.3, and support for DirectX 12 Ultimate, DLSS 3, and G-Sync.
However, on the back of the box, there is no mention of the minimum system requirements. Only a QR code that leads to a table of recommended PSUs is added. The minimum system requirements are only shown on one lateral side of the cover and only mention the need for a 1*16-pin supplementary power connector.
Accessories
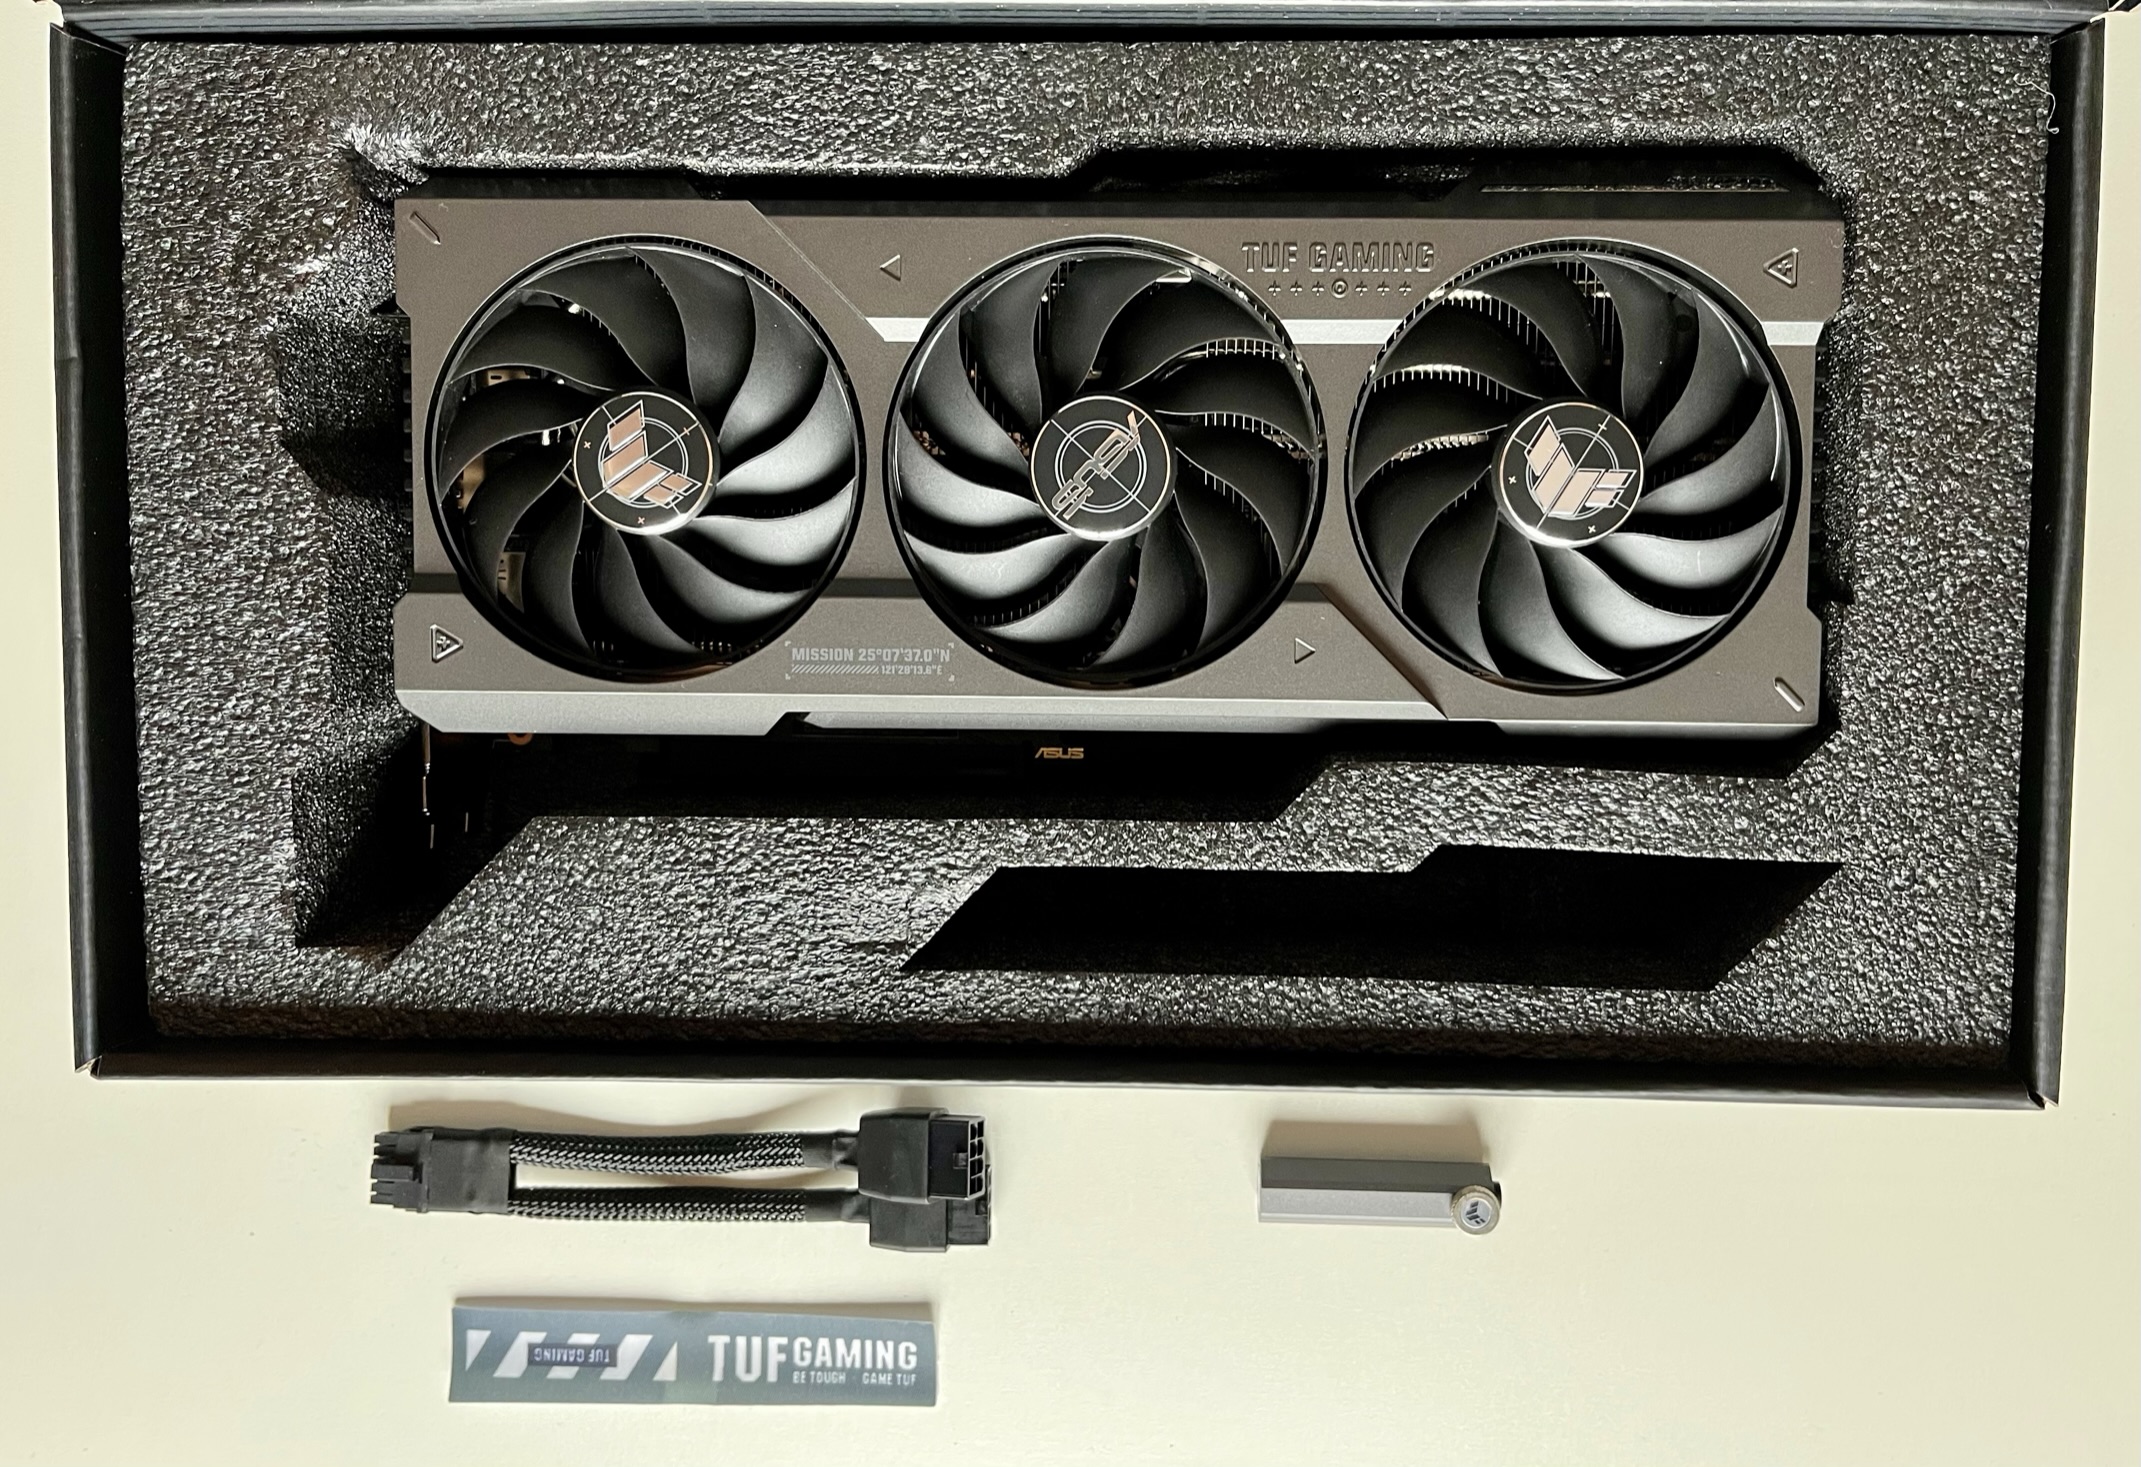
We open the box and note there are parts for a card stand. The card stand is height adjustable, and its thinner upper part can also be separated and become a small screwdriver for card disassembling purposes. Also, the card stand has a rubber band at one end, and the support base has a magnet to fix the card stand inside the chassis.
ASUS includes a PCIe Gen5 power cable adapter to two PCI-E 8-pin cables to connect the RTX 4070 Ti TUF GAMING OC to most PSUs. While the power connector adapter requires two Molex wires from the PSU to operate, newer PSUs may offer the new PCIe Gen5 single cable connector instead of massive double cabling. They also include a Velcro cable management strap with TUF GAMING branding.
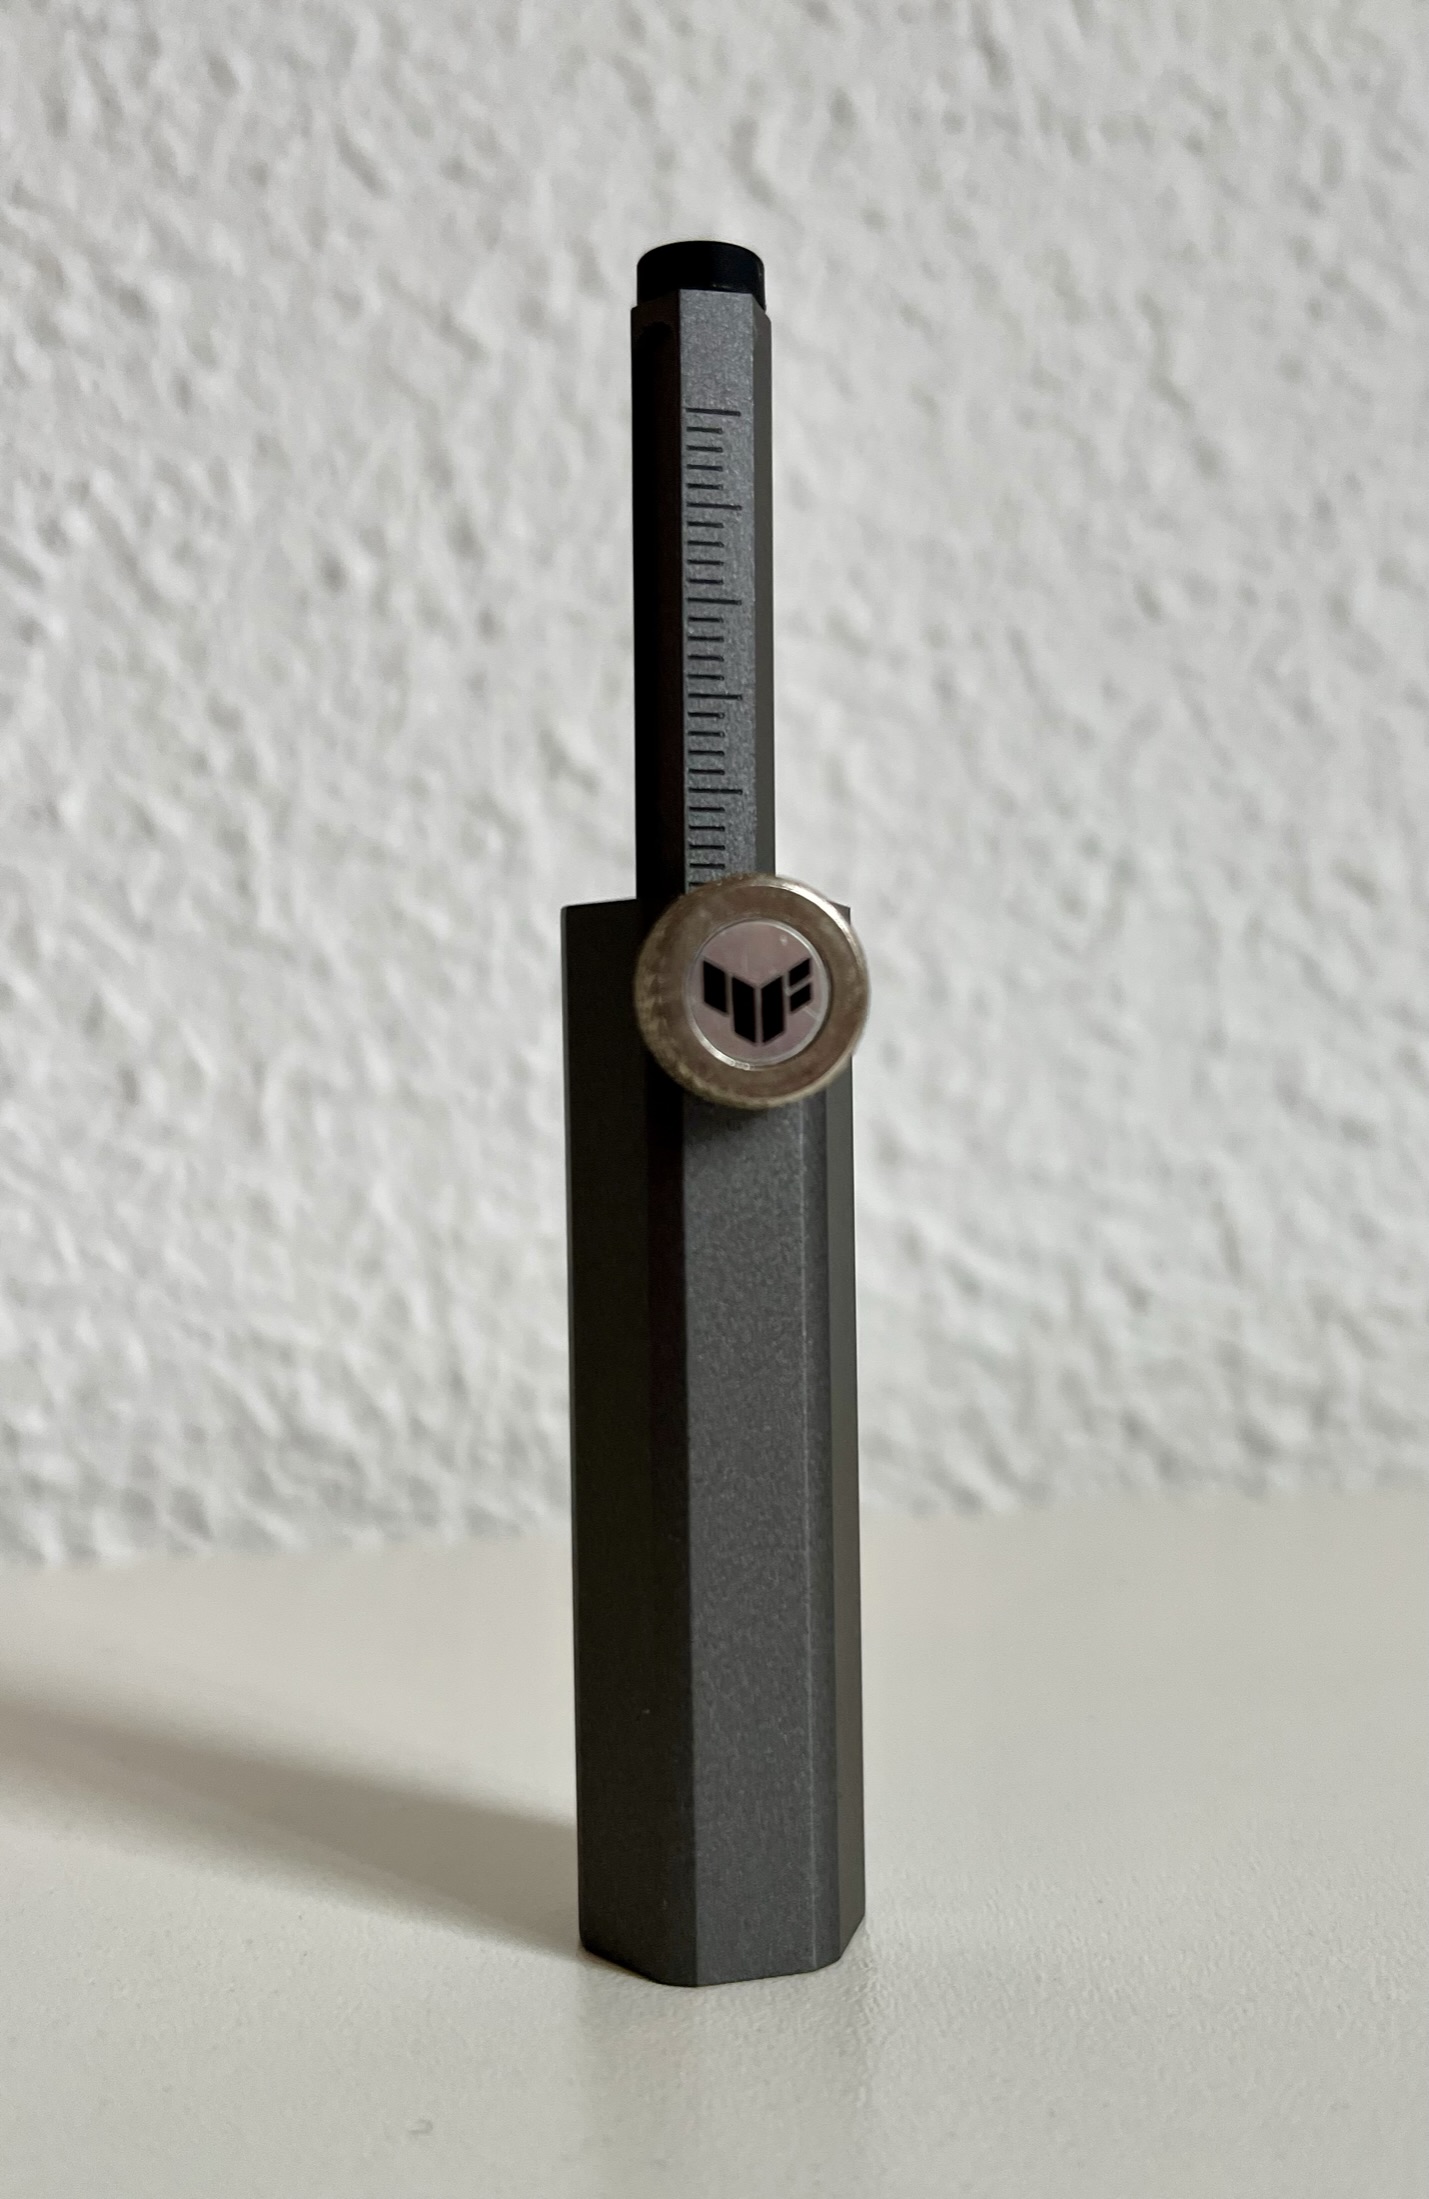
Above, you can see the card stand fully assembled. Some may not feel the need to use the card stand, given how relatively heavy the 4070 Ti TUF GAMING OC is. However, for safety and given the little volume it occupies inside the case, we think it is a worthwhile addition.
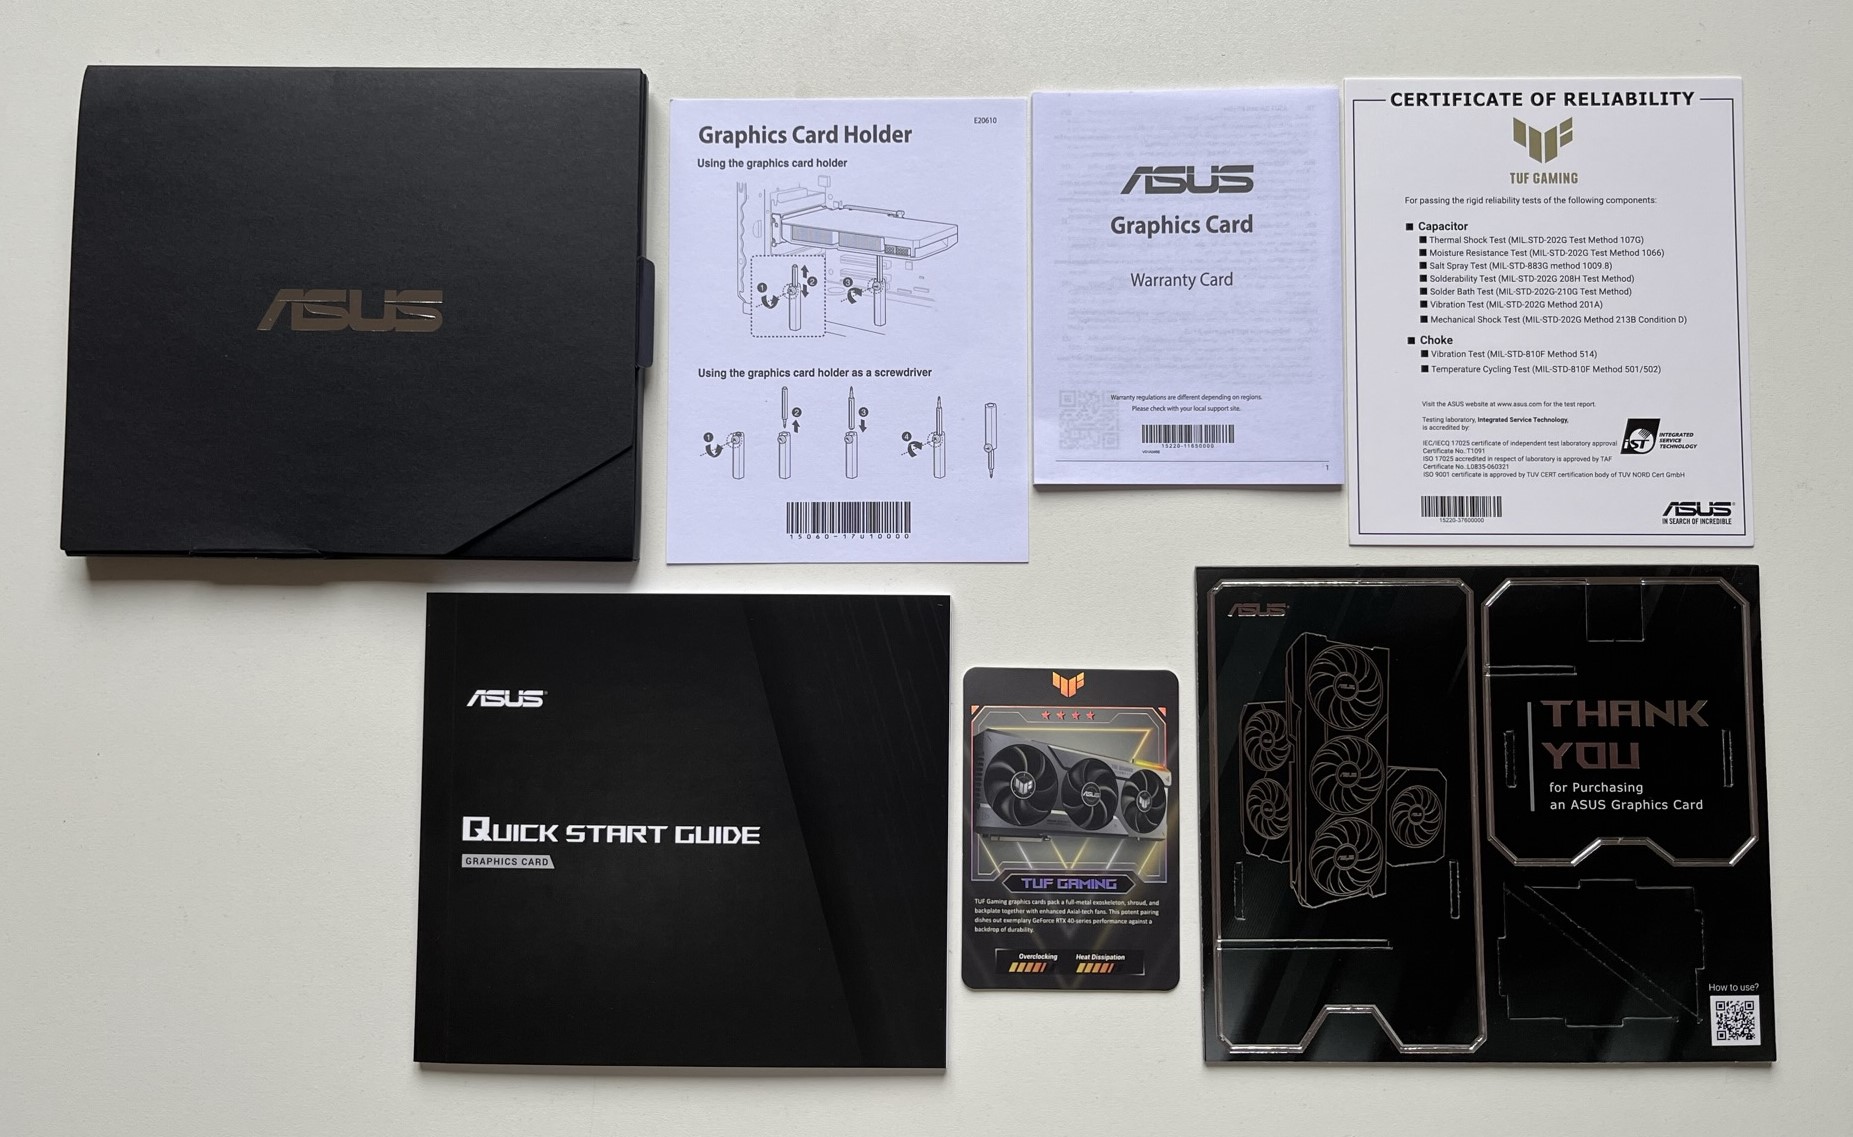
Also, you will find a small detachable black cardboard box, which includes the quick start guide, the warranty card, the certificate of reliability, the graphics card holder manual, an ASUS promotional detachable cardboard holder for your mobile phone, and a collectible card advertising this model.
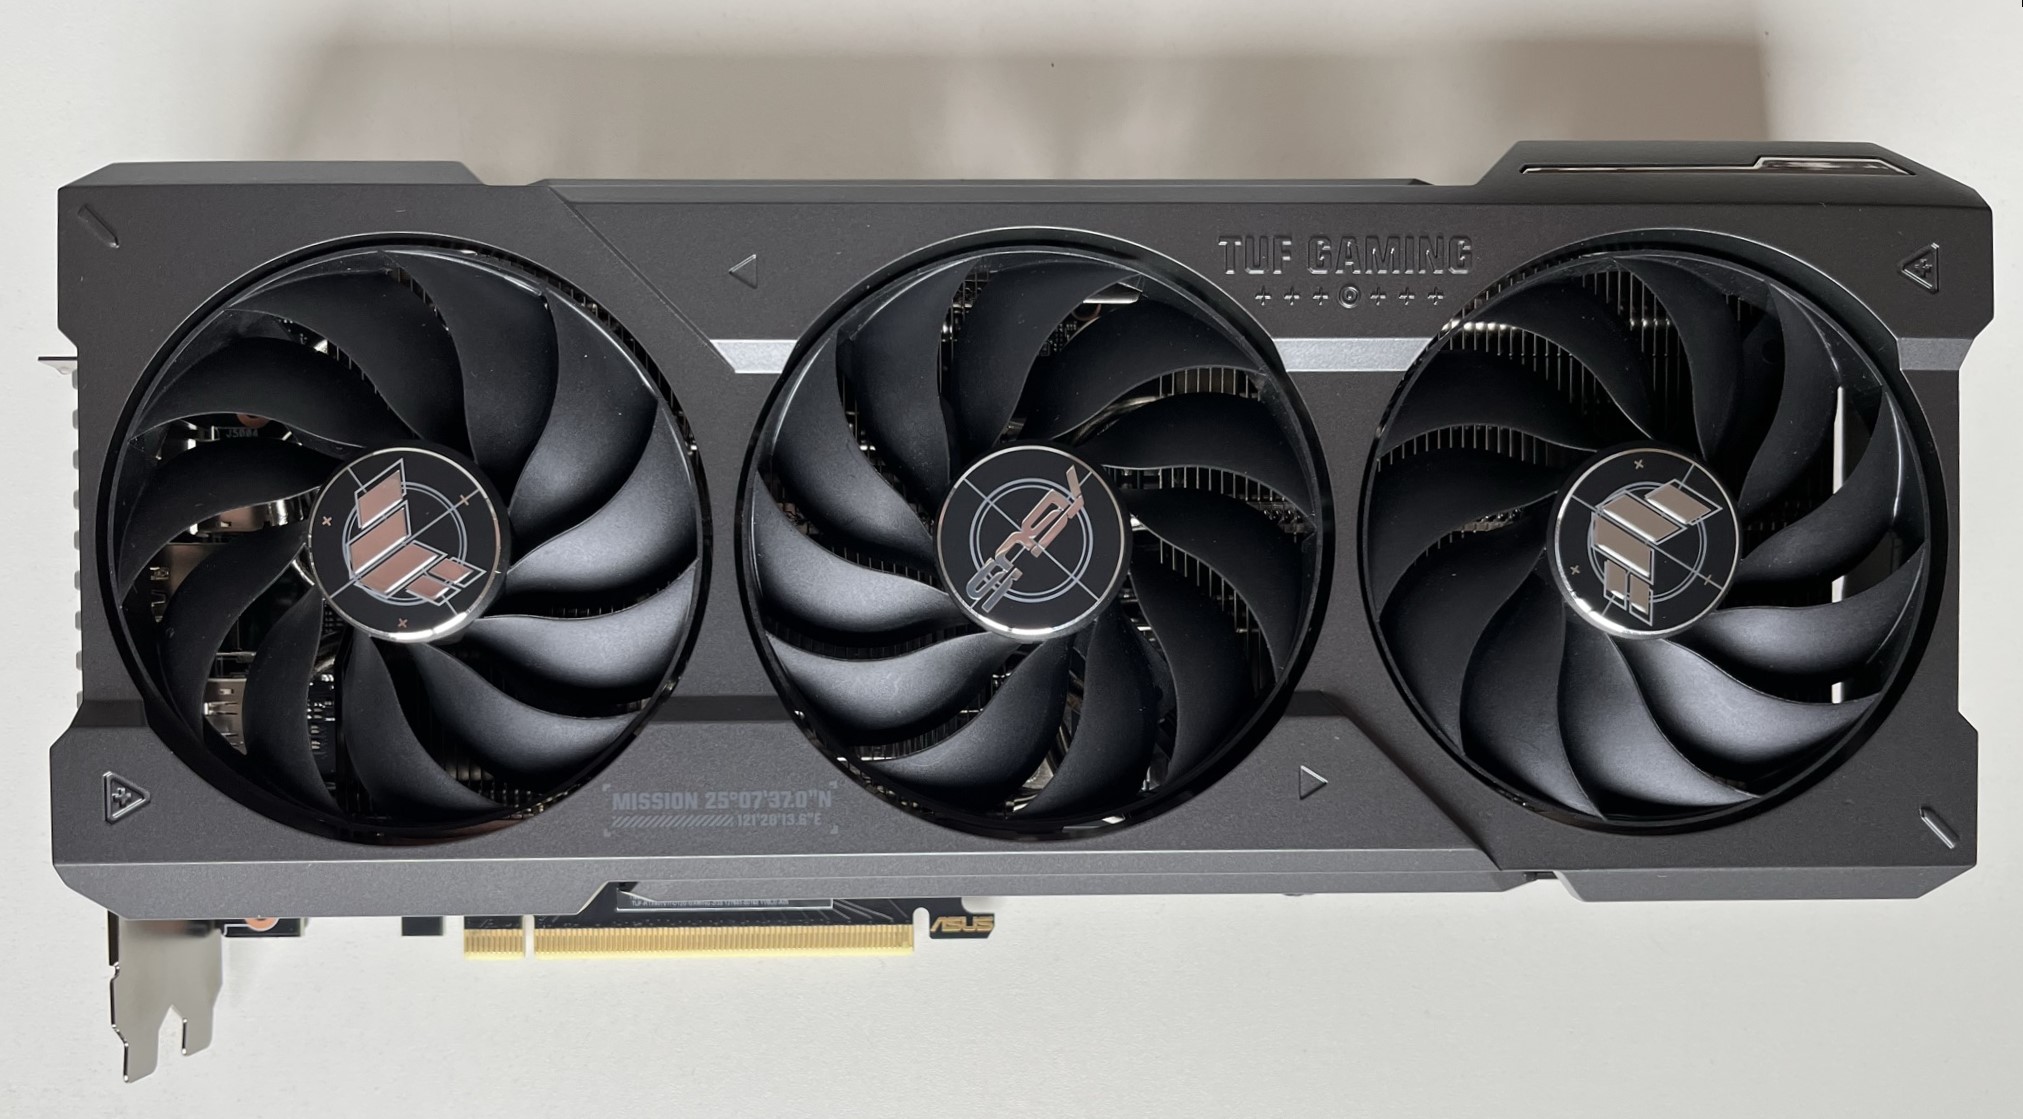
The Card
The RTX 4070 Ti TUF GAMING OC is a large tri-fan and three-slot graphics card with sober aesthetics and solid and quality design.
Turning it over, we see a sturdy metal backplate featuring the TUF and GeForce RTX logos and branding.
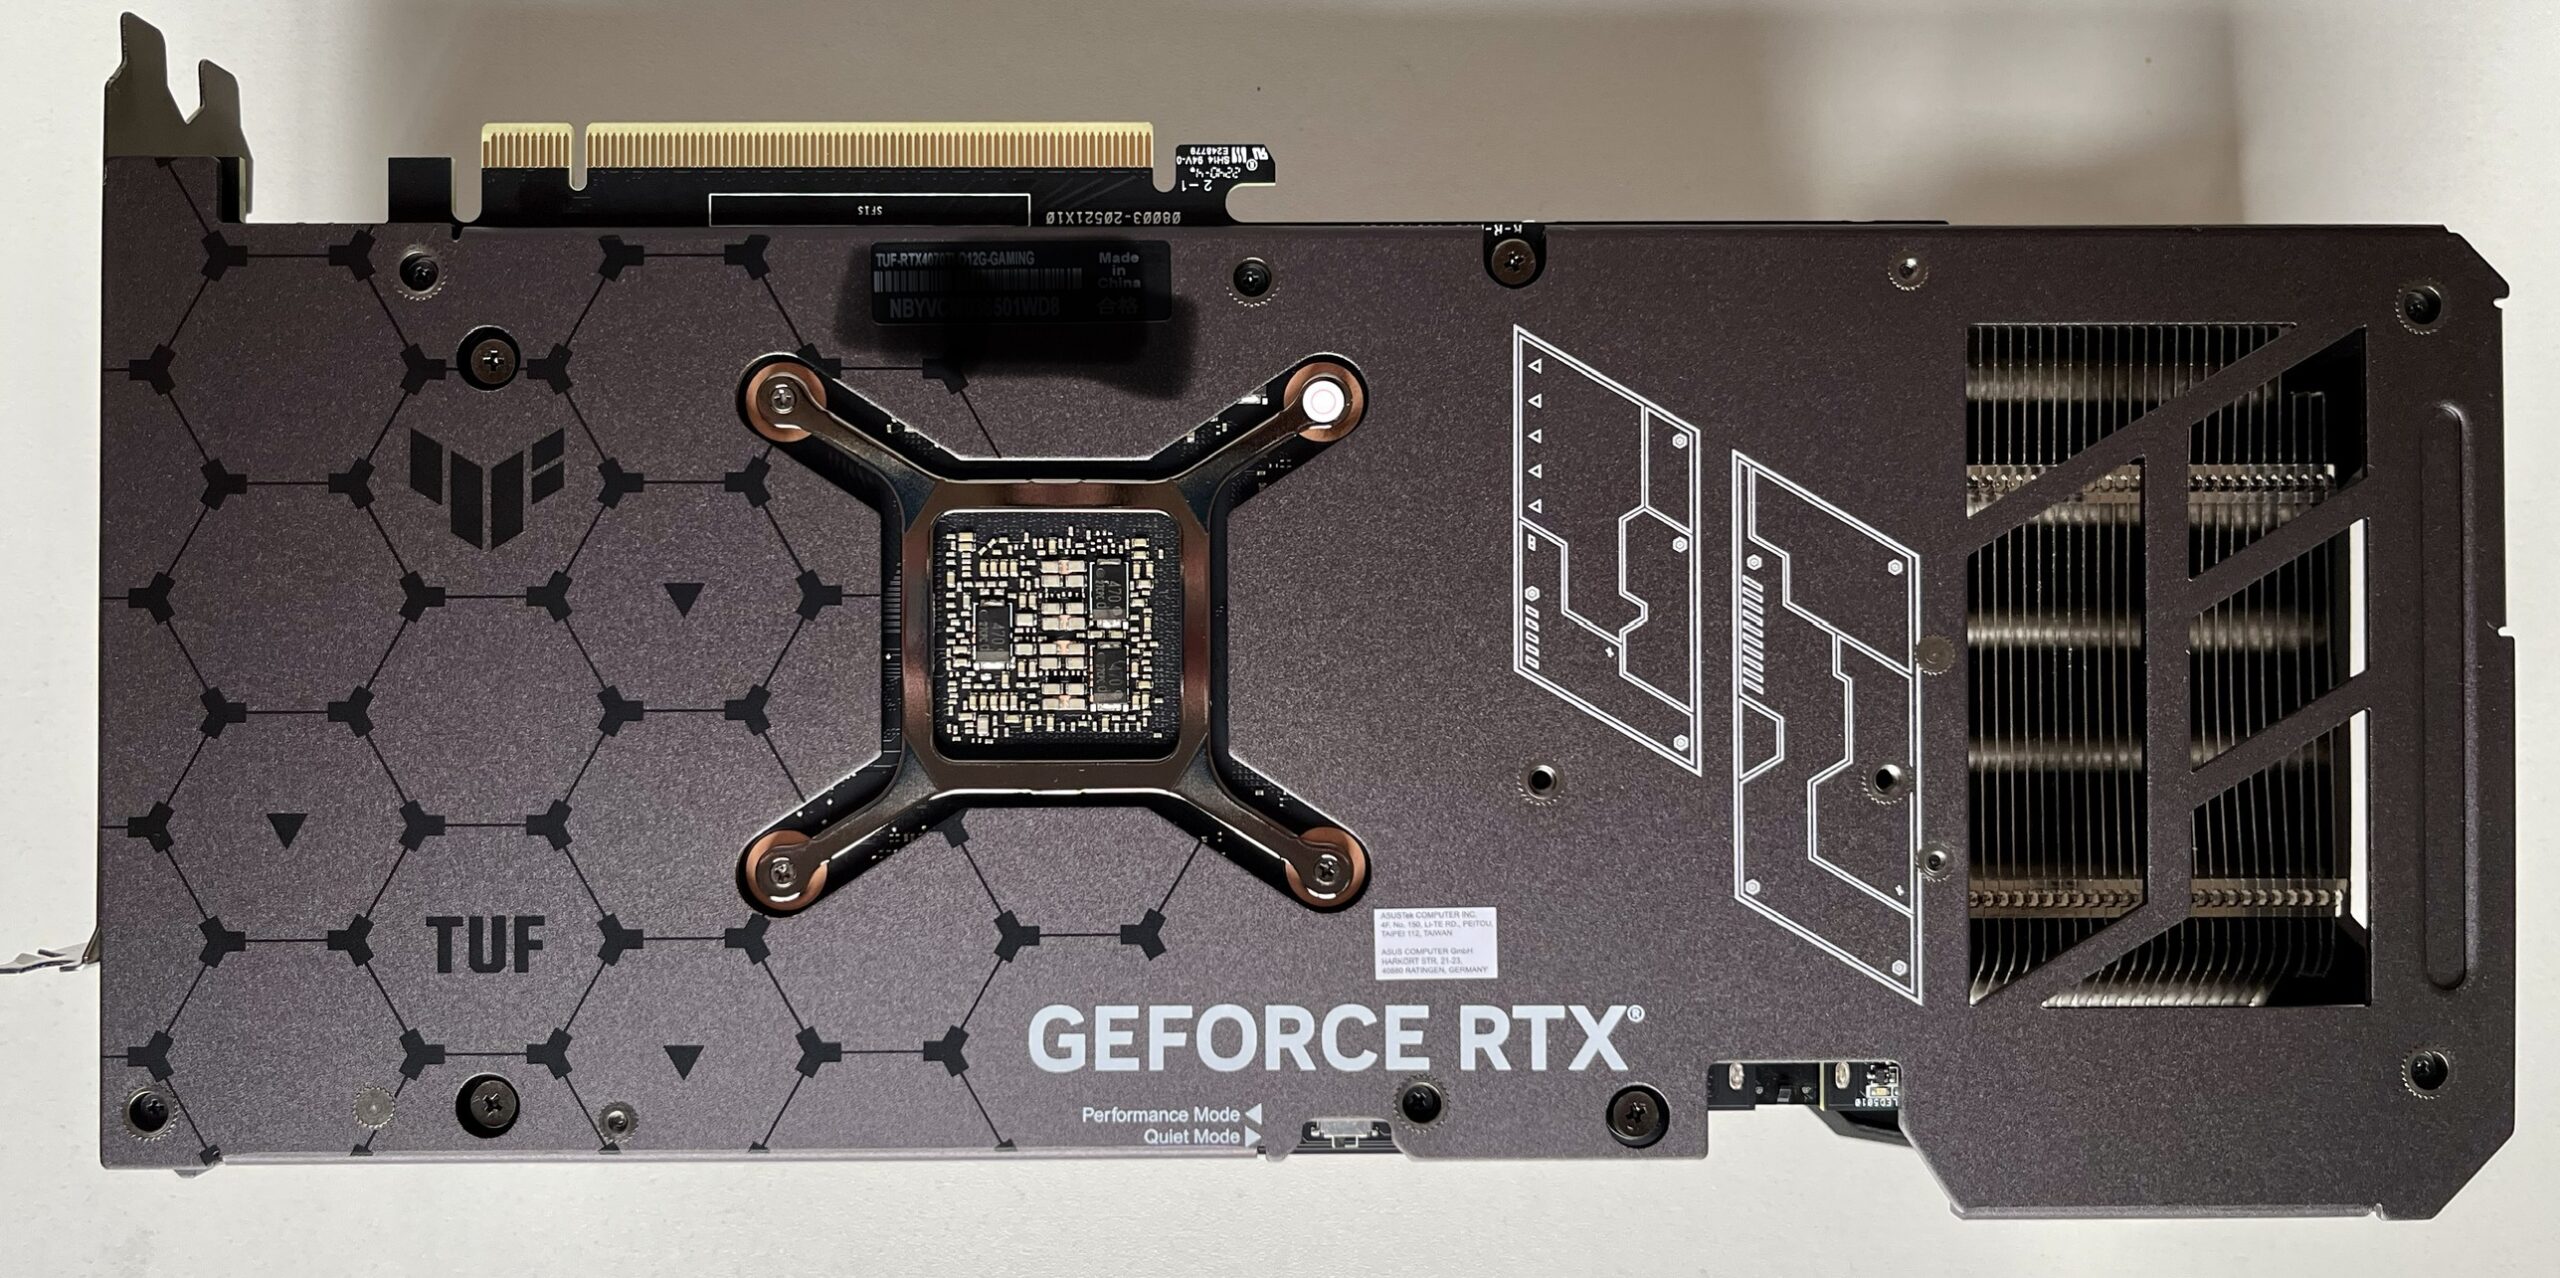
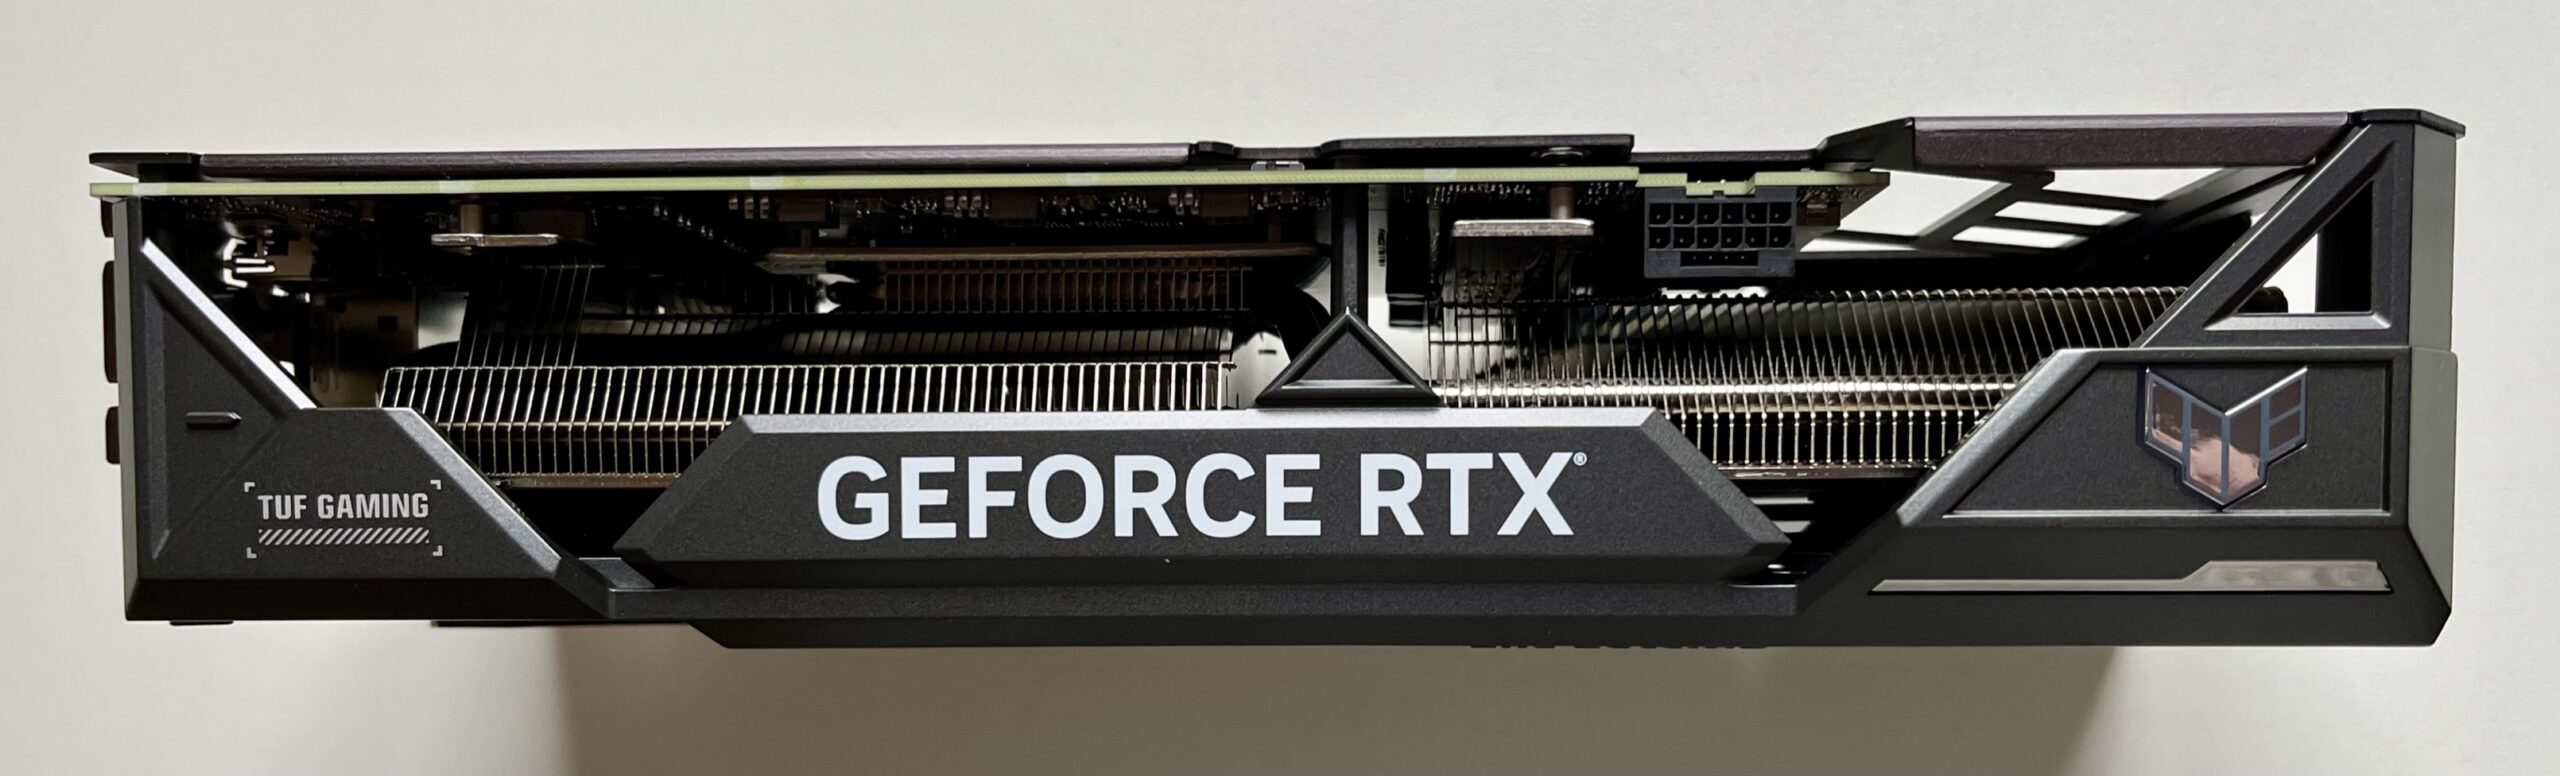
Heat pipes and heatsink fins cover the entire PCB, and there is a switch to choose between the Performance and Quiet VBIOS modes. We didn’t bother using the Quiet VBIOS mode as the card is silent anyway, and the factory overclock is the same, but it is good to have in case a flash procedure fails.
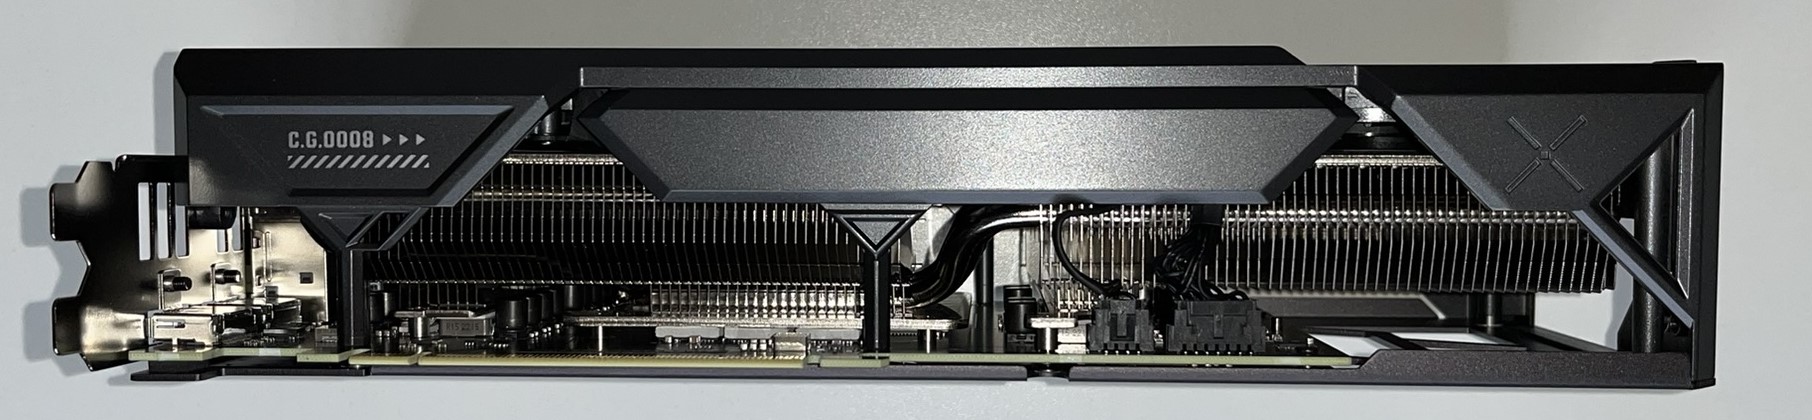
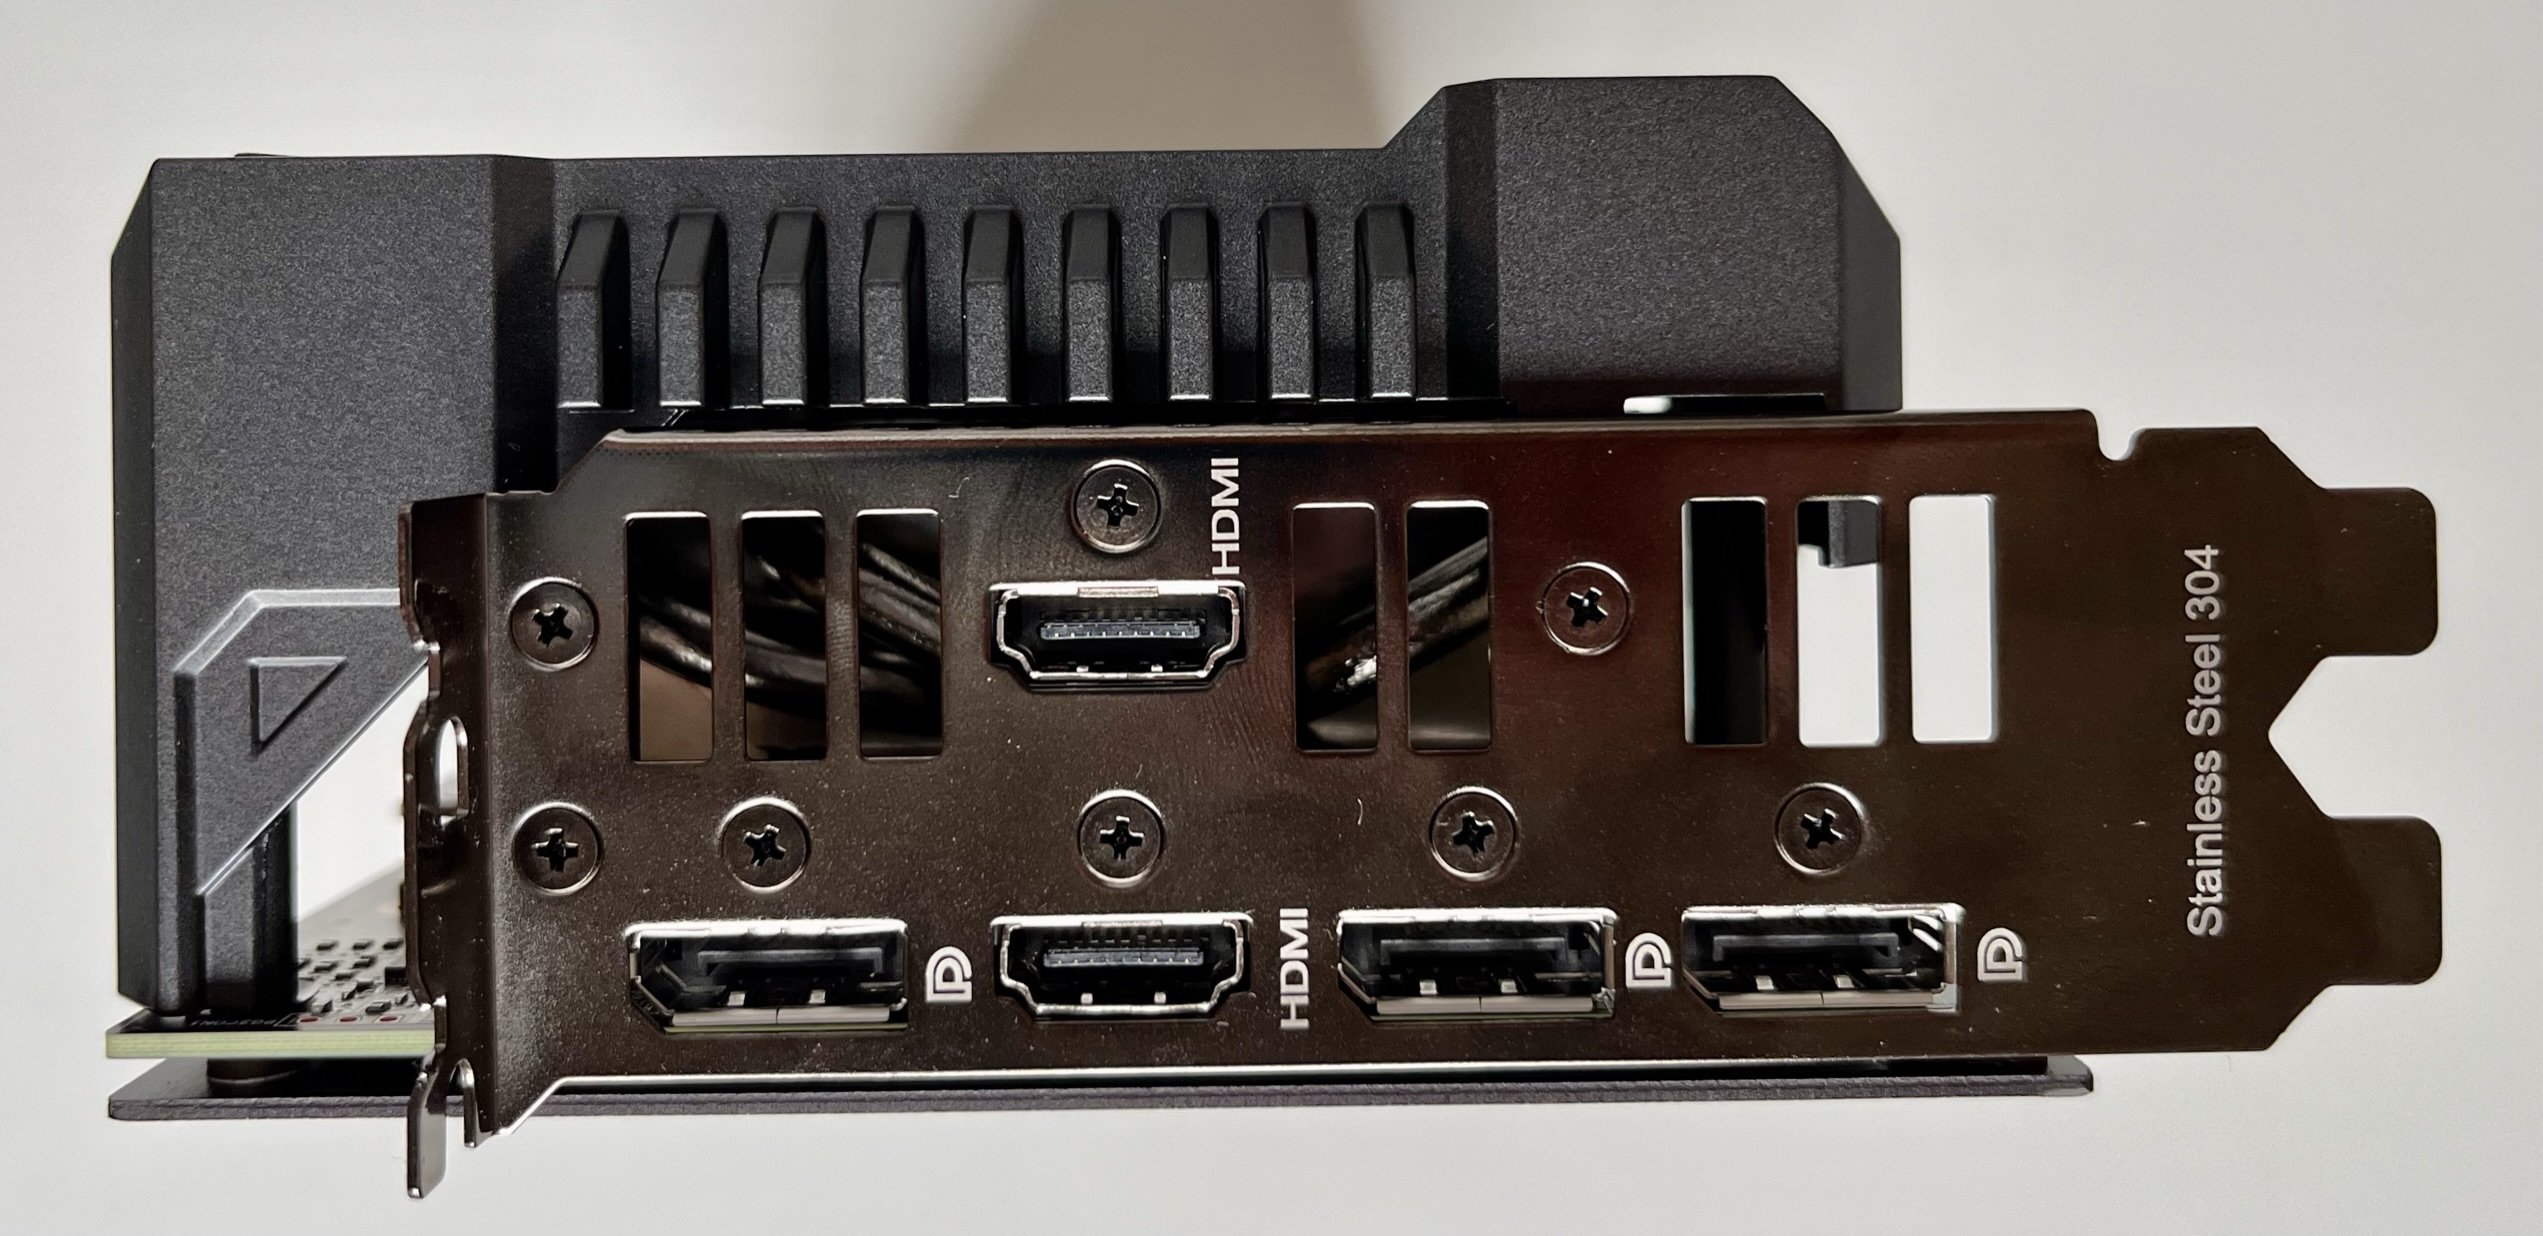
The IO panel connectors are 3 DisplayPorts and 2 HDMI connections.
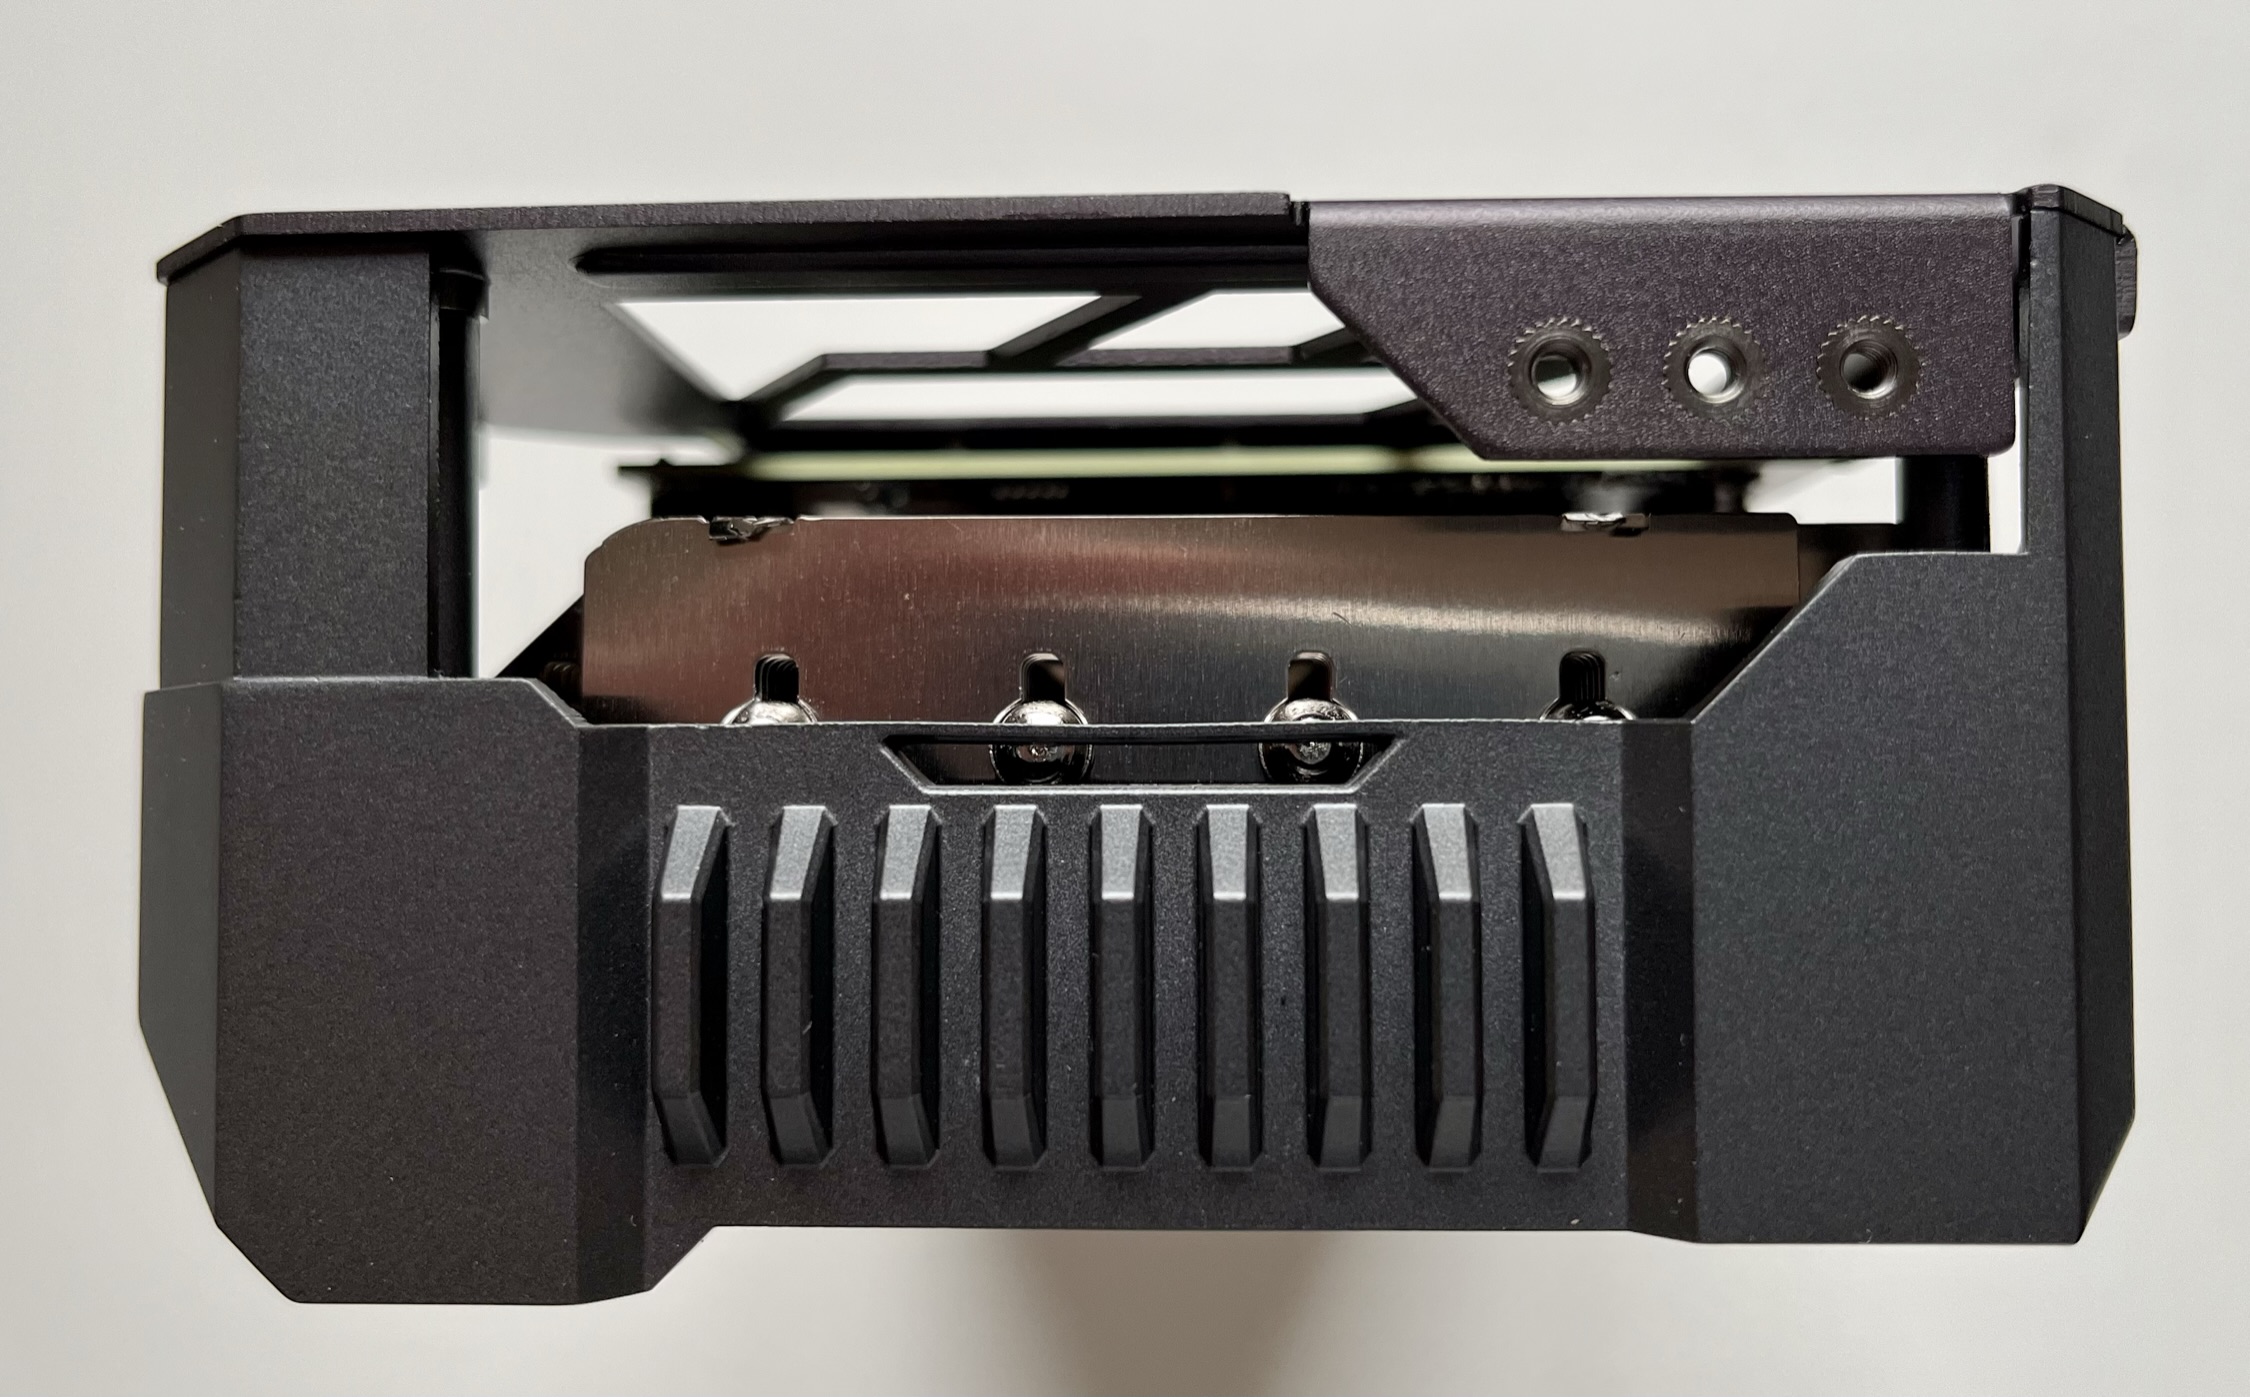
Below is the other card end.
Plugged in & Inside the case
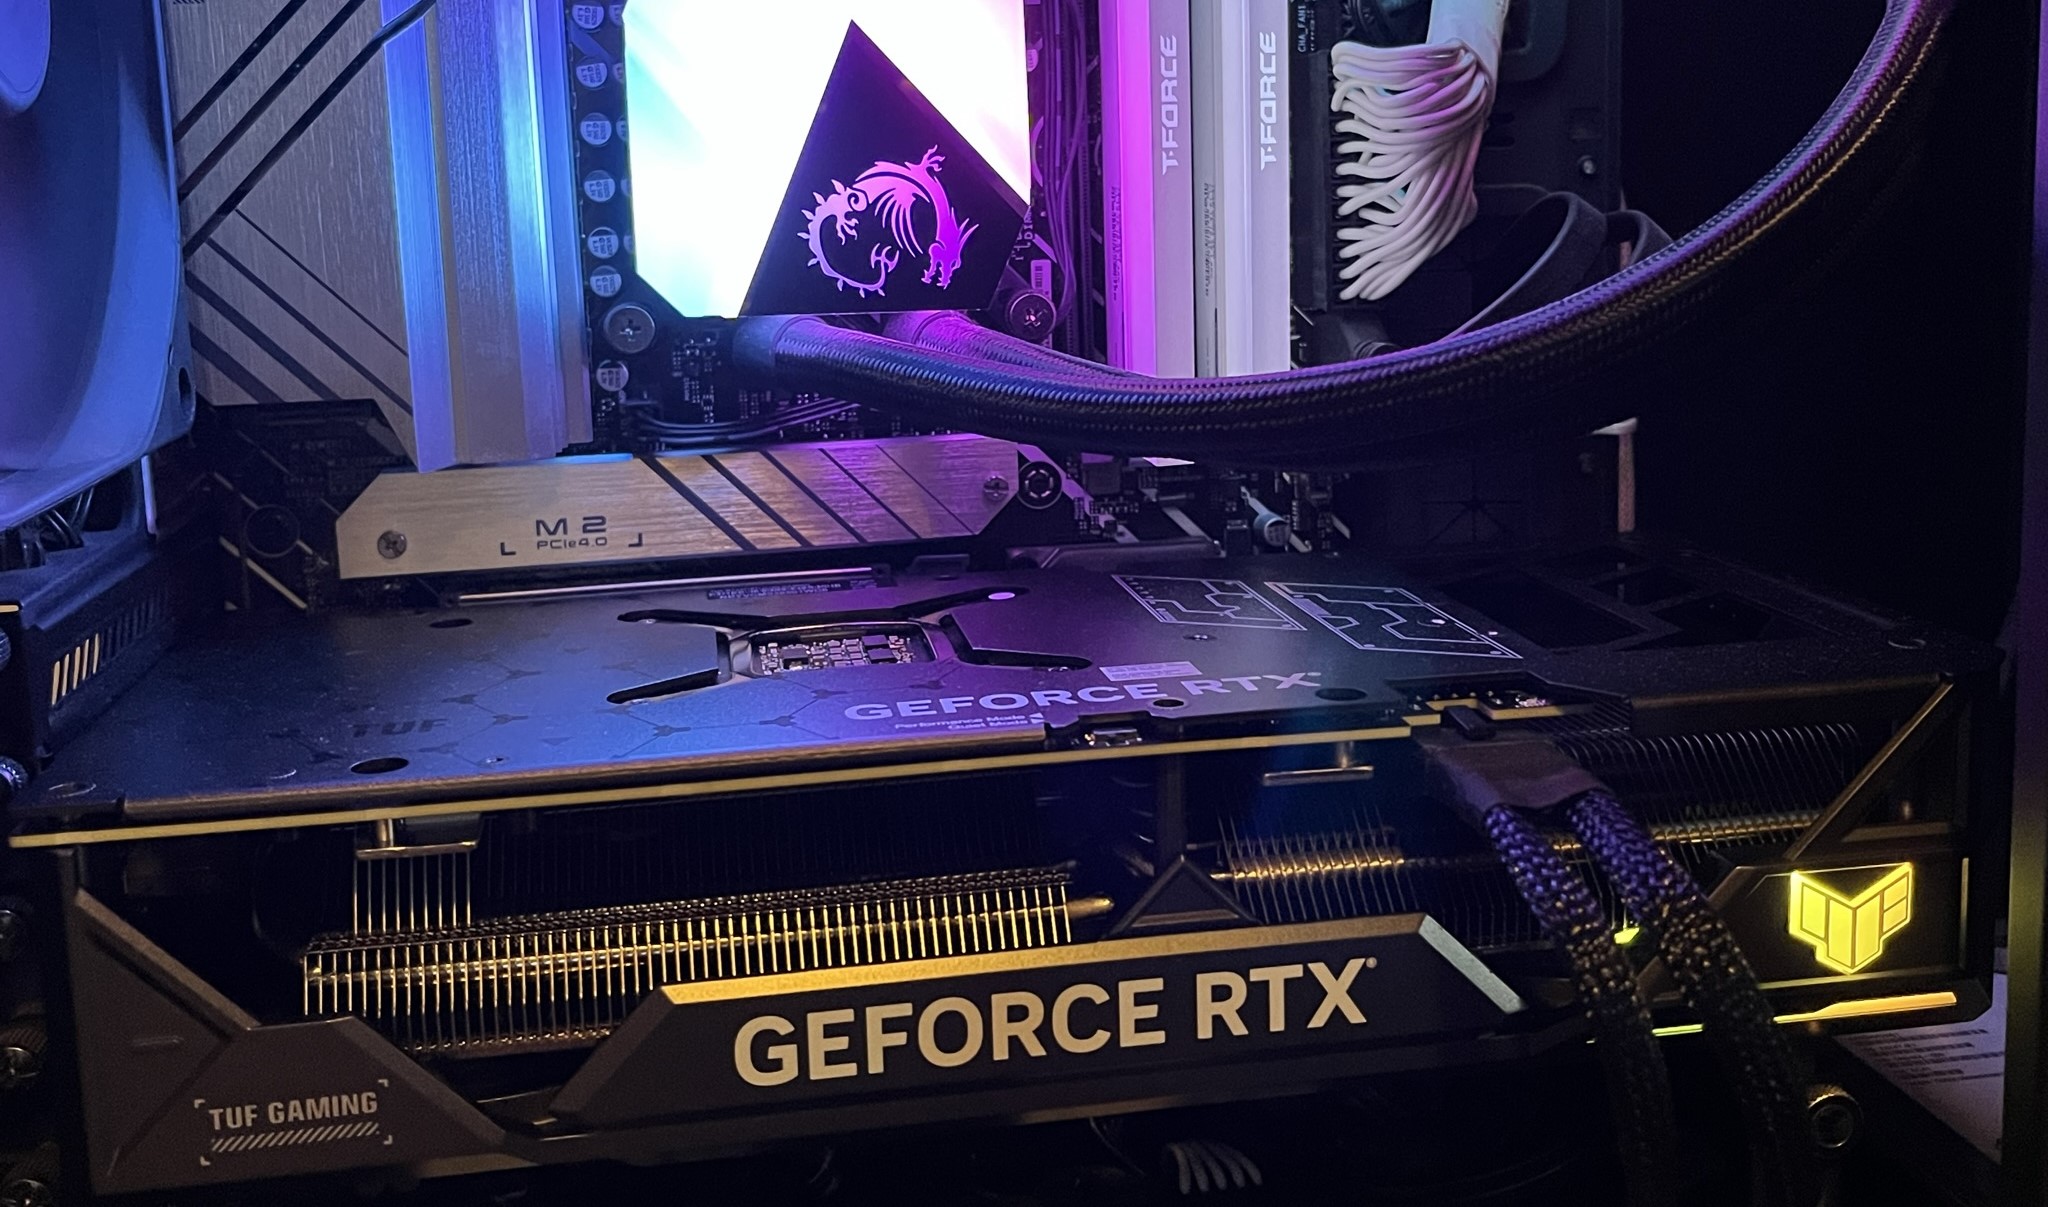
The RTX 4070 Ti TUF GAMING OC looks beautiful inside a case. We liked that only the TUF logo has RGB lighting to match our RGB-lite gaming rig.
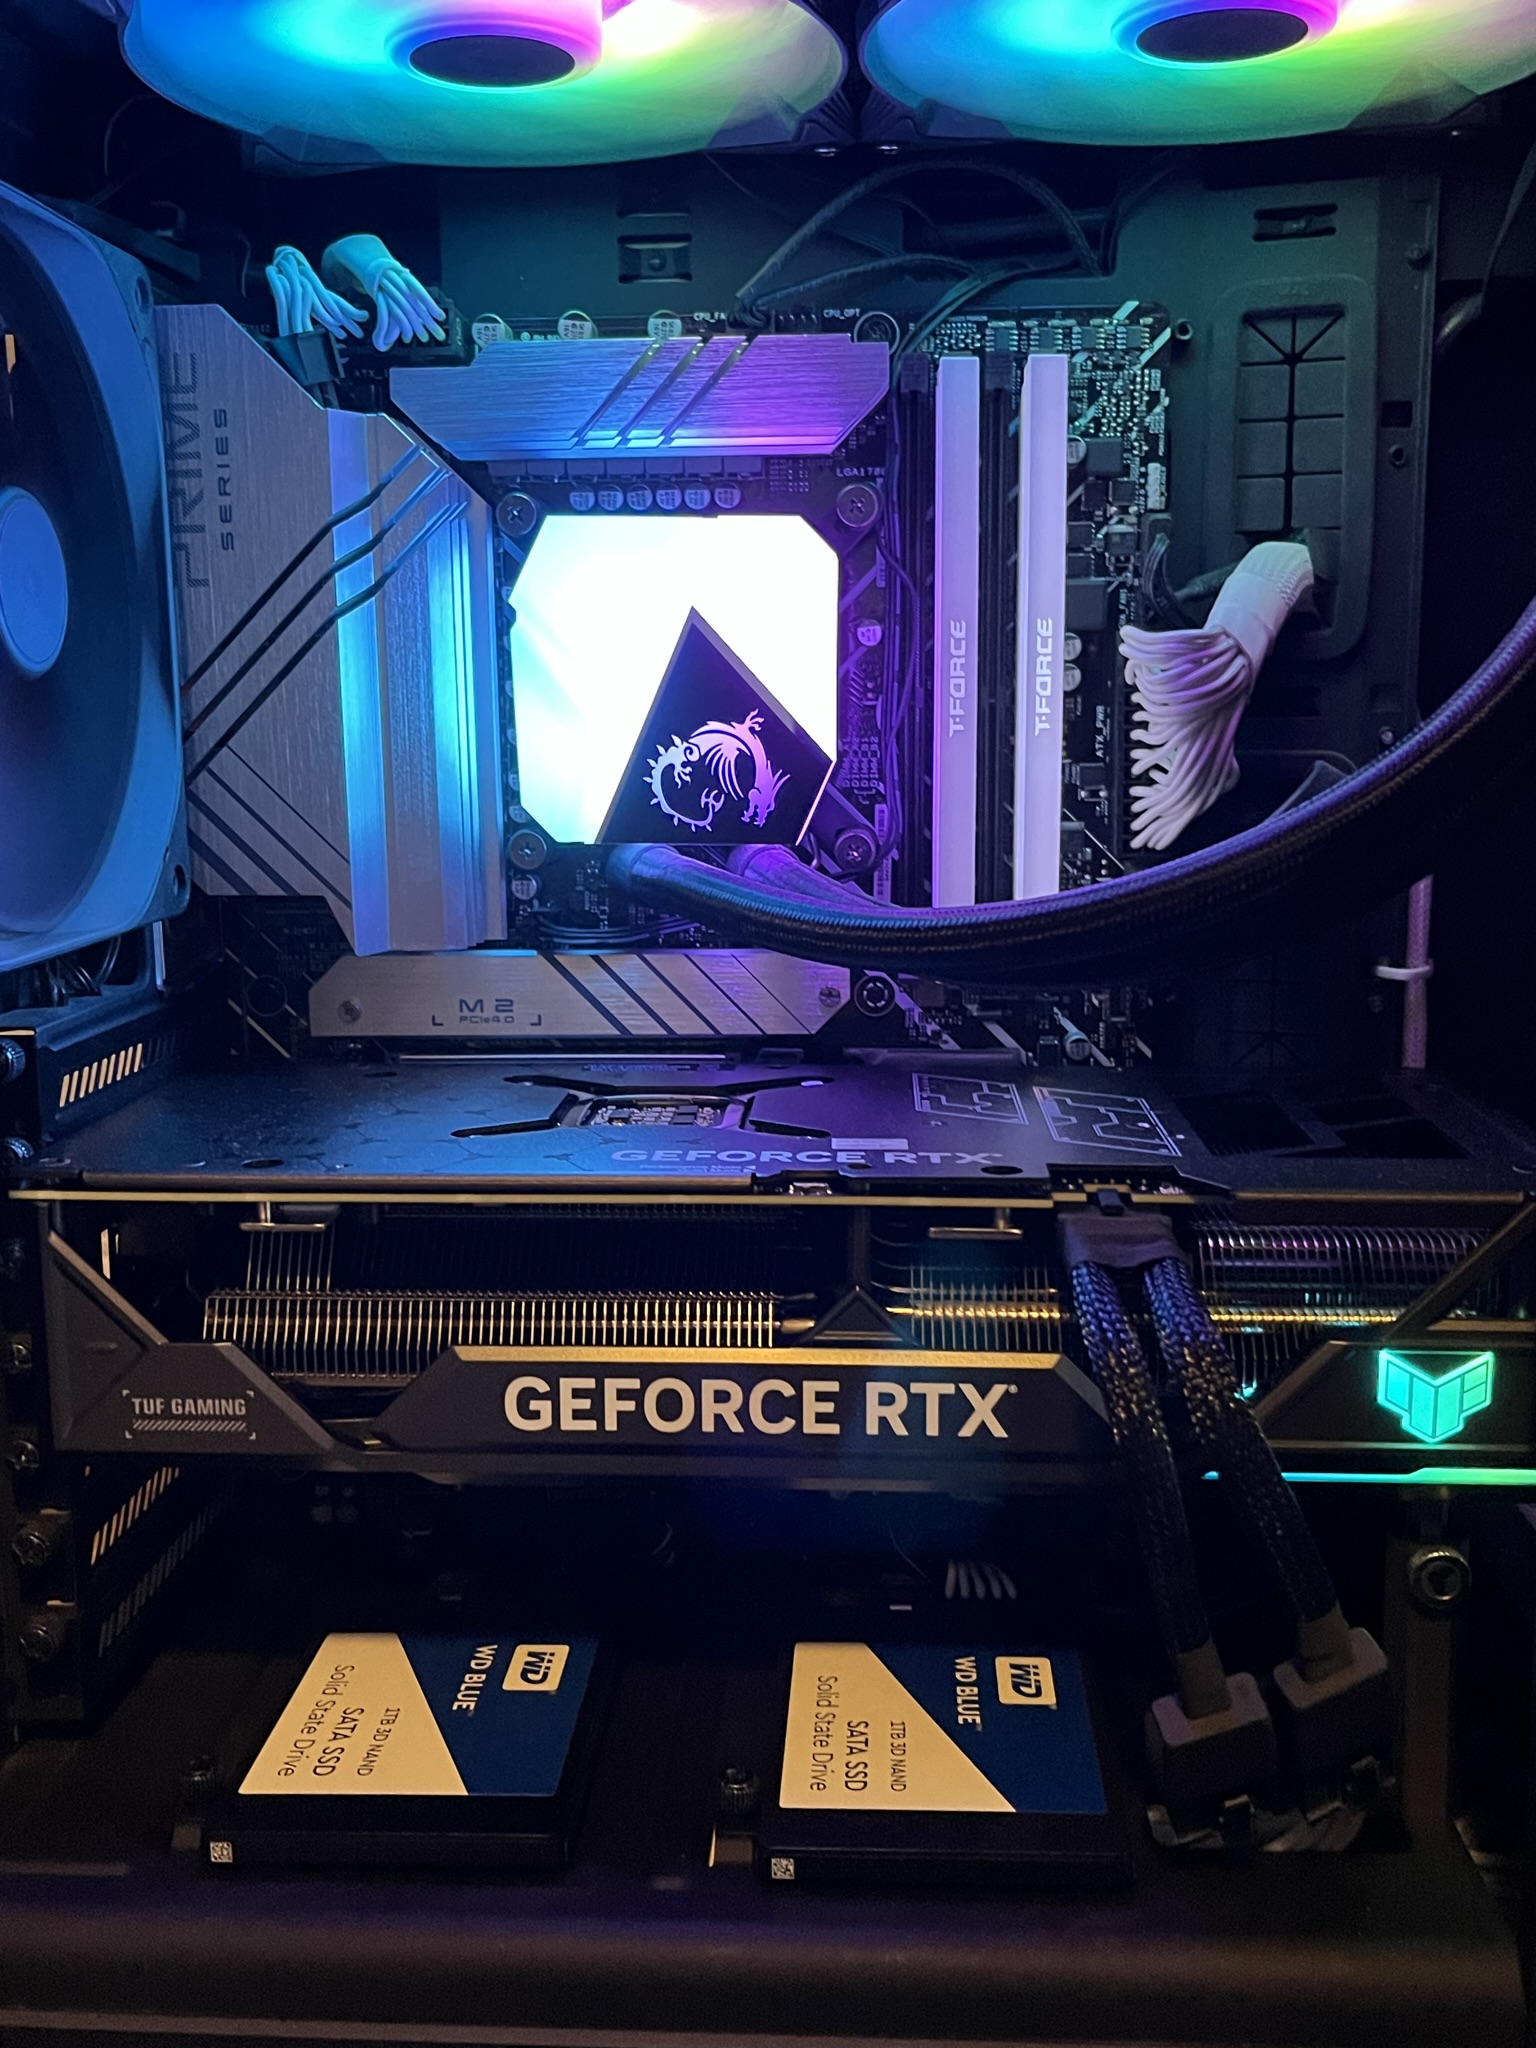
The specifications look promising, and the card, itself, looks solid and quality.
Next is our testing configuration, methodology, and more.
Test Configuration
Benching Methodology
Test Configuration – Hardware
- 12th Gen Intel Core i9-12900K (Hyper-Threading/Turbo boost on; stock settings)
- ASUS PRIME Z690-P D4 motherboard (Intel Z690 chipset, v.1008 BIOS)
- T-FORCE XTREEM ARGB WHITE 32GB DDR4 (2×16GB, dual-channel at 3600 MHz CL14 XMP), supplied by TeamGroup
- ASUS TUF GAMING GeForce RTX 4070 Ti OC Edition 12GB, stock clocks; supplied by Nvidia
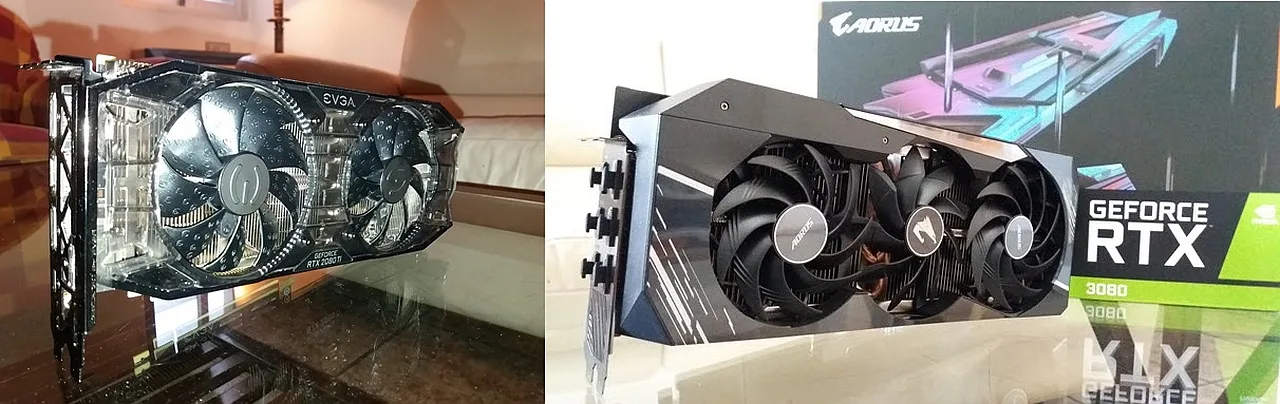
- Gigabyte AORUS GeForce RTX 3080 MASTER 10GB (rev. 1.0); v.F4 VBIOS, stock clocks
- EVGA GeForce RTX 2080 Ti BLACK EDITION GAMING 11GB, stock clocks
- 1 x Samsung 500GB SSD 960 EVO NVMe M.2
- 2 x WD Blue 1TB SATA SSD
- 1 x TeamGroup MP33 M.2 PCIe 1TB SSD
- Corsair RM850x, 850W 80PLUS Gold power supply unit
- ASUS TUF Gaming VG289Q 28? IPS UltraHD (3840×2160) 60Hz 5ms FreeSync Monitor for testing games at 2160p resolution.
- ASUS ROG Swift PG279Q 27? IPS QuadHD (2560 x 1440) 165Hz 4ms G-Sync Monitor for testing games at 1440p resolution.
Test Configuration – Software
- NVIDIA GeForce 527.62 press drivers; ‘Prefer maximum performance’ (on a per-game profile basis); Shader Cache Size ‘Unlimited’ (globally); fixed refresh rate (globally).
- We enable Resizable BAR (disabled with RTX 2080 Ti due to the lack of full support).
- ‘V-Sync application controlled’ in the control panel; V-Sync off in-game.
- We note and specify the main in-game display, graphics, AA, and scaling settings in the performance summary charts.
- Windows 11 64-bit Pro edition, latest updates v22H2, High-performance power plan, HAGS & Game Mode are enabled, Game DVR & Game Bar features off, Control Flow Guard (CFG) off on a per-game basis, Hypervisor and Virtualization-based security are disabled.
- We do not install GIGABYTE or ASUS tools.
- Latest DirectX
- All 19 games are patched to their latest versions at the time of publication.
- 3DMark suite and UNIGINE Superposition benchmark, the latest version
- Basemark GPU benchmark, v.1.2.3
- UNIGINE Superposition, v.1.1
- CapFrameX (CX), the latest version
- RivaTuner Statistics Server (RTSS), the latest version
- FrameView, the latest version
- Display Driver Uninstaller (DDU), the latest version; always uninstall drivers using DDU in safe mode, clean, and restart.
-
ISLC (Purge Standby List) before each benchmark.
GeForce Driver Suite-related
- We use DCH Game Ready drivers.
- The display driver is installed.
- We install the latest version of PhysX.
Hybrid & Non-Synthetic Tests-related
- Single run per test.
Game Benchmarks-related
- We use the corresponding built-in or custom benchmark sequence.
Frametimes Capture & Analysis tool-related
- We use CapFrameX for capturing frametimes and analyzing the relevant performance numbers obtained from each recorded built-in or custom benchmark sequence.
- We use FrameView for capturing purposes only when DLSS 3 is enabled for maximum reliability.
- We always perform consecutive runs until detecting three usable runs (no outliers) that can be aggregated by CapFrameX using the following method:
- Aggregate excluding outliers:
- Outlier metric: Third, P0.2 (0.2% FPS percentile).
- Outlier percentage: 3% (the % the FPS of an entry can differ from the median of all entries before counting as an outlier).
- Aggregate excluding outliers:
- We compare and evaluate the results and aggregated records in terms of percentages of gain/loss and set the following thresholds to consider a % value as significant (not within the margin of error) for our benchmarking purposes:
- Score/Avg FPS > 3% when valuing hybrid and non-synthetic benchmarks;
- Avg FPS > 3% when evaluating raw performance.
Benchmark Suite: 19 Games, 6 Hybrid & 3 Non-Synthetic Tests
PC Games
DX11 Games
- Days Gone (DX11)
- God of War (DX11)
- Total War: Warhammer III (DX11)
DX12 Games
- A Plague Tale: Requiem (DX12)
- Assassin’s Creed: Valhalla (DX12)
- Call of Duty: Vanguard (DX12)
- Cyberpunk 2077 v.1.61 (DX12)
- F1 2021 (DX12)
- Far Cry 6 (DX12)
- Forza Horizon 5 (DX12)
- Hitman 3 (DX12)
- Horizon Zero Dawn (DX12)
- Metro Exodus PC Enhanced Edition (DX12)
- Spider-Man: Remastered (DX12)
- The Callisto Protocol (DX12)
- The Witcher 3: Wild Hunt v.4.00 (DX12)
Vulkan Games
- DOOM Eternal (VK)
- Quake 2 RTX (VK; v.1.6.0)
- Wolfenstein: Youngblood (VK)
Synthetic Tests
- AIDA64 GPGPU benchmarks
- Blender 3.4.0 benchmark
- Geekbench 5
- Sandra 2021 GPGPU Benchmarks
Hybrid Tests (3DMark)
- DirectX Raytracing feature test
- Fire Strike Extreme
- Fire Strike Ultra
- Port Royal
- Time Spy
- Time Spy Extreme
Non-Synthetic Tests
- Basemark GPU
- GPUScore: Relic of Life
- UNIGINE Superposition
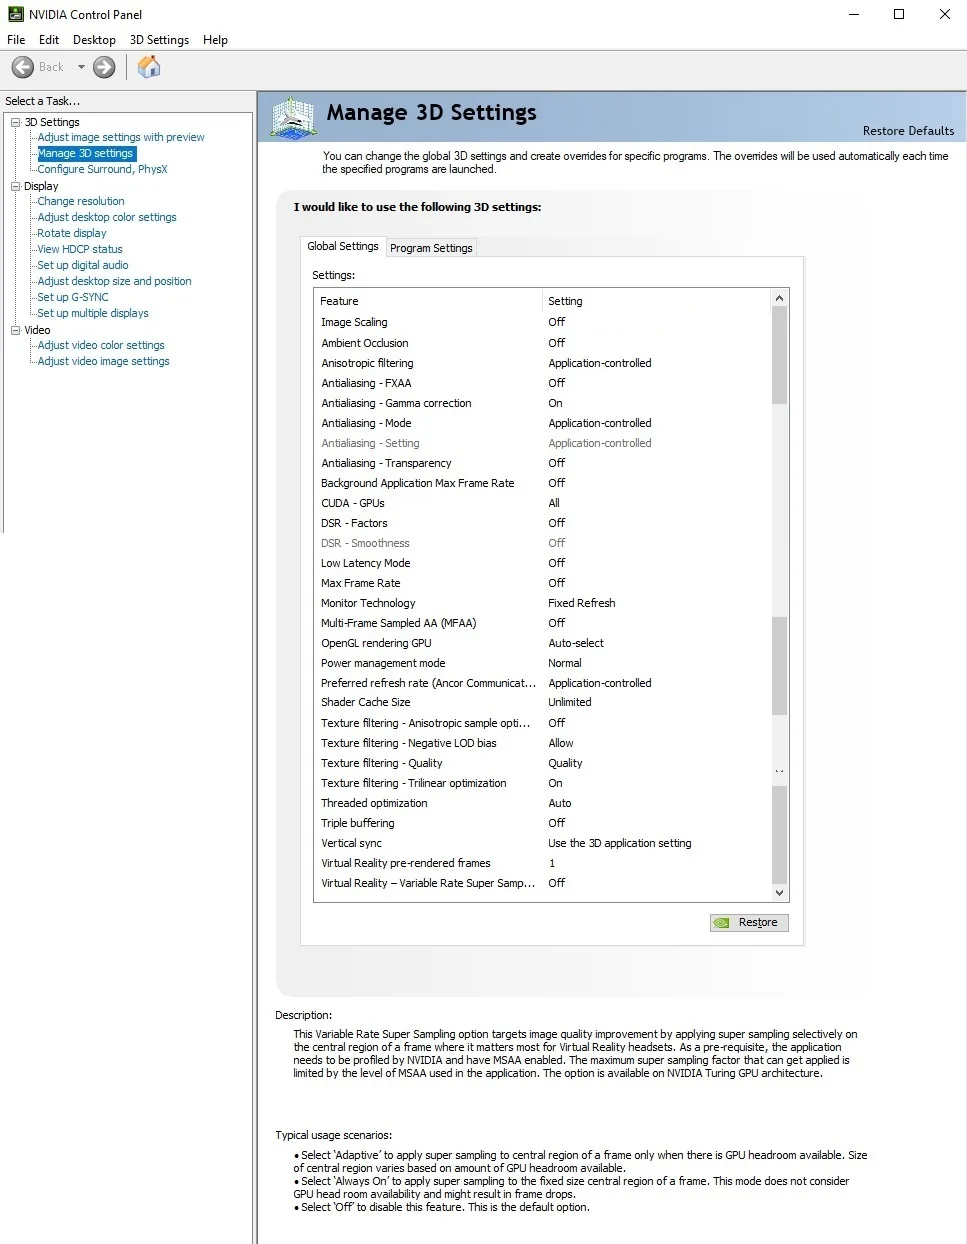
NVIDIA Control Panel settings
Here are the global NVIDIA Control Panel settings:

Noise, Temperatures, and Power Consumption
Unfortunately, we did not have time to check out the overclocking potential, but temperatures were slightly higher than the AORUS RTX 3080 MASTER. So BTR plans to follow this review up with a VR review – conducted by Mark Poppin, BTR’s PC VR specialist – and an overclocking and creative and pro apps performance analysis – done by the author of the current article.
The RTX 4070 Ti TUF GAMING OC is quiet, and its fans never spin up, even under a heavy or full load, to be irritating or noticeable. It is as silent as the AORUS RTX 3080 MASTER. This model also supports a 0RPM fan mode on idle or light load conditions.
This card is factory clocked 120MHz higher than the reference version at 2610MHz using both BIOS modes. According to its specifications, the RTX 4070 Ti TUF GAMING OC boost can clock up to 2730MHz out of the box. From our testing, we generally see it boosting even higher and typically settling in 2820MHz with peaks above 2850MHz under full or heavy load conditions.
Below is our thermal and approximate power consumption analysis on idle (Windows desktop, no user interactions) and full-load (UNIGINE Superposition Stress Test, 2160p resolution, highest settings, 10 minutes).
Idle conditions
On idle conditions, we see a maximum GPU clock of 210MHz, a Memory Clock of 50.6MHz max, a GPU temperature of 23 Celsius degrees (room temp at 19 Celsius degrees) max, an average board power draw of approximately 9.0W, average power consumption of 3%, and a maximum GPU voltage of 0.88V.
Full-load conditions
Under full-load conditions, the RTX 4070 Ti TUF GAMING OC peaked at a maximum clock of 2880MHz, but after some minutes running the Superposition stress test, it slowed down progressively, step by step, and stabilized at 2820MHz when GPU temp stays in the mid-60s C. Also, the maximum memory clock was 1312.7MHz, the GPU peaked at 65.50 Celsius degrees max (room temp at 21 Celsius degrees), the approximate board power draw was 272.8W max, a maximum power consumption peak of 95.7%, and the GPU voltage reached a maximum of 1.10V.
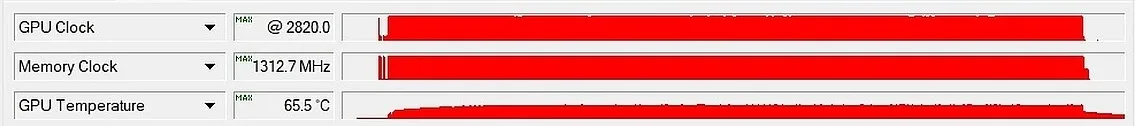

Finally, the reported PerfCap reason (performance limited by different factors) during our full-load GPU stress test was either the intended VBIOS power or reliability limits.
So taking into account all the above, we consider that our ASUS TUF GAMING RTX 4070 Ti OC Edition sample works great and as intended in terms of frequencies, noise level, temperature, and power consumption. Overall the RTX 4070 Ti TUF GAMING OC is quiet, well-cooled, and power efficient.
Let’s head to the performance charts to compare the graphics performance of the RTX 4070 Ti TUF GAMING OC with two other graphics cards; an RTX 3080, based on the Ampere architecture, and an RTX 2080 Ti, based on the Turing architecture.
Gaming Performance Charts
DirectX 11 Game Performance Charts
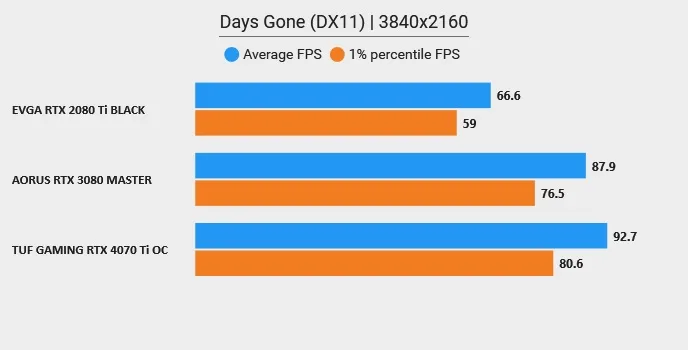
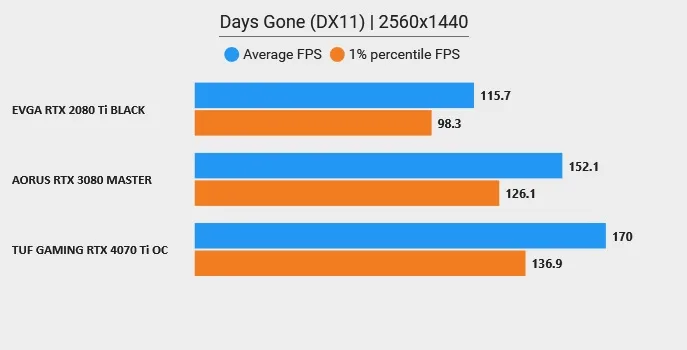
Days Gone (DX11)
2160p – Avg FPS & P1 FPS – Higher is better
1440p – Avg FPS & P1 FPS – Higher is better
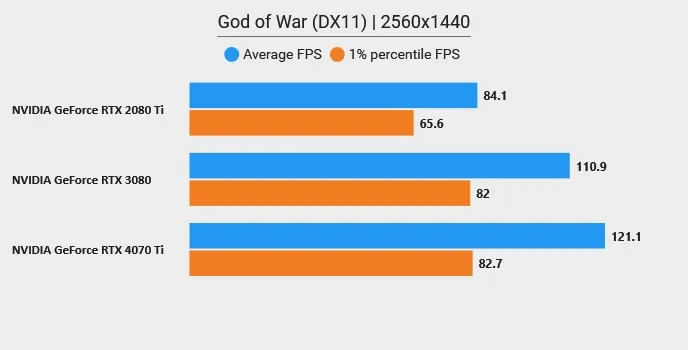
God of War (DX11)
2160p – Avg FPS & P1 FPS – Higher is better
 1440p – Avg FPS & P1 FPS – Higher is better
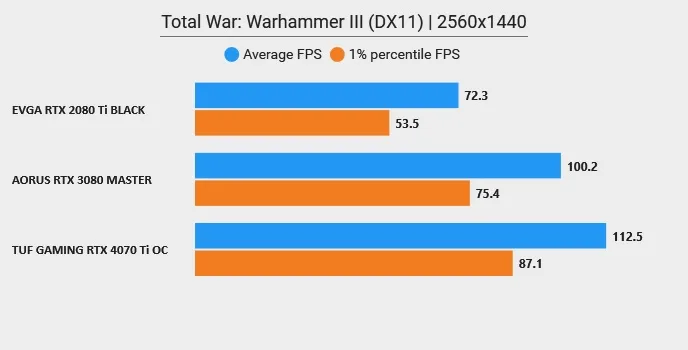
Total War: Warhammer III (DX11)
2160p – Avg FPS & P1 FPS – Higher is better
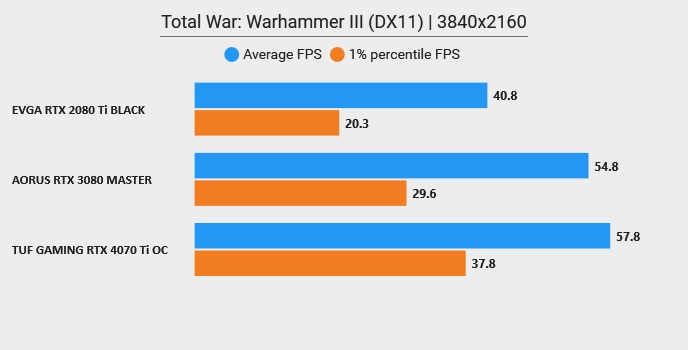
1440p – Avg FPS & P1 FPS – Higher is better
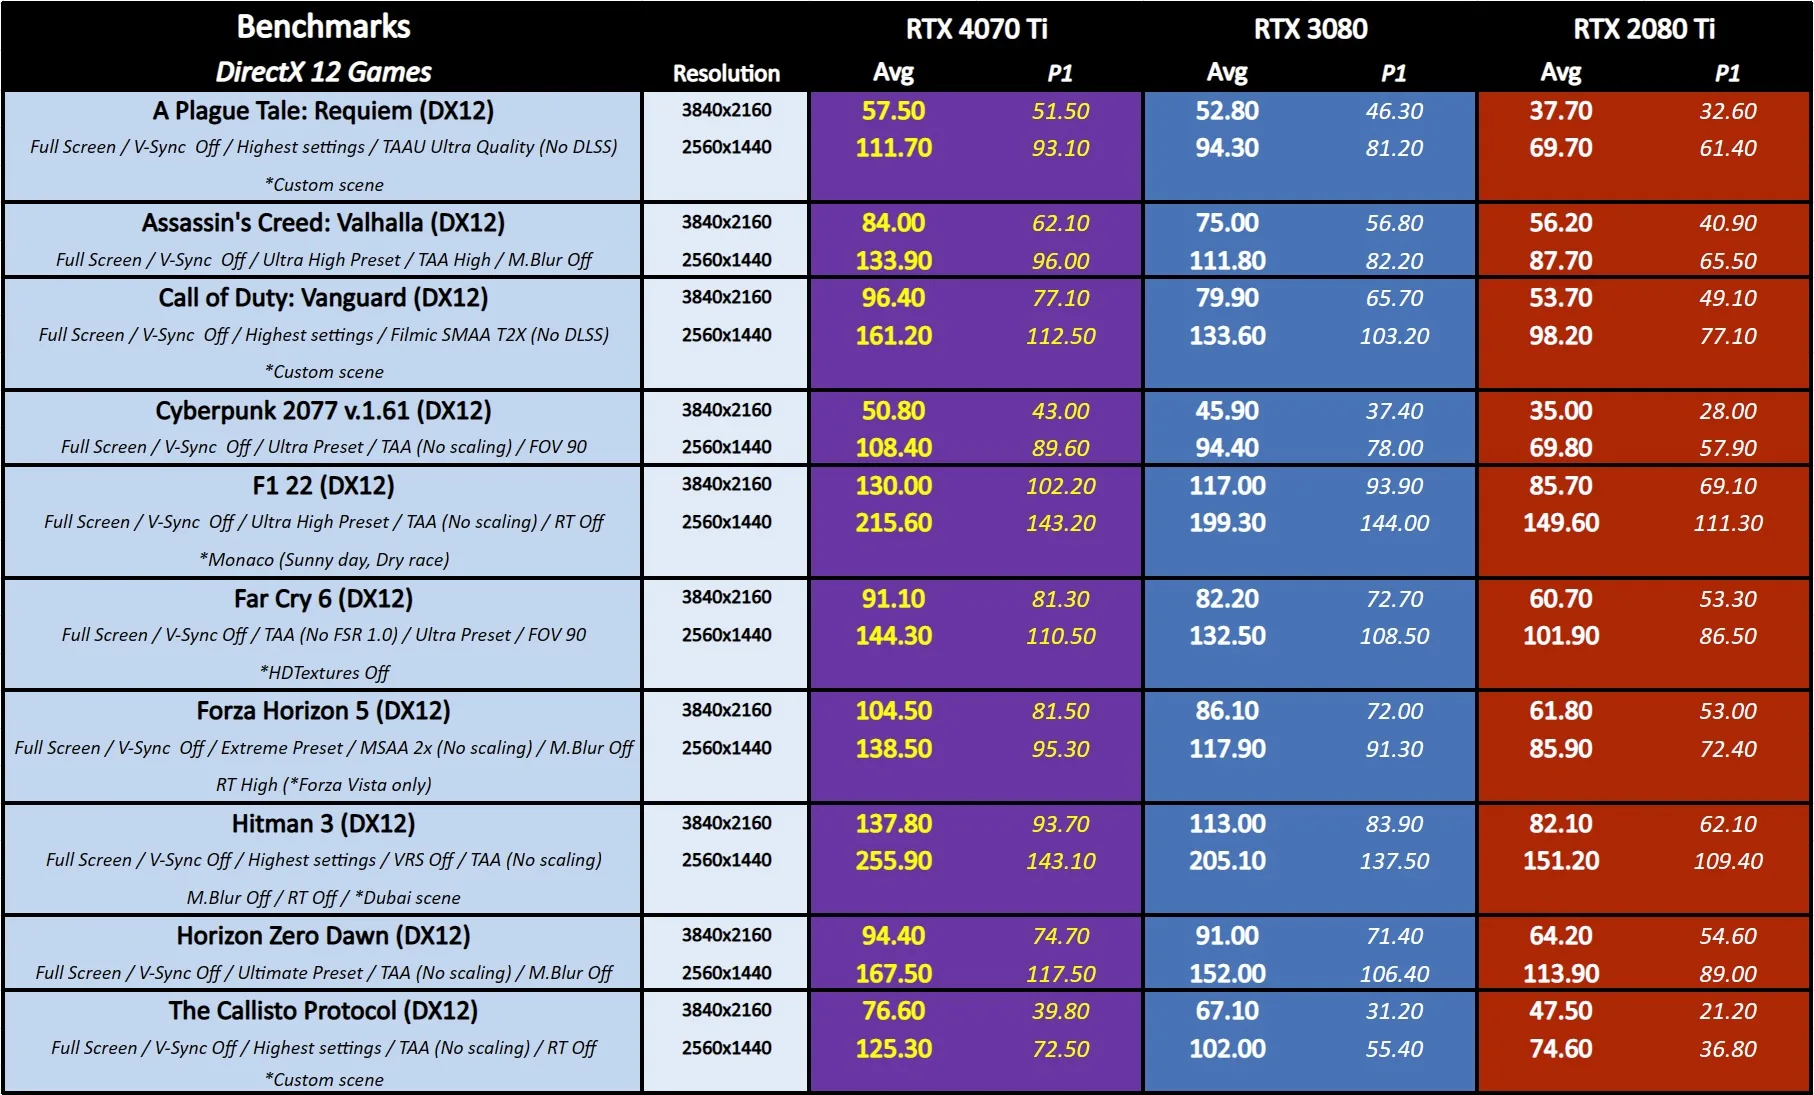
DirectX 12 Game Performance Charts
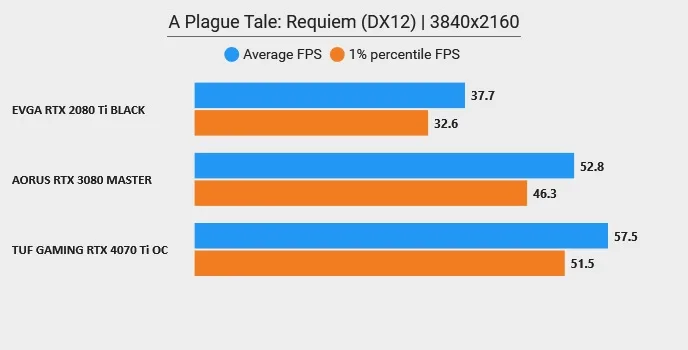
A Plague Tale: Requiem (DX12)
2160p – Avg FPS & P1 FPS – Higher is better
1440p – Avg FPS & P1 FPS – Higher is better

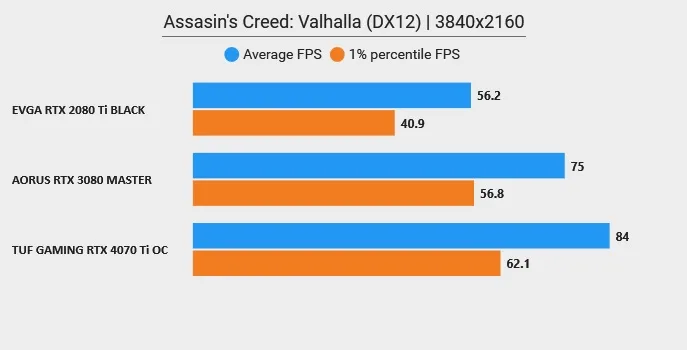
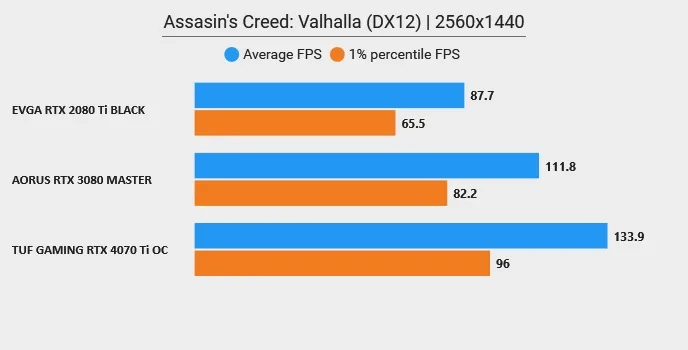
Assassin’s Creed: Valhalla (DX12)
2160p – Avg FPS & P1 FPS – Higher is better
1440p – Avg FPS & P1 FPS – Higher is better
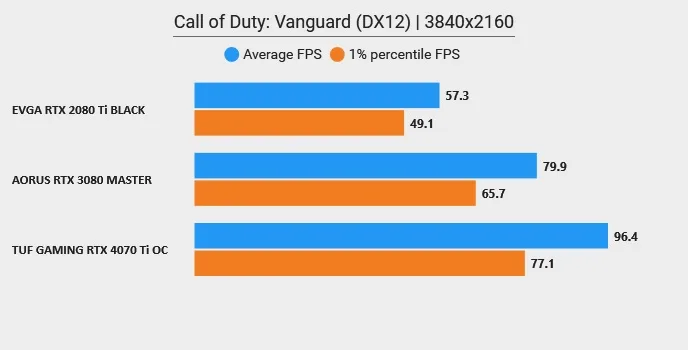
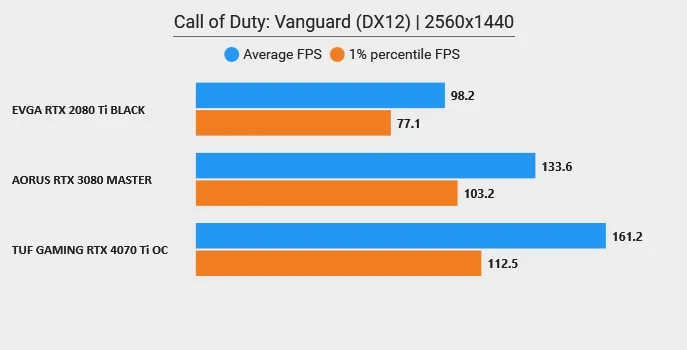
Call of Duty: Vanguard (DX12)
2160p – Avg FPS & P1 FPS – Higher is better
1440p – Avg FPS & P1 FPS – Higher is better
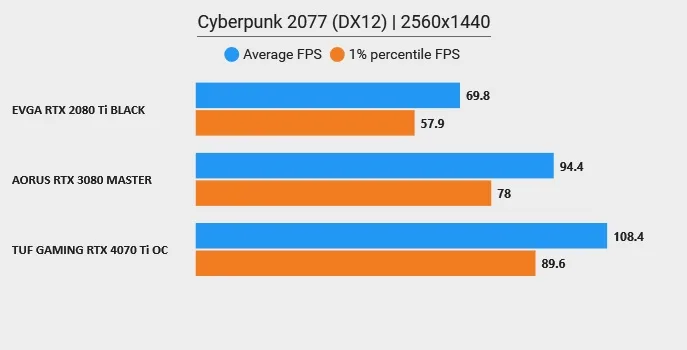
Cyberpunk 2077 (DX12) v.1.61
2160p – Avg FPS & P1 FPS – Higher is better

1440p – Avg FPS & P1 FPS – Higher is better
F1 22 (DX12)
2160p – Avg FPS & P1 FPS – Higher is better

1440p – Avg FPS & P1 FPS – Higher is better

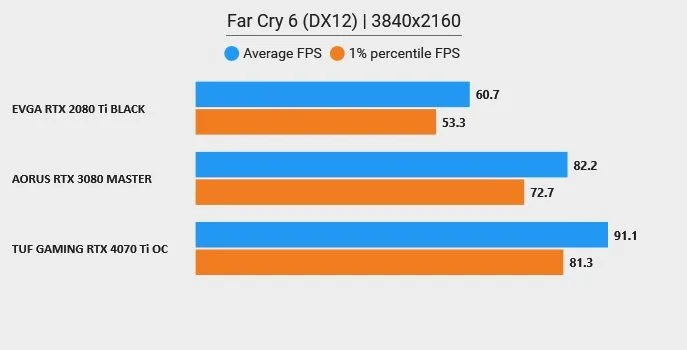
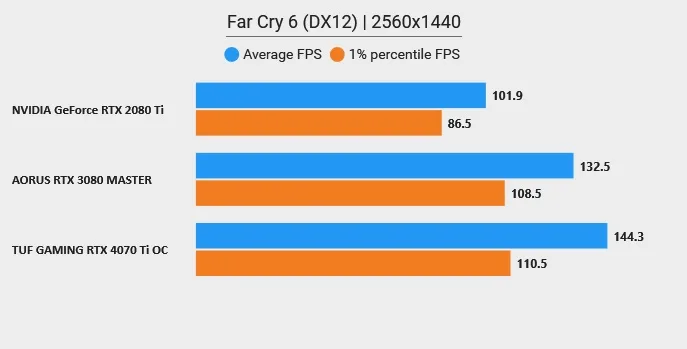
Far Cry 6 (DX12)
2160p – Avg FPS & P1 FPS – Higher is better
1440p – Avg FPS & P1 FPS – Higher is better
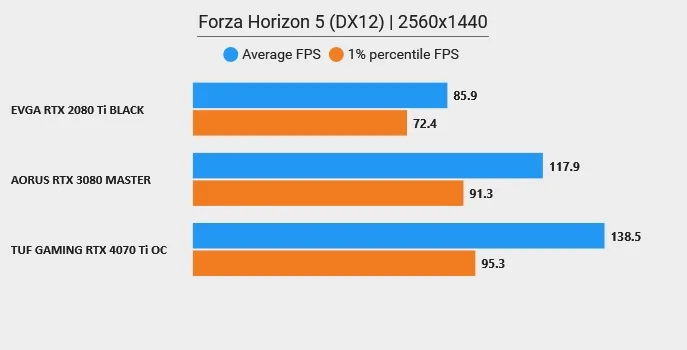
 Forza Horizon 5 (DX12)
2160p – Avg FPS & P1 FPS – Higher is better

1440p – Avg FPS & P1 FPS – Higher is better
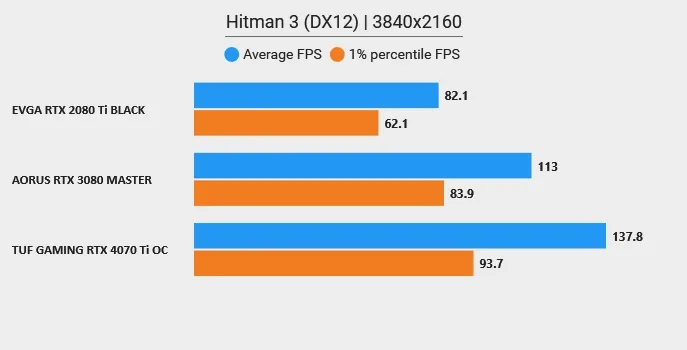
Hitman 3 (DX12)
2160p – Avg FPS & P1 FPS – Higher is better
1440p – Avg FPS & P1 FPS – Higher is better

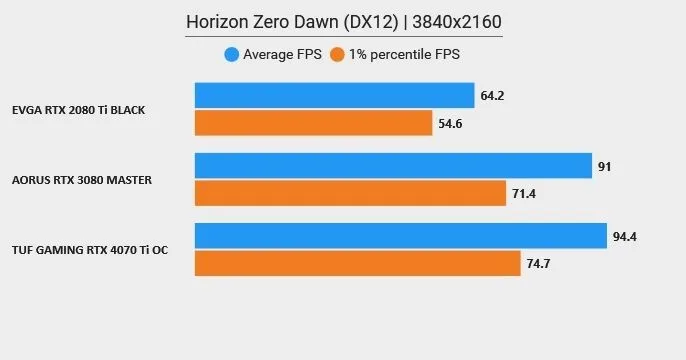
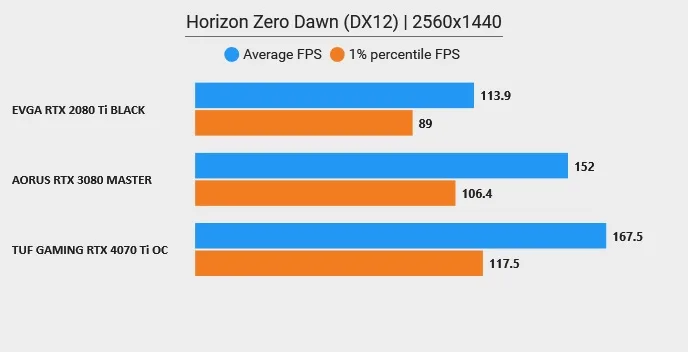
Horizon Zero Dawn (DX12)
2160p – Avg FPS & P1 FPS – Higher is better
1440p – Avg FPS & P1 FPS – Higher is better
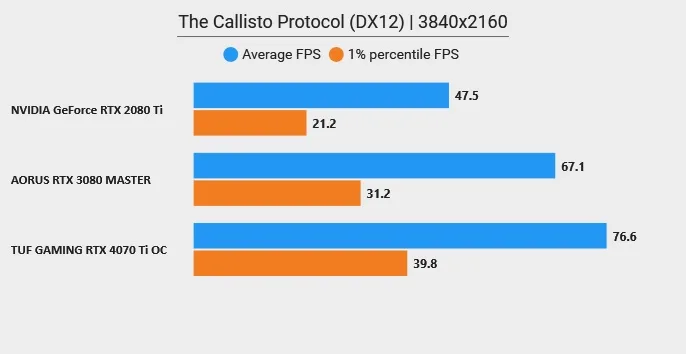
The Callisto Protocol (DX12)
2160p – Avg FPS & P1 FPS – Higher is better
1440p – Avg FPS & P1 FPS – Higher is better

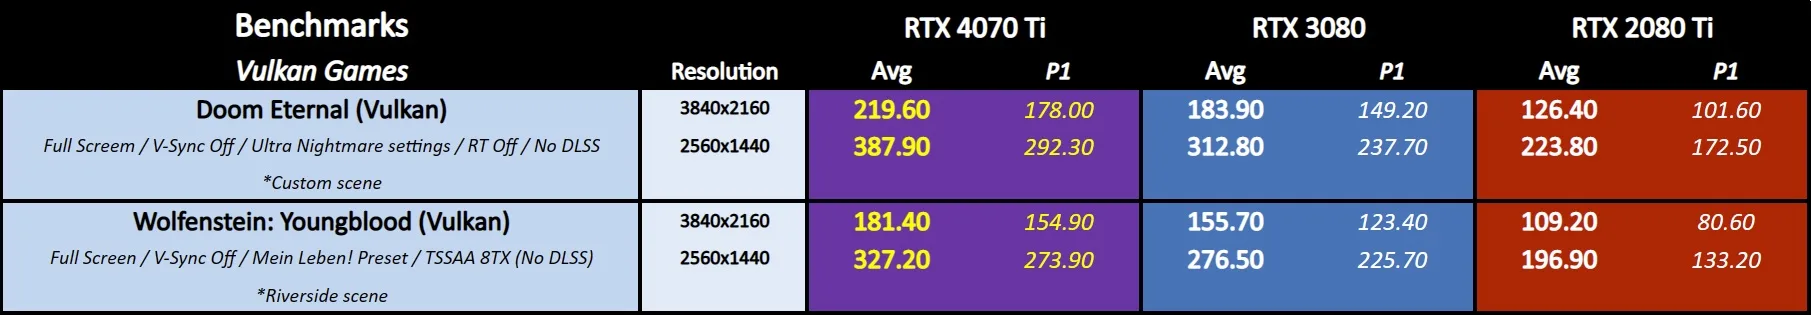
Vulkan Game Performance Charts
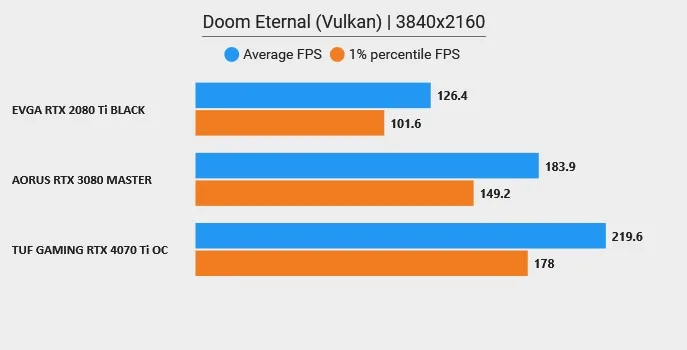
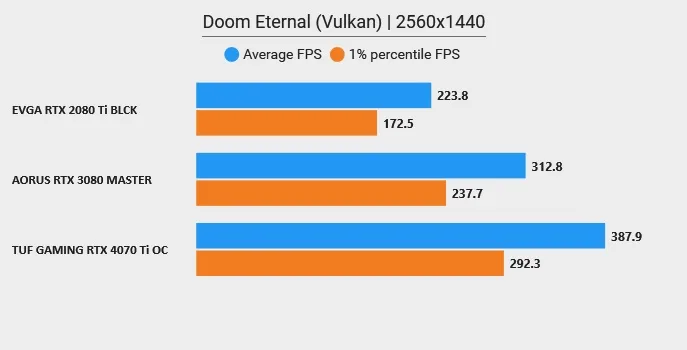
Doom Eternal (Vulkan)
2160p – Avg FPS & P1 FPS – Higher is better
1440p – Avg FPS & P1 FPS – Higher is better
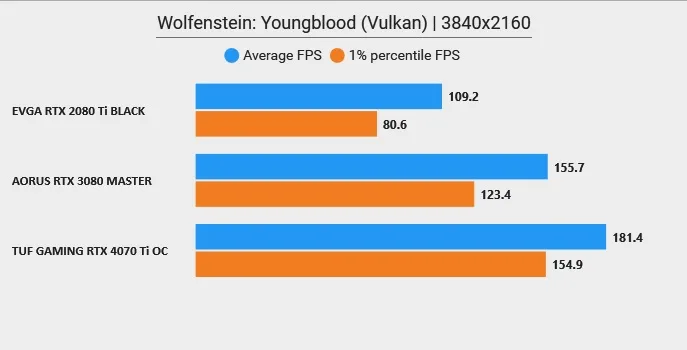
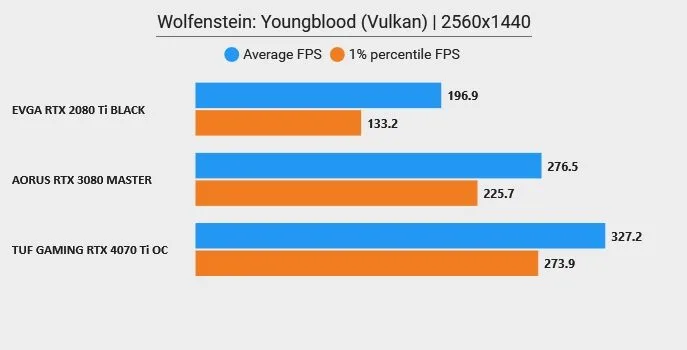
Wolfenstein: Youngblood (Vulkan)
2160p – Avg FPS & P1 FPS – Higher is better
1440p – Avg FPS & P1 FPS – Higher is better
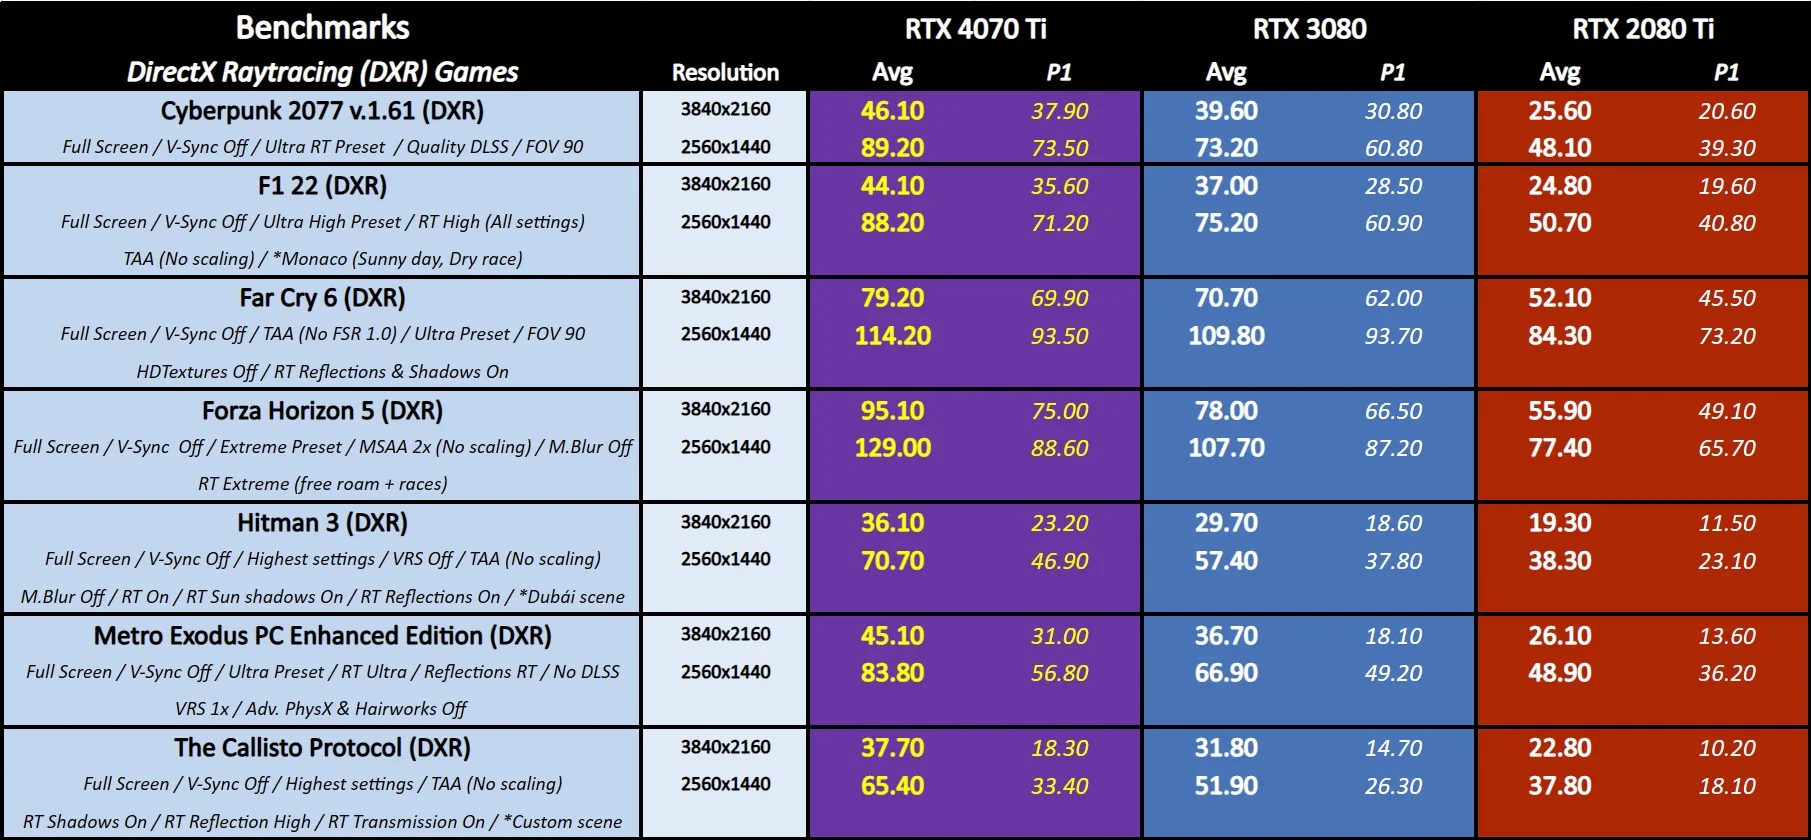
DirectX Raytracing Game Performance Charts
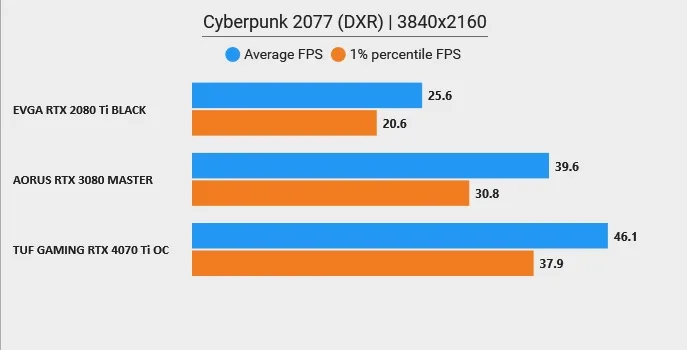
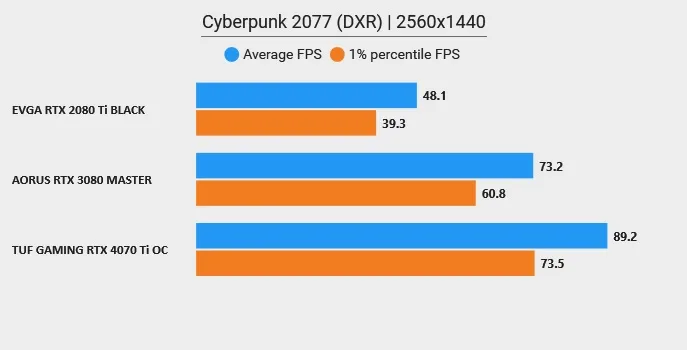
Cyberpunk 2077 (DXR)
2160p – Avg FPS & P1 FPS – Higher is better
1440p – Avg FPS & P1 FPS – Higher is better
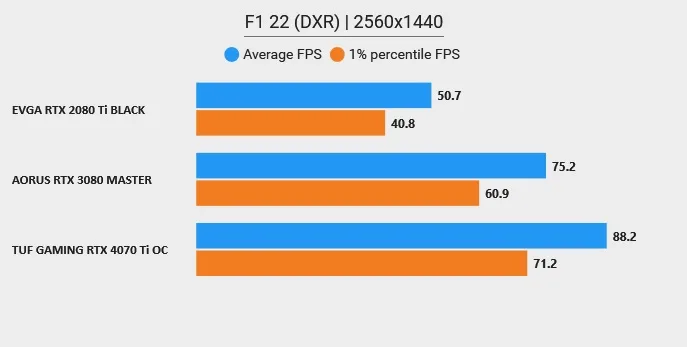
F1 22 (DXR)
2160p – Avg FPS & P1 FPS – Higher is better

1440p – Avg FPS & P1 FPS – Higher is better
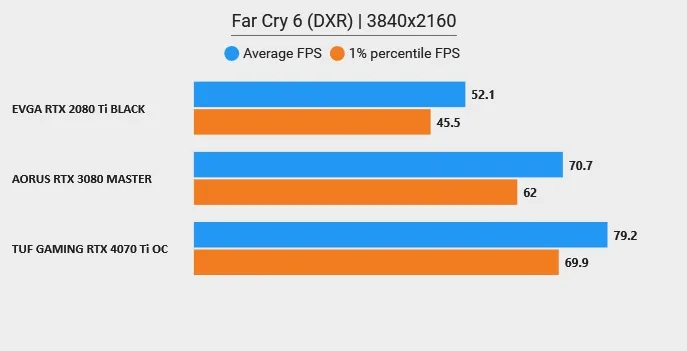
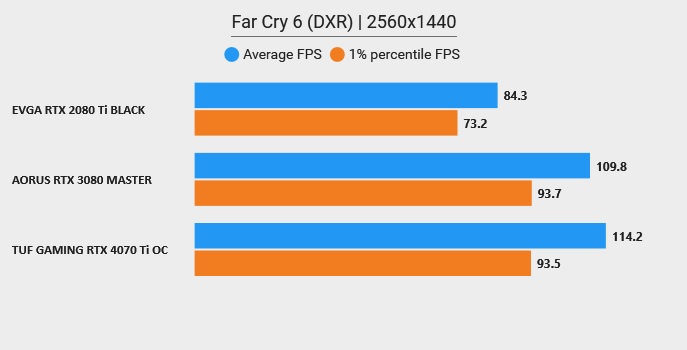
Far Cry 6 (DXR)
2160p – Avg FPS & P1 FPS – Higher is better
1440p – Avg FPS & P1 FPS – Higher is better
Forza Horizon 5 (DXR)
2160p – Avg FPS & P1 FPS – Higher is better

1440p – Avg FPS & P1 FPS – Higher is better

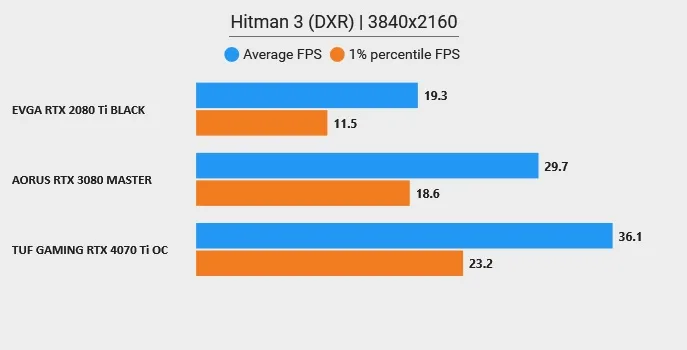
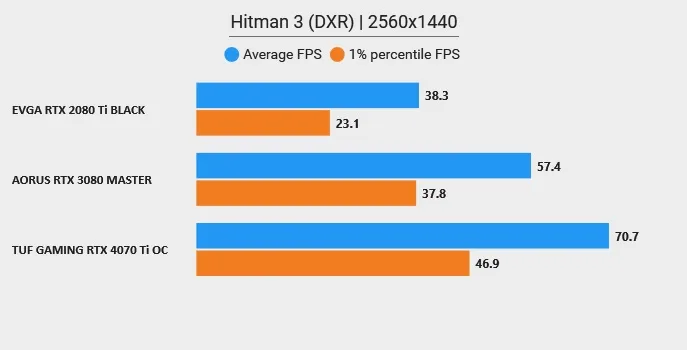
Hitman 3 (DXR)
2160p – Avg FPS & P1 FPS – Higher is better
1440p – Avg FPS & P1 FPS – Higher is better
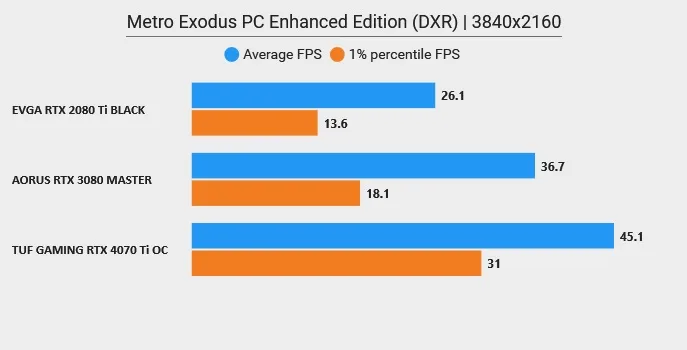
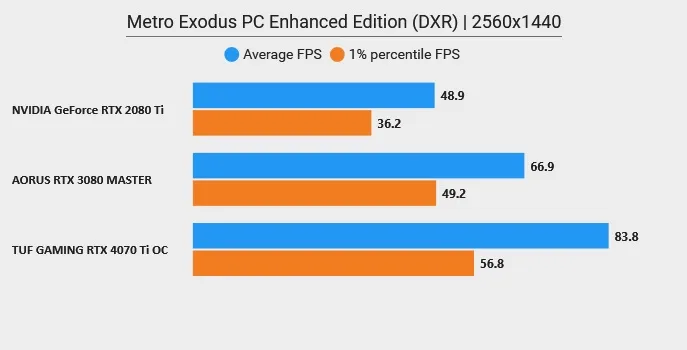
Metro Exodus PC Enhanced Edition (DXR)
2160p – Avg FPS & P1 FPS – Higher is better
1440p – Avg FPS & P1 FPS – Higher is better
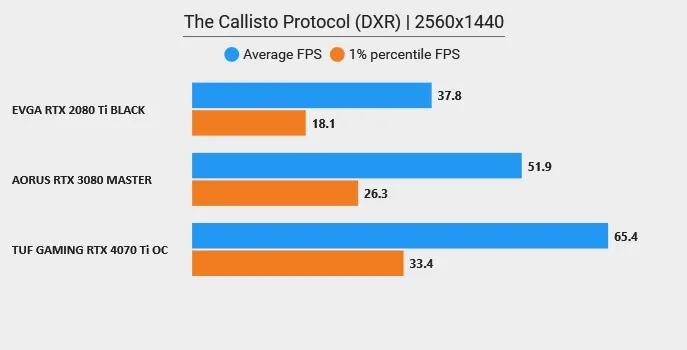
The Callisto Protocol (DXR)
2160p – Avg FPS & P1 FPS – Higher is better

1440p – Avg FPS & P1 FPS – Higher is better
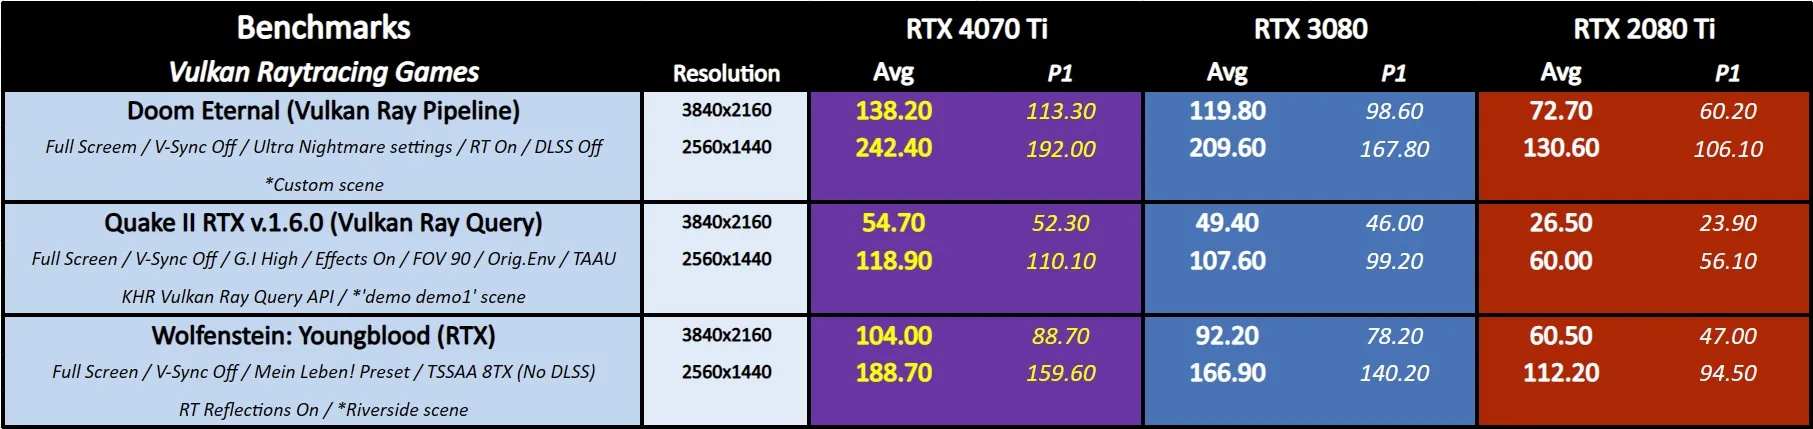
Vulkan Raytracing Game Performance Charts
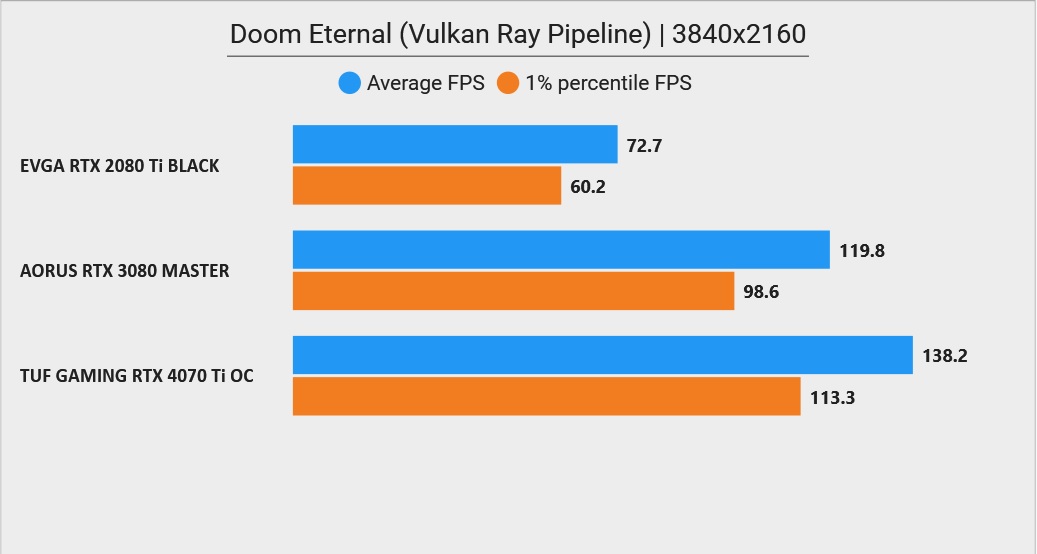
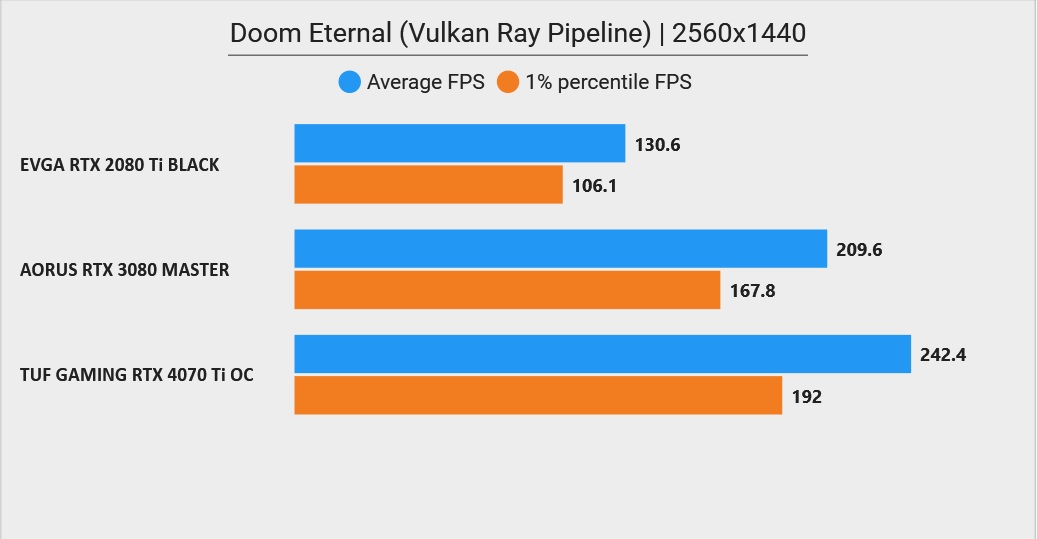
Doom Eternal (Vulkan Ray Pipeline)
2160p – Avg FPS & P1 FPS – Higher is better
1440p – Avg FPS & P1 FPS – Higher is better
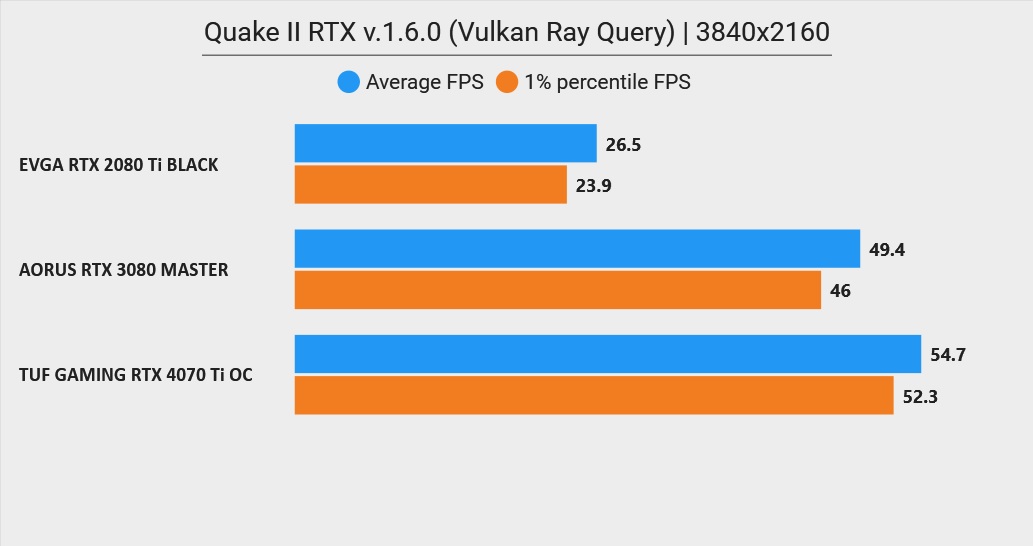
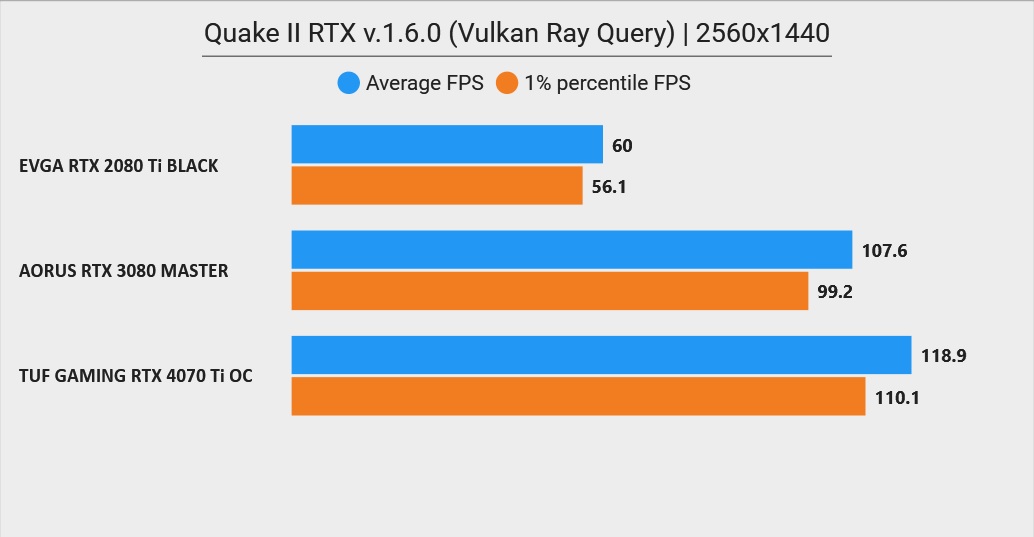
Quake II RTX v.1.6.0 (Vulkan Ray Query)
2160p – Avg FPS & P1 FPS – Higher is better
1440p – Avg FPS & P1 FPS – Higher is better
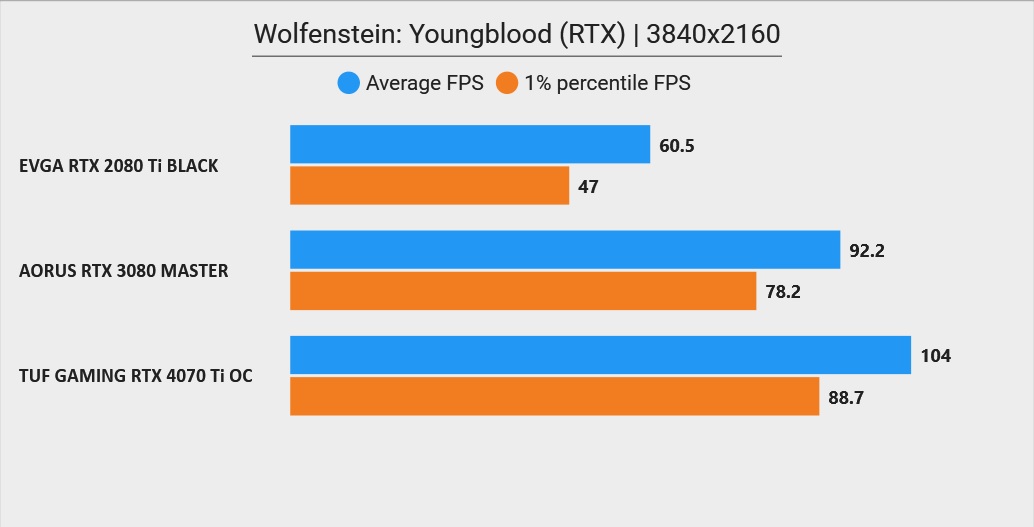
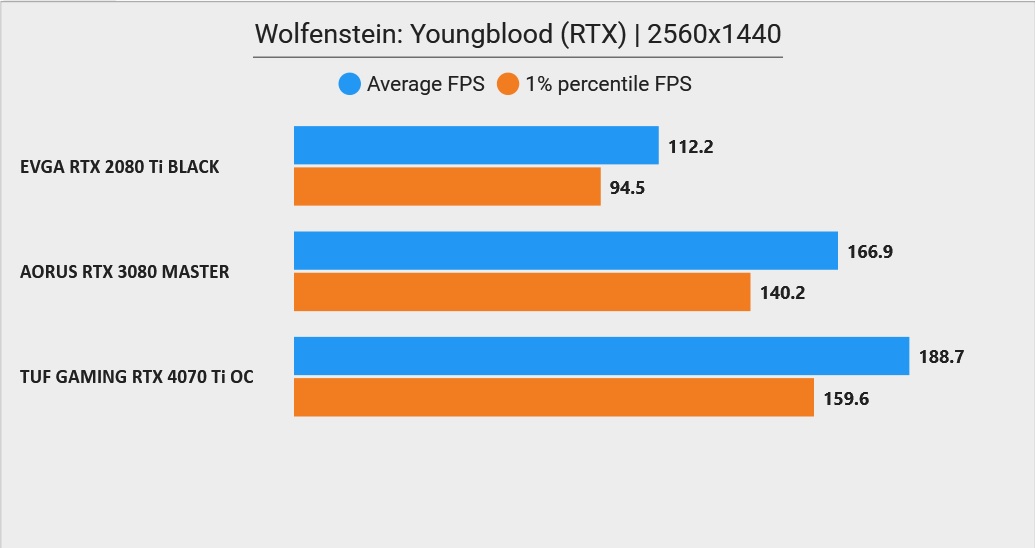
Wolfenstein: Youngblood (RTX)
2160p – Avg FPS & P1 FPS – Higher is better
1440p – Avg FPS & P1 FPS – Higher is better
Main Performance Gaming Summary Charts
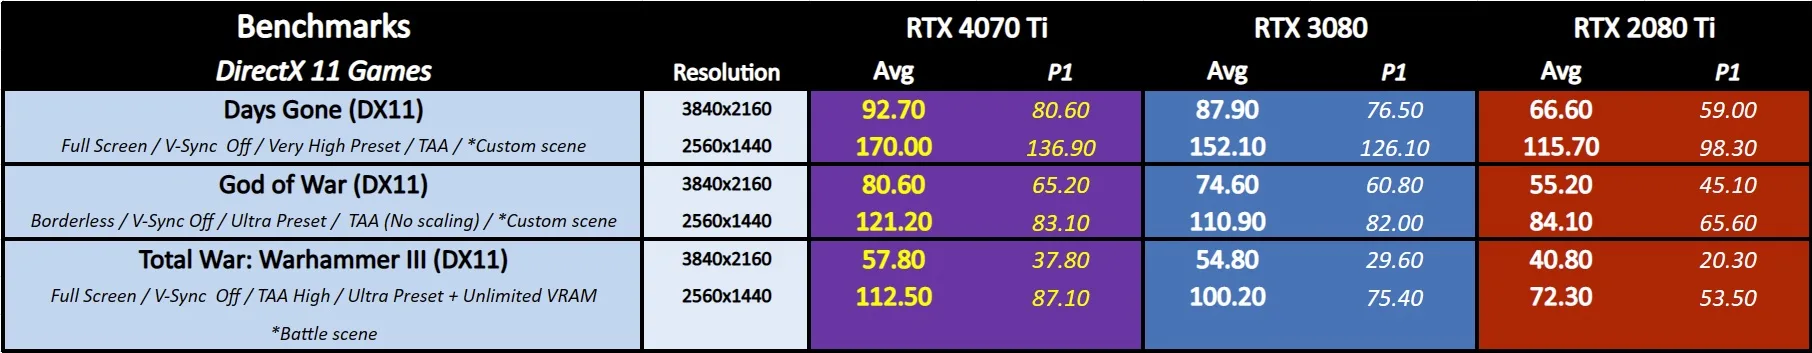
Here are the summary charts of 19 games, six hybrid, and three non-synthetic tests. We note and specify the main in-game display, graphics, AA, and scaling settings on the performance summary charts below. The benches were run at 2560×1440 and at 3840×2160.
We compare three graphics cards and list them listed in order starting with the TUF GAMING RTX 4070 Ti OC (yellow text), the AORUS RTX 3080 MASTER, and the EVGA RTX 2080 Ti BLACK. All results, except for 3D Mark Fire Strike, Time Spy, and Port Royal hybrid tests, show average framerates, and higher is better. Minimum framerates are next to the averages in italics and a slightly smaller font. Minimum framerates are expressed by the 1% percentile FPS (P1), and higher is better.
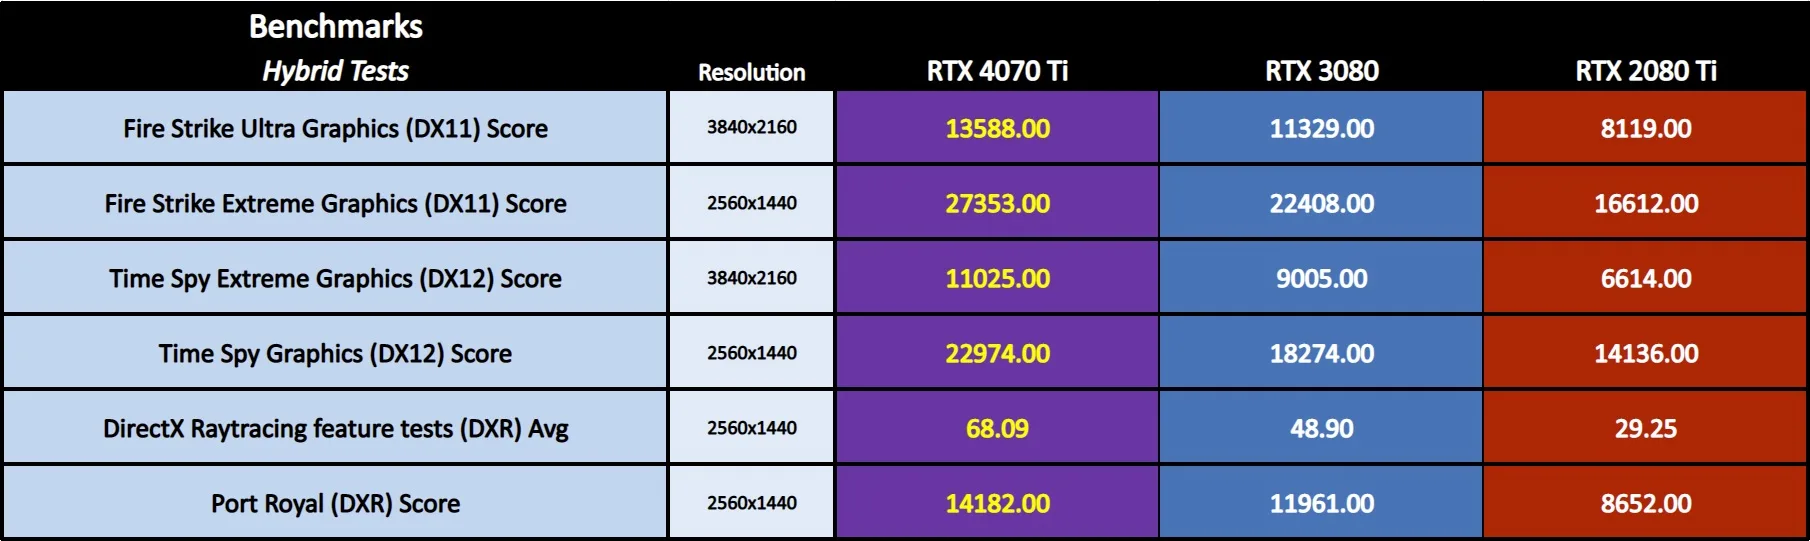
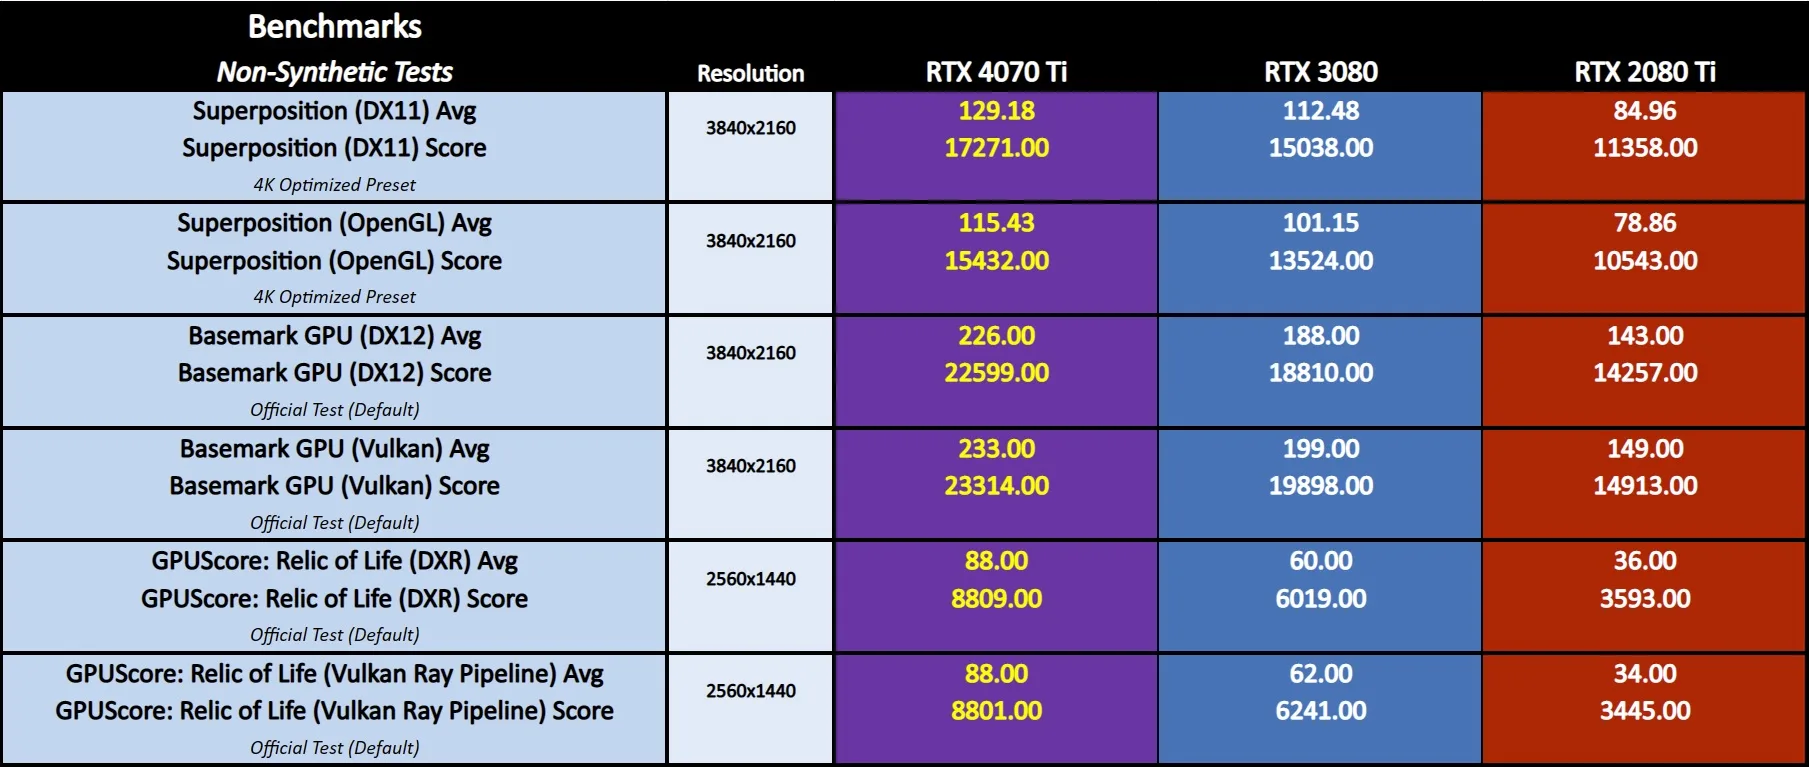
Here are the hybrid and non-synthetic benchmark results.
DLSS Benchmarks
In this section, we compare the performance in some games with Quality DLSS on and off, and also compare performance with Quality DLSS 2 with our RTX 3080 and 2080 Ti cards versus Quality DLSS 3 (DLSS 2 + Frame Generation) using our RTX 4070 Ti TUF GAMING OC to check if the massive performance improvements advertised by Nvidia are real.
No DLSS vs. Quality DLSS 2
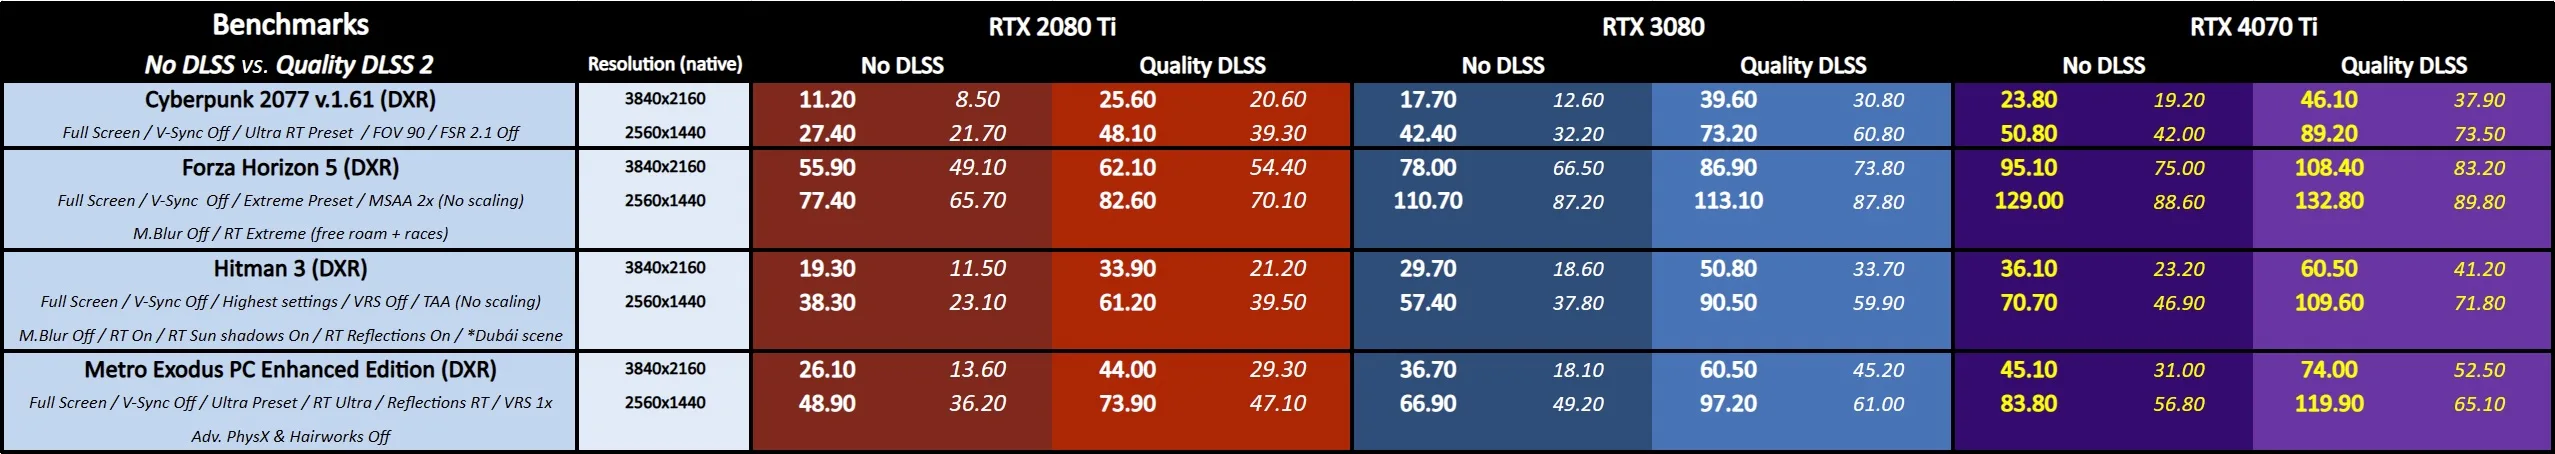
Looking at the chart above, we see substantial performance improvements in all tested games using Quality DLSS 2 with our three cards compared to not using DLSS.
At 2160p and using Quality DLSS, the 4070 Ti TUF GAMING OC is the only card of our three we compare to exceed the 30FPS barrier in Cyberpunk 2077 (DXR), to reach the 60FPS one in Hitman 3 (DXR), and to exceed 60FPS avg in Metro Exodus PC Enhanced Edition (DXR).
No DLSS vs. Quality DLSS 2 & 3
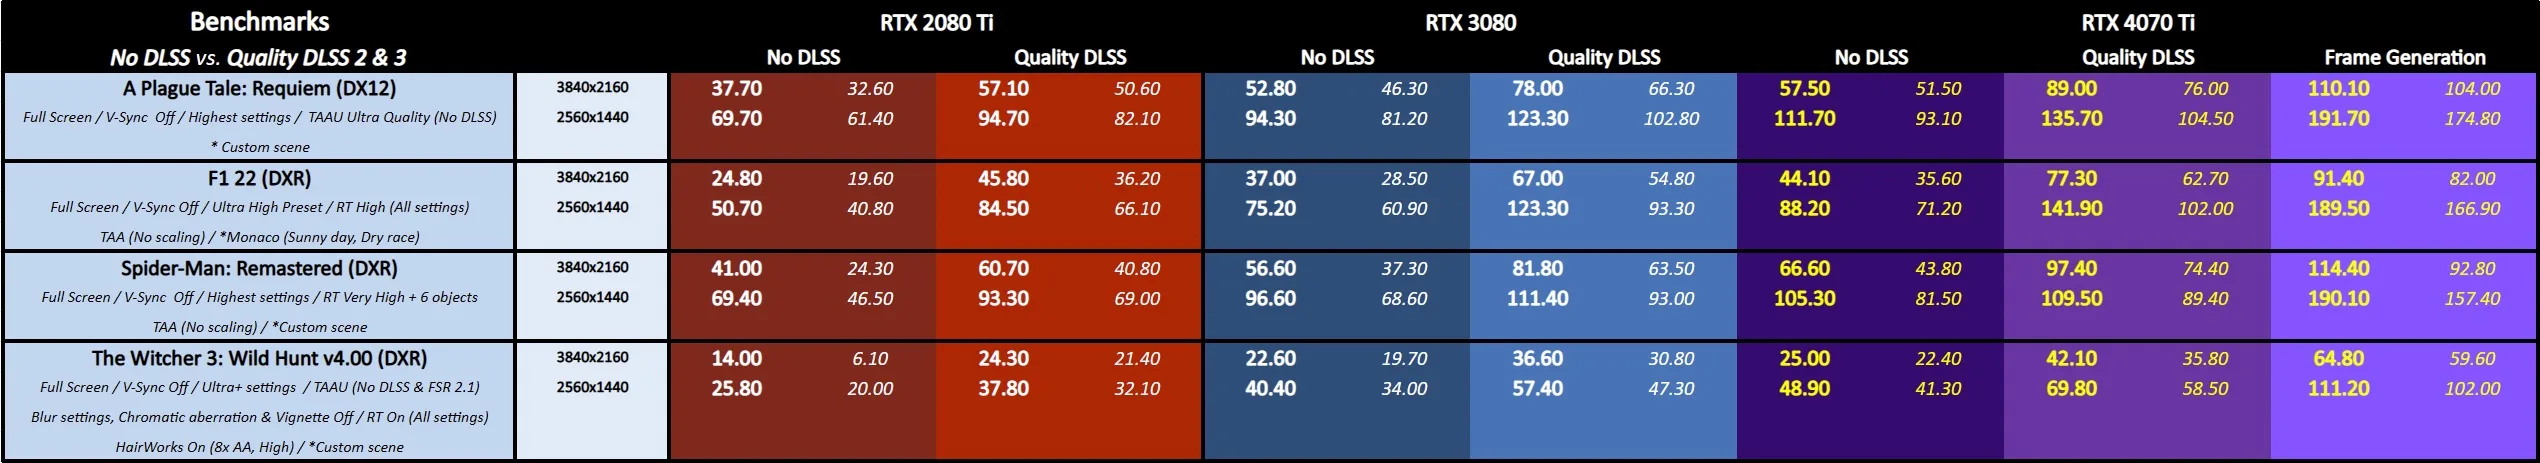
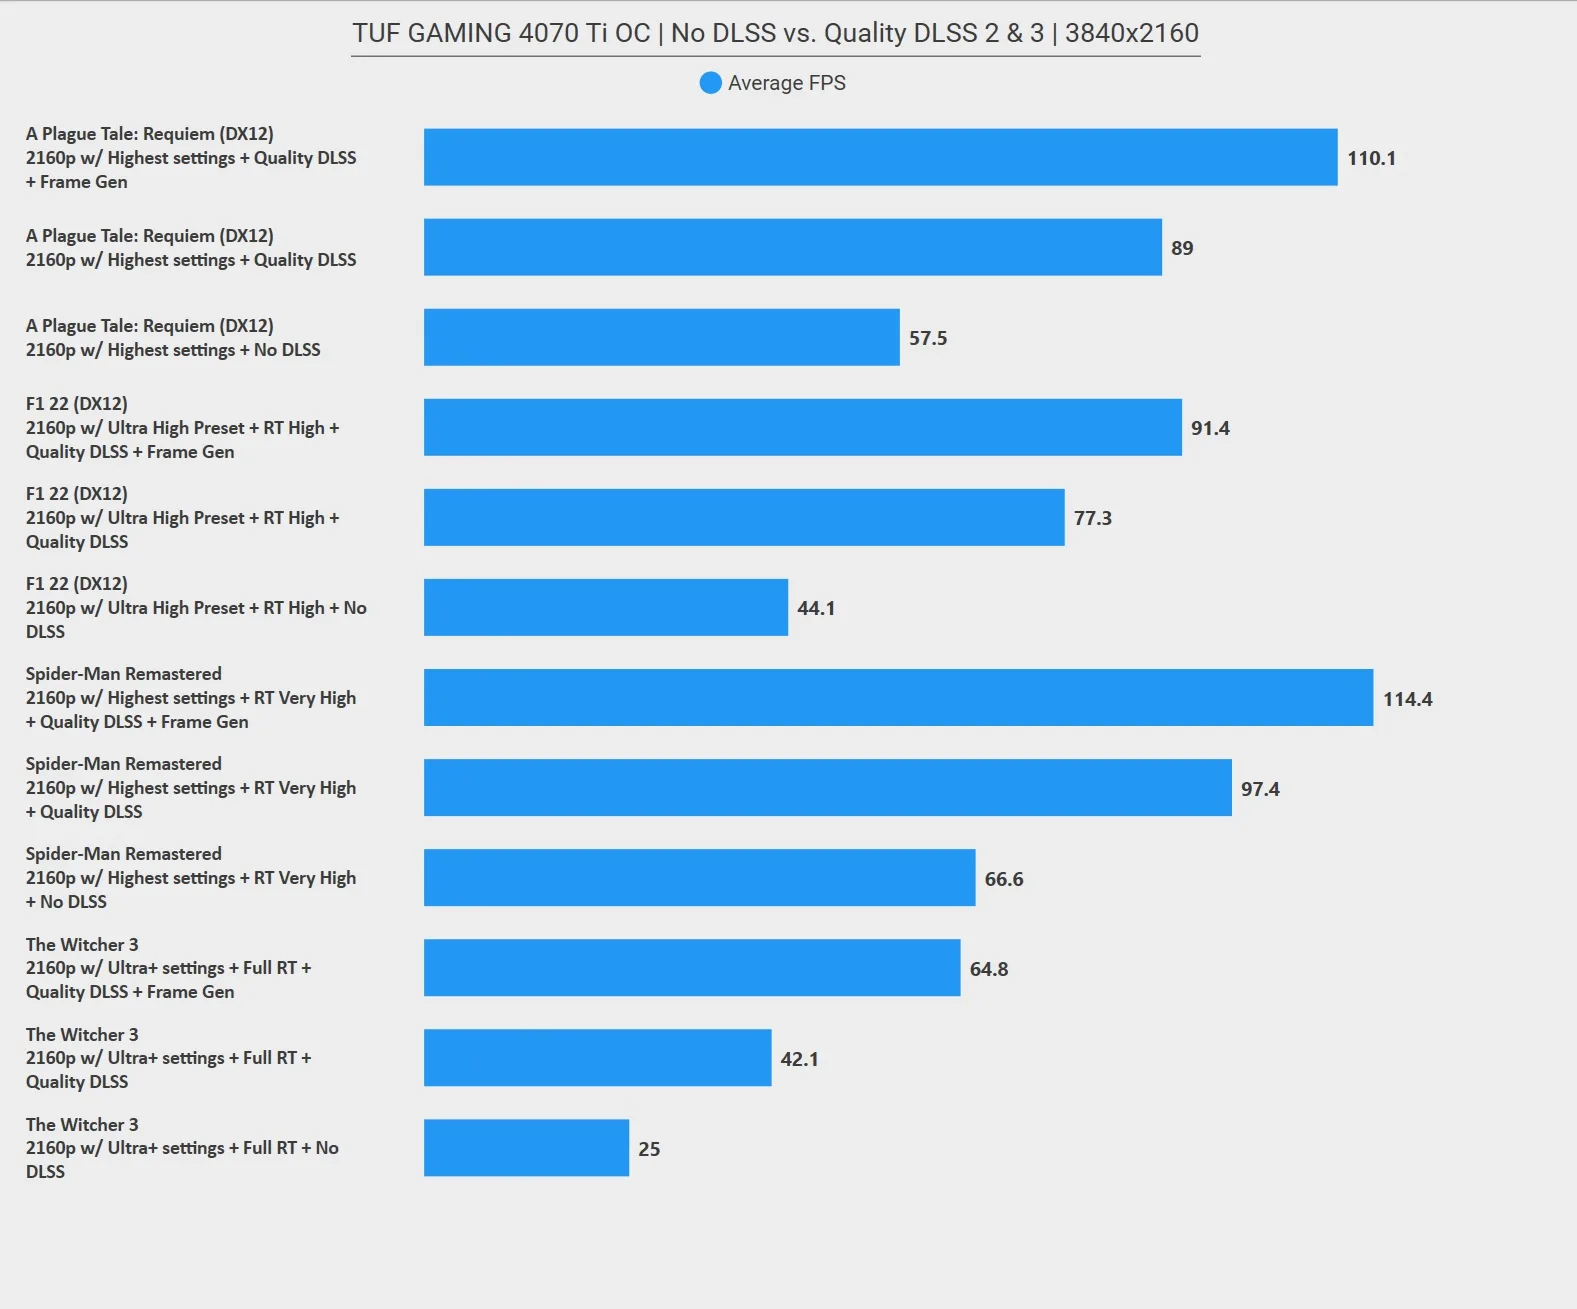
Nvidia talks about 2x and up to 2.4x performance improvements when using DLSS 3 in games supported by the RTX 4070 Ti. In our case, we saw that their promo ads are consistent with reality.
We see an impressive +159% (2.6X) performance improvement between having DLSS 3 on and off in The Witcher 3 (DXR) v4.0, another +107% (2.1X) in F1 22 (DXR), +72% (1.7X) in Spider-Man: Remastered (DXR), and +91% (1.9X) in A Plague Tale: Requiem.
The previous results using DLSS 3 show us the notable advantage and performance leap in the most demanding and current ray-traced games, which comes from having an Ada Lovelace graphics card, especially in the case of the RTX 4070 Ti TUF GAMING OC.
Considering the image quality results from a 2160p native resolution, we saw that overall, Quality DLSS 3 looks just as good as Quality DLSS 2 in all games we tested, with only some minor artifacts visible in certain situations. From a 1440p native resolution, we see similar results, except The Witcher 3 v.4.0, as the game with DLSS 3 enabled showed a blurrier image than Quality DLSS 2 in this scenario.
Averaged Framerates & Relative GPU Performance
Averaged Game Framerates
We averaged the aggregated FPS avg of all games and testing scenarios, and we represented the total game average FPS for each tested graphics card by the following chart:

On average, the TUF GAMING RTX 4070 Ti is approximately 17% faster than the AORUS RTX 3080 MASTER and 66% faster than the EVGA RTX 2080 BLACK. So, although the RTX 4070 Ti TUF GAMING OC offers a substantial performance improvement in games over the EVGA RTX 2080 Ti BLACK baseline performance, the RTX 4070 Ti TUF GAMING OC delivers a far less impressive step up over the AORUS RTX 3080 MASTER.
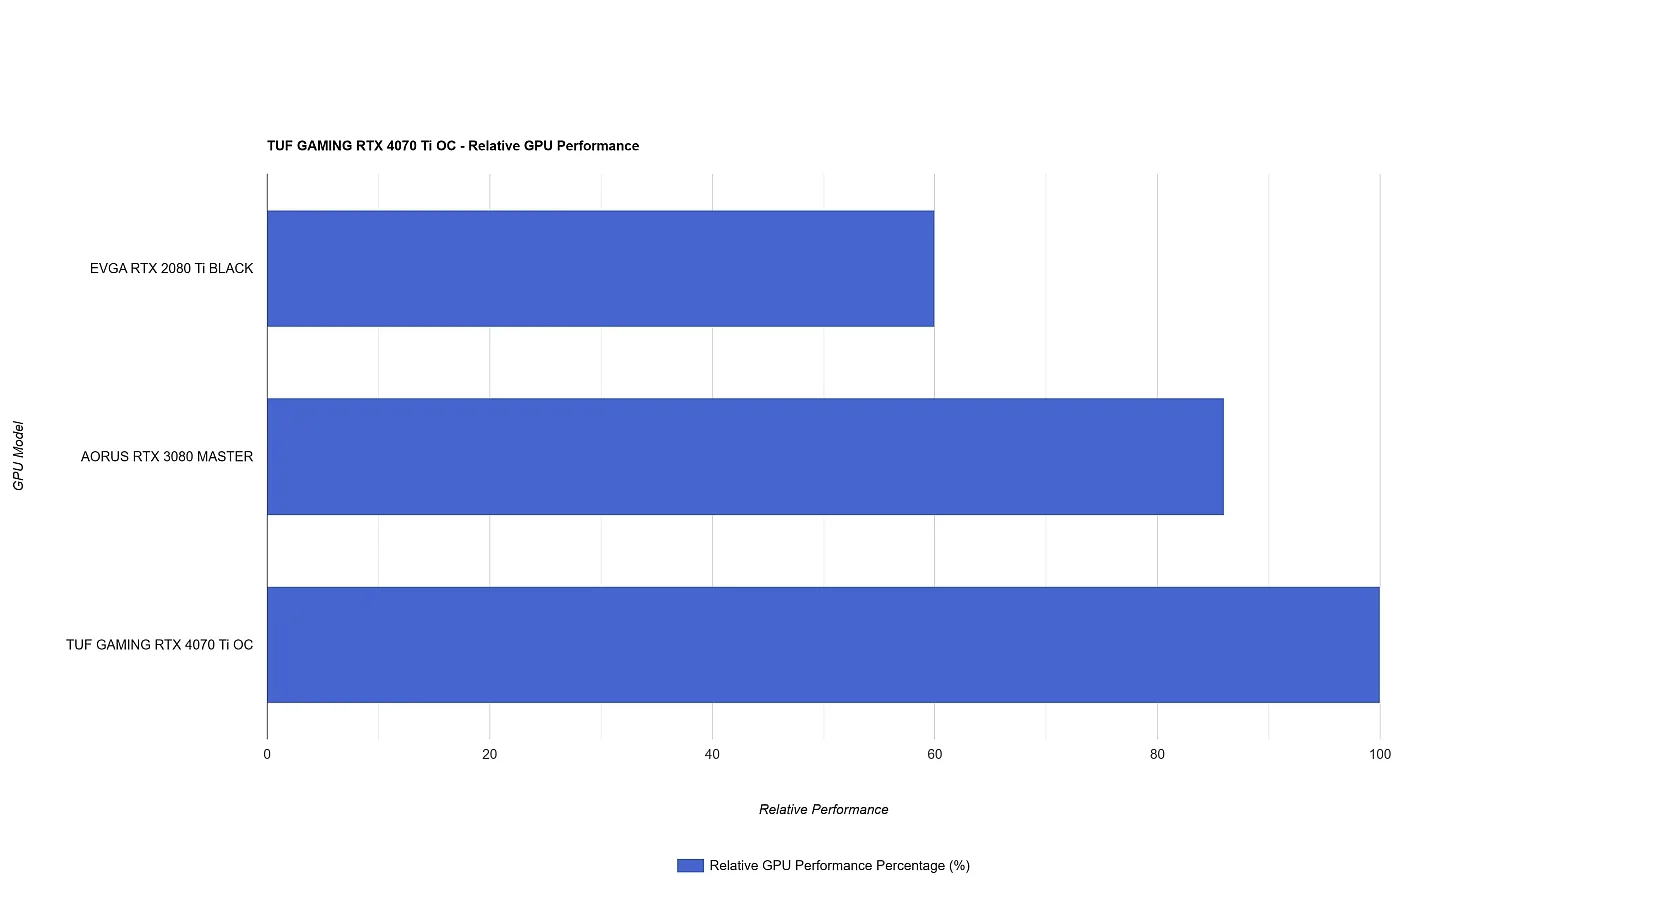
RTX 4070 Ti TUF GAMING OC Relative Performance
Considering the calculated total game average FPS and the RTX 4070 Ti TUF GAMING OC as 100% performance, we can situate relatively the two other cards we compare. So, based on our total game average FPS of each card, the relative GPU performance of the AORUS RTX 3080 MASTER is approximately 86% (14% less performance than the RTX 4070 Ti, on average), and the relative GPU performance of the EVGA RTX 2080 Ti BLACK is 60% (40% less performance than the RTX 4070 Ti, on average).
Let’s see our final thoughts and verdict on the RTX 4070 Ti TUF GAMING OC.
Final Thoughts & Verdict
This has been an enjoyable exploration comparing the new ASUS TUF GAMING RTX 4070 Ti OC Edition with the AORUS RTX 3080 MASTER and EVGA RTX 2080 Ti BLACK. The TUF GAMING RTX 4070 Ti is a quality card with a sober aesthetic, minimal RGB lighting, an excellent cooling system, and room for moderate additional overclocking.
The RTX 4070 Ti TUF GAMING OC performed solidly above the RTX 3080 and well above the RTX 2080 Ti. While the TUF GAMING RTX 4070 Ti OC is not a notable upgrade for existing RTX 3080 users, it certainly is for RTX 2080 Ti users and any Turing users considering upgrading their gaming rig. However, at $849.99 and for users coming from an RTX 3080, the TUF GAMING RTX 4070 Ti OC is still a reasonably priced option to consider as a decent GPU refresh, especially if you want to enjoy significant performance improvements in DX12 and ray-traced games and the massive performance gains that DLSS 3 brings to gamers.
The TUF GAMING RTX 4070 Ti OC Edition especially shines at 1440p resolution delivering high to very-high framerates in every recent game and 3D API scenario we tested, and also has the power to play most games over 60FPS at 2160p, where until now, a 3080 fell short of delivering a smooth 60 FPS experience in the most demanding games.
All in all, the ASUS TUF GAMING RTX 4070 Ti OC Edition is a decent refresh in terms of performance for RTX 3080 owners who want to upgrade to the latest architecture to maximize its graphics power for a reasonable price or even a big step up at a good price for Turing users who also like to enjoy the ray tracing and Nvidia DLSS enhancements of the new Ada-Lovelace micro-architecture.
Let’s Play!
***
Rodrigo González (aka RodroG) is the current BTR lead reviewer and an enthusiast gamer. He is especially interested in shooter games, open-world role-playing games, and software and hardware benchmarking. He is the author of the NVIDIA WHQL Driver Performance Benchmarks Series and founder and moderator of the r/allbenchmarks community on Reddit.
Comments are closed.