We asked CORSAIR for a 2x48GB DDR5 6000MHz CL30 VENGEANCE kit to give our 9950X3D/RTX5090 PC additional memory for creative and AI tasks. Instead, we received two 2x48GB kits for a total of 192GB RAM, which we reviewed here. Unfortunately, our ASRock X870E Taichi motherboard was only able to manage a very disappointing 4400MHz (MT/s) with both kits installed.
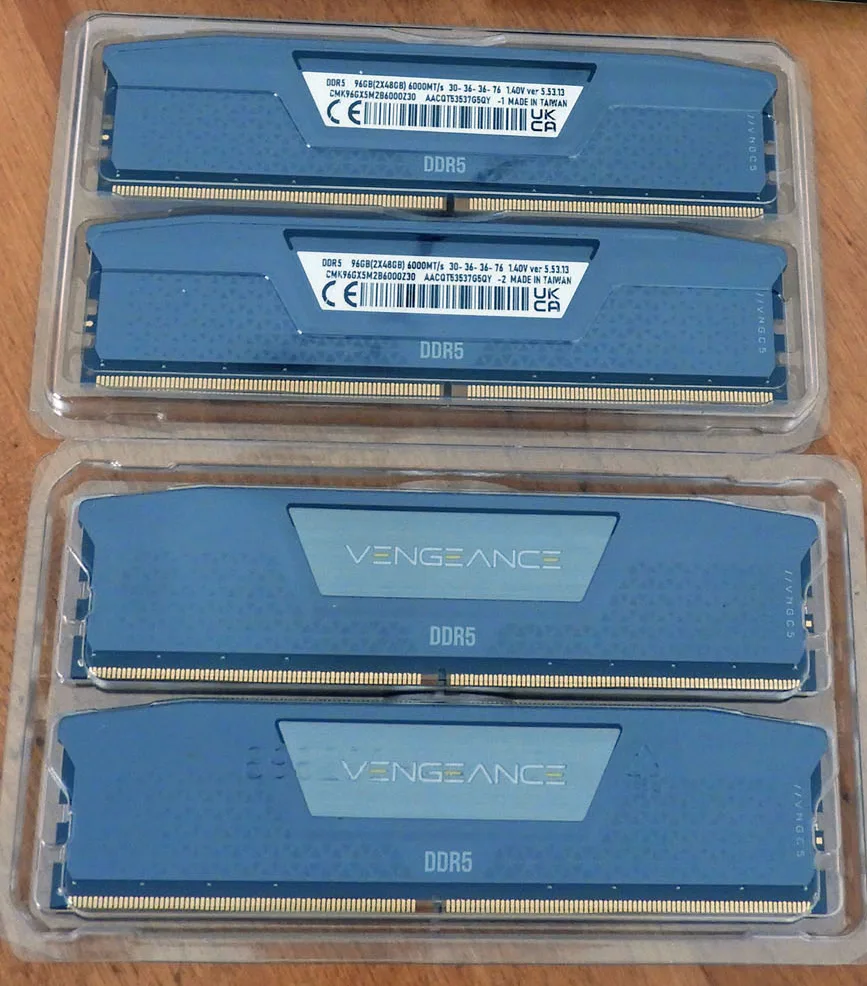
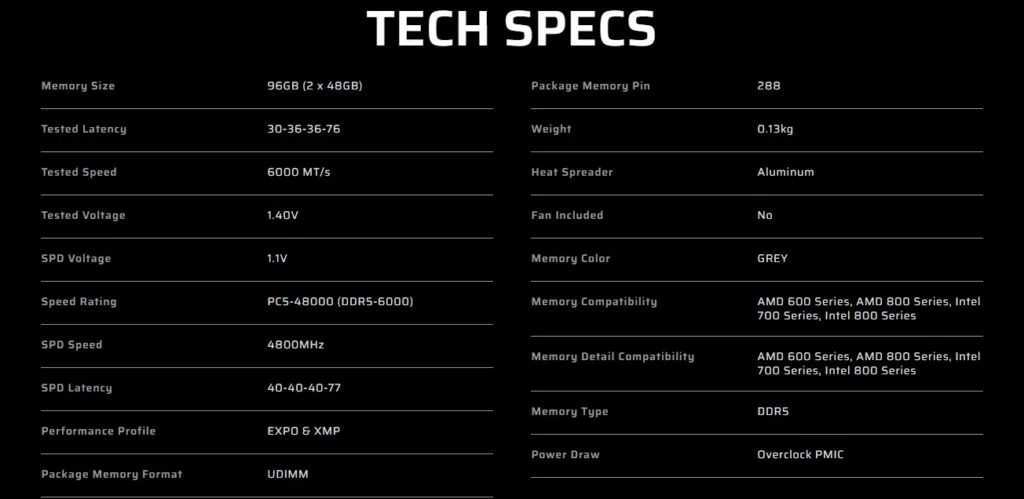
The technical specifications are from CORSAIR’s website, and the memory is optimized for AMD EXPO meeting AMD’s sweet spot of 6000MT/s at CL30-36-36-76 for a Ryzen 9 9950X3D. They are very impressive specifications for a 48GB module, and it matched the specs of our 2x32GB G.SKILL kit. Our issues arose when using two kits and populating all four slots.
Using Two Kits vs. Using One Kit
One cannot use two kits, even of the same brand and timings, in a 4×4 configuration and expect EXPO settings. Adding a second memory kit to an AM5 motherboard results in lower frequencies due to the increased stress placed on the CPU’s integrated memory controller. AMD desktop consumer motherboards have physical and electrical limitations when using four DIMMs versus two. In fact, the default speed when using four dual rank (double-sided) DIMMs is 3600MT/s.
Consumer AM5 motherboards are built to prioritize maximum clock speeds for a two-DIMM configuration. Motherboard traces are designed to have the best signal integrity and shortest path when only two of the four slots are populated, typically in slots A2 and B2. When using two kits, the best practice usually is to install each kit in the same channel to account for slight differences between kits.
When all four slots are used, the signal path becomes much more complex, reducing signal integrity. We were only able to achieve 4400MT/s with our ASRock MB even with a voltage increase and a lot of tweaking. Attempting 4600MT/s defaulted immediately back to 3600MT/s.
CORSAIR was easily able to achieve 5200MT/s with their own MSI Carbon board, and we speculate that it’s because of our ASRock Taichi X870E motherboard, which has been reported on social media for having damaged X3D CPUs until BIOS 3.40 was released. One major site even called the ASRock X870E “murderboards“.
It seems likely that the new BIOS may be limiting the CORSAIR VENGEANCE’s true potential, as ASRock may now be erring on the side of safety. In fact, after BIOS 3.50 was released, we could no longer run at 4400MT/s but had to drop the frequency even further to 4200MT/s. However, we used the 3.40 BIOS when comparing performance with the other two motherboards we newly purchased. Below are our test configurations.
Test Configuration
Hardware
- Ryzen 9 9950X3D supplied by AMD
- ASRock Taichi X870E BIOS 3.50 – 4x48GB DDR5-6000 maximum overclocked custom settings / PBO to -0.3mV and TDP to 85C / SVM disabled, supplied by AMD/ASRock
- ASUS ROG Strix X870E-E Gaming WiFi X870e BIOS version 1715 – maximum overclocked custom settings / PBO to -0.3mV and TDP to 90C / SVM disabled
- MSI MPG X870E CARBON WIFI X870E BIOS version 7E49v1A70 – 2x48GB at EXPO 6000MT/s CL30-36-36-76 and 4x48GB DDR5-6000 at maximum overclocked custom settings/ PBO to -0.3mV and TDP to 85C / SVM disabled
- 4x48GB CORSAIR VENGEANCE DDR5-6000 CL30-36-36-76 UCLK=MEMCLK and FCLK 2000 (custom frequencies for each motherboard), supplied by CORSAIR
- 2x48GB CORSAIR VENGEANCE DDR5-6000 CL30-36-36-76 UCLK=MEMCLK (EXPO) and FCLK 2000, supplied by CORSAIR as tested in the MSI motherboard
- Samsung 990 Pro 1TB Gen4x4 M.2 2280 PCIe 4.0 (7450/6900MBps) C: drive, supplied by AMD/Samsung
- TEAMGROUP MP44 4TB SLC Cache Gen4x4 M.2 2280 PCIe 4.0 (7000/6000MBps) Storage
- RTX 5090 Founders Edition, supplied by NVIDIA
- Super Flower Leadex SE 1200W 80+ Platinum Power Supply Unit
- DeepCool Castle 360EX AIO
- CORSAIR 5000D case
- BenQ EW3270U 32″ 4K UHD/60Hz Monitor
Software
- Windows 11 Professional 64-bit 2024 2H2
- NVIDIA Studio driver 581.29 for apps (577.00 for PCMark 10 only) /581.29 GRD for games/3DMark. All drivers, games & apps updated
- UL 3DMark Professional, courtesy of UL
- UL Procyon Suite, courtesy of UL
- UL PCMark 10 Professional, courtesy of UL
- SPEC Workstation 4.0
- SPECviewperf 15
- AIDA64 Engineer, courtesy of FinalWire
- 7zip
- Blender Benchmark
- CPUZ Benchmark
- GeekBench CPU
- GeekBench AI
- HWiNFO64
- Karhu RAM test
- LLM Studio OpenAI’s gpt-oss 120B
- MaxxMem2
- Memory Mark (PassMark)
- Novabench Memory
- Vovsoft RAM Benchmark
- V-Ray CPU Benchmark
- Y-cruncher
ASUS ROG Strix X870E-E Gaming WiFi and MSI MPG X870E CARBON WiFi motherboards
The first motherboard we purchased from retail was the ASUS ROG Strix X870E-E Gaming WiFi. We installed the motherboard and did a clean install of Windows 11 along with all our apps and games. We were particularly interested in trying DIMM Fit and DIMM Fit Pro, which promise an automatic way to overclock memory. From the ASUS link:
“Two ASUS-exclusive BIOS features, DIMM Fit and DIMM Fit Pro, help streamline the process. The former runs a precise analysis to optimize performance for compatibility and system stability. When activated from the UEFI, the DIMM Fit algorithm performs a grid search on the interface signaling registers, finding hyperparameters that optimize stability for that kit. Because memory testing takes time, the process can take hours instead of minutes, but the entire process is fully automatic, and the parameters will be saved so they can be used in the future.”
The process takes many hours to run and is best done overnight. In theory, it should work great but DIMM Fit did not set optimum outcomes, resulting in either 4600MT/s stable or higher with very loose timings that were completely unstable. In each case, our own manual tuning had better results. Using DIMM Fit Pro would lock up the BIOS when trying to enter our own values requiring a hard reset. ASUS does not provide much documentation, and we returned to manual tuning.
Very strangely, the ASUS motherboard refused to boot at 5000MT/s but did boot into Windows at 5200MT/s with the same very loose timing settings (CL48). After spending three days with this motherboard, starting with 4200MT/s, testing for stability, and slowly increasing the frequency, we finally achieved a stable 4800MT/s CL30-36-36-76 which we were still dissatisfied with.
Memory is usually Hynix A-die or M-die, Samsung, or Micron. Hynix A die can often achieve the highest raw frequencies, while the Hynix M-die that the high density CORSAIR’s VENGEANCE kits we have excel at tight timings without high voltage. So we expected better than the ASUS motherboard’s 4800MT/s.
Next, we purchased the MSI MPG X870E Carbon WiFi Gaming motherboard from retail and rebuilt our PC, then did another clean install of Windows 11 with all of our apps and games. Again, we started the tedious overclocking process beginning with 4200MT/s, testing for stability, and increasing the frequency in steps until we reached 5400MHz CL30-36-36-76.
This allowed us to use MSI’s “Try It” which allows one to test memory presets, beginning with 5600MT/s with relatively loose timings. It passed all our stability tests, and we were also able to tighten the timings. It also passed the 5800MT/s Try It preset with loose timings, which we were able to finally adjust to CL30-36-36-76 with our PC completely stable. Attempting 6000 MT/s booted into Windows but the Karhu RAM Test reported errors and no amount of (safe) voltage increases or other tweaks worked.
We are very impressed with MSI’s straightforward BIOS and settings for RAM as well as Try It. We had achieved 5800MT/s at CORSAIR’s rated timings of 30-36-36-76 with 4x48GB DDR5-6000 – only 200MT/s below what a single kit is rated for!
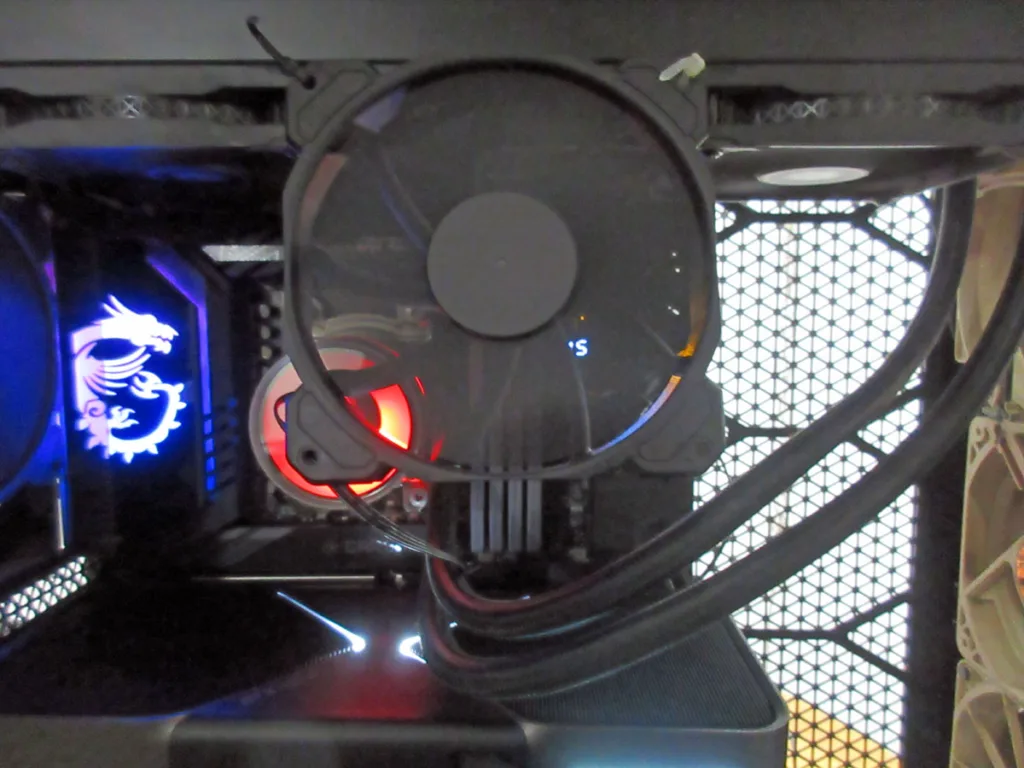
Thermals may also become an important consideration when running 4x48GB RAM. We noticed temperatures of the center two modules reached the mid-60s C under extreme load, so we added a 140mm fan angled to blow air directly on them. It dropped temperatures by 5-7 C keeping temps well below 60 C. We plan to add a small dedicated RAM cooler instead of our hastily zip-tied solution.
So let’s compare 4x48GB performance – at 4400MT/s, 4800MT/s, and 5800MT/s – among our three motherboards and also against 2x48GB at 6000MT/s, each at CL30-36-36-76.
Gaming Performance Summary Chart & 3DMark
Although our focus is not on gaming, here are the summary charts of four games known to be CPU-intensive and two synthetic 3DMark tests. The highest settings were chosen, and the settings are listed on the charts.
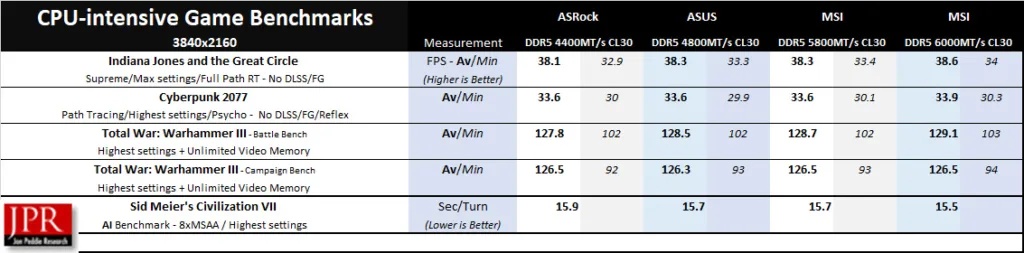
The four memory speeds each ran the above games relatively closely in performance. Even the VENGEANCE 4x48GB kit at only 4400MT/s does reasonably well, which means — although not ideal — a 192GB workstation-type setup can work for gaming.
3DMark
3DMark uses a specialized CPU profile test that uses from one to the maximum number of CPU threads available to give the average simulation time per thread. Here is the summary chart using max threads, followed by the Firestrike Extreme 4K Physics scores, which also depend heavily on CPU/RAM.
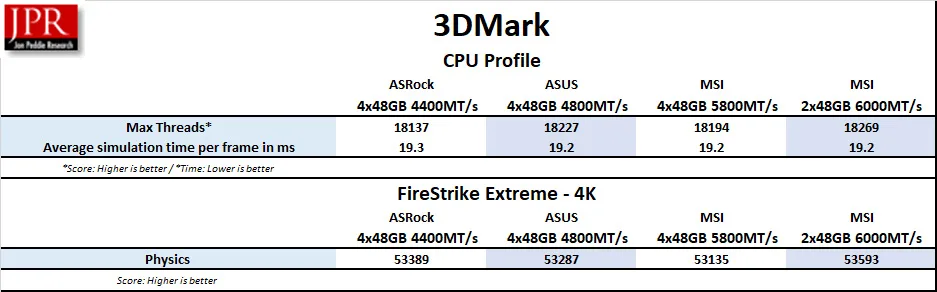
There’s not a lot of difference, so let’s move on to non-gaming synthetic benchmarks specifically designed to test memory and CPU.
Synthetic Benchmarks
AIDA64 v8.00.8000 Engineer
AIDA64 is an important industry tool for benchmarkers. Its memory bandwidth benchmarks (Memory Read, Memory Write, and Memory Copy) measure the maximum available memory data transfer bandwidth. AIDA64’s benchmark code methods are written in Assembly language, and they are well-optimized. We use the Engineer’s full version of AIDA64, courtesy of FinalWire. AIDA64 is free to try and use for 30 days.
The AIDA64 Memory Latency benchmark measures the typical delay from when the CPU reads data from system memory. Memory latency time means the time is accurately measured from the issuing of the read command until the data arrives in the integer registers of the CPU. It also tests Memory Read, Write, and Copy speeds.
Here are the CORSAIR VENGEANCE Memory Benchmark results.
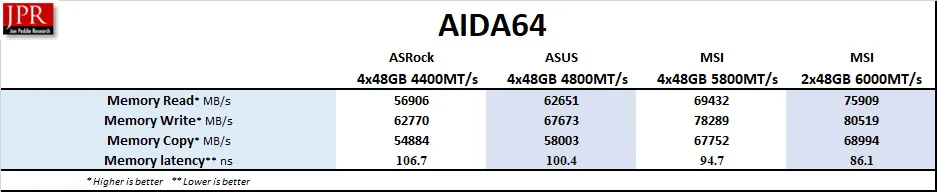
It’s not surprising that the 2x48GB configuration at 6000MT/s exhibits the least latency and highest performance, while the 4x48GB configurations have increasingly lower performance and higher latency as the frequency drops.
CPU-Z
CPU-Z benchmark is a quick synthetic test found in the CPU-Z utility to measure a CPU’s single- and multi-thread performance, providing a relative score to compare against other CPUs.
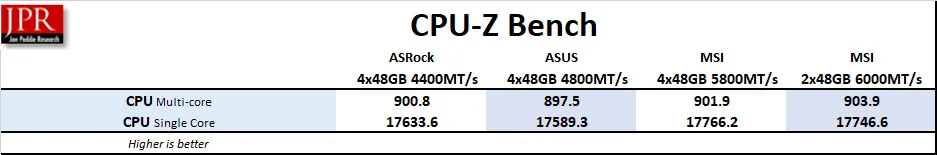
We include it only for a rough comparison.
MaxxMem²
MaxxMem² v3.00.24.109 is another free small memory benchmarking program designed to compare memory performance, including latency.
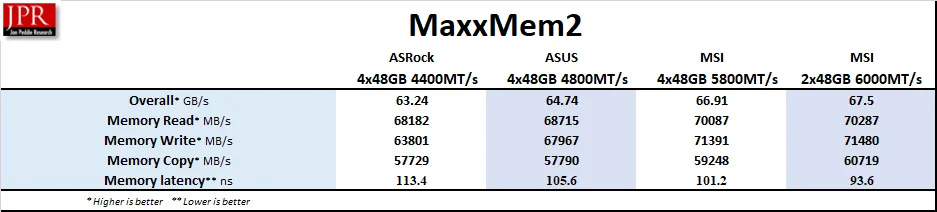
The results are in line with other memory tests.
PassMark Software’s PerformanceTest tool – Memory Mark
PassMark Software’s PerformanceTest tool includes Memory Mark, which tests the memory database operations as well as uncached and cached reads, writes, and latency.
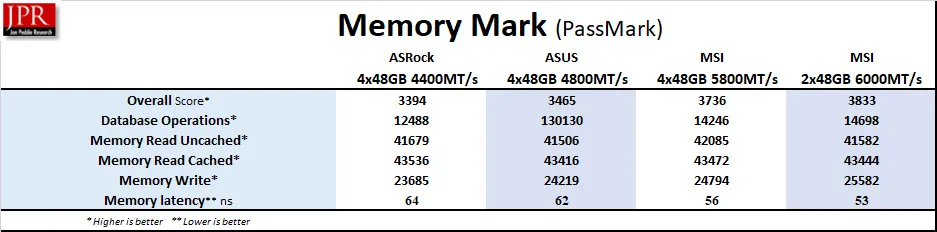
Again, no surprises.
Novabench
Novabench is a very quick synthetic benching utility that also gives a memory score, which shows the peak transfer speed as well as latency. Here is the summary.
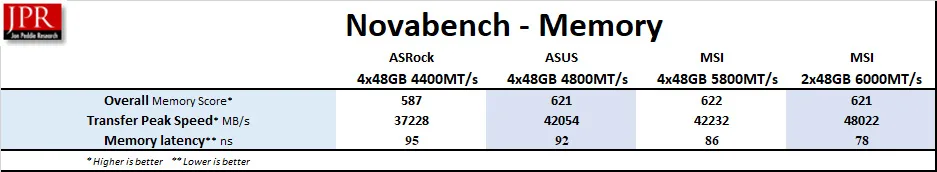
This time, the 4x48GB configuration at 5800MT/s marginally scores highest despite having a distant second-fastest transfer peak speed and second lowest latency.
Vovsoft RAM Benchmark
Vovsoft RAM Benchmark is another free semi-synthetic benchmark that mimics the way real applications use large amounts of RAM by allowing users to customize the block size. An ‘x’ means the block is too large to be run by the memory kit.
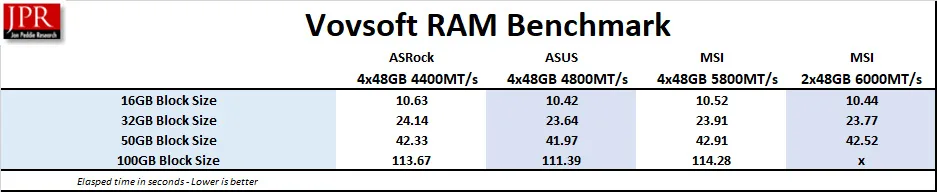
The VENGEANCE 2x48GB kit was unable to run a 100GB block, although all four configurations ran almost identically.
7-Zip benchmark
The 7-Zip built-in benchmark we use is a synthetic benchmark that tests LZMA and LZMA2 algorithms compression/decompression and gives a rating in GIPS (giga or billion instructions per second), which is calculated from the measured speed. It is somewhat dependent on RAM speeds.
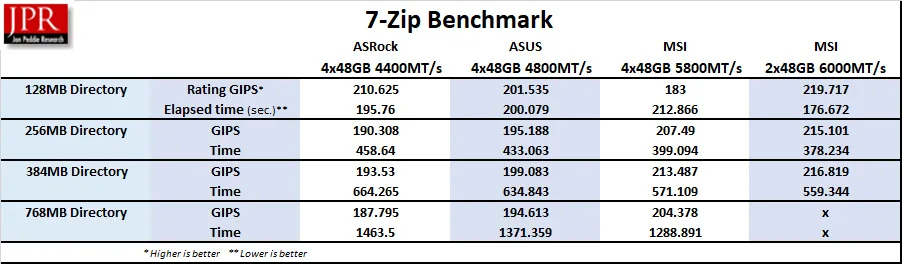
As in the previous test, we increased the directory size until only the 2x48GB CORSAIR VENGEANCE configuration could not process 768MB. This time, performance scaled upward as RAM frequency increased, except for an outlier 5800MT/s using the 128MB directory.
Y-cruncher
Y-cruncher is a synthetic benchmark that tests the raw computational power of a system by calculating Pi, pushing the CPU and RAM to their limits. It is a free test that is fully multi-threaded. We chose the 1 and 2.5 billion digit tests, and kept the test running only in RAM with no swapping to disk allowed.
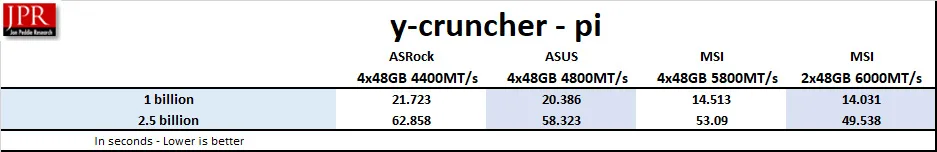
Memory speed matters in Y-cruncher, with performance scaling upward as the frequency increases.
Let’s leave synthetic benchmarks behind and move on to more real-world-scenario benchmarking.
Real-World Benchmarks
Geekbench 6 CPU and Geekbench AI Benchmarks
GeekBench 6 is a well-established CPU benchmarking program that runs a series of tests and times how long the processor takes to complete the tasks. Faster memory means the CPU may be able to complete tasks faster.
Both Geekbench and Geekbench AI are hybrid benchmarks straddling a line between synthetic and real-world testing. It simulates real-world scenarios and tasks, including machine learning, yet focuses on practical workloads.
Here are the summary results of our four memory configurations:
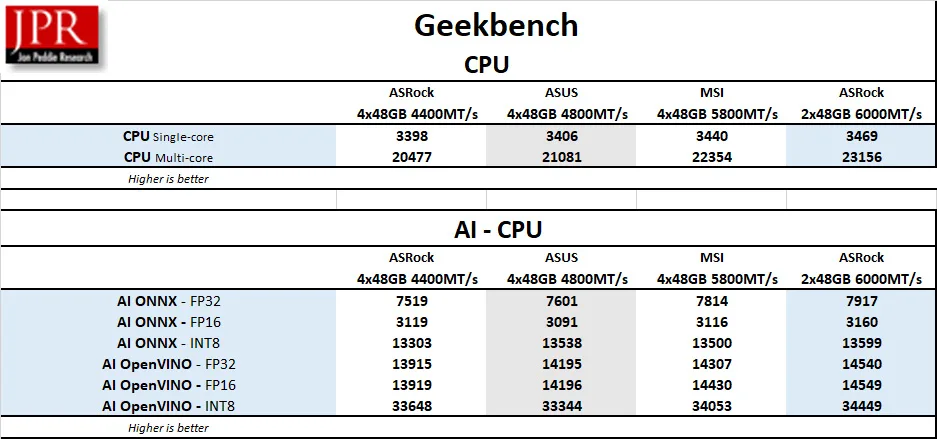
Again, faster memory translated to higher performance in most of the benches.
Blender 4.5.0 Benchmark
Blender is generally considered a real-world benchmark because it renders three files of 3D models and scenes that are based on professional production tasks.
We generally see performance increase with faster CPU and memory speeds, so we used the very latest version of the Blender 4.5.0 benchmark, which primarily measures CPU performance in rendering production files. Higher is better, as the benchmark automatically renders a scene multiple times and gives the results as samples per minute. The benchmark may be downloaded from here.
Here is the Summary.
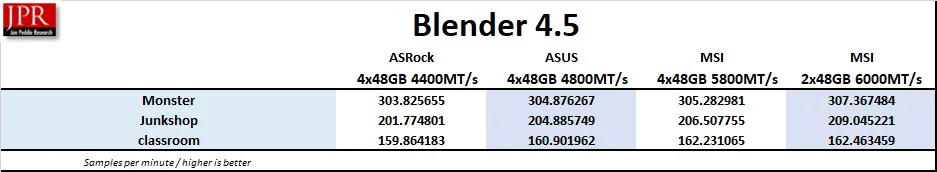
All of the kits perform adequately, although faster memory brings higher performance.
Next, we benchmark using Cinebench.
Cinebench 2024
Cinebench 2024 is based on MAXON’s professional 3D content creation suite, Cinema 4D. The latest version of Cinebench uses real-world rendering tasks from the Redshift engine. It provides scores for multi-core and single-core CPU (as well as GPU) accurately and automatically, and is an excellent tool to compare CPU/memory performance.
Following is the summary chart.
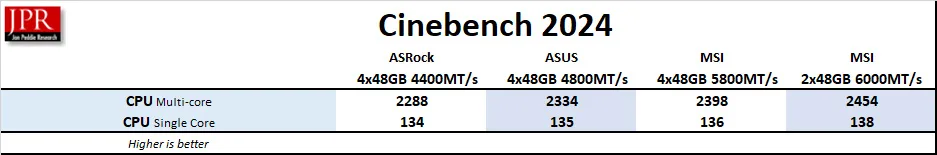
In every instance, progressively higher memory speed brought higher rendering performance.
V-Ray CPU Benchmark
The V-Ray benchmark is a real-world benchmark, as it uses the popular V-Ray rendering engine to test a system’s performance. The benchmark uses the same technology that visual effects and design professionals use for their projects. We chose the CPU benchmark instead of the GPU version.
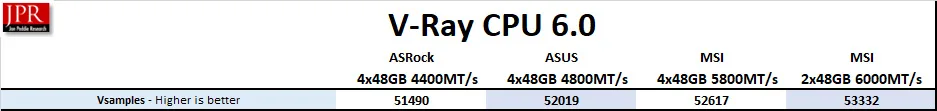
Each increase in memory speed translated to progressively higher scores. Next, let’s check out real-world testing benchmark suites.
PCMark 10 Professional Edition
PCMark 10 has multiple tests that use real-world timed benchmarks, including web browsing, video group chat, photo, batch, and video editing, music and video tests, and even mainstream gaming. PCMark 10 offers three primary tests, and we chose the Extended suite. We used the Professional Edition courtesy of UL.
In our summary, we are focusing primarily on the overall score as well as photo and video editing. UL’s Procyon Office benchmark suite has largely superseded PCMark 10 (which is still current and supported), but we don’t have the full versions of Adobe’s Lightroom or Photoshop.
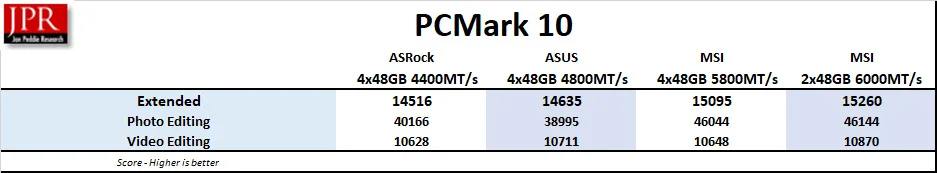
This time, there isn’t a lot of difference between the scores, with higher memory speeds bringing only incremental improvement to the scores.
Procyon Suite
UL’s Procyon benchmark suite is another hybrid approach using a combination of real-world applications and simulated workloads to measure performance. Procyon Office tests real-world tasks within Microsoft Office, while the AI Inference Benchmarks use common machine-learning tasks to measure performance.
Procyon Office
Here is the summary:
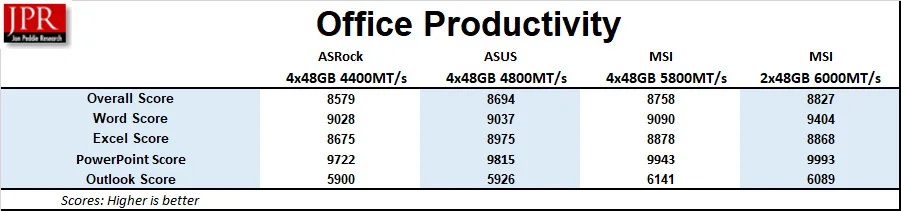
Just as with PCMark 10, faster memory generally brought increased scores.
Procyon AI Computer Vision Benchmark
The Procyon AI Computer Vision Benchmark measures how AI inference engines perform. We used the Windows Machine Learning, Float 32 benchmark.
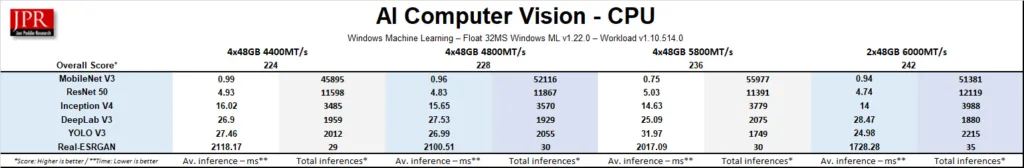
We saw the much higher latency of the 4x48GB’s 4400MT/s configuration causing the inference times to increase significantly, resulting in lower total inferences compared with the 2x48GB 6000MT/s configuration.
UL Procyon AI Image Generation benchmark
The UL Procyon AI Image Generation benchmark measures inference performance for Stable Diffusion models, and we used their most demanding Stable Diffusion XL (FP16) workload. It primarily runs on the GPU, but we included it for completeness
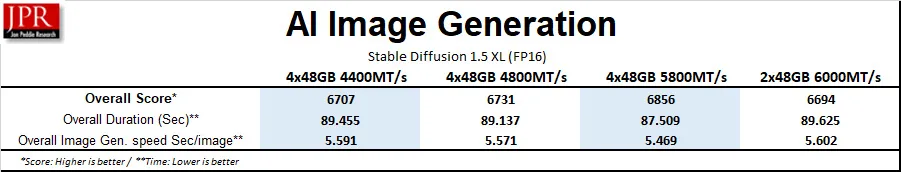
Because AI Image Generations runs on the GPU, there isn’t a lot of difference among the results.
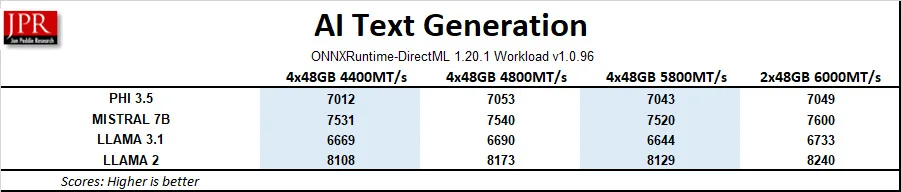
Procyon AI Text Generation Benchmark
The Procyon AI Text Generation Benchmark tests AI performance with multiple LLM AI models. Again, it runs primarily on the GPU and depends less on vRAM.
Let’s move on to SPECworkstation benchmarks.
SPECworkstation 4.0 Benchmarks
All of the SPECworkstation 4.0 benchmarks are based on professional applications, most of which are in the CAD/CAM or media and entertainment fields. All of these benchmarks are free except for vendors of computer-related products and/or services.
The most comprehensive workstation benchmark is the newly revamped 4.0 version. It’s a freestanding benchmark that does not require ancillary software. It measures GPU, CPU, storage, and all other major aspects of workstation performance based on actual applications and representative workloads. It now features a new category of tests focusing on AI and ML workloads and has updated many others over the older versions.
Here is our SPECworkstation 4.0 summary.
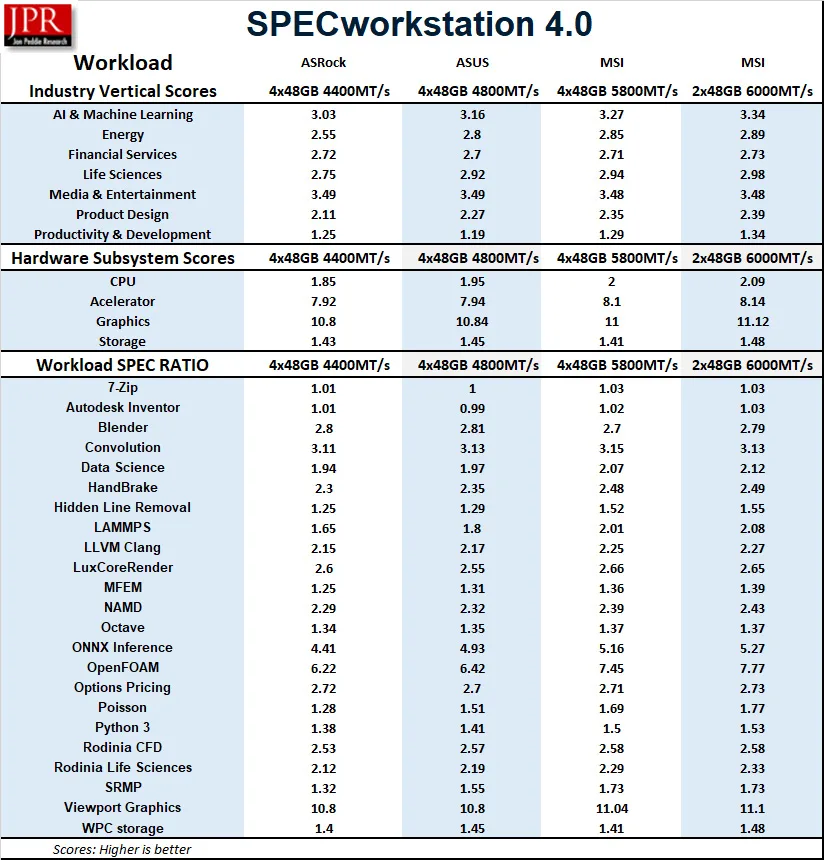
Generally, performance scales upward as the RAM speed increases. However, for workstation tasks, the DDR5 at 4400MT/s is satisfactory.
SPECviewperf 15
Specviewperf 15 was also completely revamped over the 2020 version. It uses system RAM in conjunction with the GPU for its performance benchmarks. It simulates professional application workloads, requiring large system resources to load and manipulate large datasets before being rendered by the GPU.
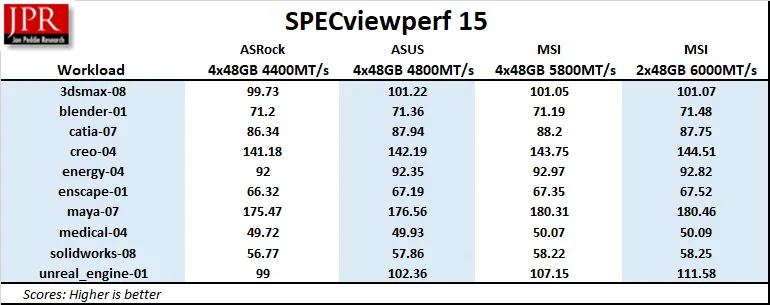
Although performance scaled upward incrementally, except for the Epic’s Unreal Engine benchmark, the RAM at 4400MT/s configuration did well.
Finally, we look at LM Studio.
LM Studio
LM Studio is a very powerful open-source desktop application that brings the capabilities of Large Language Models (LLMs) directly to local PCs without requiring a connection to the cloud. It’s a platform for downloading, running, and experimenting with a very large variety of open-source LLMs. It’s perfect for users who want privacy and full control of their data.
When we downloaded the 63GB OpenAI/gpt oss 120b model, we ran into this: “Partial GPU Offload Possible.”
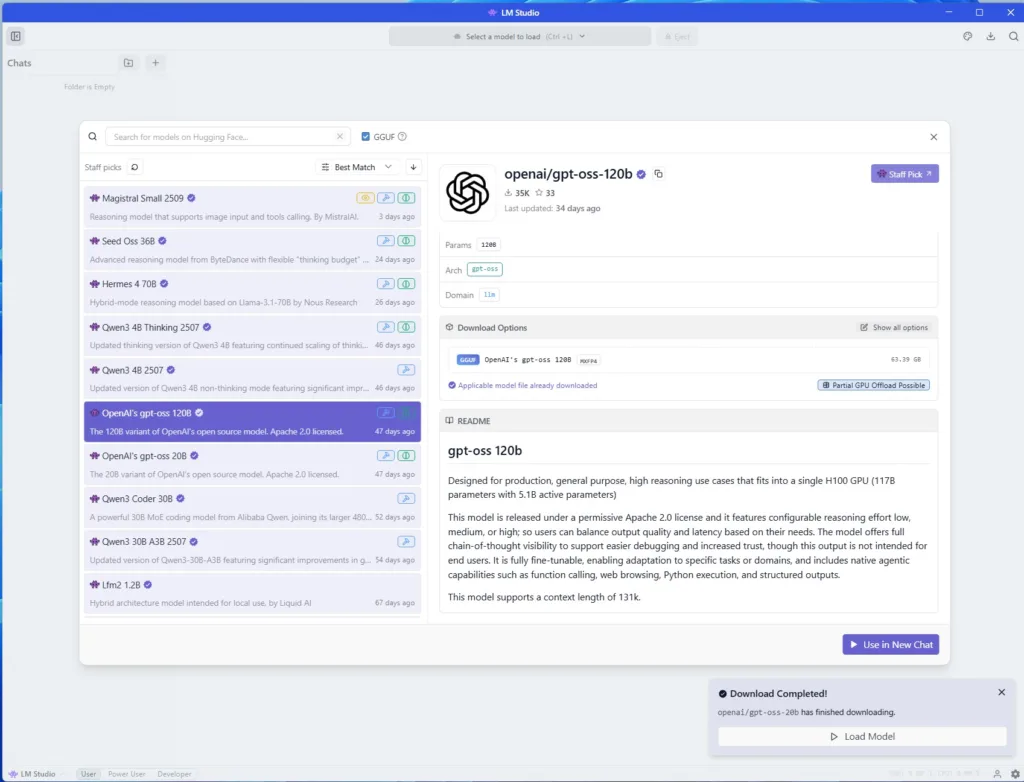
The 120 billion model is so large that it cannot fit into the 32GB vRAM of the RTX 5090, and the differences between system RAM capacity quickly become apparent. The GPU off-loads data to RAM, which means that with having 192GB over 96GB, the thought time is shorter and the answers are much complex and detailed.
With more RAM on the same PC, LM Studio off-loads a larger portion of a model from the slower system RAM to the much faster GPU VRAM, so the model performs better and produces far more detailed answers. Without enough RAM, the larger model makes performance compromises as system RAM is used as a swap file. When the model is too big for the GPU’s vRAM, LM Studio off-loads part of the model to the system RAM, and constant data transfers between them create a performance bottleneck.
Here is the summary of three prompts between the 2x48GB and the 4x48GB configurations.
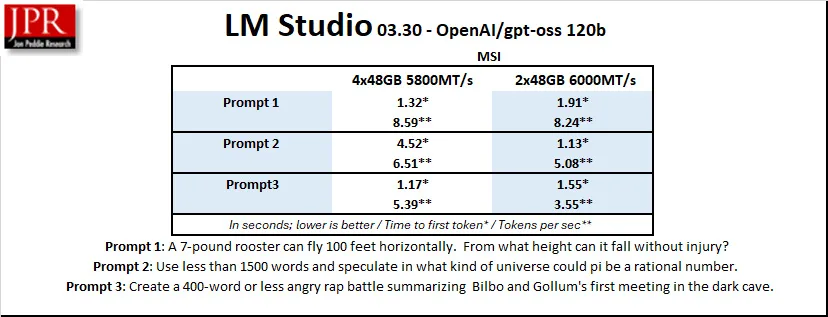
Using 192GB of system RAM means the model responds faster and with more detailed and accurate answers than having only 96GB of RAM. The RAM speed is less important than having higher capacity when using large models where the GPU needs to partially off-load to the CPU.
Let’s head to our conclusion.
Conclusion and Verdict
Running DDR memory at faster clock speeds with lower latency generally results in performance gains and saves time with multiple applications.
It is unsurprising that for most of the synthetic benchmarks, the 2x48GB CORSAIR VENGEANCE kit at 6000MT/s gives the highest performance where capacity is not an issue as it is with running a 120 billion-parameter large language model.
As to using memory in a 4-slot configuration – even with the same memory kits from the same manufacturer – your results may vary.
Because of the way the AMD consumer memory controller is designed, all you are guaranteed is 3600MT/s from using two identical 6000MT/s kits. However, we cannot recommend the ASRock Taichi motherboard as its memory controller is crippled compared with the other two motherboards we tested. Unfortunately, the ASUS motherboard’s DIMM Fit did not work properly for us, and we could only get 4800MT/s compared with the MSI MAG Carbon’s 5800MT/s.
We are very impressed with the MSI MAG Carbon motherboard’s intuitive BIOS, and its memory presets “Try It” worked perfectly, allowing the CORSAIR VENGEANCE 4x48GB configuration to achieve a high frequency with complete stability. In fact, we were also able to achieve 6000MT/s at CL28-36-36-76 with 2x48GB.
If you want to use LLMs like the OpenAI 120 billion model and you don’t have a professional GPU with a lot of vRAM or perhaps two RTX 5090s, a slower 4x48GB RAM configuration produces more accurate and detailed responses more quickly than a very fast 2x48GB kit. And for most workstation tasks and even gaming, 4400MT/s may be acceptable.
Using a high-quality motherboard like the MSI MAG Carbon, we recommend two CORSAIR VENGEANCE DDR5-6000 CL30 2x48GB kits for LLM users, creators, and artists who require 192GB fast system RAM with the only caveat being its price. These kits are very expensive. If you are primarily a gamer, a single 2x32GB kit makes far more sense. However, if you need higher capacity, either one or two CORSAIR VENGEANCE 2x48GB DDR5-6000 CL30 kits are outstanding and a perfect match for a high-end Ryzen 9 9950X3D system.