Performance Tests
Pricing and Availability
As NVIDIA’s new flagship, the RTX 5090 comes at a premium price point. However, for users who demand the pinnacle of performance and are willing to invest in cutting-edge technology, the RTX 5090 offers value that matches its cost. Since its release, the RTX 5090 has been lauded for its raw power and efficiency, and our performance tests show some great gains, but at an MSRP of $1999, many may struggle with this. Its premium price point has been and will continue to be a point of contention among the average consumer, though power users see it as a worthwhile investment.
JPR Tests are below. We shared the RTX 5090 with our partner site, JPR and have some of these results below:
| JPR TEST SYSTEM | Difference | ||
| OS | Win 11 Pro (64-bit) | ||
| MB: | Gigabyte X870 Aorus Master-CF-WCP | ||
| CPU | Ryzen 7 9800X3D (8 core, 16 threads) | ||
| CPU clock | 4.7 GHz | ||
| RAM | 32MB | ||
| Storage | Samsung SSD 990 Pro 1TB | ||
| GPU | RTX 4090 | RTX 5090 | |
| Architecture | Ada Lovelacw | Blackwell (GB202) | |
| Transistors (b) | 76.2 | 92 | 21% |
| Process (nm) | 5 | 4 | -20% |
| GPU Price | $1,599 | $1,999 | 25% |
| GDDR GB | 24 GDDR6X | 32 GDDR7 | 33% |
| Mem bus (bits) | 384 | 512 | 33% |
| Mem BW TB/s | 1.01 | 1.79 | 77% |
| CUDA cores | 16384 | 21760 | 33% |
| Clock (GHz) | 2.23 | 2.01 | -10% |
| Clock boost | 2.52 | 2.41 | -4% |
| RT cores | 128 | 170 | 33% |
| RT TFLOPS | 191 | 318 | 66% |
| Tensor cores | 512 | 680 | 33% |
| Tensor TOPS | 1321 | 1637 | 24% |
| ROPS | 176 | 192 | 9% |
| GPU TDP (w) | 450 | 575 | 28% |
| Introduced | Oct ‘22 | Jan ‘25 | |
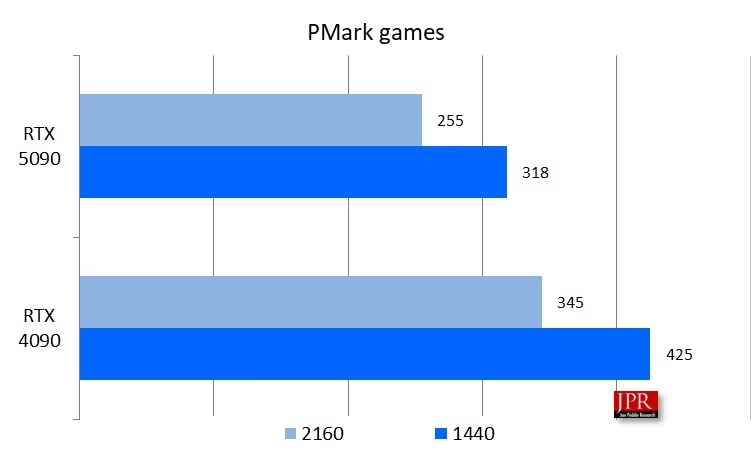
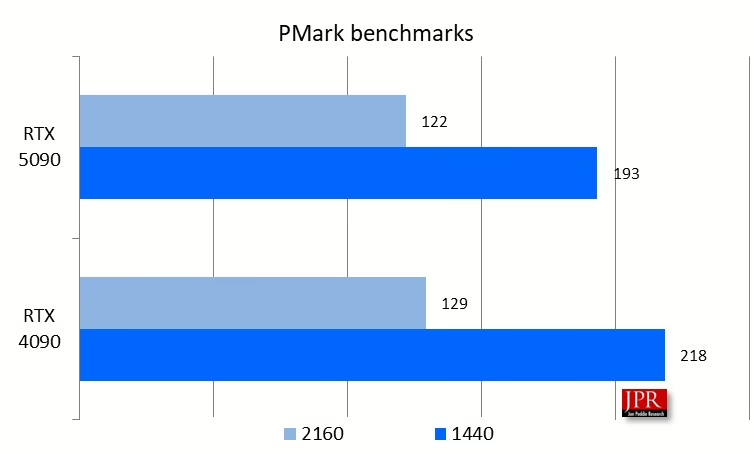
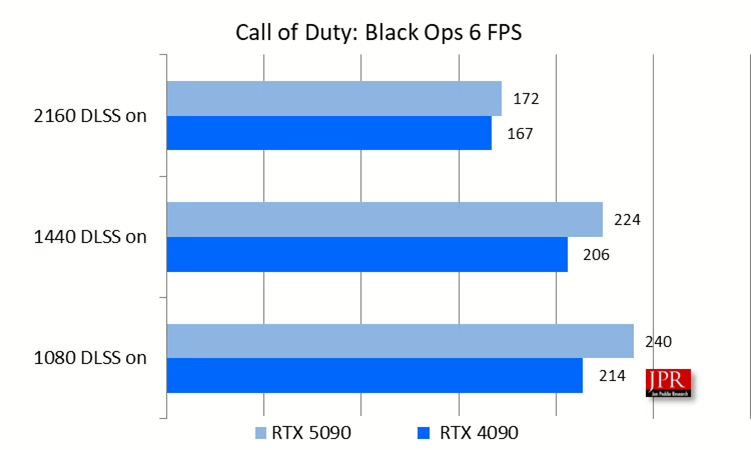
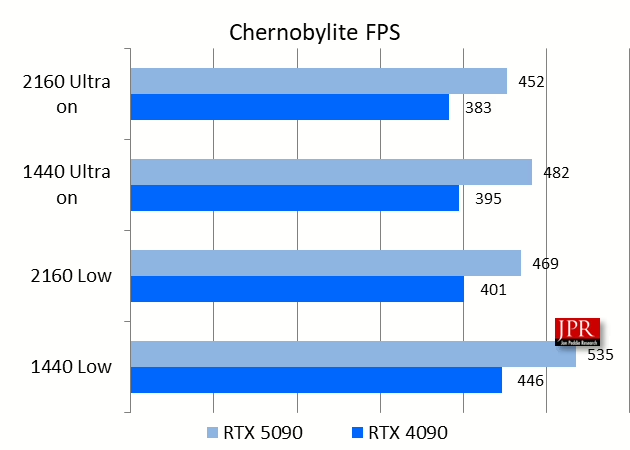
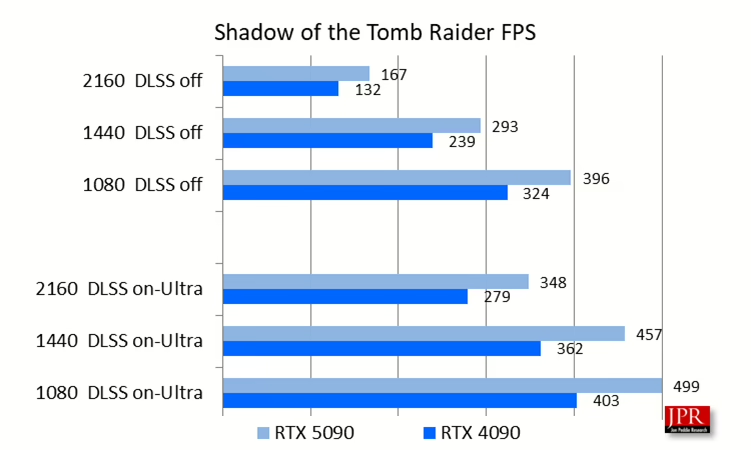
The RTX 5090 costs about 25% more than an RTX 4090 and uses 28% more power, while delivering 18% to 51% more performance.
| RTX 5090 difference over RTX 4090 | |
| Ave 2160 game Pmark | 18% |
| Ave 1440 game Pmark | 20% |
| Ave 2160 benchmark Pmark | 51% |
| Ave 1440 benchmark Pmark | 42% |
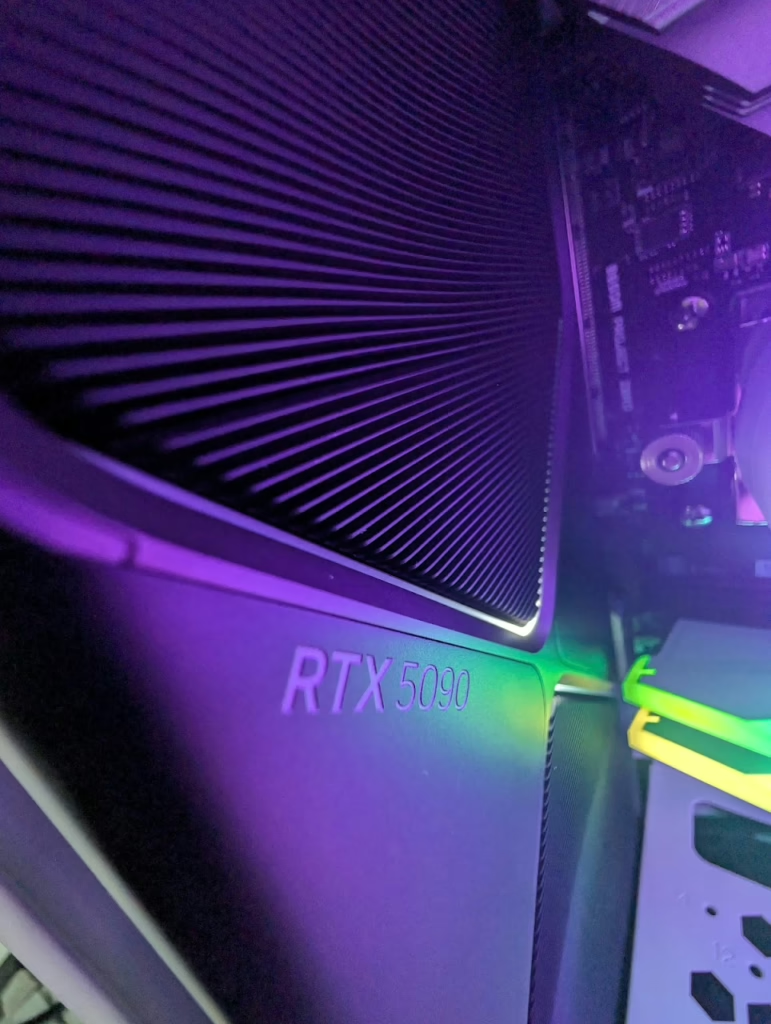
If you upgrade from a 30 series or demand the best of the best, this is a no-brainer. The price-to-performance ratio here is great. We completely understand others waiting for the 70 and 80 class entries for the Blackwell generation, as those may provide the perfect value for the average gamer. This is the zenith of gaming currently and will provide you with the top of the game for many years to come, and only you can decide if that high price tag is worth it.
3840×2160 Benchmarks
Benchmark Analysis of the RTX 5090
In our latest deep dive, we explore the performance of the RTX 5090 graphics card across different resolutions: 4K (3840×2160), 1440p (2560×1440), and 1080p (1920×1080). This analysis thoroughly compares with other GPUs in various gaming and rendering scenarios, illustrating the power and efficiency of the RTX 5090. Truthfully, we are not very impressed with the raw raster and raw performance uplifts, but as you’ll see later and in Nvidia’s own marketing, DLSS 4 is the focus and the king here.
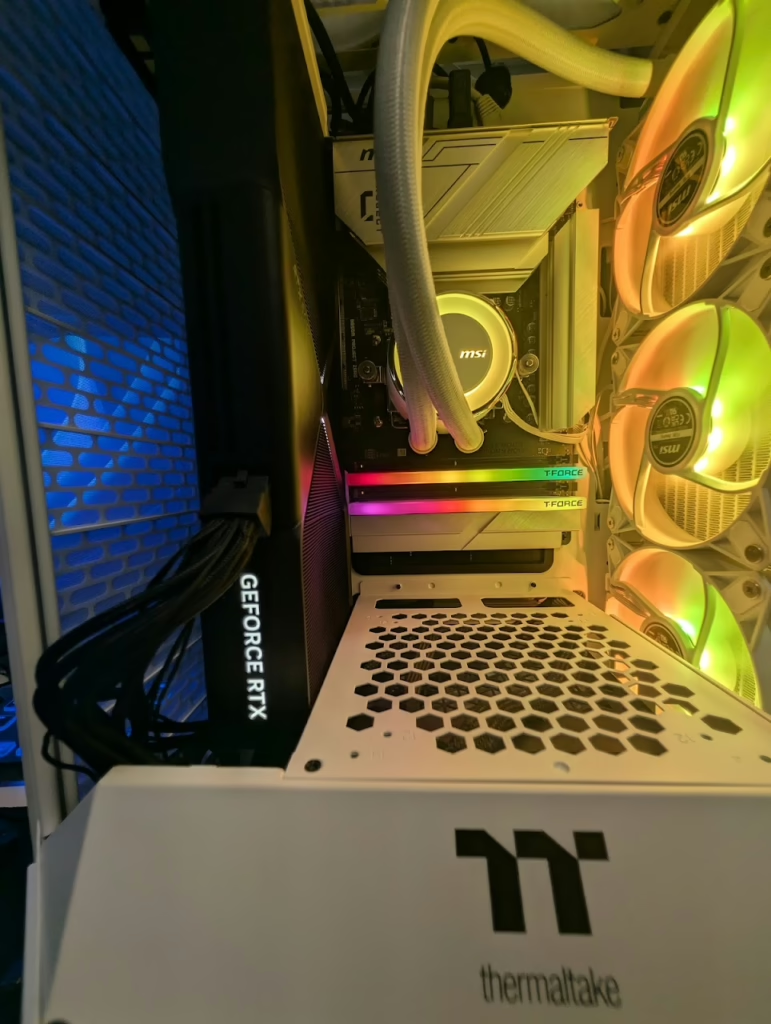
We will provide a larger 28 to 30-game, part 2, review of this card as soon as possible. Due to logistics and our offices being split between California and Texas. We had some shipping issues when sharing the card. This is why the 4090 is not included in our testing here – this will be included alongside the RTX 3090 in our part 2 review. Apologies!
3840×2160 (4k) Resolution Benchmarks
At 4K resolution, the RTX 5090 shows remarkable performance, significantly outpacing its predecessors and competitors in high-demand scenarios. The detailed benchmarks for various games and applications at 4K resolution are displayed in the table and graph below:
| 3840×2160 Benchmarks | RTX 5090 | RTX 4080 SUPER | RTX 4080 | RTX 3070 | RTX 3080 | RTX 4060 8GB | RTX 4060 Ti 8GB | XFX RX 7700 XT QICK 319 | AMD RADEON RX 7800 XT | RTX 4070 | RTX 4070 SUPER | RTX 4071 Ti | RTX 4071 Ti SUPER |
|---|---|---|---|---|---|---|---|---|---|---|---|---|---|
| Shadow of the Tomb Raider (Ultra) | 128.9 | 80.7 | 79.2 | 37.4 | 52.4 | 27.8 | 31.9 | 32.8 | 41.5 | 48.6 | 57.9 | 60.7 | 68.8 |
| A Plague Tale Requiem | 101.2 | 80.4 | 78.3 | 24.3 | 38.6 | 28.4 | 31.8 | 42.6 | 49.9 | 47.3 | 55.6 | 60.1 | 66.4 |
| Alan Wake 2 Ultra | 103 | 59.1 | 57.8 | 24.8 | 39.8 | 20.4 | 25.2 | 29.7 | 40.1 | 38.6 | 42.4 | 46.3 | 51.6 |
| Cyberpunk 2077 Ultra | 102.6 | 59.4 | 58.6 | 29.8 | 43.4 | 21.3 | 25.4 | 32.8 | 42.1 | 29.3 | 38.5 | 45.7 | 53.5 |
| Cyberpunk 2077 Ultra + DLSS 2 Quality | 162.1 | 146.9 | 143.1 | – | – | – | – | – | – | 81 | 102.2 | 103 | 128.6 |
| Resident Evil 4 Ultra | 135.2 | 81.2 | 80.3 | 41.5 | 54.3 | 27.6 | 32.8 | 48.4 | 59.8 | 49.6 | 57.2 | 62.4 | 68.3 |
| F1 2023 | 215.8 | 149.6 | 147.8 | 70.2 | 102.6 | – | – | – | 108.1 | 85.9 | 100.1 | 114.5 | 126.9 |
| Red Dead Redemption 2 | 150.3 | 74.2 | 73.1 | 35.6 | 52.8 | 24.5 | 33.7 | 43.9 | 55.4 | 45.2 | 54.9 | 58 | 64.2 |
| DOOM Eternal | 223.4 | 180.4 | 179.8 | – | 110.9 | – | – | – | 115.7 | 116.8 | 133.4 | 146.2 | 154.7 |
| The Last of Us Part. 1 | 87.6 | 62.8 | 57.1 | – | 34.1 | – | – | – | 43.7 | 36.5 | 40.7 | 39.9 | 53.6 |
| Hogwarts Legacy, Ultra | 90.2 | 62.4 | 61.7 | – | 38.1 | – | – | – | 41.8 | 32 | 36.8 | 47.4 | 50.8 |
Review Navigation: