MSI Raider A18 HX Other/Non-Gaming Benchmarks
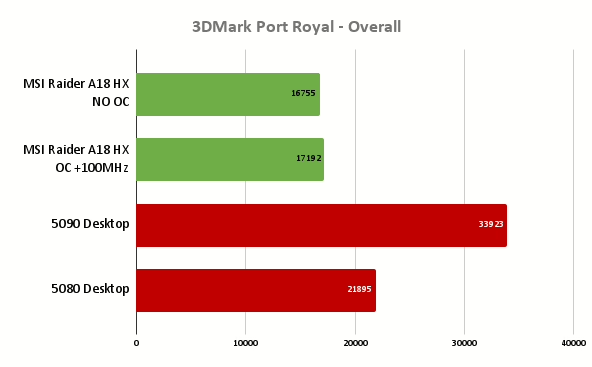
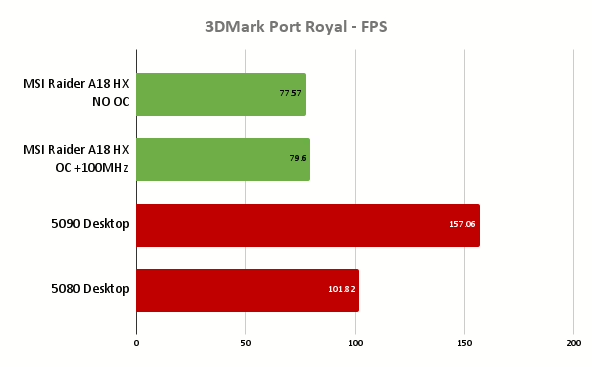
MSI Raider A18 HX 3DMark Benchmarks
In synthetic tests like 3DMark Port Royal, Time Spy, and Steel Nomad do show the expected delta between the laptop and top-tier desktops, the MSI Raider A18 HX still posts very strong results. Its overclocked mode brings measurable gains—typically 2–4%—which helps close the gap further. In ray-traced workloads, especially, its numbers are impressive for a mobile system, landing not far behind the 5080 desktop in multiple scenarios.


MSI Raider A18 HX GeekBench Benchmarks


In the Geekbench CPU and GPU benchmarks, the MSI Raider A18 HX demonstrates competitive performance, holding its own well against the powerful desktop 5080 and 5090 systems. The CPU results particularly highlight the strength of the mobile Ryzen platform, delivering strong multithreaded throughput that’s not far behind high-end desktops.
MSI Raider A18 HX System Benchmarks
| Score | Octane | Octane Multi Core | Speedometer | WebXPRT4 | VRay (vsamples) |
|---|---|---|---|---|---|
| MSI Raider A18 HX NO OC | 131,923 | 1,284,718 | 23.2 | 391 | 45198 |
| MSI Raider A18 HX OC +100MHz | 133536 | 1,333,151 | 23 | 399 | 45199 |
| 5090 Desktop | 70,020 | 731,415 | 17.8 | 443 | 23628 |
| 5080 Desktop | 142,355 | 1,409,793 | 47.62 | 461 | 54645 |
| Score | 7zip Total Time – Seconds | 7zip Total Compressing Speed – MB/s | 7zip Total Decompressing Speed – MB/s | Octanebench | Basemark GPU Overall Score -3840×2160 |
|---|---|---|---|---|---|
| MSI Raider A18 HX NO OC | – | – | – | 821.65 | 25669 |
| MSI Raider A18 HX OC +100MHz | 59.172 | 153.638 | 2490.795 MB | 824.63 | 25848 |
| 5090 Desktop | 45.891 | 105.021 | 1511.572 | 1614.12 | 50036 |
| 5080 Desktop | 45.906 | 201.719 | 3187.704 | 973.08 | 33264 |