The ‘Horizon Zero Dawn – Complete Edition’ PC Game Performance and Image Quality Review — All Video Settings Benchmarked
Horizon Zero Dawn finally arrived last week for PC from Guerrilla Games and Sony as a PS4 console port. Although it doesn’t make use of ray tracing technology, Horizon Zero Dawn – Complete Edition includes some nice additions for PC gamers. Some of these improvements include support for ultra-wide screens, high frame rates, an adjustable field of view, and remapping capabilities for keyboard, controller, and mouse. Also, the PC version contains certain significant and specific graphical enhancements over the console version of the game such as enhanced lighting and reflections.
It’s important to have a reliable in-depth review of the current and expected graphics performance of Horizon Zero Dawn. We offer an exhaustive review of its performance using the latest drivers with a high-end gaming PC using 1080p, 1440p and 2160p resolutions, and an IQ comparison of its major video graphics settings. We will make suggestions for an optimized graphics profile, as well as analyze the effects of using FPS limiters on performance to get the best 60 FPS gameplay experience.
Another recent PS4 to PC port, Death Stranding, also uses the same Decima graphics engine but is sponsored by NVIDIA and uses DLSS 2.0. Although technically not directly comparable despite sharing the same graphics engine, both ports have aroused a lot of expectation and interest as Horizon Zero Dawn is sponsored by AMD and is the first game to use the FidelityFX Single Pass Downsampler (SPD). The PC version of Horizon Zero Dawn together with additional digital content including its only expansion, ‘The Frozen Wilds,’ is available for Windows and is distributed through Steam and the Epic Games Store.
The Game
Horizon Zero Dawn is a highly enjoyable post-apocalypse game specially created for players who like the action RPG genre set in a huge and visually diverse open-world. It’s a very good RPG Lite that starts painfully slow, but it gets a lot better as it progresses. It’s a big-budget AAA game and the gameplay is well-polished
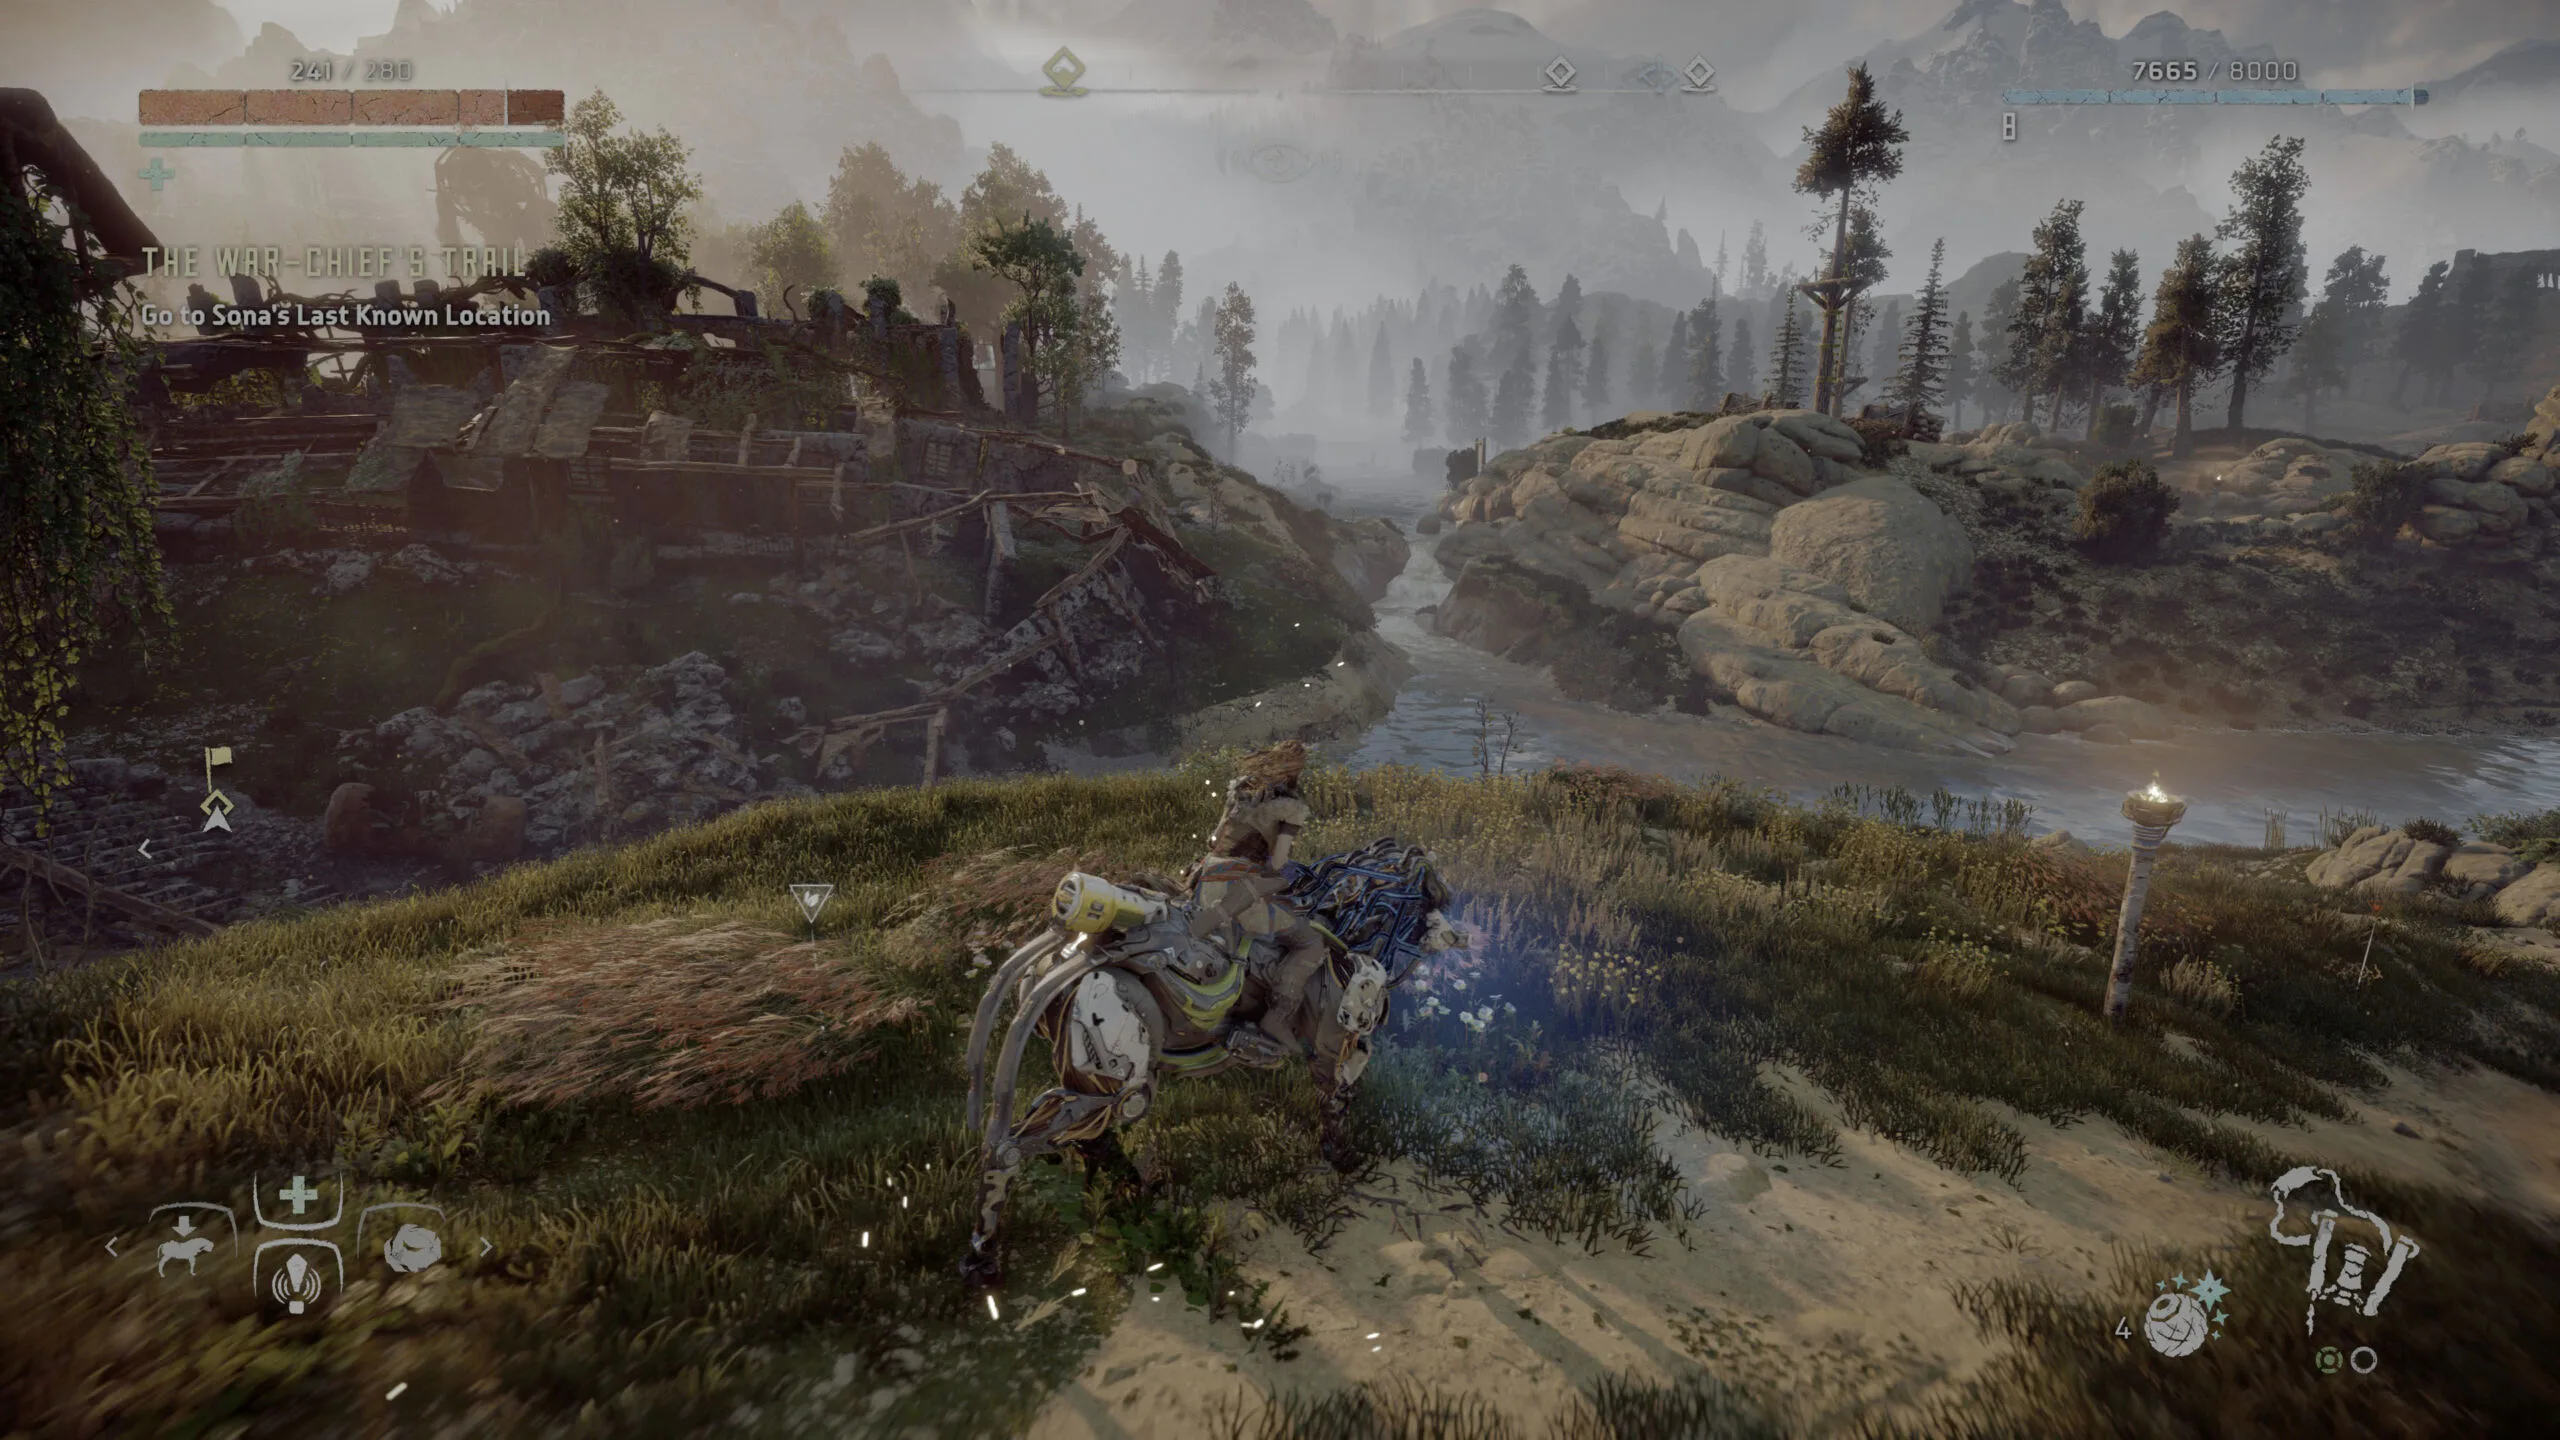 Although the visuals are very good, Horizon Zero Dawn is ported from an aging console platform. For what it is, it’s well-done although it is nothing ground-breaking, and it features a decent story, superb voice acting, and great audio that make the game an addicting journey by driving one on just to see what happens next. The gameplay, choices, and action are excellent since you can choose to make your warrior a stealth mistress or into a tank that can go toe to toe with the largest machines.
Horizon Zero Dawn is a huge game, and it does what all great action RPG Lite games do well. It offers loot, loot, and more loot, together with crafting and skills to choose from and upgrade to as your hero transforms from a little girl into a mighty warrior. One of BTR’s senior editors completed the main quest in 30 hours, but there is still a lot left to explore and many side missions to complete.
His PC also features an RTX 2080 Ti, but with an i9-10900K instead of my i9-9900K, and he got an almost identical performance. He also benchmarked an Anniversary Edition of the RX 5700 XT, averaging 36 FPS at 4K and 69 FPS at 1440P, which leads him to conclude that the game is better optimized for Radeons than for GeForce. It’s not surprising as Horizon Zero Dawn is an AMD-sponsored game that implements FidelityFX instead of DLSS for improved image quality.
We could not find much information about the FidelityFX implementation for Horizon Zero Dawn so we reached out to AMD, and they replied:
“FidelityFX is a series of open-source effects available on GPUOpen and will work across all GPUs. Horizon Zero Dawn is the first game to feature FidelityFX SPD (Single-Pass Downsampler), which utilizes asynchronous compute to accelerate texture mapping for more efficient post-processing, driving effects like bloom and screen space reflections faster without sacrificing framerates. The end-user is not able to toggle FidelityFX SPD on or off, and it is enabled by default.”
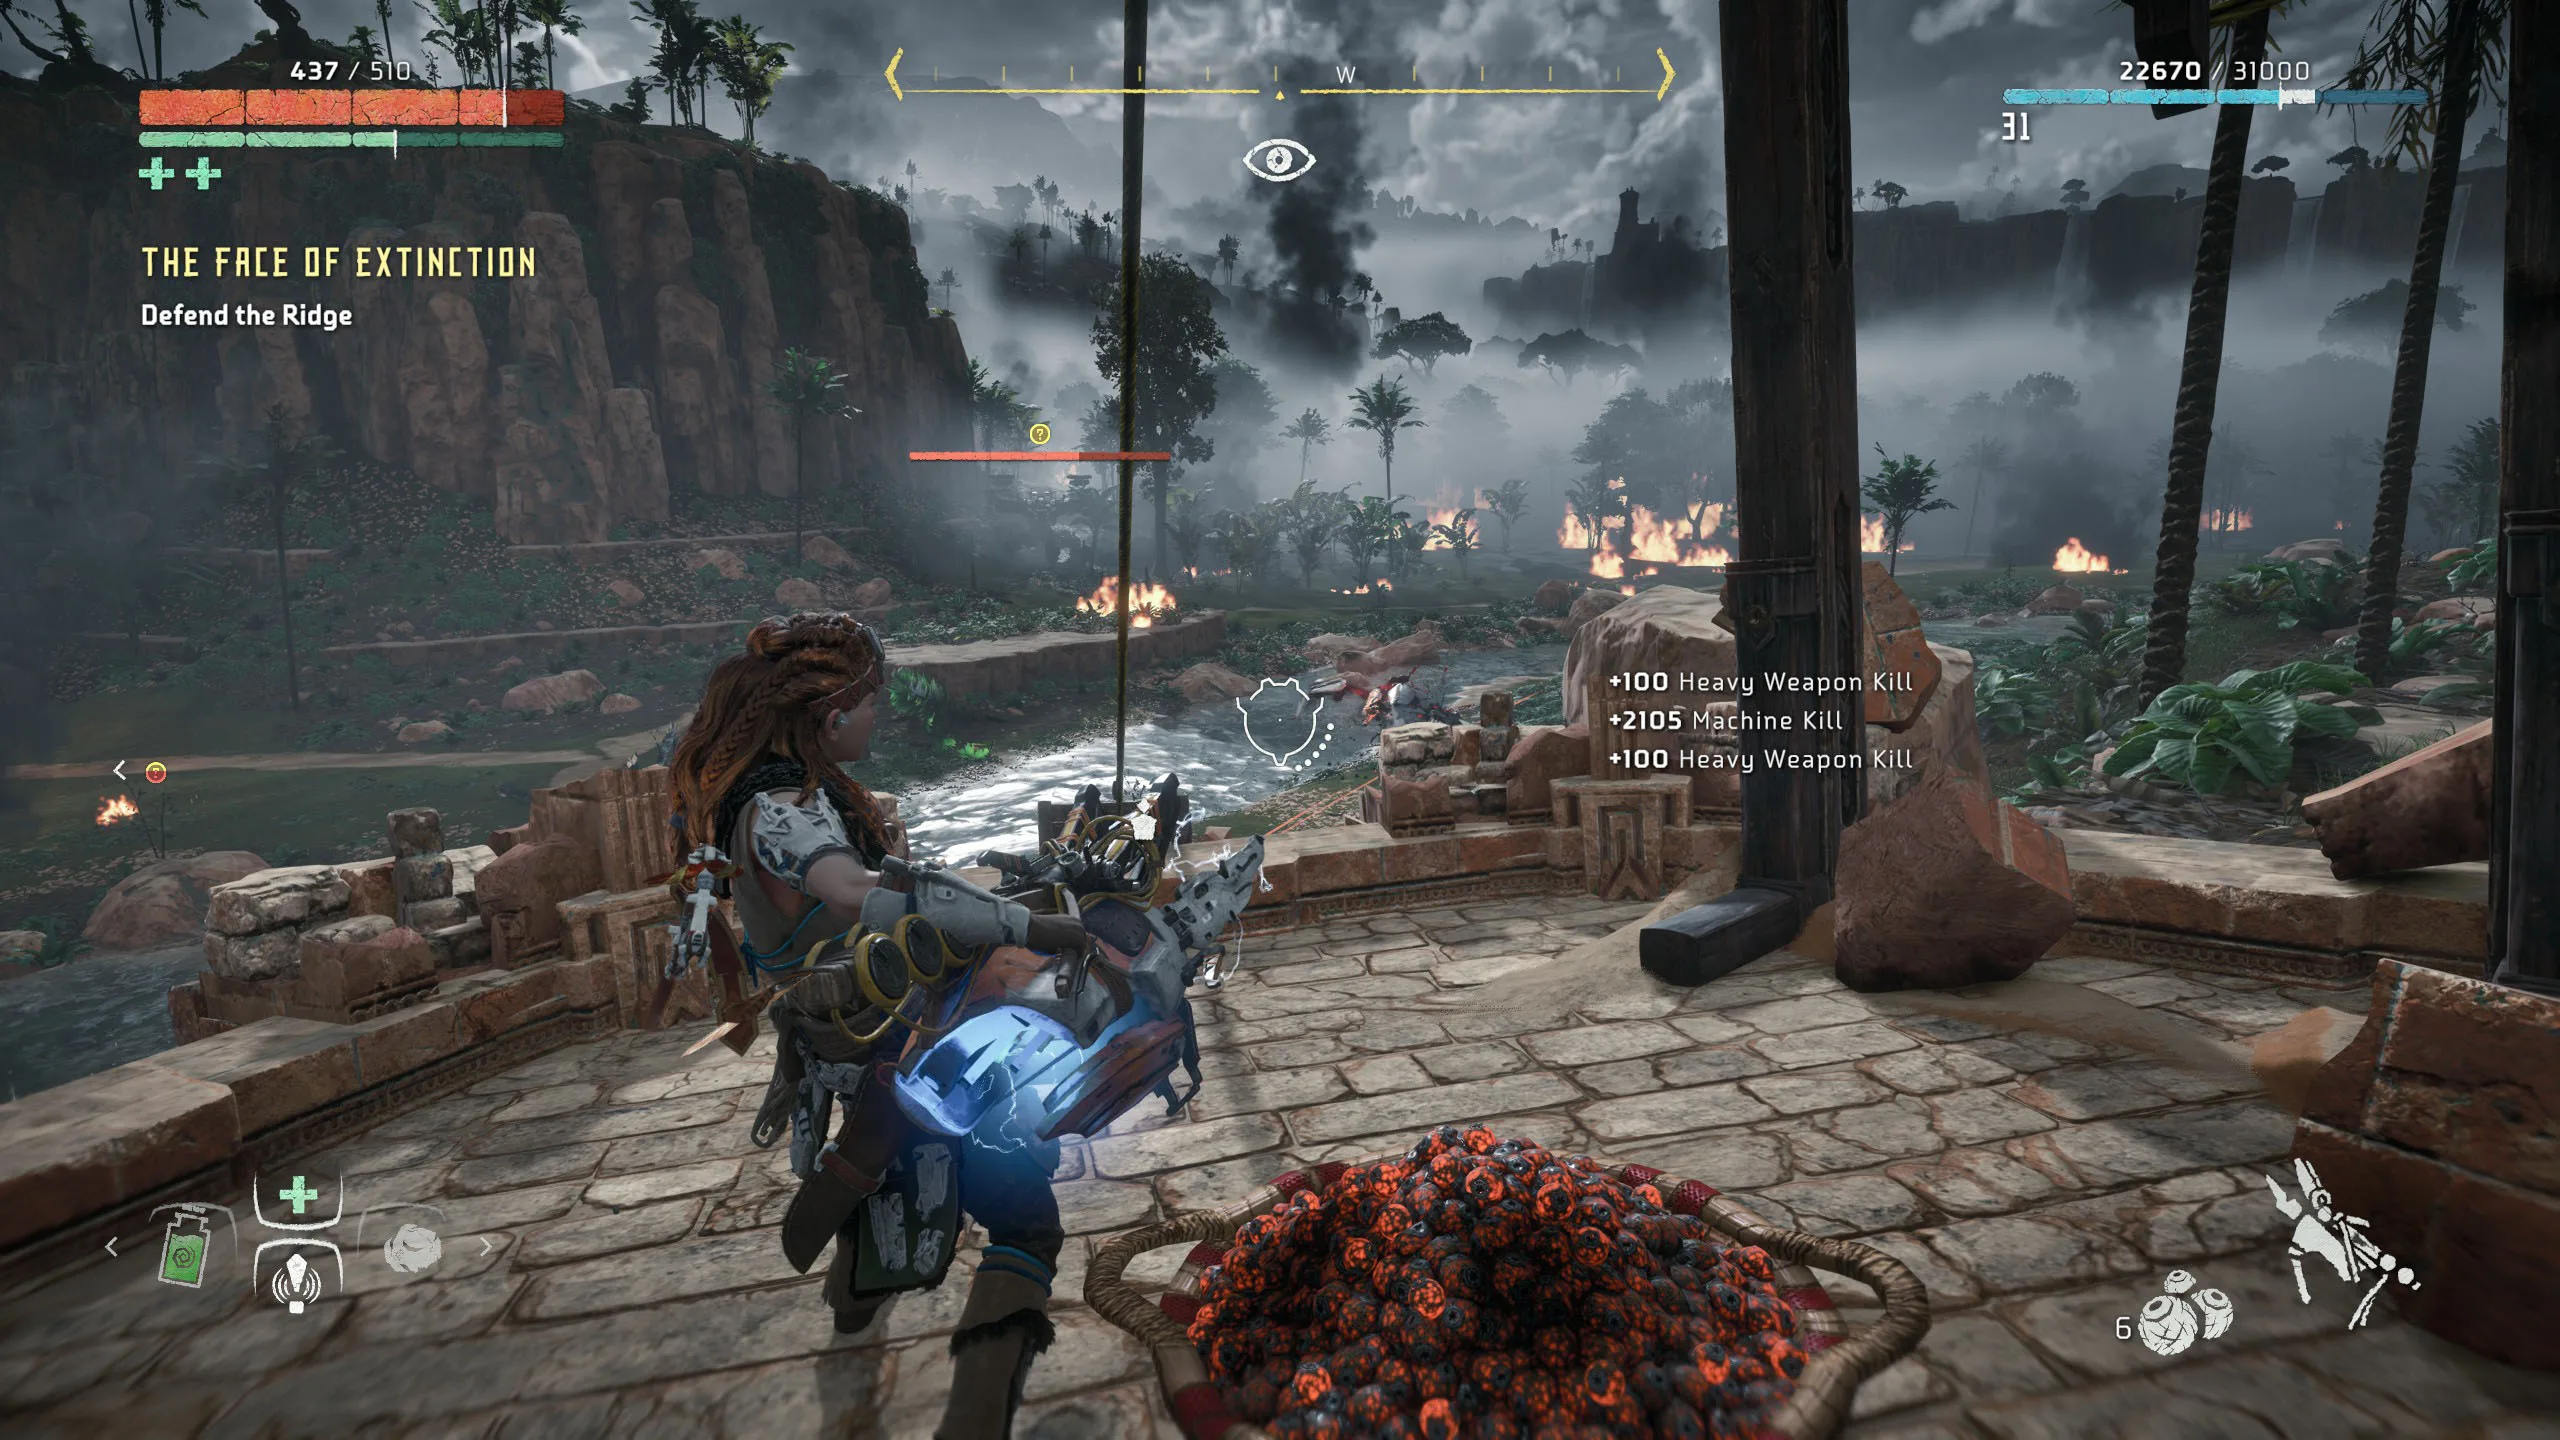
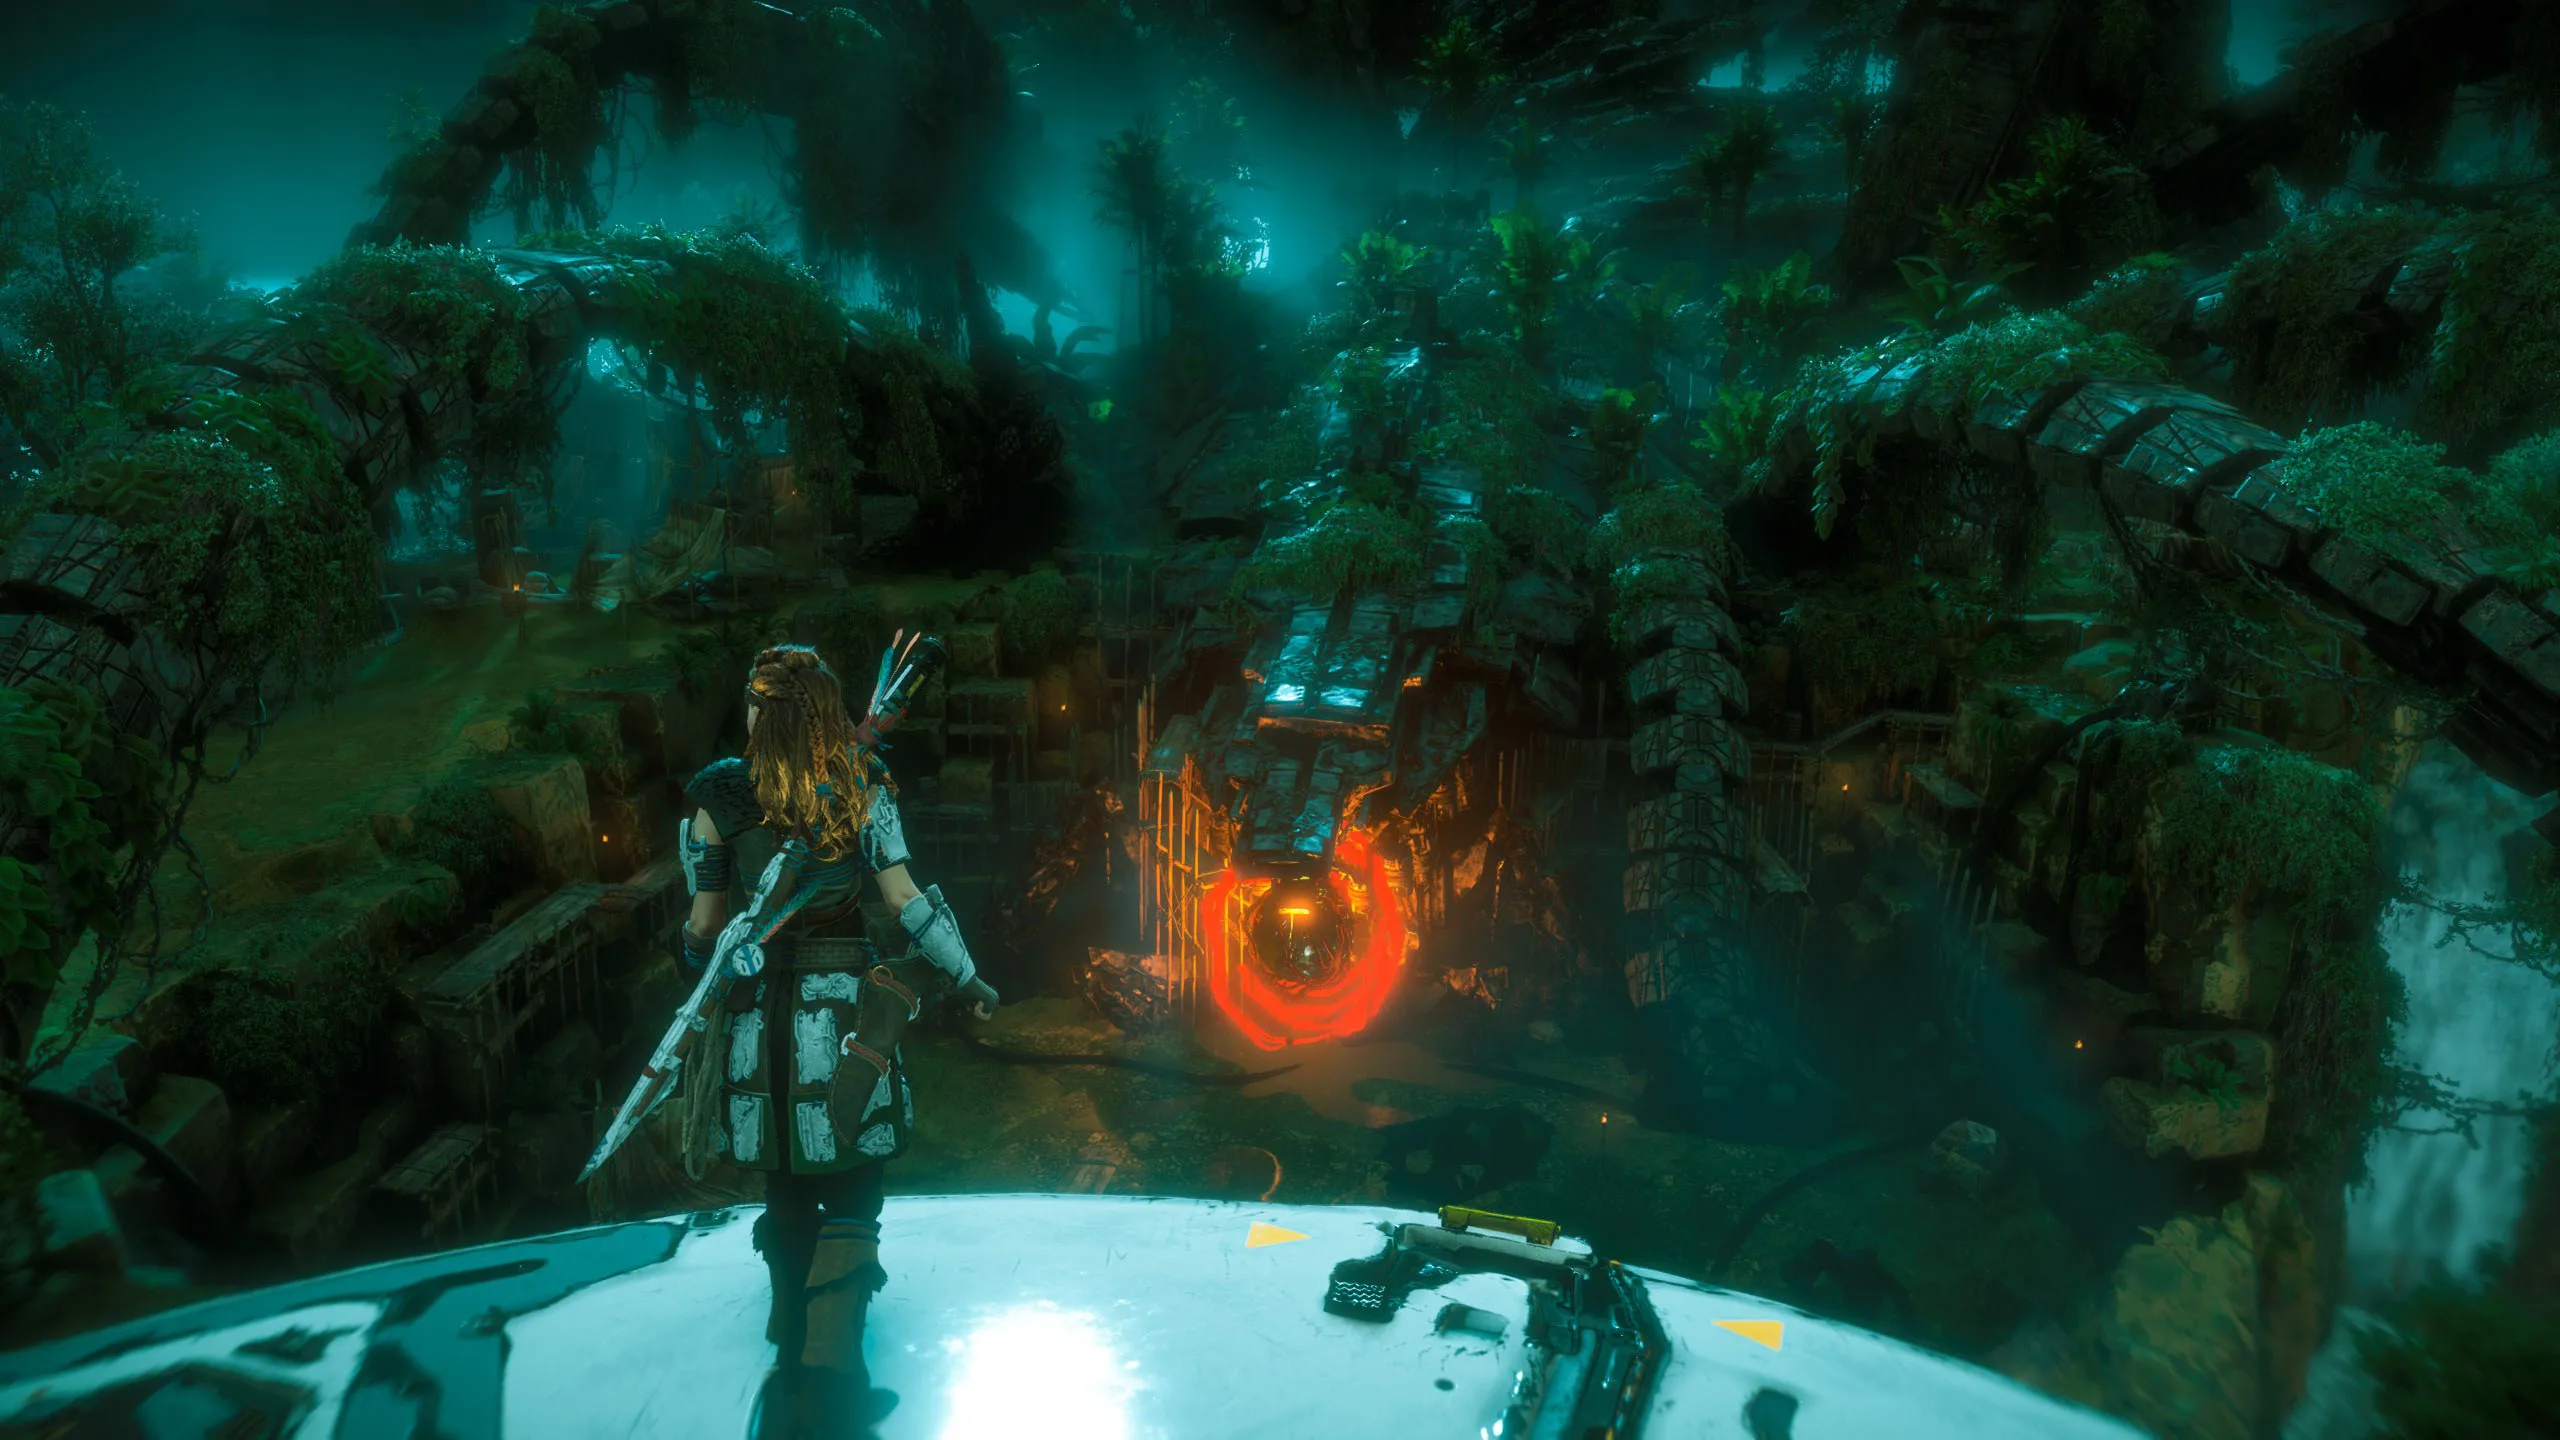
We both agree that Horizon Zero Dawn deserves an 8/10 as it is a lot of fun after an extremely slow start. After about 8 hours, the story comes together as it takes off on an amazing flight of fantasy complete with exciting battles versus huge AI-controlled machines culminating in an exciting and very satisfying ending to the main quest as you race to save your world from extinction against impossible odds.
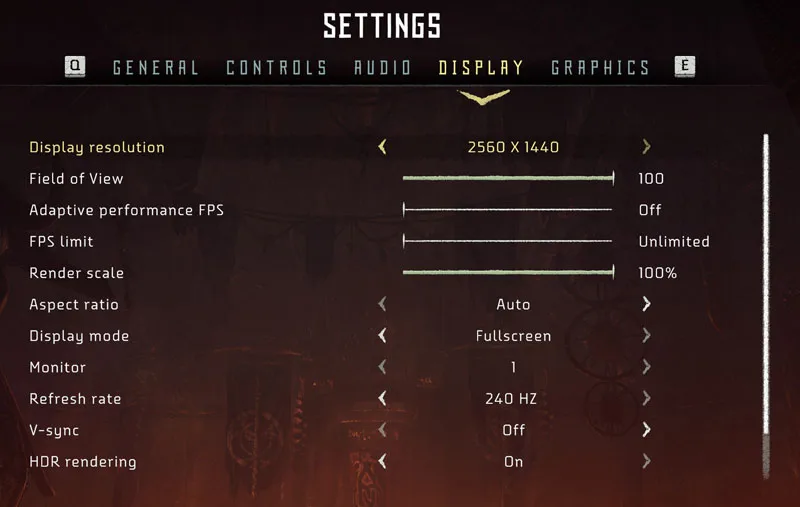
Here are the settings that we used except HDR off for benching:
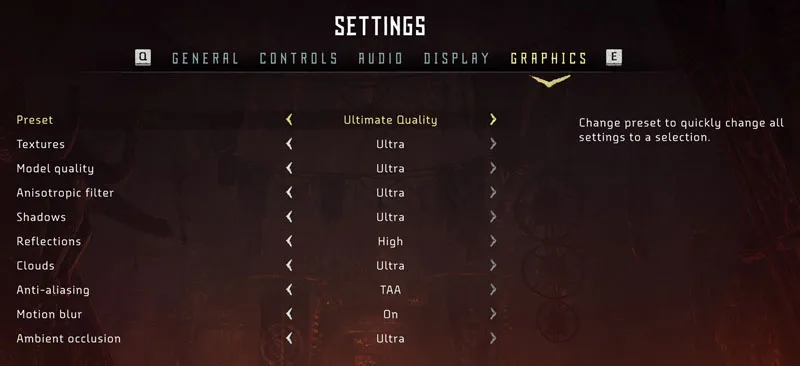
Our 4K DSR benchmarking specifically applies to NVIDIA cards (although AMD has VSR). But before offering the game’s performance data and charts of each different analysis scenario, it’s important to describe both the hardware and software configuration used in our testing as well as its analysis methodology on the next page.
Benching Methodology
Test Configuration – Hardware
- Intel Core i9-9900K (Hyper-Threading/Turbo boost on; stock settings)
- Gigabyte Z390 AORUS PRO motherboard (Intel Z390 chipset, v.F9 BIOS)
- Kingston HyperX Predator 32GB DDR4 (2×16GB, dual-channel at 3333 MHz CL16)
- Gigabyte GeForce RTX 2080 Ti Gaming OC 11GB, stock clocks
- Samsung 500GB SSD 960 EVO NVMe M.2 (both OS and HZD installed)
- Corsair RM750x, 750W 80PLUS Gold power supply unit
- ASUS ROG Swift PG279Q 27″ IPS 2560 x 1440 165Hz 4ms G-Sync Monitor (G-Sync Off, Fixed Refresh Rate On)
Test Configuration – Software
- GeForce Hotfix 451.85 drivers, High Quality, prefer maximum performance, DSR for simulating 4K resolution (x2.25-native), fixed refresh rate,
- V-Sync application controlled in the control panel, V-Sync Off in-game
- AA and AF controlled by the application, set according to video quality game presets
- Windows 10 64-bit Pro edition, latest updates v2004, Game Mode, Game DVR & Game Bar features Off
- GIGABYTE tools not installed
- Latest DirectX
- Horizon Zero Dawn, the latest version
- CapFrameX (CX), the latest version
- RivaTuner frame limiter
- NVIDIA Control panel frame limiter
- SpecialK mod frame limiter
Built-in Benchmark-related
- The built-in benchmark sequence is used. It is consistent and repeatable, and although not the most demanding scenario, it offers a good picture of average game performance
Frametimes Capture & Analysis tool-related
- CapFrameX is used for capturing and analyzing the relevant performance numbers obtained from each 174-second built-in benchmark sequence
- Consecutive runs until detecting 3 valid runs (no outliers) that can be aggregated by CapFrameX using the following method:
- “Aggregate excluding outliers”
- Outlier metric: Third, P0.2 (0.2% FPS percentile).
- Outlier percentage: 3% (the % the FPS of an entry can differ from the median of all entries before counting as an outlier).
- “Aggregate excluding outliers”
Note that DSR specifically applies to NVIDIA cards (although AMD uses VSR), and I did not test Radeons. A senior BTR editor supplied the RX 5700 XT performance results. Unless otherwise noted, all testing was done on the NVIDIA and Intel-based high-end gaming rig detailed above.
To compare and value the aggregated records in terms of percentages of Gain / Loss, the following thresholds are set to consider a certain % value as significant (not within the margin of error) for our benchmarking purposes:
- FPS Avg > 3% when valuing raw performance
- P1/P0.2 > 3% when valuing frame time consistency; custom formula:
[(Percentile_2 / AvgFPS_2) / (Percentile_1 / AvgFPS_1)] – 1} x 100
Let’s head to our performance charts.
Full HD (1080p) Performance
Full HD 1920×1080 is probably still the most common display resolution for PC gamers in 2020, and particularly for the lower to mid-end range PCs. However, it’s also probably a more CPU-bound scenario when considering high-end PC platforms such as the one we use to perform our Horizon Zero Dawn analysis.
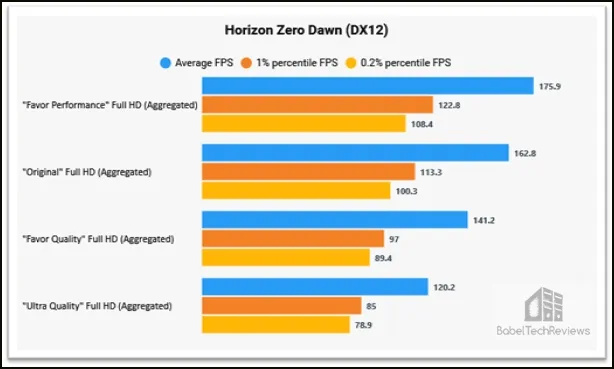
That said, the performance chart below shows the performance of each of the game’s individual graphics presets in terms of both raw performance (average FPS metric) and frametimes stability (P1 and P0.2 metrics).
From the chart, we see that the game progressively scales its performance on this resolution when going from the highest graphics preset to the lowest one in terms of both image quality and its use of GPU resources. In fact, we found that you can expect significant average FPS performance gains dropping from a higher quality graphics preset to a lower one. However, the same doesn’t occur with the same level of intensity in terms of frametimes consistency by looking at the corresponding P1 and P0.2 aggregated values. In this case, the increases are significant when considered by themselves and are also much lower when going from “Ultimate” or ultra to lower quality presets.
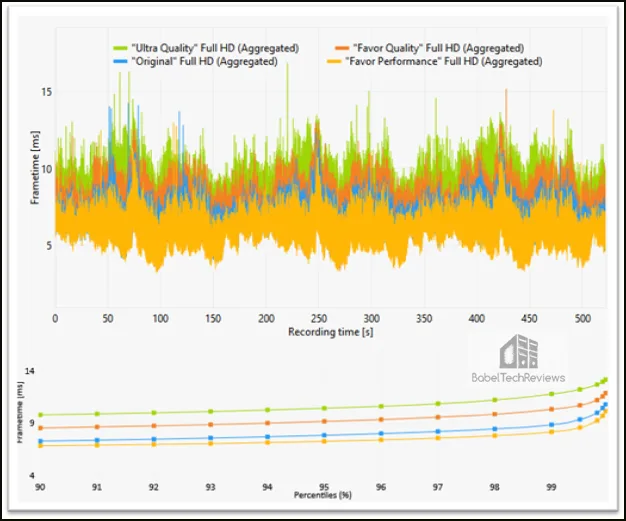
Finally, when we put the P1 and P0.2 values of each preset in relation to their corresponding and relative average FPS values, we also found a trend of improving frametimes stability from the “Favor Performance” preset to ultra or “Ultimate Quality”; the latter being the most consistent or steadiest quality preset at full HD resolution. This is also confirmed by the frametimes (ms) comparative chart below.
Next, we will perform some relevant dual comparisons between graphics game presets that will allow us to identify the recommended and most balanced presets in terms of performance/IQ when moving from a lower to higher quality preset. Here is the Favor Performance Preset (low) compared with Original (medium).
[twenty20 img1=”18265″ img2=”18266″ offset=”0.5″ before=”Original/Medium Preset” after=”Favor Performance/Low Preset”]
The change from “Favor Performance” (low) to “Original” (medium) is probably the most noticeable improvement among the presets in terms of IQ.
“Original” vs. “Favor Performance” – Full HD (1080p)
| Favor Performance | Original | % Gain / Loss | |
| Avg FPS | 175.9 | 162.8 | -7.75 |
| P1 | 122.8 | 113.3 | -0.31* |
| P0.2 | 108.4 | 100.3 | -0.03* |
*[(Percentile_2 / AvgFPS_2) / (Percentile_1 / AvgFPS_1)] – 1} x 100
In this comparison, the “Original” or medium preset is recommended. Although it offers lower performance in terms of average FPS (7.75% lower than “Favor Performance” or low), it offers an equivalent level of frametimes consistency with better image quality.
Here is the Favor Quality (high) Preset compared with Original (medium).
[twenty20 img1=”18266″ img2=”18264″ offset=”0.5″ before=”Medium Preset” after=”High Preset”]
The difference is still noticeable but less striking than in the prior IQ comparison.
“Favor Quality” vs. “Original” – Full HD (1080p)
| Original | Favor Quality | % Gain / Loss | |
| Avg FPS | 162.8 | 141.2 | -13.26 |
| P1 | 113.3 | 97.0 | -1.29* |
| P0.2 | 100.3 | 89.4 | +2,76* |
*[(Percentile_2 / AvgFPS_2) / (Percentile_1 / AvgFPS_1)] – 1} x 100
Here we have a similar situation to the previous one: an expected significant average FPS regression in exchange for a similar level of smoothness and better IQ when going from the “Original” medium preset to “Favor Quality” or low. So, because the average FPS on “Favor Quality” is still high (141.2), we would recommend using it over “Original”.
Here is the Ultimate (ultra) Preset compared with the high (Favor Quality) preset.
[twenty20 img1=”18267″ img2=”18264″ offset=”0.5″ before=”Ultimate/Ultra Preset” after=”High Preset”]
This is the case where the difference in image quality between the presets is the least noticeable. There is not much difference between the two presets in IQ.
“Ultimate Quality” vs. “Favor Quality” – Full HD (1080p)
| Favor Quality | Ultimate Quality | % Gain / Loss | |
| Avg FPS | 141.2 | 120.2 | -14.87 |
| P1 | 97.0 | 85.0 | +2.94* |
| P0.2 | 89.4 | 78.9 | +3.67* |
*[(Percentile_2 / AvgFPS_2) / (Percentile_1 / AvgFPS_1)] – 1} x 100
Here we see a comparable situation, but in this case we found a significant improvement in frametime consistency (3.67% gain in the 0.2% percentile FPS value) going to the “Ultimate” or ultra present from “Favor Quality” or high.
WQHD (1440p) Performance
Next, we review Horizon Zero Dawn’s performance using the 2560×1440 (1440p) or WQHD display resolution which is the native resolution of the G-Sync monitor used to conduct this performance analysis.
The performance chart below shows the performance of each of the game’s individual graphics presets in terms of average FPS numbers for the raw performance, and P1 and P0.2 metrics for frametimes stability.
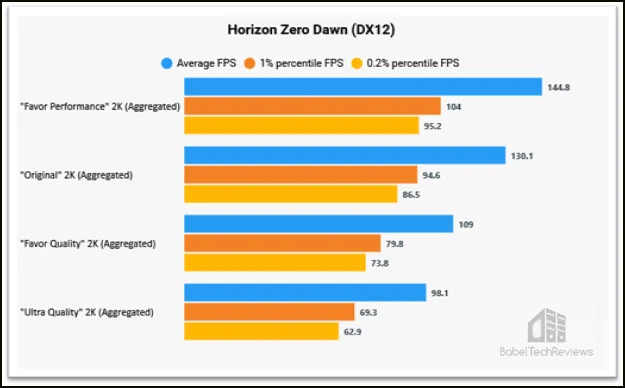 Once again, the above results showed how well and progressively the game scales performance on 1440p resolution when going from “Ultimate Quality” or ultra to “Favor Performance” or high in terms of both IQ and GPU workload levels. In fact, we again found great average FPS gains and significant P1 and P0.2 improvements at each preset level moving from “Ultimate” to “Favor Performance”.
However, this time it’s interesting to note that the frame pacing and stability levels are significantly better across all graphics presets than at 1080p. This is because we can see the relative gap sizes or “Deltas” between the FPS low percentiles numbers and their corresponding FPS values across all presets when we compare them to the corresponding values at the full HD display resolution.
Focusing on the 1440p scenario only, and according to the frametimes (ms) chart below, on this testing scenario the steadiest or smoothest graphics preset with a high IQ level is high or “Favor Quality” and not “Ultimate” or ultra. It’s the same as at 1080p, and “Ultimate” in this case offers the most inconsistent frametimes.
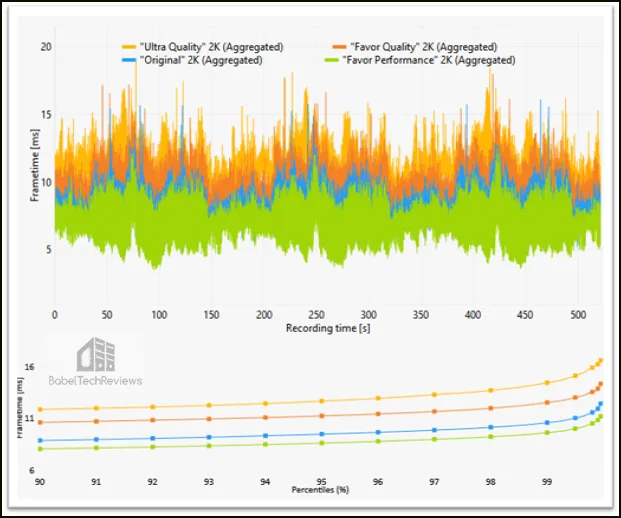 We next present some dual comparisons between the graphics game presets that allow you to identify the best and most balanced presets in terms of performance/IQ for WQHD when you go from a lower to a higher quality preset.
IQ Comparisons (1440p) – All Major Presets
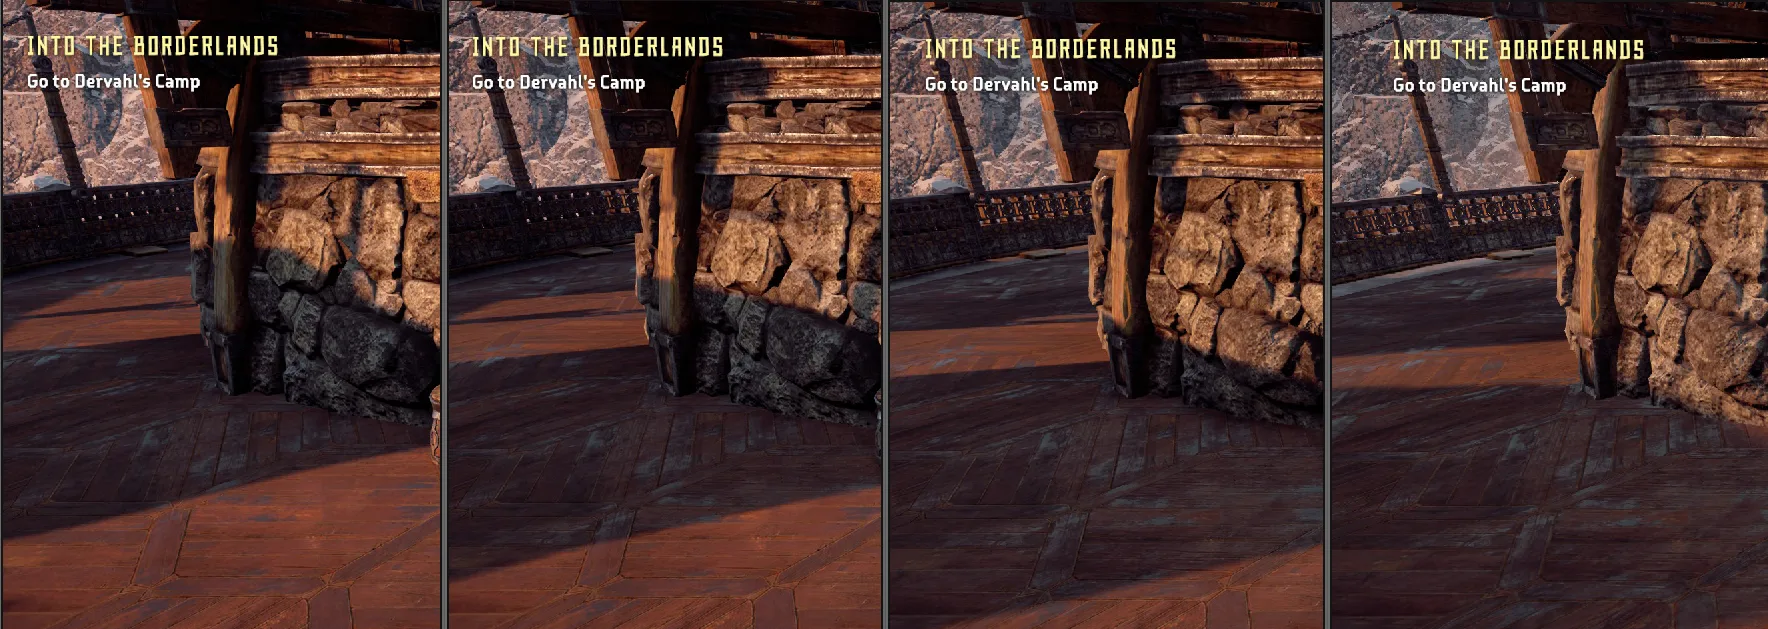
Here are enlarged images that show the visual degradation from changing the quality presets. From left to right: Ultimate (ultra), Favor Quality (high), Original (PS4/medium), and Favor Performance (low).
As you can see, there isn’t a huge difference between each step-down. Here is another example.
The PS4 is an aging console and even an enhanced graphics port cannot compete visually with many PC games that are designed primarily for the PC. For example, its shadows do not appear to be particularly well-implemented although they take a performance hit.
“Original” vs. “Favor Performance” – 1440p
| Favor Performance | Original | % Gain / Loss | |
| Avg FPS | 144.8 | 130.1 | -10.15 |
| P1 | 104.0 | 94.6 | +1.24* |
| P0.2 | 95.2 | 86.5 | +1.13* |
*[(Percentile_2 / AvgFPS_2) / (Percentile_1 / AvgFPS_1)] – 1} x 100
These comparative results suggest that the “Original” (medium) preset should be recommended over “Favor Performance” (low) because, despite the expected significant regression in average FPS, the “Original” preset will guarantee equivalent smoothness with better IQ at the same time.
“Favor Quality” vs. “Original” – 1440p
| Original | Favor Quality | % Gain / Loss | |
| Avg FPS | 130.1 | 109.0 | -16.22 |
| P1 | 94.6 | 79.8 | +0.68* |
| P0.2 | 86.5 | 73.8 | +1.83* |
*[(Percentile_2 / AvgFPS_2) / (Percentile_1 / AvgFPS_1)] – 1} x 100
Here are comparative numbers that also lead us to recommend the “Favor Quality” (high) preset over “Original” (medium). In fact, “Favor Quality” offers both a pretty similar level of performance consistency plus better IQ.
“Ultimate Quality” vs. “Favor Quality” – 1440p
| Favor Quality | Ultimate Quality | % Gain / Loss | |
| Avg FPS | 109.0 | 98.1 | -10.00 |
| P1 | 79.8 | 69.3 | -3.51* |
| P0.2 | 73.8 | 62.9 | -5.30* |
*[(Percentile_2 / AvgFPS_2) / (Percentile_1 / AvgFPS_1)] – 1} x 100
The results of this comparison confirm that on this preset setting, “Ultimate” or ultra is significantly worse than “Favor Quality” (high) in terms of stability. Therefore, “Favor Quality” is the recommended graphics preset to achieve the best performance with the best possible IQ.
4K DSR (2160p) Performance
We used Nvidia’s DSR technology to simulate a 4K (3840×2160/2160p) rendering resolution to compare the performance of each Horizon Zero Dawn graphics preset on this GPU-limited scenario. We proceed the same way for 4K as for our 1080p and 1440p testing.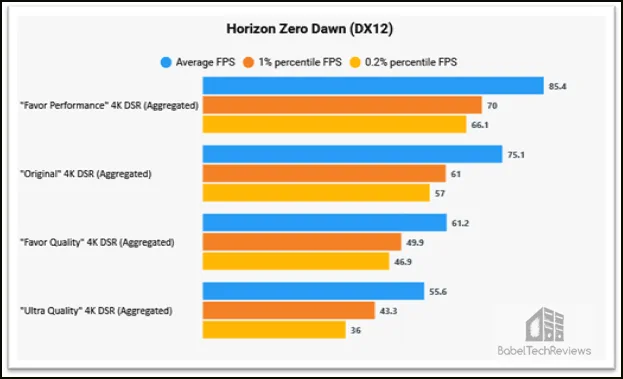
The chart below shows how the game progressively scales its performance on 4K resolution when going from the ultra or “Ultimate Quality” preset to “Favor Performance” or low. Using 4K, we see that the improvements in average FPS and with low percentile FPS are still significant, especially when going from “Favor Quality” (high) to “Original” (medium), and/or from “Original” to “Favor Performance” low).
It should be noted that moving from “Ultimate Quality” to “Favor Quality” made a great difference in frametimes consistency since the “Favor Quality” preset performance is significantly smoother and more consistent than by using “Ultimate Quality”.
The latter is also supported and confirmed by the frametimes (ms) charts below.
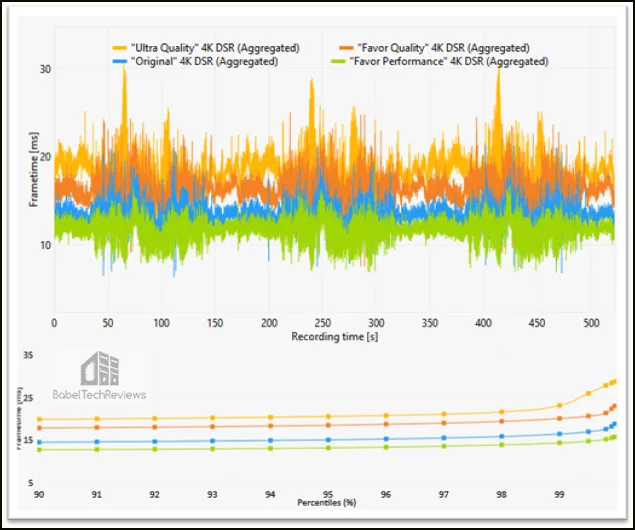 Finally, we next show some key dual comparisons between the graphics game presets that will allow you to identify the recommended and most balanced presets in terms of performance/IQ on using 4K rendering when moving from a lower to higher quality preset.
“Original” vs. “Favor Performance” – 4K DSR (2160p)
| Favor Performance | Original | % Gain / Loss | |
| Avg FPS | 84.5 | 75.1 | -11.12 |
| P1 | 70.0 | 61.0 | -1.95* |
| P0.2 | 66.1 | 57.0 | -3.43* |
*[(Percentile_2 / AvgFPS_2) / (Percentile_1 / AvgFPS_1)] – 1} x 100
In this case, the “Favor Performance” (low) preset was better in performance – both raw performance and stability-wise – but the IQ dropped greatly as well, so it’s difficult to give a neat recommendation. There simply isn’t a balanced choice available for this comparison scenario, so choose the graphics preset that best matches your IQ/performance preferences or needs.
“Favor Quality” vs. “Original” – 4K DSR (2160p)
| Original | Favor Quality | % Gain / Loss | |
| Avg FPS | 75.1 | 61.2 | -18.51 |
| P1 | 61.0 | 49.9 | +0.38* |
| P0.2 | 57.0 | 46.9 | +0.97* |
*[(Percentile_2 / AvgFPS_2) / (Percentile_1 / AvgFPS_1)] – 1} x 100
Here it is also difficult to give a recommendation. While both presets, “Original” (medium) and “Favor Quality” (high), will give almost identical level of frametimes consistency, one will also experience a major performance regression in terms of average FPS but with better IQ, moving from “Original” to “Favor Quality”. If you prefer to attempt to achieve a steady 4K 60+ FPS experience while keeping an acceptable IQ level, the “Original” preset is your best choice.
“Ultimate Quality” vs. “Favor Quality” – 4K DSR (2160p)
| Favor Quality | Ultimate Quality | % Gain / Loss | |
| Avg FPS | 61.2 | 55.6 | -9.15 |
| P1 | 49.9 | 43.3 | -4.49* |
| P0.2 | 46.9 | 36.0 | -15.51* |
*[(Percentile_2 / AvgFPS_2) / (Percentile_1 / AvgFPS_1)] – 1} x 100
The “Ultimate” or ultra preset leads to a major overall performance regression. Especially remarkable is the performance loss in the P0.2 value (15.51%). Therefore, if you want maximum IQ with a near-average 60 FPS experience, “Favor Quality” (high) should be preferred over “Ultimate”.
All Graphics Settings Benchmarked
In this section, we will look at which Horizon Zero Dawn graphics settings are the best suited to lower from “Ultimate” quality to get significant FPS gains in case you need or want to boost its performance.
We identified the most demanding in-game graphics settings by first setting a baseline benchmark figure with all settings at maximum to exactly match our results for the “Ultimate Quality” preset. From there, we lower each of the individual graphic options to its lowest/off setting and we compare to the baseline to determine how it influences performance to get the best possible IQ with an optimal trade-off in terms of average FPS performance.
| FPS Avg | % Gain* | |
| “Textures” Lowest | 98.6 | +0.5 |
| “Model Quality” Lowest | 101.2 | +3.2 |
| “AF” Lowest | 98.1 | 0.0** |
| “Shadows” Lowest | 103.3 | +5.3 |
| “Reflections” Lowest | 109.3 | +11.4 |
| “Clouds” Lowest | 107.1 | +9.2 |
| “AA” SMAA | 98.5 | +0.4 |
| “AA” Camera-based | 98.1 | 0.0 |
| “AA” FXAA | 99.8 | +1.7 |
| “AA” Off | 100.2 | +2.1 |
| “Motion Blur” Off | 98.4 | +0.3 |
| “AO” Lowest | 103.1 | +5.1 |
*% FPS (avg) gain over our “Ultimate Quality” preset baseline of 98.1 FPS (avg)
** This result was probably because, as the developers acknowledged, the AF setting does not currently work due to a game bug that will be patched in a future game update.
From the graphics settings performance breakdown table above, Horizon Zero Dawn just doesn’t have many graphics settings to tinker with. However, there are a couple of settings that will greatly influence performance like “Reflections” and “Clouds” at 11.4% and 9.2% average FPS performance gain respectively.
Although “Reflections” and “Clouds”, are undoubtedly the settings that provide the greatest average FPS performance gain when lowered, there are three other settings, “Shadows” (5.3% gain), “Ambient Occlusion”(5.1% gain), and “Model Quality” (3.2% gain), which are also associated with lesser but significant performance gains if you turn them down.
1440p Optimized Video Settings vs. All Video Presets
We decided to play with the above graphics settings to see which ones we should lower to get a significant average FPS improvement. Ideally, we aim for an optimal combination of settings at 1440p that will provide a mix of High/Ultra IQ settings with a boost in performance (both raw performance-wise and stability-wise), particularly when compared to both “Favor Quality” (high) and “Ultimate Quality” (ultra) presets.
The “Optimized Settings” custom profile we created and benchmarked are as follows:
- Textures: Ultra
- Model quality: High
- Anisotropic Filtering: Ultra
- Shadows: High
- Reflections: High
- Clouds: High
- Anti-aliasing (AA): TAA
- Motion blur: On
- Ambient Occlusion: High
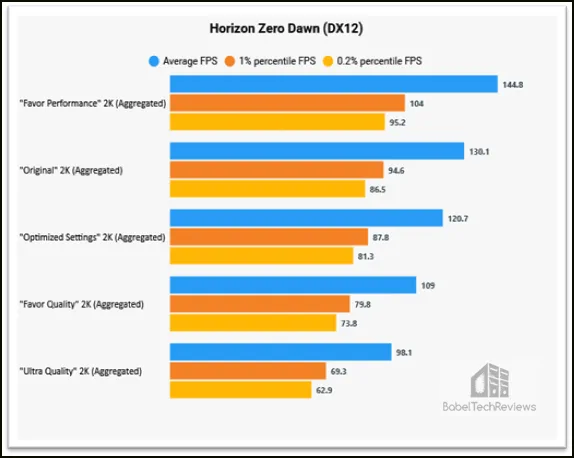
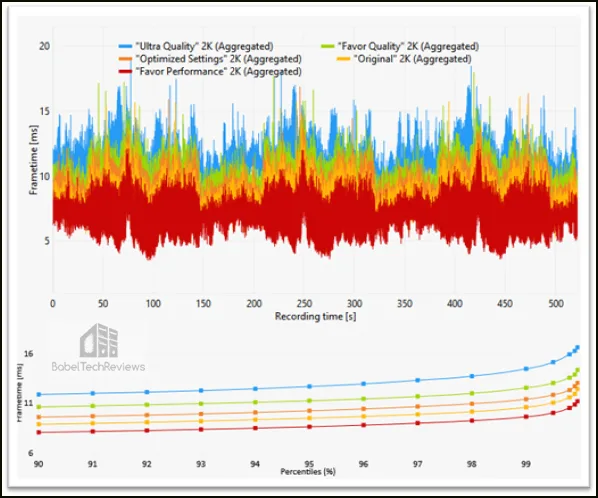 From the performance charts above, the “Optimized Settings” at 1440p that we recommend will give you significantly better performance than “Favor Quality” (high), but with an IQ level between “Ultimate” (ultra) and “Favor Quality” at the same time.
Now, here are some interesting dual comparisons between our suggested “Optimized” graphics profile and the “Original” (medium), “Favor Quality” (high), and “Ultimate Quality” (ultra) presets. This will allow us to identify the boundaries of our “Optimized” mix of game graphics settings, both performance, and IQ-wise.
“Optimized settings” vs. “Original” – 1440p
| Original | Optimized settings | % Gain / Loss | |
| FPS avg | 130.1 | 120.7 | -7.22 |
| P1 | 94.6 | 87.8 | +0.04* |
| P0.2 | 86.5 | 81.3 | +1.31* |
*[(Percentile_2 / FPSavg_2) / (Percentile_1 / FPSavg_1)] – 1} x 100
In this comparison scenario, our “Optimized” profile shows an equivalent level of frame time consistency with significantly better image quality, so the “Optimized settings” are recommended over the “Original” graphics preset.
“Optimized Settings” vs. “Favor Quality” – 1440p
| Favor Quality | Optimized settings | % Gain / Loss | |
| FPS avg | 109.0 | 120.7 | +10.73 |
| P1 | 79.8 | 87.8 | -0.64* |
| P0.2 | 73.8 | 81.3 | -0.52* |
*[(Percentile_2 / FPSavg_2) / (Percentile_1 / FPSavg_1)] – 1} x 100
In this case, with the “Optimized Settings,” you will get both a great improvement in average FPS with high image quality that is somewhere between the “Favor Quality” and “Ultimate” IQ levels.
“Optimized settings” vs. “Ultra Quality” – 1440p
| Ultimate Quality | Optimized settings | % Gain / Loss | |
| FPS avg | 98.1 | 120.7 | +23.04 |
| P1 | 69.3 | 87.8 | +2.97* |
| P0.2 | 62.9 | 81.3 | +5.05* |
*[(Percentile_2 / FPSavg_2) / (Percentile_1 / FPSavg_1)] – 1} x 100
Finally, and considering the best balance between IQ and performance, these results also confirm that the use of the “Optimized settings” profile is superior and preferable to the “Ultimate” or ultra graphics present at 1440p.
Getting the Steadiest 60 FPS Experience: Benchmarking FPS Limiters (in-game, NV CP, RTSS, and SpecialK)
A good way to improve the smoothness and frametimes consistency and to improve and control its generally high variability is to use an effective and optimal method of limiting the framerates. Below we offer a comparison of Horizon Zero Dawn performance, using our “Optimized settings” along with some of the best-known external FPS limiters as well as the in-game limiter, to maintain the best gameplay experience at 60 FPS.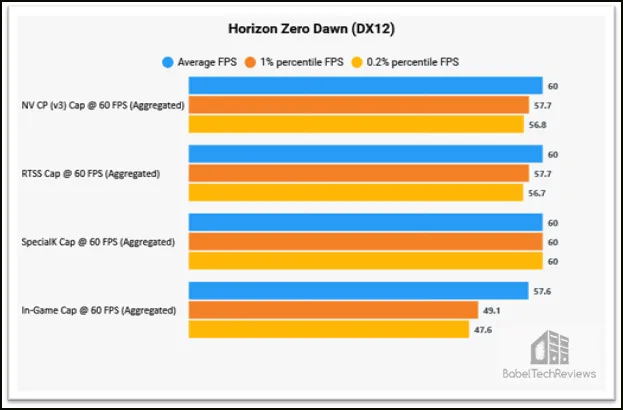
First of all, the in-game limiter does not work properly, and it is the worst limiting method in terms of performance since it does not guarantee an average of 60 FPS (57.6 avg FPS). It also offers particularly low P1 and P0.2 values that are far below our 60 average FPS target.
Both NVIDIA’s Control Panel (“Max Frame Rate” in the Control Panel settings) and RivaTuner Statistics Server (RTSS) limiters work as intended, averaging 60 FPS, and they each performed quite well offering P1 and P0.2 values (~56-58s) that were close to the 60 FPS set target. Therefore both FPS limiters may be considered equivalent in terms of performance.
Special mention should be made of the limiter featured by the popular SpecialK mod since through its proper use and configuration, it offers performance and efficiency results that border on perfection. In fact, with the SpecialK limiter method we got the ideal target performance scenario, 60-60-60, that is, Avg 60 FPS, P1 60 FPS, and P0.2 60 FPS.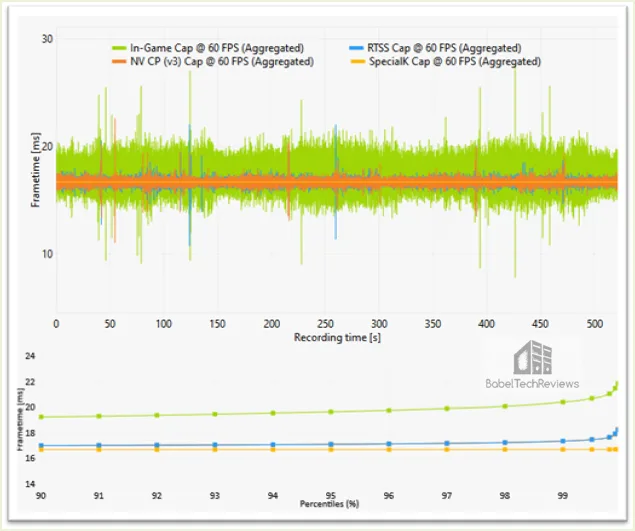
All of these considerations highlight SpecialK superiority as the best FPS limiter for Horizon Zero Dawn and are also confirmed by the frametimes (ms) comparison charts above. Let’s head to our conclusion.
Conclusion
Horizon Zero Dawn on PC is a good game overall, but with some weak points and room for improvement in terms of performance optimization.
The gameplay is highly enjoyable, especially for those players who like the open-world action RPG genre. Horizon Zero Dawn is a very good big-budget AAA RPG Lite that gets a lot better as it progresses. The game is not ground-breaking but it is fun and probably the equivalent of a big Summer blockbuster movie. It will become a popular series judging by the post-credits scene.
However, its performance and current level of optimization, although is not the worst we have seen from a PS4 port to a PC and far from perfect, shows some noteworthy and fixable performance faults. We refer to its broken AF settings and some briefly recurrent stutter during general world traversal and other bugs including camera swaps after cutscenes. From our testing sessions, we notice visible brief stutters during the built-in benchmark runs and can confirm that they are still present in the game although they are rarer. Fortunately, G-Sync or FreeSync works well to minimize them. The minor stutters we notice are reflected by some very low minimum numbers we encountered occasionally during the benching runs.
These optimization problems, related to a greater or lesser extent to its level of performance polish, detract from an otherwise mostly acceptable and fairly consistent performance level. We believe that the AF and stutter issues are game bugs and Horizon Zero Dawn can use more-fine tuning. It also appears to be better performance optimized for Radeons as it is an AMD-sponsored game. NVIDIA’s driver team probably has further optimization work to do. All in all, the developers have quickly acknowledged the issues and announced that they consider them as a high priority and to be fixed in a future game patch.
Here is the summary of our main performance results plus recommendations:
- Overall, and among the different graphic presets that the game offers, it is highly recommended to use the “Favor Quality” (high) preset for both the most consistent and stable performance experience and a high IQ.
- The only exception to using “Favor Quality” (high) is with the Full HD resolution, in which “Ultimate” (ultra) provided significantly better stability results and the best IQ.
- We recommended a custom “Optimized” settings profile, based on a mix of high and ultra in-game graphics settings, that provide a good boost in performance along with high IQ.
- For the best 60 FPS gameplay experience, avoid the in-game limiter and use the SpecialK’s FPS limiter for optimal results. Alternatively, if you do not want to use SpecialK, RTSS, or NVIDIA’s Control Panel limiters both performed similarly and quite well.
We recommend Horizon Zero Dawn as worth buying and playing – an 8/10 – and hope our first of many performance reviews will be helpful to you. Please comment below.
***
Rodrigo González (aka “RodroG”) is an enthusiast gamer interested especially in shooter games, open-world role-playing games, and software and hardware benchmarking. He is the author of the NVIDIA WHQL Driver Performance Benchmarks Series and founder and moderator of the r/allbenchmarks community on Reddit.

Comments are closed.