The EVGA GTX 1660 Ti XC Black Overclock Showdown vs. the RX Vega 56 & RX 590 Red Devils and vs. the GTX 1070 FE using 40 games
This overclocking showdown is the follow-up to BTR’s launch review of the EVGA GTX 1660 Ti XC Black versus the PowerColor Red Devils RX 590 and RX Vega 56, and versus the GTX 1070. Today we have optimized and maxed-out all individual overclocks with all performance options set to their highest limits to get the most performance from each card.
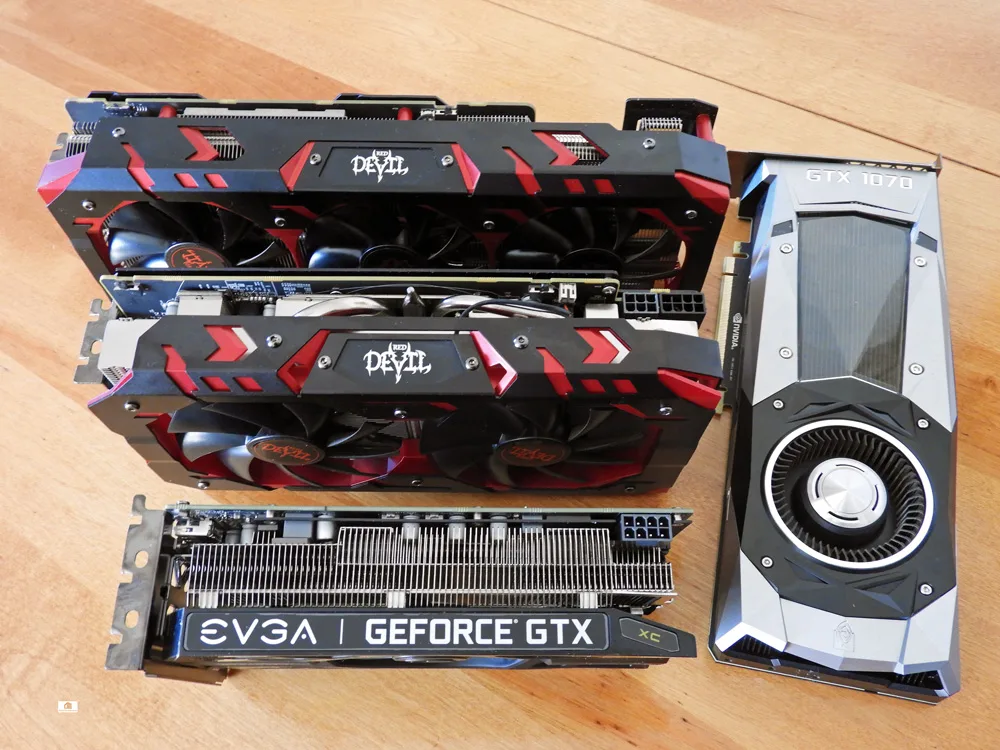
At stock, the GTX 1660 Ti won nearly all of the 40 games we tested over the Red Devil RX 590, and it also beat the GTX 1070, but it fell short of the premium Red Devil RX Vega 56’s performance. This time, we will overclock all four cards manually each as far as they will go to see where they stand in relation to each other and to see if anything changes.
The GTX 1660 Ti OC
We found our own final stable manual overclock was much higher than Precision X1’s +114MHz scan recommendation. We added 175MHz to the core to boost the clocks close to 2050MHz. We also added 800MHz to the GDDR6 memory overclock, and although it could probably go higher, we found that our core overclock began to destabilize possibly due to the comparatively limited power delivery capabilities of an EVGA entry-level Black GTX 1660 Ti.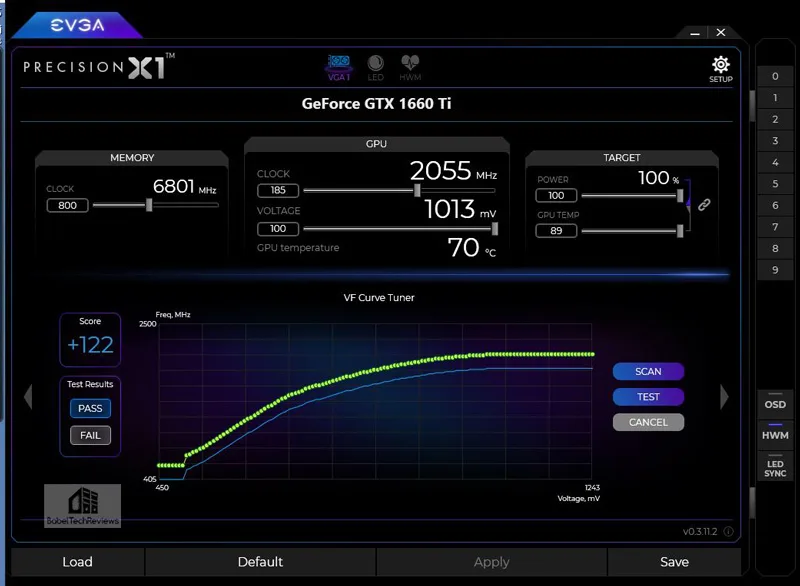
Our core overclock of the GTX 1660 Ti seems to be in line with what is expected from Turing GPUs.
The Red Devil RX Vega 56 OC
The premium PowerColor Red Devil RX Vega 56 uses the same two 8-pin PCIe power connectors as the reference RX Vega 56. However, we saw the original reference RX Vega 56 throttle its clocks regularly under load as its power delivery was apparently insufficient for overclocking vs. the GTX 1070 Ti. In contrast, the Red Devil RX Vega 56 features a 12-phase power delivery system plus a huge heatsink and three fans. The Red Devil’s clocks flatline at maximum boost unlike the reference RX Vega 56 which tends to throttle under load.
For our own gaming, we undervolt our RX Vega 56 and take a slight performance hit for big power savings, but for overclocking maximum-performance-damn-the-power-consumption, it requires brute force. We set the power limit and voltages up as high as they can go and set the clocks right to the edge of instability while using a somewhat loud and aggressive fan profile.
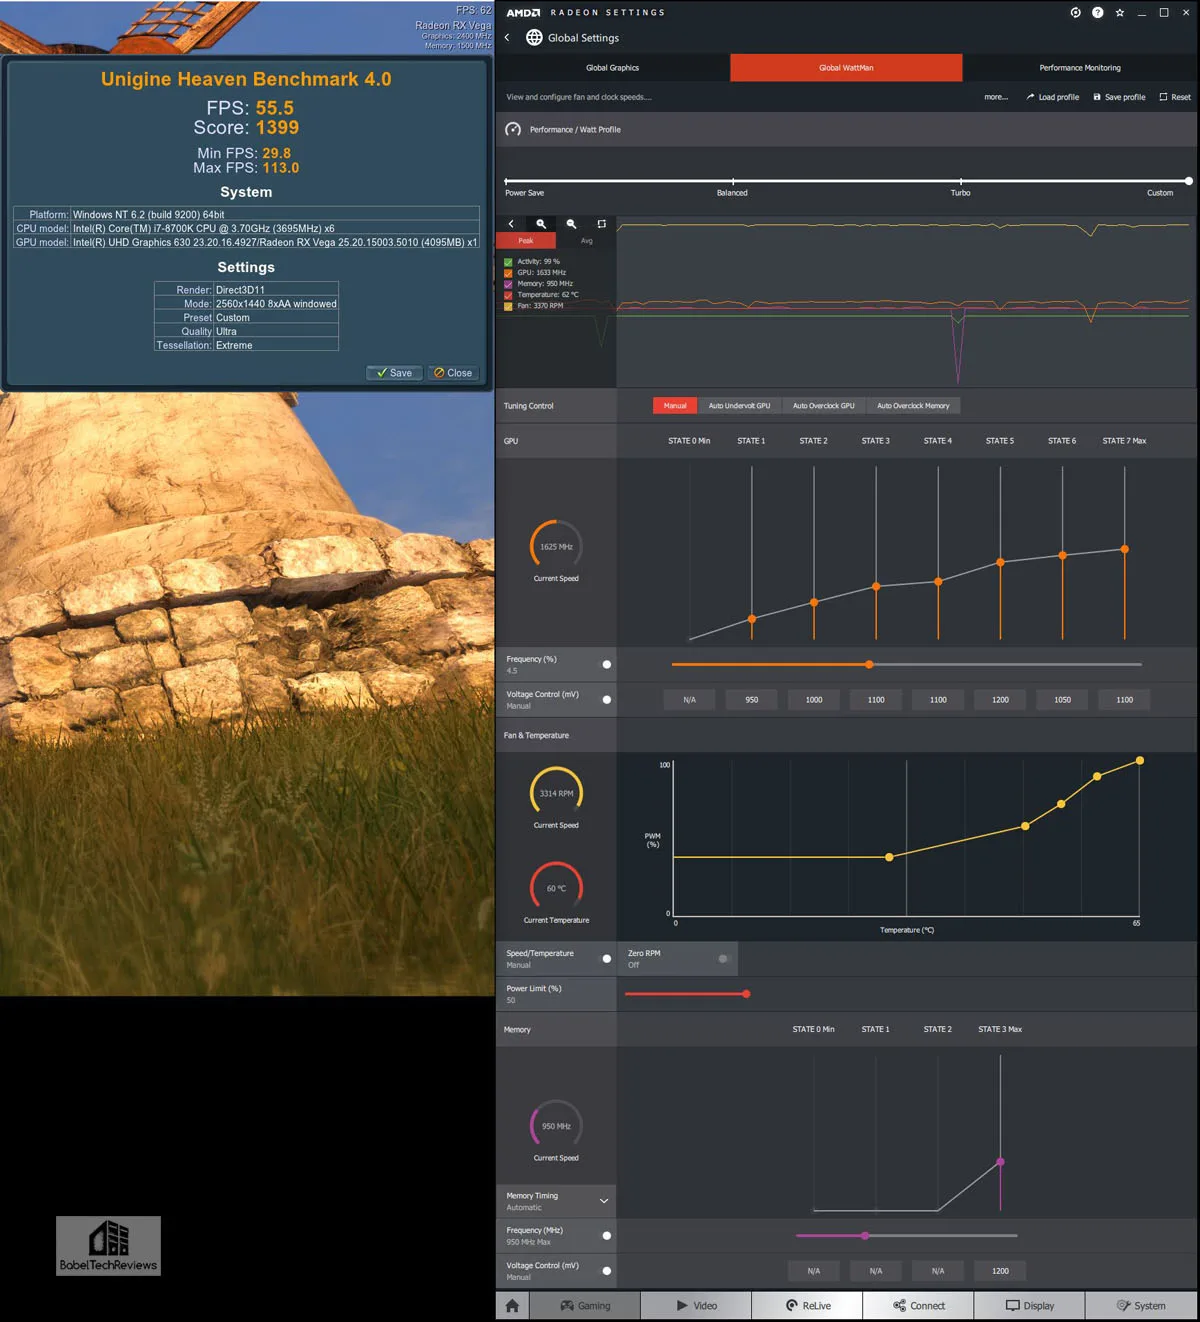
Our PowerColor Red Devil RX Vega 56 uses Hynix memory which doesn’t overclock particularly well in this case so we found an offset of +150MHz is its ceiling for stable performance paired with a stock-clocked core. However, for overall rock solid stability and overall maximum performance, we settled on a 4.0% overclock for an average boost above 1625MHz with its memory clocks overclocked +135MHz to 935MHz.
The GTX 1070 OC
Overclocking the Founders Edition of the GTX 1070
We devoted a separate evaluation to overclocking the GTX 1080 Founders Edition which also applies to the GTX 1070. Our Founders Edition’s final stable offset was +140 MHz to the core which settled in around 2012MHz with GPU Boost, and we added 520MHz to achieve a 4519MHz final stable memory clock. 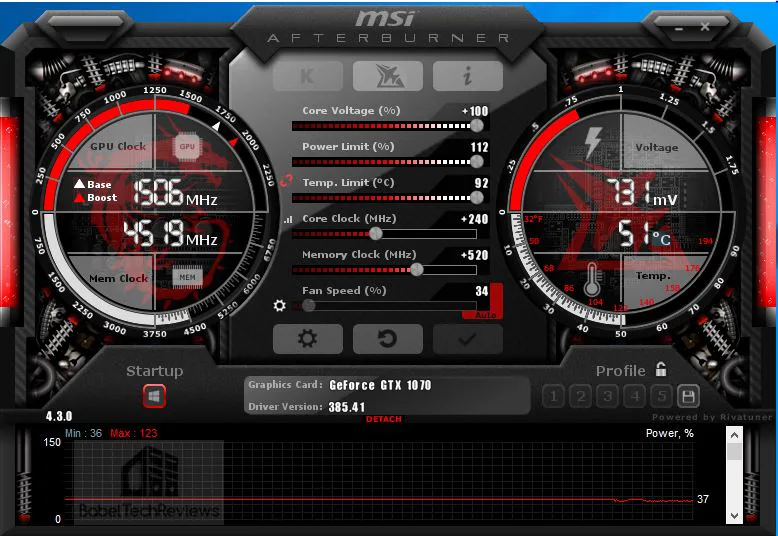
We did not need to adjust the fan profile, but left it on automatic. The fan never becomes obtrusive as we left its profile at stock, and the GPU remained relatively cool and did not throttle under overclocking.
The Red Devil RX 590 OC
The $279 Red Devil of the RX 590 8GB is clocked up from the reference 1545MHz to its maximum boost speeds of 1576MHz. The details of our original overclocking may be found here. We found that as long as the the Power and Temperature limits are maximized, it will not throttle even with the Silent BIOS profile.
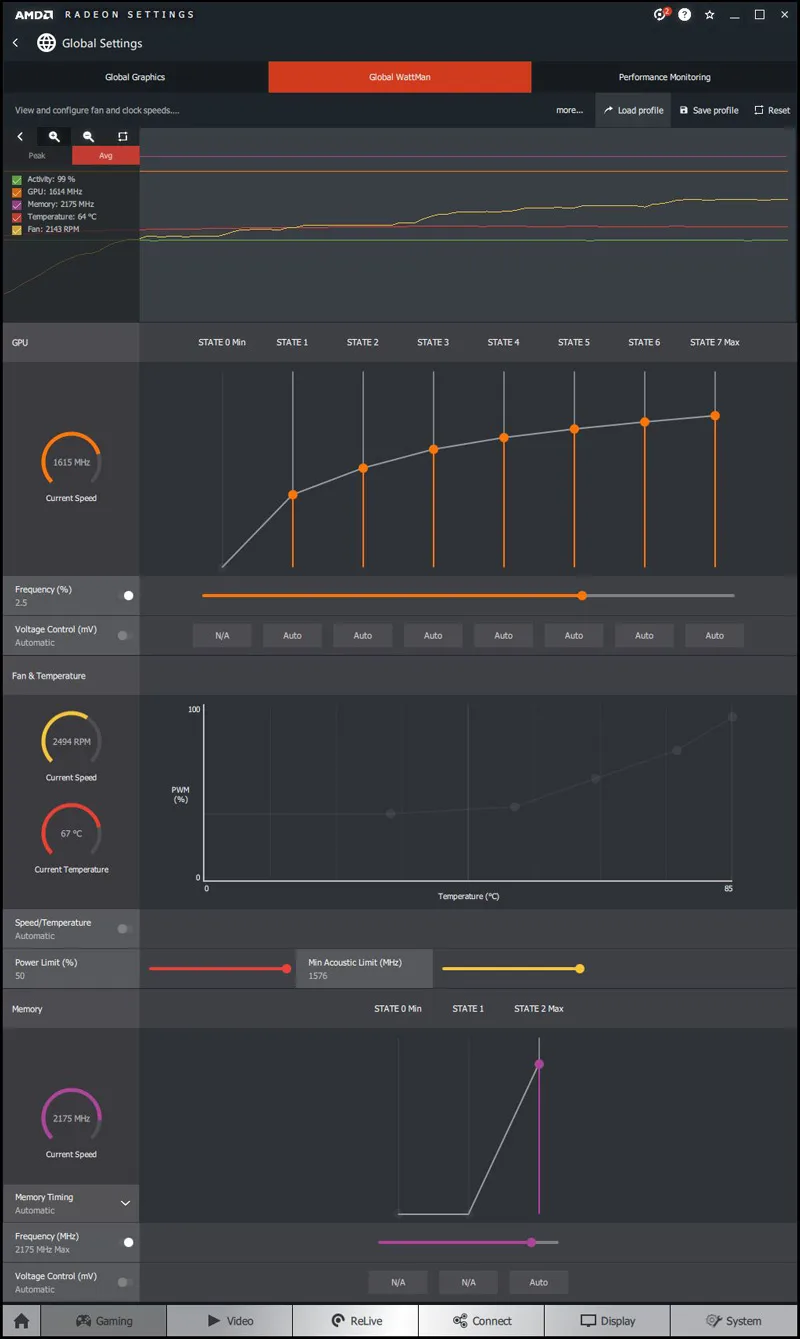
We settled on a 2.5% overclock or +40MHz to the core for a 1615MHz boost, with memory clocks overclocked +175MHz to 2175MHz. We found that higher memory clocks gained significant performance over a slightly higher core overclock. Adjusting the voltage – undervolting or undervolting – made no practical difference, and we achieved stability in all of our 40 tested games again using overclocking brute force.
Testing Platform
We test 40 games and 3 synthetic benchmarks at 1920×1080 and at 2560×1440. Our platform is a recent installation of Windows 10 64-bit Home Edition, and we are using an i7-8700K which turbos all 6 cores to 4.7GHz, an EVGA Z370 FTW motherboard, and 16GB of HyperX DDR4 3333MHz. The games, settings, and hardware are identical except for the cards being compared.
Before we run our overclocked benchmarks, let’s check out the test configuration.
Test Configuration – Hardware
- Intel Core i7-8700K (HyperThreading and Turbo boost is on to 4.7GHz for all cores; Coffee Lake DX11 CPU graphics).
- EVGA Z370 FTW motherboard (Intel Z370 chipset, latest BIOS, PCIe 3.0/3.1 specification, CrossFire/SLI 8x+8x), supplied by EVGA
- HyperX 16GB DDR4 (2x8GB, dual channel at 3333 MHz), supplied by HyperX
- EVGA GTX 1660 Ti XC Black 6GB, stock GTX 1660 Ti clocks, on loan from EVGA
- GTX 1070 8GB Founders Edition, stock FE clocks, on loan from NVIDIA
- Red Devil RX Vega 56 8GB, at factory overclocked settings, on loan from PowerColor
- Red Devil RX 590 8GB, at factory overclocked settings, on loan from PowerColor
- 2 x 480GB Team Group SSDs – one for AMD, and one for NVIDIA
- 1.92TB San Disk enterprise class SSD
- 2TB Micron 1100 enterprise class SSD
- Seasonic 850W Gold Focus power supply unit
- EVGA CLC 280mm CPU water cooler, supplied by EVGA
- EVGA Nu Audio PCIe soundcard, supplied by EVGA
- Edifier R1320T Active speakers
- EVGA DG-77, mid-tower case supplied by EVGA
- LG 43″ HDR 4K TV
- Monoprice Crystal Pro 4K
Test Configuration – Software
- Nvidia’s GeForce 418.91 press drivers and 419.17 which have the same functionality and performance. See NVIDIA Control Panel image below.
- AMD Adrenalin Software 19.2.3 drivers. See the AMD Control Panel image below.
- VSync is forced off.
- AA enabled as noted in games; all in-game settings are specified with 16xAF always applied
- Gaming results show average frame rates in bold including minimum frame rates shown on the chart next to the averages in a smaller italics font.
- Highest quality sound (stereo) used in all games.
- Windows 10 64-bit Home edition. All DX11 titles were run under DX11 render paths. DX12 titles are generally run under the DX12 render path unless performance is lower than with DX11. Three games use the Vulkan API.
- Latest DirectX
- All 40 games are patched to their latest versions at time of publication.
- WattMan used to set Radeon cooling and power options.
- Precision X1 used for all GeForce settings and for overclocking.
- OCAT, latest version
- Fraps, latest version
- Unigine Heaven 4.0 benchmark
40 PC Game benchmark suite & 4 synthetic tests
Synthetic
- Firestrike – Basic & Extreme
- Time Spy DX12
- Superposition
DX11 Games
- Grand Theft Auto V
- The Witcher 3
- Fallout 4
- Rainbow Six Siege
- Battlefield 1
- For Honor
- Ghost Recon Wildlands
- Mass Effect: Andromeda
- Prey
- Hellblade: Senua’s Sacrifice
- Project CARS 2
- Total Wars: Warhammer II
- Middle Earth: Shadow of War
- Destiny 2
- Star Wars: Battlefront II
- Monster Hunter: World
- Kingdom Come: Deliverance
- Final Fantasy XV
- Far Cry 5
- The Crew 2
- Assassin’s Creed: Odyssey
- Call of Duty: Black Ops 4
- Hitman 2
- Just Cause 4
- Resident Evil 2
DX12 Games
- Tom Clancy’s The Division
- Ashes of the Singularity: Escalation
- Hitman
- Rise of the Tomb Raider
- Deus Ex Mankind Divided
- Gears of War 4
- Civilization VI
- Sniper Elite 4
- Forza 7
- Shadow of the Tomb Raider
- Battlefield V
- Metro Exodus
Vulkan Games
- DOOM
- Wolfenstein: The New Colossus
- Strange Brigade
AMD Adrenalin Control Center Settings
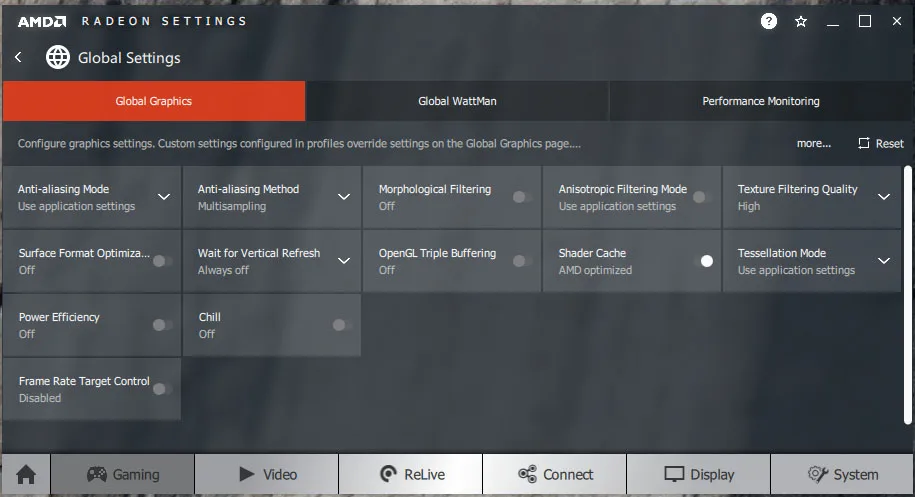 All AMD settings are set so as to be apples-to-apples when compared to NVIDIA’s control panel settings – all optimizations are off, Vsync is forced off, Texture filtering is set to High, and Tessellation uses application settings.
We use Wattman to set the Radeons’ power, temperature and fan settings to their maximums.
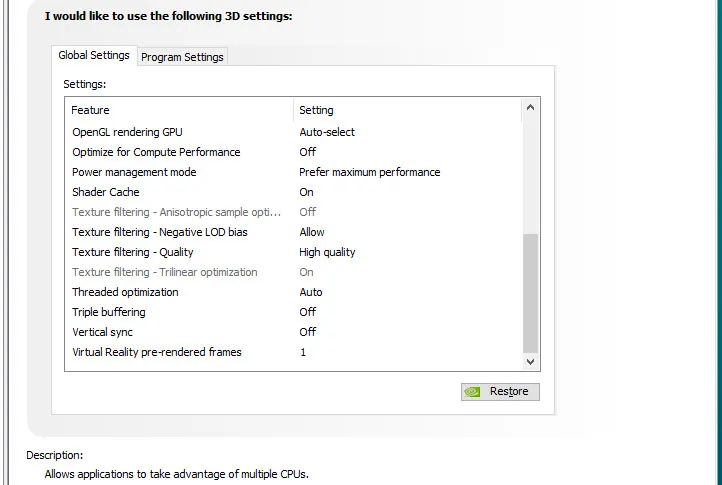
NVIDIA Control Panel settings
Here are the NVIDIA Control Panel settings that match AMD’s settings.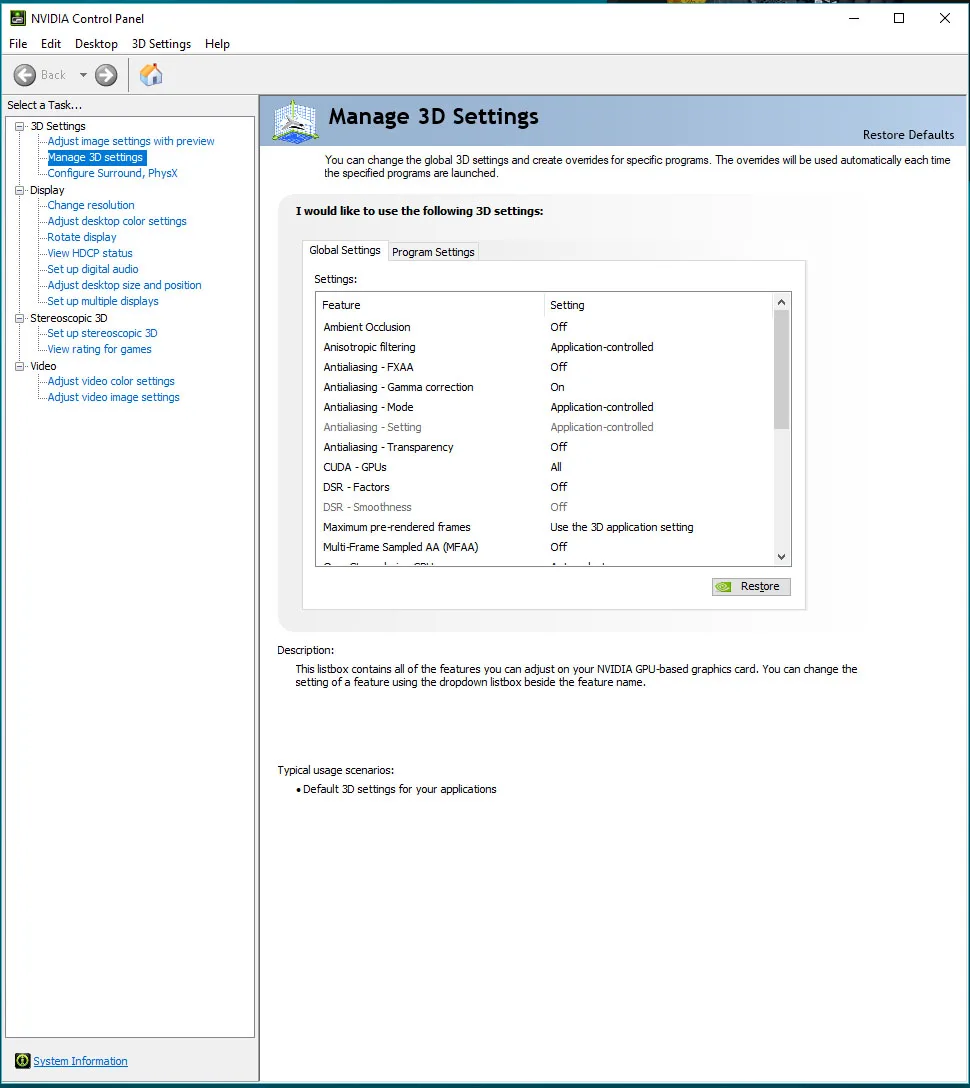
 We used the latest beta of Precision X1 to set all GeForces’ highest Power and Temperature targets and for our overclocks.
By setting the Power Limits and Temperature limits to maximum for each card, they do not throttle, but they can each reach and maintain their individual maximum clocks. This is particularly beneficial for high power cards.
Let’s check out the performance of our 4 target cards to conclude how they stand each manually overclocked in relation to each other.
Performance summary charts
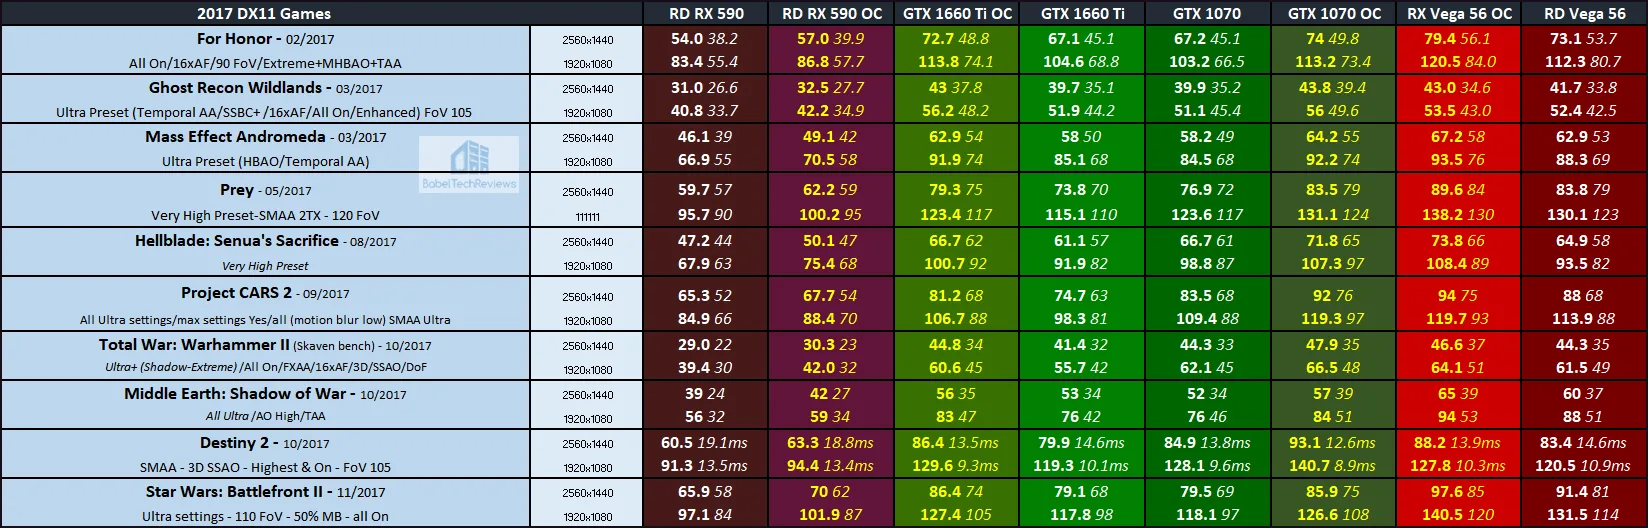
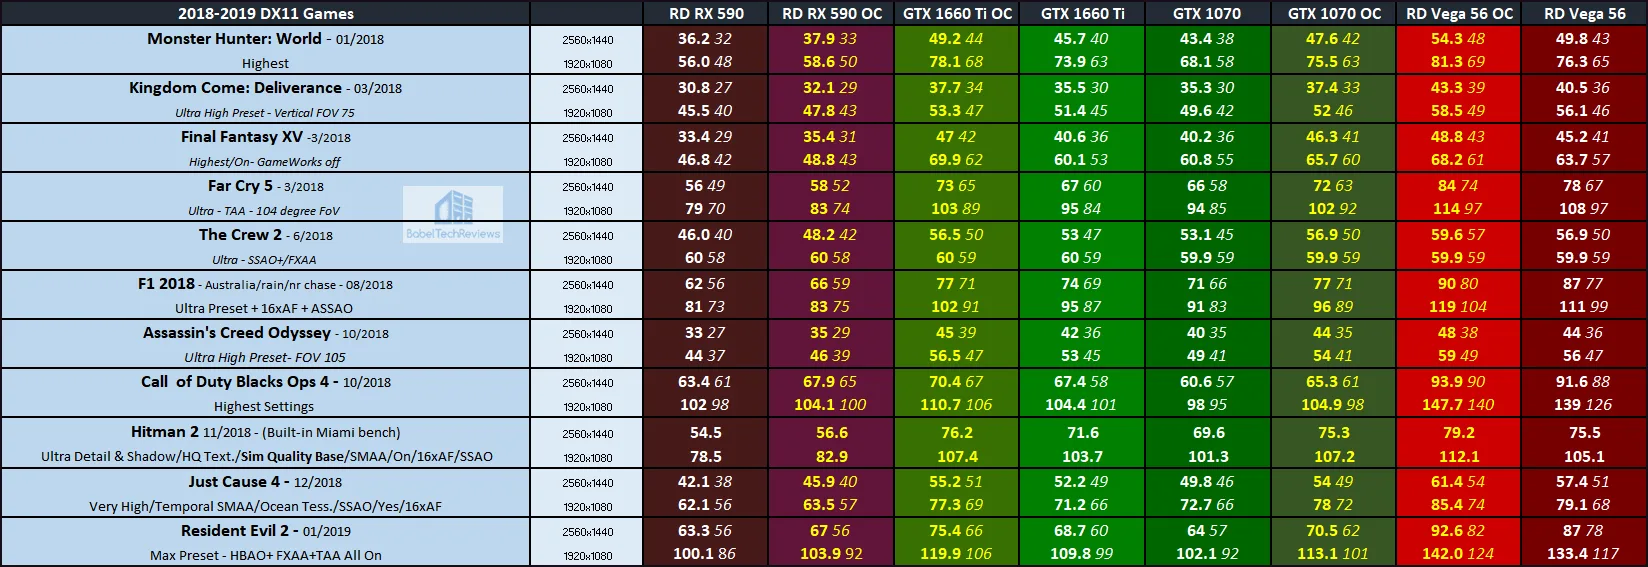
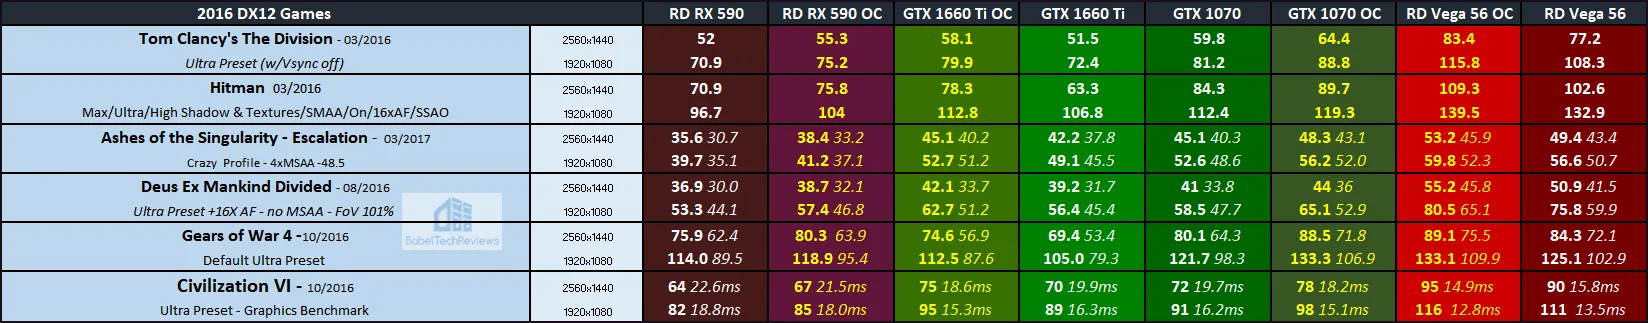
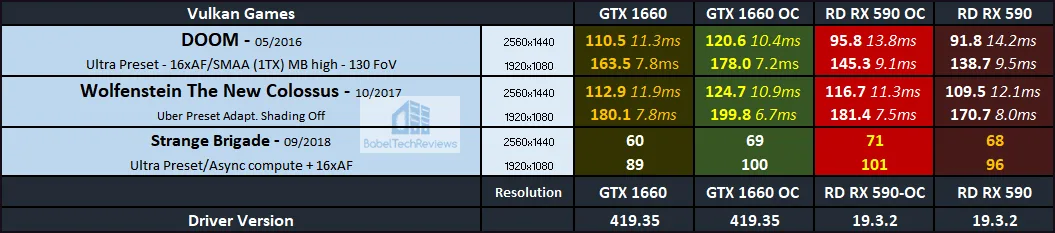
Here are the performance results of 40 games and 3 synthetic tests comparing the stock and overclocked GTX 1660 Ti XC Black versus the Red Devils RX Vega 56 and RX 590 and versus the GTX 1070 Founders Edition. The highest settings are always chosen and the settings are listed on the charts. The benches were run at 1920×1080 and at 2560×1440.
Most gaming results show average framerates in bold text, and higher is better. Minimum framerates are next to the averages in italics and in a slightly smaller font. A few games benched with OCAT show average framerates but the .1 minimums are expressed by frametimes in ms where lower numbers are better. All overclocked numbers are represented by yellow text while stock values are in white text.
The first four columns are devoted to the Red Devil RX 590 versus the GTX 1660 Ti. The next two columns are devoted to the GTX 1070 and the final two columns to the Red Devil RX Vega 56. “OC” refers to the overclocked cards’ performance and the overclocked results are shown by yellow text. As always, open each chart in a separate tab for the best viewing.

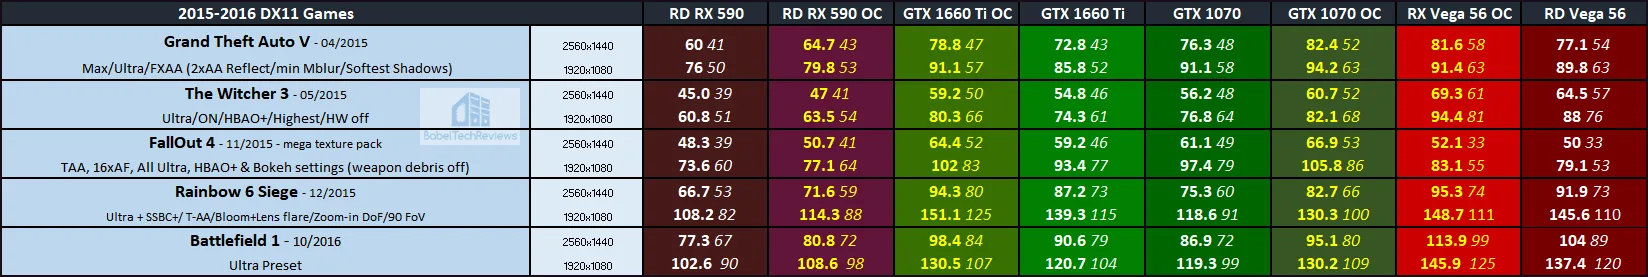
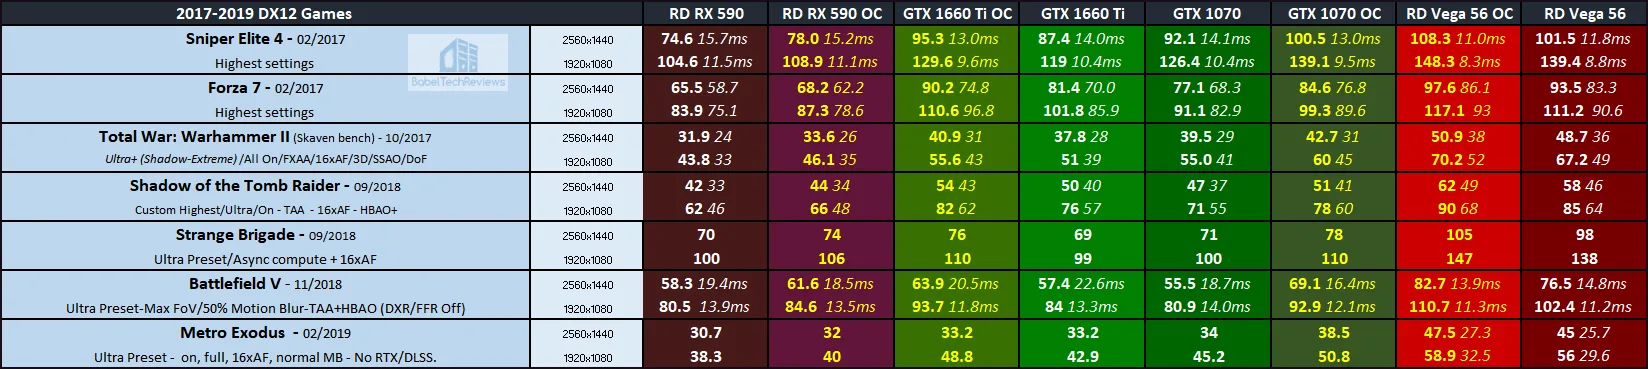
We see three of our cards each gain decent performance from manual overclocking while the Red Devil RX 590 gains a bit less as it doesn’t appear to have a lot of headroom. The Red Devil is a premium RX Vega 56 that is in a higher performance and price range than the other three cards and its performance should not be considered representative of a reference RX Vega 56, stock or overclocked.
The stock or overclocked GTX 1660 Ti Black wins more benchmarks than it loses against the GTX 1070 FE and it beats the Red Devil RX 590 in 39 of the 40 games we benchmarked. Nothing has changed significantly from overclocking although a few of the individual results have shifted their positions due to overclocking variability.
Let’s check out our conclusion.
Conclusion
This has been a fun and interesting overclocking exploration evaluating the manually overclocked EVGA GTX 1660 Ti XC Black versus the overclocked Red Devils RX 590 and RX Vega 56 and versus the overclocked GTX 1070 FE. All four cards appear to scale well with each of their respective overclocks although their overall ranking has not changed from the stock values reported in our original GTX 1660 Ti launch review.
The EVGA GTX 1660 Ti XC Ti Black is the quietest of the four cards. It is quieter than the GTX 1070 FE and significantly quieter than either Red Devil RX Vega 56 or RX 590 especially when all of the cards are overclocked and under full load. The Radeons also tend to use a lot of power when overclocked especially if undervolting isn’t also used.
The overall pricing hasn’t changed from ten days ago when the GTX 1660 Ti launched. The EVGA GTX 1660 Ti Black sits at $279 with the entry-level cards although it distinguishes itself by bundling a racing game, Grip. The Red Devil RX 590 is at $259 generally with a 3-game bundle, the GTX 1070 is still priced pretty high at $359, and the aftermarket RX Vega 56 cards are still in the $349 and up range price in the USA market. There are a lot of good choices for mainstream gamers and now may be an excellent time to upgrade from an older generation card.

Later this week, we will continue our Driver Performance Analyses series with a new post as a GeForce driver has dropped this morning. Let us know in the comments below which two GeForce cards you would like to see benchmarked.
We will also continue our VR performance benching series next week.
Happy Gaming!