The RTX 3080 Founders Edition Arrives at $699 – Ampere Performance Revealed – 35+ Games & GPGPU Benchmarked
BTR received the new Ampere RTX 3080 Founders Edition (FE) from NVIDIA, and we have been testing it using 35+ games and GPGPU/Creative benchmarks versus the RTX 2080 Ti, the RTX 2080 SUPER, and the GTX 1080 Ti. We have already covered Ampere’s new features in depth, and we have unboxed the card. This review will focus on performance as well as consider whether the new RTX 3080 Founders Edition at $699 represents a good value as a compelling upgrade from Turing and Pascal video cards.
We have also overclocked the RTX 3080 and will compare its overclocked performance versus stock. And for the first time in a BTR review, we will also give creative results using the Blender 2.90 benchmark and complete Sandra 2020 and AIDA64 GPGPU benchmark results. We have also received a LDAT latency measurement kit from NVIDIA and we will explore end-to-end latency with a special emphasis on the new Fortnite RTX map and NVIDIA’s Reflex technology.
BTR’s test bed includes the other two fastest cards in the world – the RTX 2080 Ti Founders Edition (FE) which launched at $1199 and the RTX 2080 SUPER FE which launched at $699 (the RTX 2080 originally launched at $799). In addition, we test NVIDIA’s flagship card from the Pascal generation, the GTX 1080 Ti FE which also launched at $699. There is no point in comparing AMD Radeons as their fastest card is slower than the slowest card we test, the GTX 1080 Ti.
We benchmark using Windows 10 64-bit Pro Edition at 1920×1080, 2560×1440 and at 3840×2160 using Intel’s Core i9-10900K at 5.1/5.0 GHz and 32GB of T-FORCE DARK Z 3600MHz DDR4. All games and benchmarks are the latest versions and we use the latest GeForce drivers.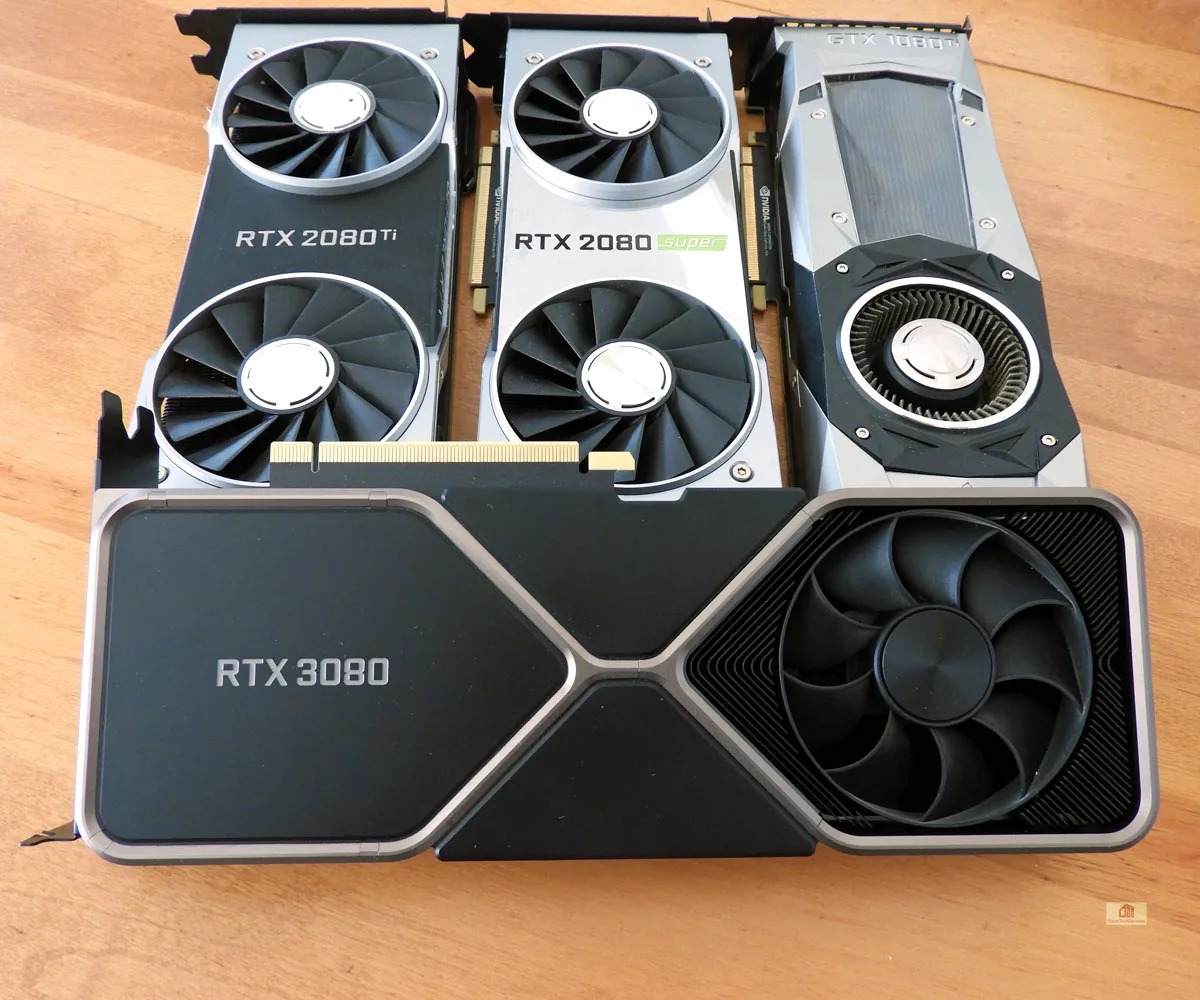
Let’s look at our test setup more closely.
Test Configuration
Test Configuration – Hardware
- Intel Core i9-10900K (HyperThreading/Turbo boost On; All cores overclocked to 5.1GHz/5.0Ghz. Comet Lake DX11 CPU graphics)
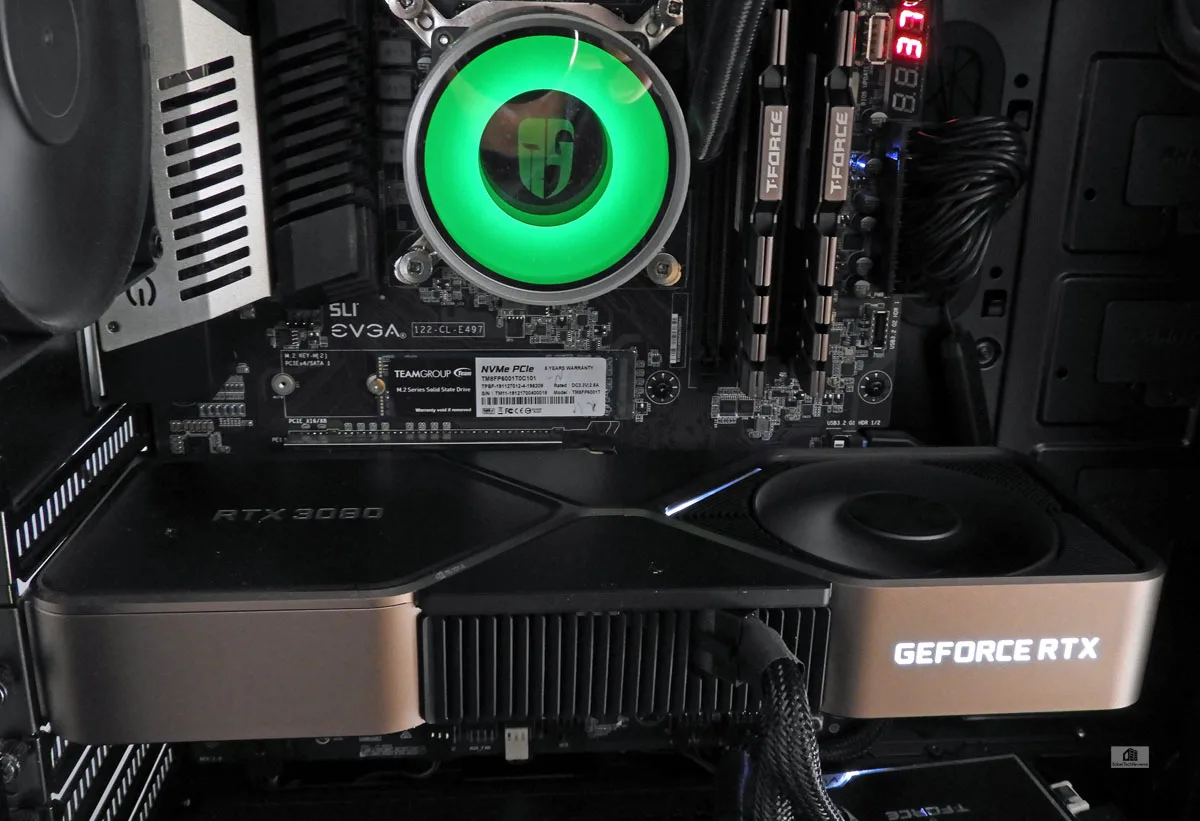
- EVGA Z490 FTW motherboard (Intel Z490 chipset, v1.3 BIOS, PCIe 3.0/3.1/3.2 specification, CrossFire/SLI 8x+8x), supplied by EVGA
- T-FORCE DARK Z 32GB DDR4 (2x16GB, dual channel at 3600MHz), supplied by Team Group
- RTX 3080 Founders Edition 10GB, stock and overclocked, on loan from NVIDIA
- RTX 2080 Ti Founders Edition 11GB, stock clocks, on loan from NVIDIA
- RTX 2080 SUPER Founders Edition 8GB, stock clocks, on loan from NVIDIA
- GTX 1080 Ti Founders Edition 11GB, stock clocks, on loan from NVIDIA
- 1TB Team Group MP33 NVMe2 PCIe SSD for C: drive
- 1.92TB San Disk enterprise class SATA III SSD (storage)
- 2TB Micron 1100 SATA III SSD (storage)
- 1TB Team Group GX2 SATA III SSD (storage)
- 500GB T-FORCE Vulcan SSD (storage), supplied by Team Group
- ANTEC HCG1000 Extreme, 1000W gold power supply unit
- BenQ EW3270U 32″ 4K HDR 60Hz FreeSync Monitor
- Samsung G7 Odyssey (LC27G75TQSNXZA) 27? 2560 x 1440/240Hz/1ms/G-SYNC/HDR600 Monitor
- DEEPCOOL Castle 360EX AIO 360mm liquid CPU cooler
- Phanteks Eclipse P400 ATX mid-tower (plus 1 Noctua 140mm fan) – All benchmarking and overclocking performed with the case closed
Test Configuration – Software
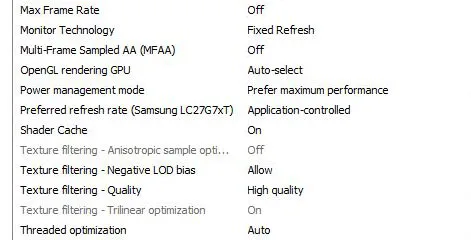
- GeForce 456.16 WHQL drivers. High Quality, prefer maximum performance, single display, set in the NVIDIA control panel.
- VSync is off in the control panel and disabled in each game
- AA enabled as noted in games; all in-game settings are specified with 16xAF always applied
- Highest quality sound (stereo) used in all games
- All games have been patched to their latest versions
- Gaming results show average frame rates in bold including minimum frame rates shown on the chart next to the averages in a smaller italics font where higher is better. Games benched with OCAT show average framerates but the minimums are expressed by frametimes (99th-percentile) in ms where lower numbers are better.
- Windows 10 64-bit Pro edition; latest updates v2004. DX11 titles are run under the DX11 render path. DX12 titles are generally run under DX12, and seven games use the Vulkan API.
- Latest DirectX
- MSI’s Afterburner, 4.6.3 beta to set the RTX 2080 Ti’s power and temp limits to their maximums
- EVGA Precision X1 (unreleased Beta) used for its automatic scan and to add voltage
Games
Vulkan
- DOOM Eternal
- Red Dead Redemption 2
- Ghost Recon: Breakpoint
- Wolfenstein Youngblood
- World War Z
- Strange Brigade
- Rainbow 6 Siege
DX12
- Horizon Zero Dawn
- Death Stranding
- F1 2020
- Mech Warrior 5: Mercenaries
- Call of Duty Modern Warfare
- Gears 5
- Control
- Anno 1800
- Tom Clancy’s The Division 2
- Metro Exodus
- Civilization VI – Gathering Storm Expansion
- Battlefield V
- Shadow of the Tomb Raider
- Project CARS 2
- Forza 7
DX11
- A Total War Saga: Troy
- Star Wars: Jedi Fallen Order
- The Outer Worlds
- Destiny 2 Shadowkeep
- Borderlands 3
- Total War: Three Kingdoms
- Far Cry New Dawn
- Assassin’s Creed Odyssey
- Monster Hunter: World
- Overwatch
- Grand Theft Auto V
Additional Games
- Fortnite RTX
- Bright Memory Infinite RTX Demo
- RTX Quake II
Synthetic
- TimeSpy (DX12)
- 3DMark FireStrike – Ultra & Extreme
- Superposition
- Heaven 4.0 benchmark
- AIDA64 GPGPU benchmarks
- Blender 2.90 benchmark
- Sandra 2020 GPGPU Benchmarks
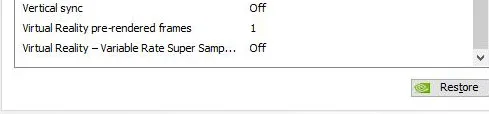
NVIDIA Control Panel settings:
Here are the NVIDIA Control Panel settings.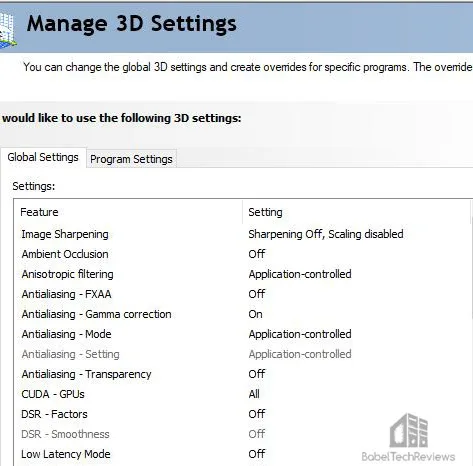
We used MSI’s Afterburner to set all video cards’ power and temperature limits to maximum as well as for overclocking, but we used the as-yet-unreleased EVGA Precision X1 tool to automatically scan and to increase the RTX 3080 voltage to its maximum for additional overclocking. See the overclocking section for details.
By setting the Power Limits and Temperature limits to maximum for each card, they do not throttle, but they can each reach and maintain their individual maximum clocks. This is particularly beneficial for high power cards.
Let’s check out overclocking, temperatures and noise next.
Overclocking, Temperatures & Noise
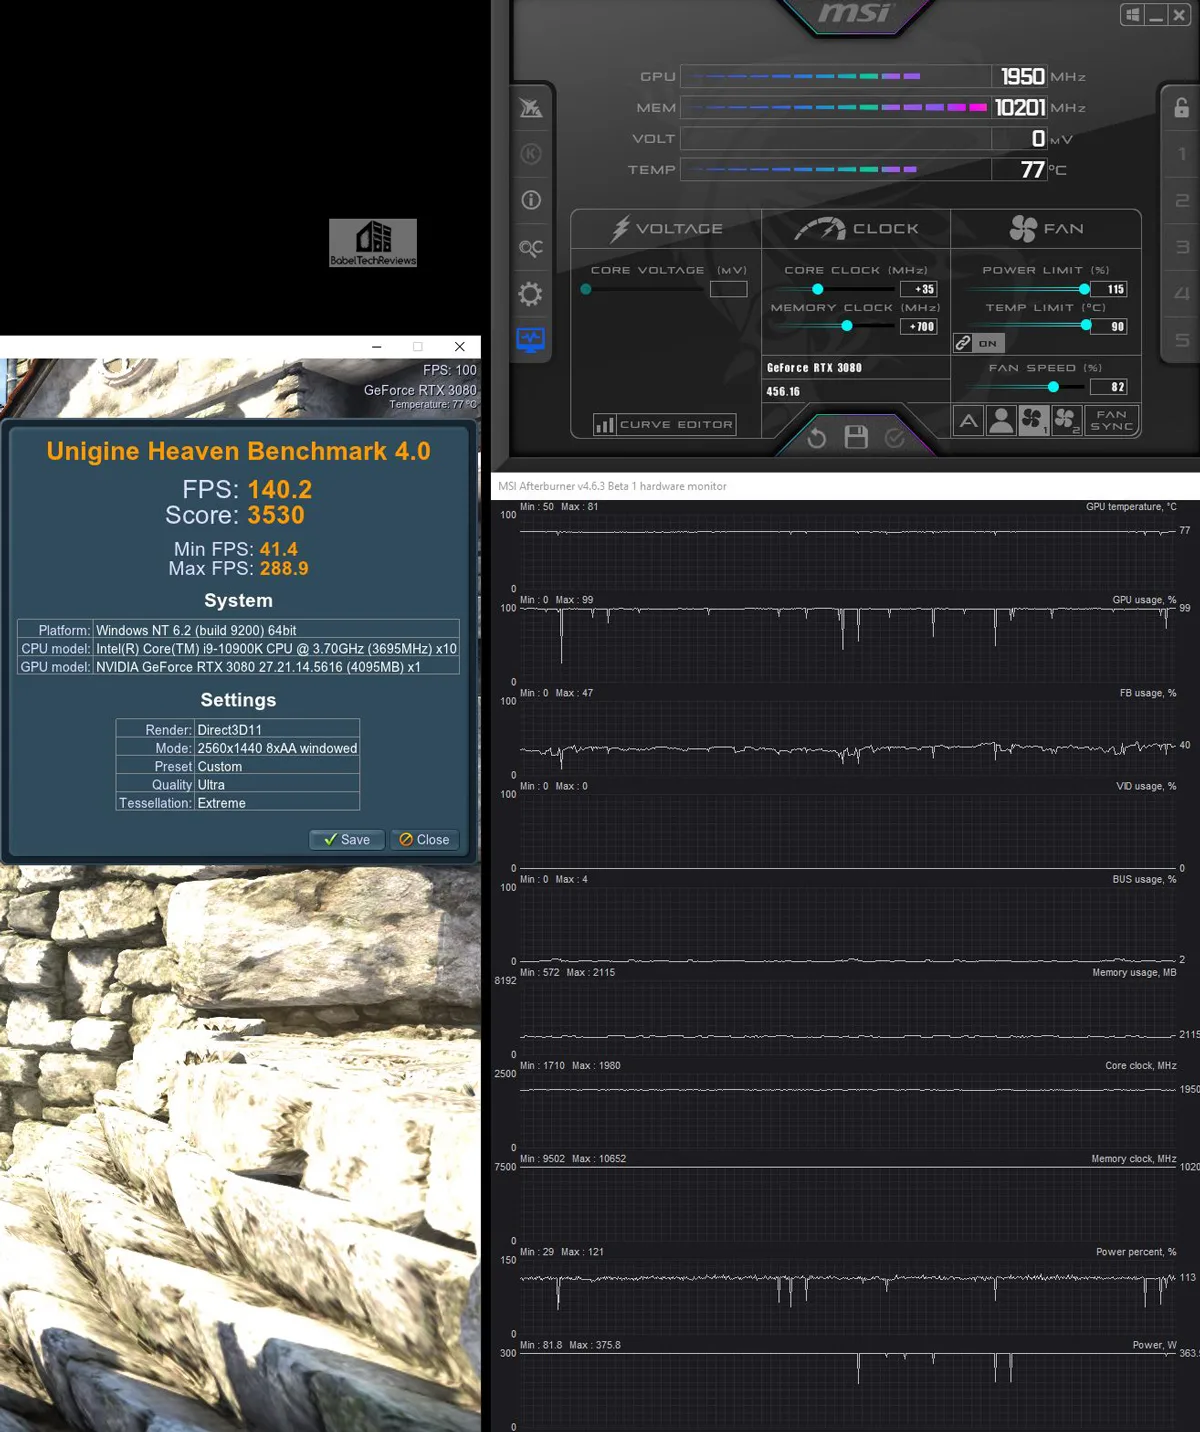
All of our performance and overclocked testing are performed in a closed Phanteks Eclipse P400 ATX mid-tower case. Inside, the RTX 3080 is a very quiet card even when overclocked and with its fan set up to 80 percent. Compared with the RTX 2080 Ti which becomes loud when it ramps up, the RTX 3080 is a whisper that can barely be heard over the other fans in our PC. We overclocked the RTX 3080 using Afterburner, but afterward we used a pre-release version of Precision X1 (courtesy of EVGA) which is not yet available to the public to add more voltage – a feature not yet available in Afterburner.
We used Heaven 4.0 running in a window at completely maxed-out settings at 2560×1440 to load the GPU to 98% so we could observe the running characteristics of the RTX 3080 and also to be able to compare our changed clock settings with their results instantly. At completely stock settings with the GPU under full load, the RTX 3080 ran cool and stayed below 78C with clocks that averaged between 1875-1890MHz. Simply raising the Power and Temperatures to their maximums resulted in the clocks running at 1905-1935MHz, but the temperatures approached 81C using the stock fan profile. The card is very well-tuned from the factory to run cool and quiet at stock but at the expense of performance.
The core clock for the RTX 3080 remained steady until it reached 80C under maximum load when it began to throttle. So we set a custom fan curve up to 80 percent to keep the temps below 79C for maximum performance – the key to a successful overclock. Even with the fans running around 80%, the card remained very quiet in contrast to the RTX 2080 Ti FE which gets rather loud under full load.
We tested manual overclocking for hours but were able to add only 35MHz to the core to raise the clocks to a steady 1950-1965MHz. We also were able to add +700 MHz to the RTX 3080’s memory clocks with good results. We found that we were able to increase the memory clocks by adding +1150MHz without artifacting, but the performance dropped off after an offset of +700MHz.
Next we set up Precision X1, as yet an unreleased beta that we were able to preview, to increase the voltage by .1mV; the maximum allowed by the tool. We ran the automatic scan function.
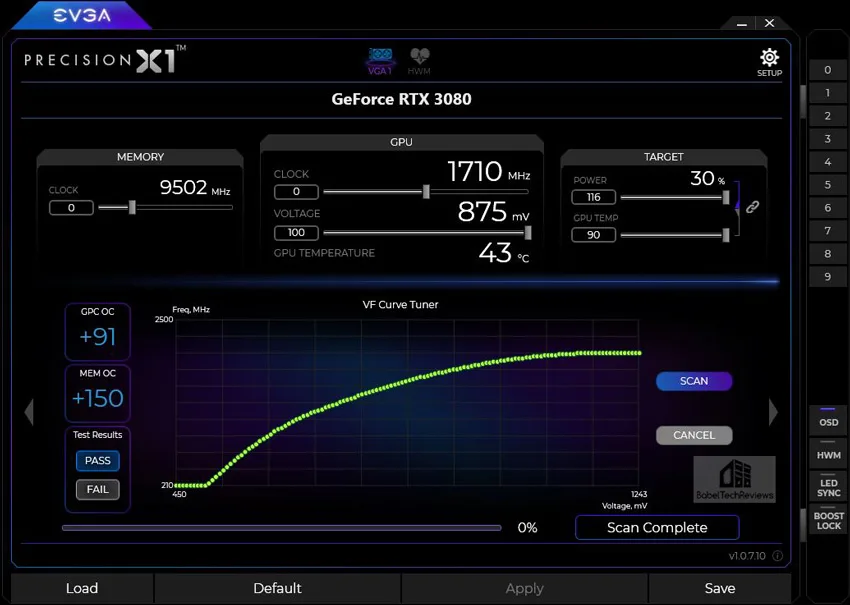
The auto scan suggested adding only 150MHz to the memory and 91MHz to the core – and it promptly crashed when we ran FireStrike. So we tested all the steps in between and found that +50MHz was stable – but only if the memory clocks were kept to a +150MHz offset. The overall performance was lower with a +150MHz memory offset and 50MHz added to the core than with a +700MHz memory offset and a +35MHz core offset. Our RTX 3080’s final overclock to achieve the highest overall performance adds +35MHz offset to the core and +700 MHz to the memory. The RTX 3080 is power-limited, and to achieve a higher overclock will take more voltage than what Precision X1 can deliver.
To see the performance increase from overclocking, we tested 15 games at 2560×1440 and at 3840×2160 resolution. The results are given after the main performance charts in the next section. So let’s check out performance on the next page.
Performance summary charts & graphs
Main Performance Summary Charts
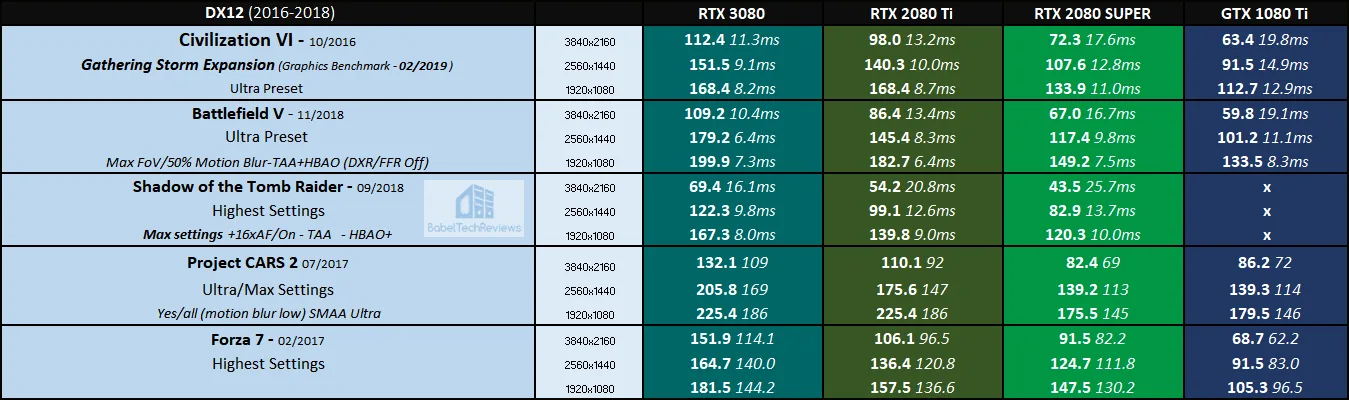
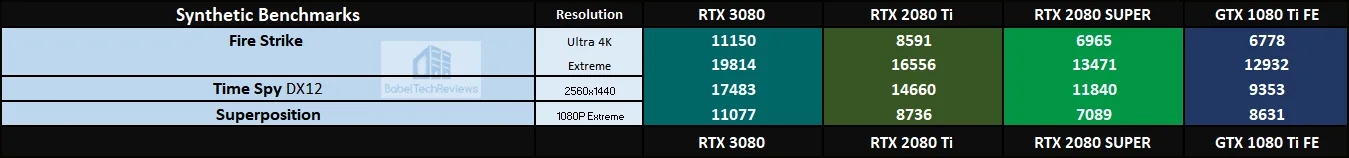
Here are the summary charts of 33 games and 3 synthetic tests. The highest settings are always chosen and the settings are listed on the chart. The benches were run at 1920×1080, 2560×1440, and at 3840×2160. Four cards were benchmarked and they are listed in order starting with the most powerful card on the left to the least powerful on the right: the RTX 3080, the RTX 2080 Ti, The RTX 2080 SUPER, and the GTX 1080 Ti.
Most results, except for synthetic scores, show average framerates, and higher is better. Minimum framerates are next to the averages in italics and in a slightly smaller font. Games benched with OCAT show average framerates, but the minimums are expressed by frametimes (99th-percentile) in ms where lower are better. 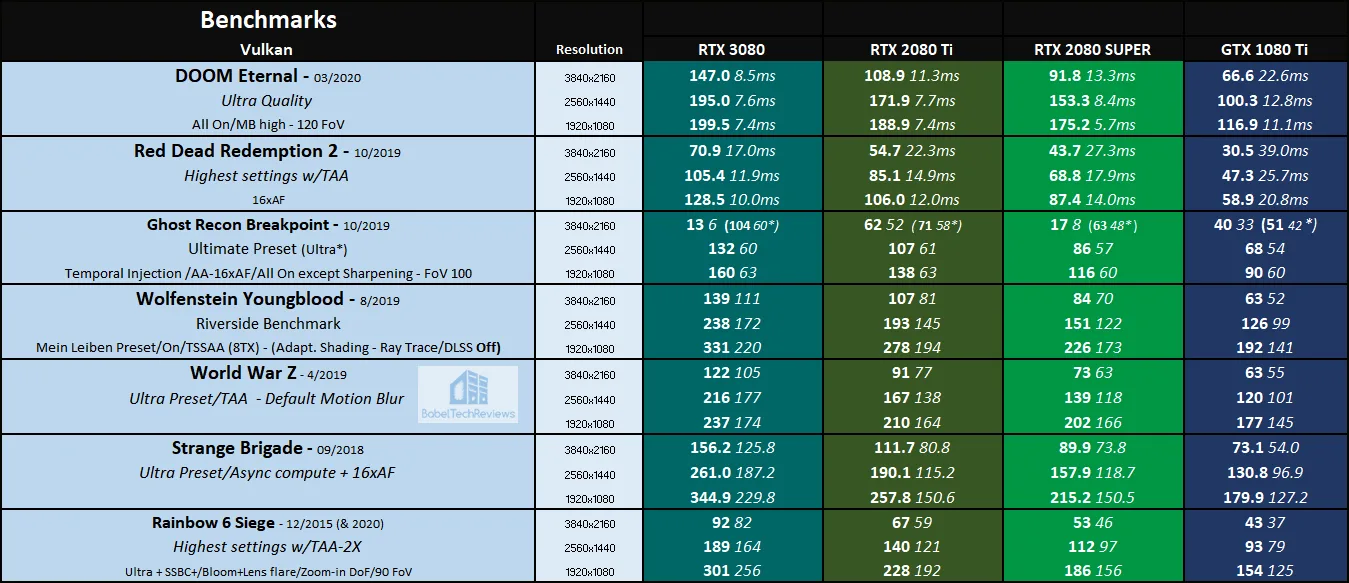
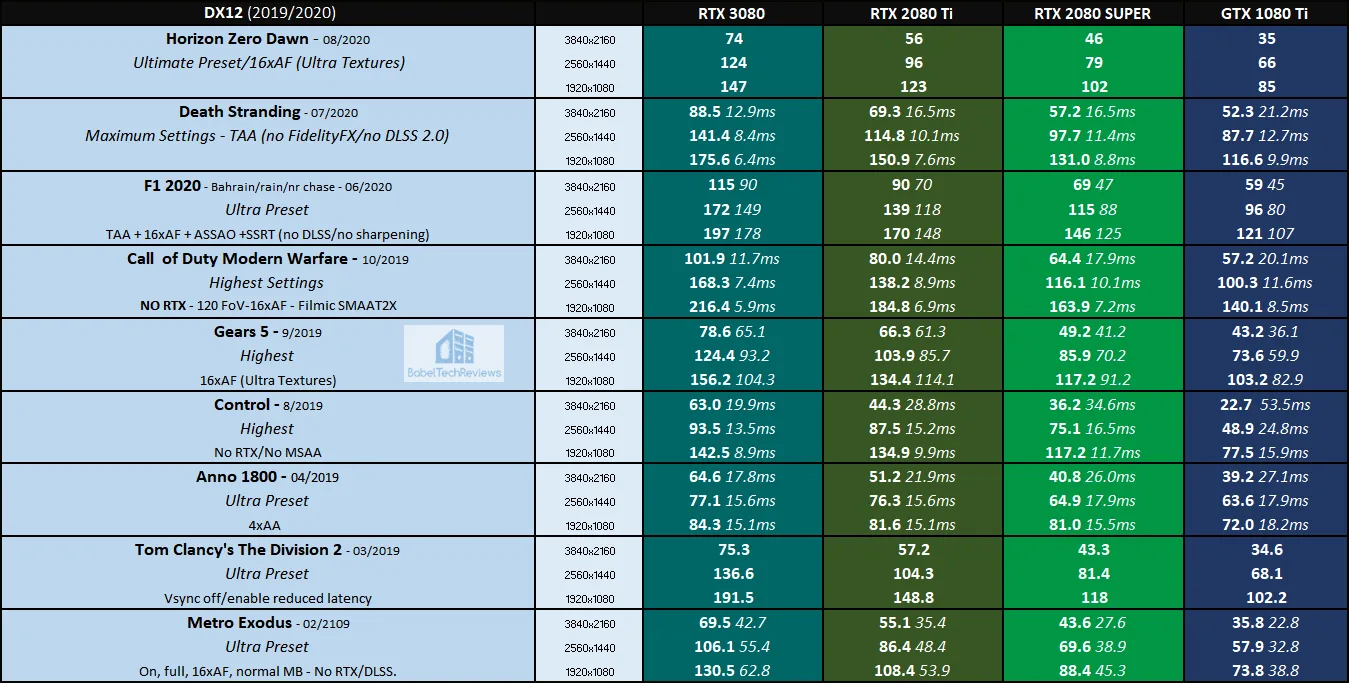
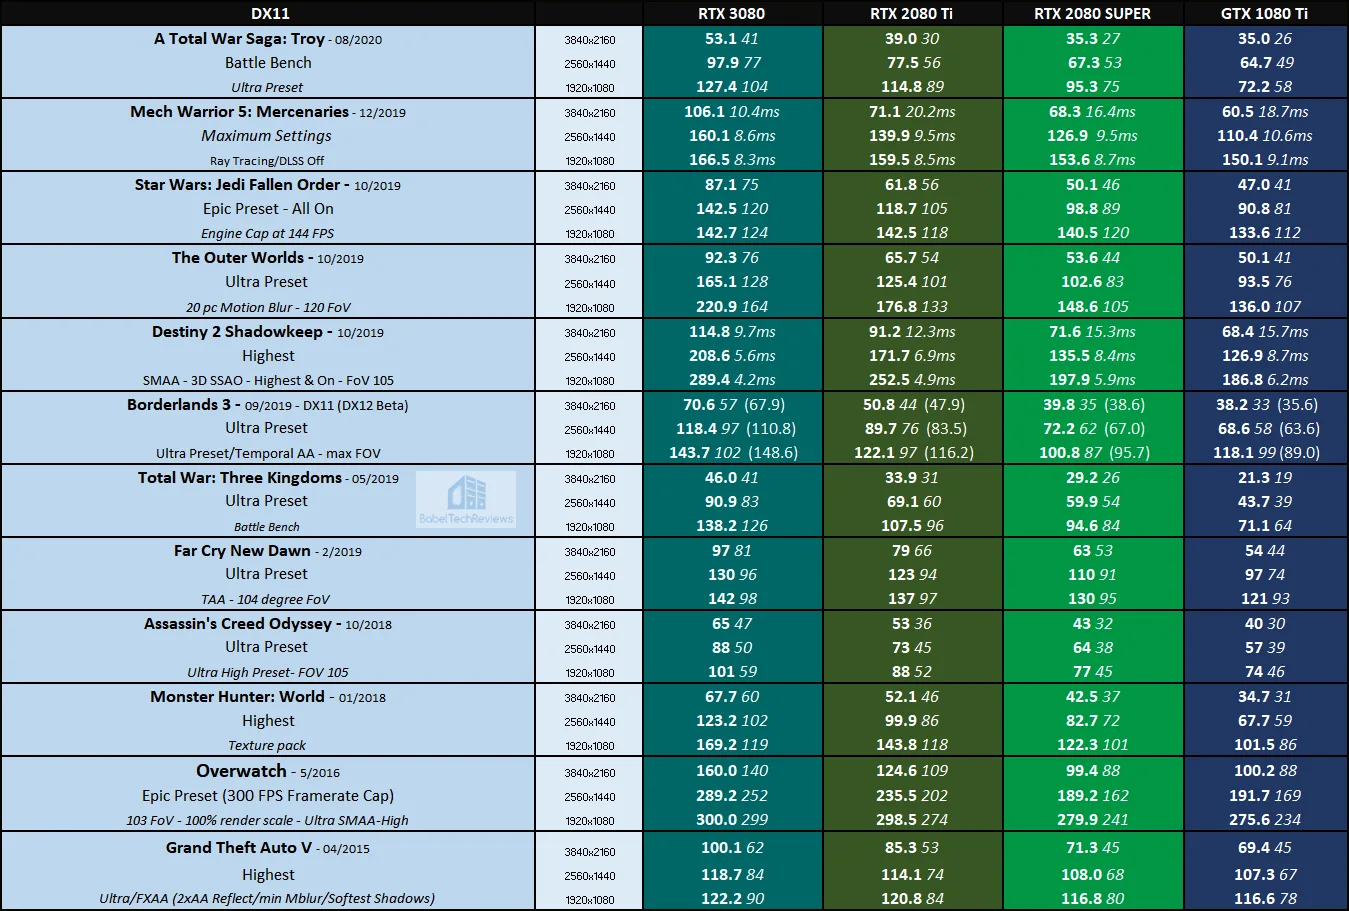
All of the games that we tested ran well on the RTX 3080 except for A Total War Saga: Troy. However, the benchmark also had issues with the other three cards. We suspect that it may be a game or driver issue. The Shadow of the Tomb Raider benchmark refused to run on the GTX 1080 Ti and would crash to desktop when we attempted to access the benchmark.
The only benchmark that did not run well on the RTX 3080 is Ghost Recon: Breakpoint – but only on the Ultimate Preset at 3840×2160. Ultimate/4K requires 11GB of vRAM and the RTX 3080 is equipped with 10GB. This is the only benchmark where the RTX 2080 Ti beats the RTX 3080, but dropping to the Ultra Preset returns the RTX 3080 Founders Edition to complete dominance over the $1199 Turing FE flagship.
It is a blowout and the RTX 3080 FE wins every game benchmark over the RTX 2080 Ti FE. The RTX 3080 is the first single-GPU card that is truly suitable for 4K/60 FPS using ultra settings for most modern games. In many cases, the $699 RTX 3080 FE doubles performance over the GTX 1080 Ti which also launched at the same price! The RTX 3080 also provides a significant performance upgrade over this generations’ RTX 2080 SUPER which also launched at $699 (although the RTX 2080 originally launched for $799).
However, the RTX 3080 is overkill for 1920×1080 – only perhaps suitable for some competitive gamers who require a 240Hz to 360Hz (or higher) display, and it exposes many engine framerate caps that were formerly hidden. We will drop 1080P testing for future RTX 3080 reviews.
Now we look specifically at ten RTX/DLSS enabled games, each using maximum ray traced settings and the highest quality DLSS where available.
RTX/DLSS Benchmarks
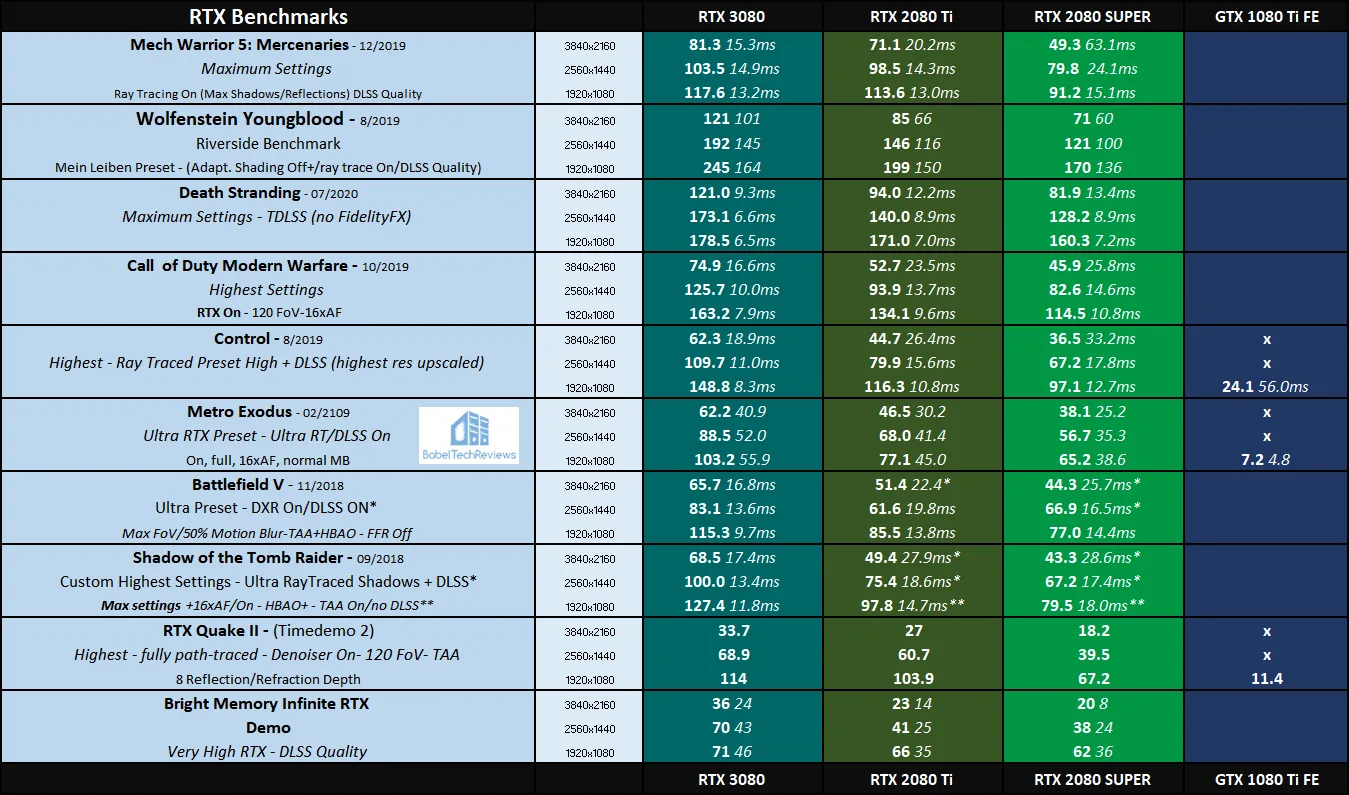
The RTX 3080 maintains its performance dominance over the other cards and pulls further away when RTX/DLSS are enabled. The GTX 1080 Ti is unable to run RTX features efficiently and DLSS is unavailable to it.
Next, we look at overclocked performance.
Overclocked benchmarks
These 15 benchmarks are run with the RTX 3080 overclocked +35MHz on the core and +700MHz on the memory versus at stock clocks.
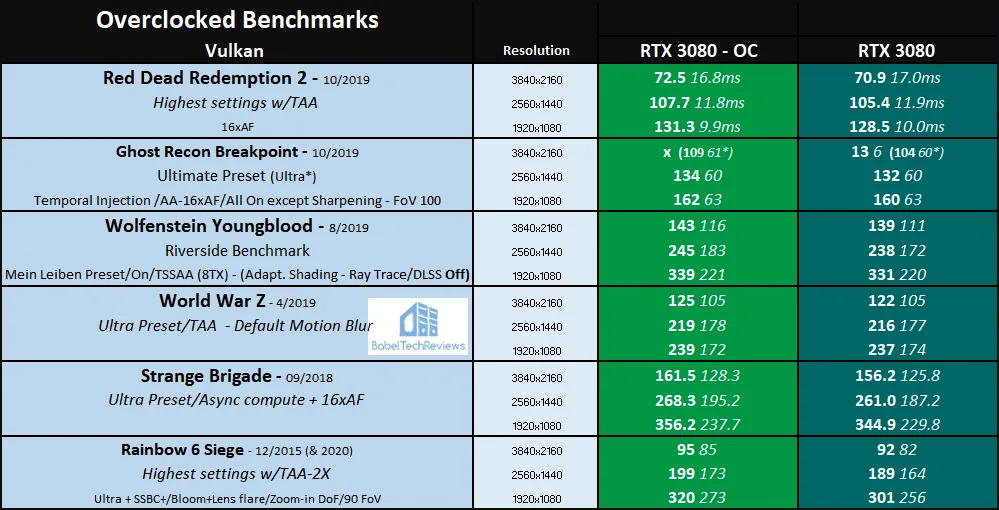
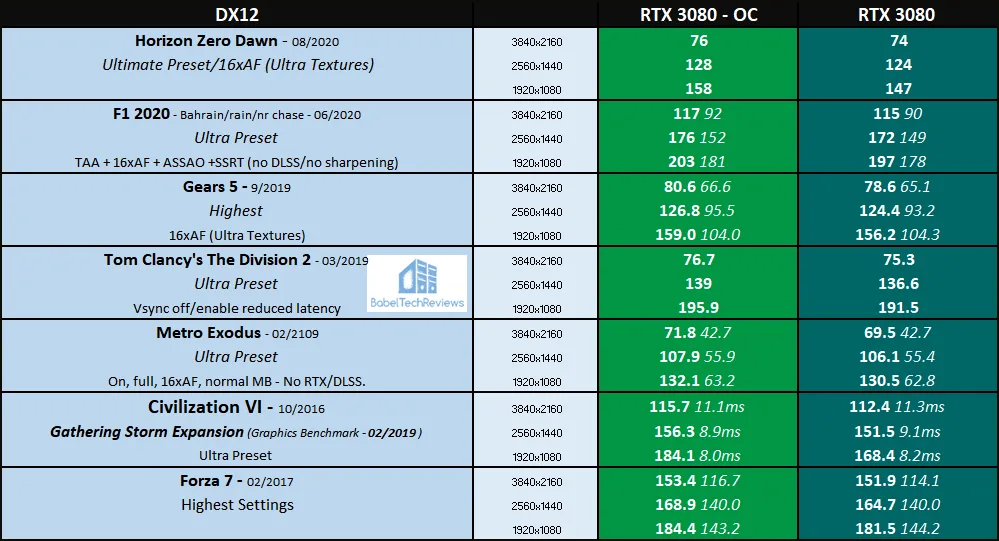
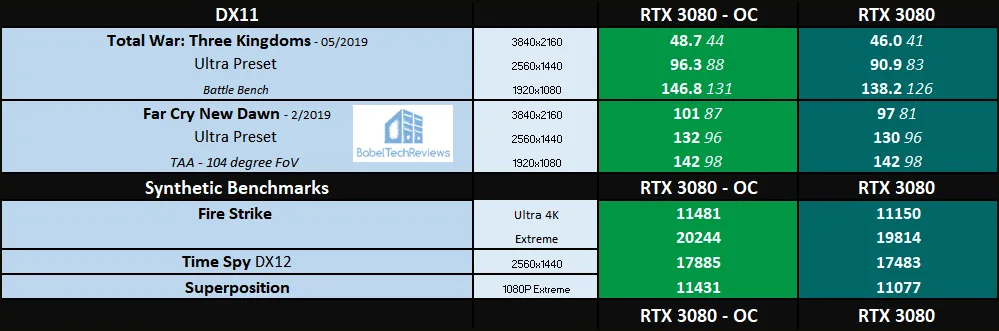
There is a small performance increase, but not even five percent for most games. We used the Precision X1 preview build to increase the voltage to its maximum .1mV offset, but we could not improve the performance We won’t bother overclocking the RTX 3080 in future as NVIDIA has locked it down in an attempt to maximize performance for all Founders Edition gamers.
Let’s look at Creative applications next to see if the RTX 3080 is a good upgrade from the other video cards starting with Blender.
Blender 2.90
Blender is a very popular open source 3D content creation suite. It supports every aspect of 3D development with a complete range of tools for professional 3D creation.
We have seen Blender performance increase with faster CPU speeds, so we decided to try several Blender 2.90 benchmarks which also can measure GPU performance by timing how long it takes to render production files. We tested our four comparison cards with both CUDA and Optix running on the GPU instead of using the CPU.
For the following chart, lower is better as the benchmark renders a scene multiple times and gives the results in minutes and seconds.
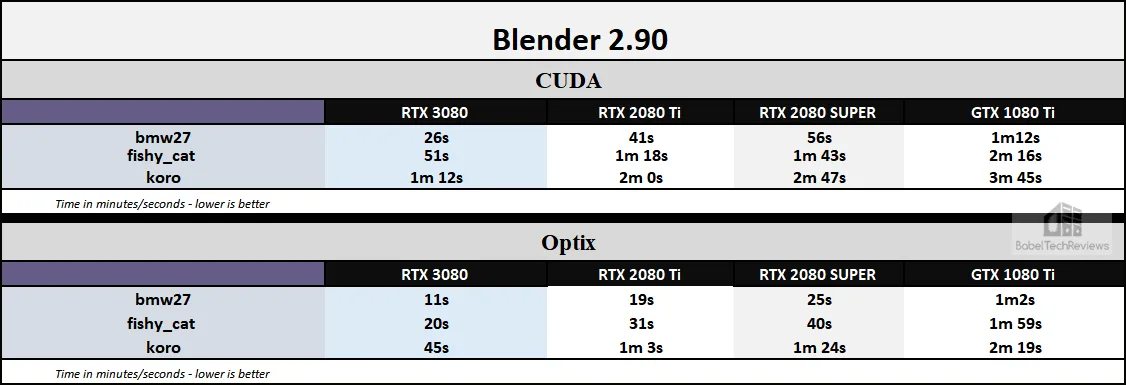 Blender’s benchmark performance is highest using the RTX 3080, and often the amount of time saved is substantial over using the next fastest card, the RTX 2080 Ti. We did not test motion blur performance which NVIDIA claims is five times faster using the RTX 3080 over the RTX 2080 SUPER.
Next, we move on to AIDA64 GPGPU benchmarks.
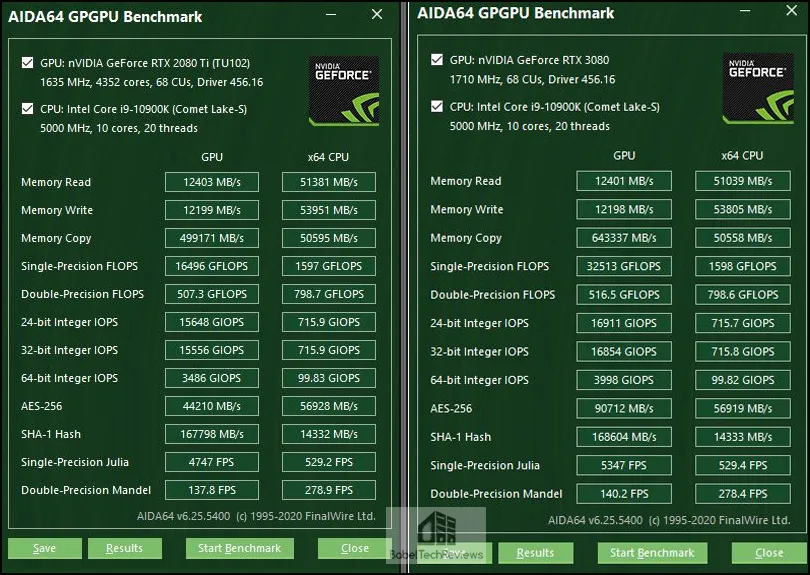
AIDA64 v6.25
AIDA64 is an important industry tool for benchmarkers. Its GPGPU benchmarks measure performance and give scores to compare against other popular video cards.
AIDA64’s benchmark code methods are written in Assembly language, and they are well-optimized for every popular AMD, Intel, NVIDIA and VIA processor by utilizing the appropriate instruction set extensions. We use the Engineer’s full version of AIDA64 courtesy of FinalWire. AIDA64 is free to to try and use for 30 days. This time, we compare the flagship Turing RTX 2080 Ti against the Ampere RTX 3080. CPU results are also shown for comparison.
Here is the chart summary of the AIDA64 GPGPU benchmarks with the RTX 3080 and the RTX 2080 Ti side-by-side.
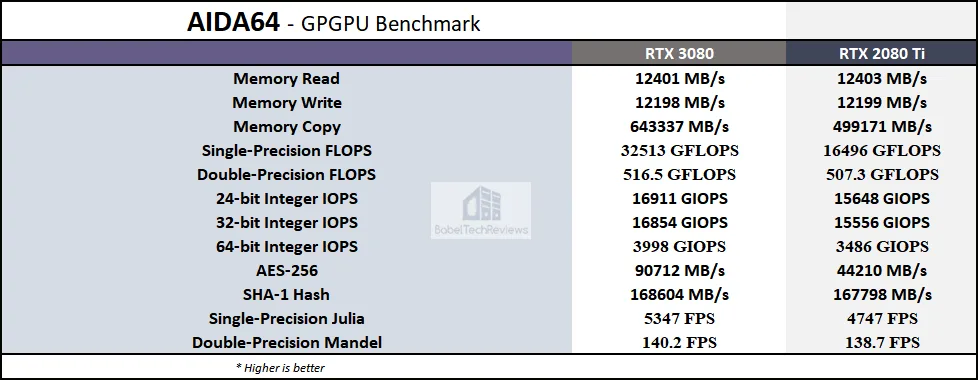
Generally the RTX 3080 is faster at almost all of the GPGPU benchmarks than the RTX 2080 Ti, sometimes overwhelmingly so as with AES-256 and in Single-Precision FLOPS. It is only slightly slower with SHA-1 Hash. So let’s look at Sandra 2020 next.
SiSoft Sandra 2020
To see where the CPU, GPU, and motherboard performance results differ, there is no better tool than SiSoft’s Sandra 2020. SiSoftware SANDRA (the System ANalyser, Diagnostic and Reporting Assistant) is a excellent information & diagnostic utility in a complete package. It is able to provide all the information about your hardware, software, and other devices for diagnosis and for benchmarking. Sandra is derived from a Greek name that implies “defender” or “helper”.
There are several versions of Sandra, including a free version of Sandra Lite that anyone can download and use. Sandra 2020 R10 is the latest version, and we are using the full engineer suite courtesy of SiSoft. Sandra 2020 features continuous multiple monthly incremental improvements over earlier versions of Sandra. It will benchmark and analyze all of the important PC subsystems and even rank your PC while giving recommendations for improvement.
We ran Sandra’s intensive GPGPU benchmarks and charted the results summarizing them. The performance results of the RTX 3080 are compared with the performance results of the RTX 2080 Ti.
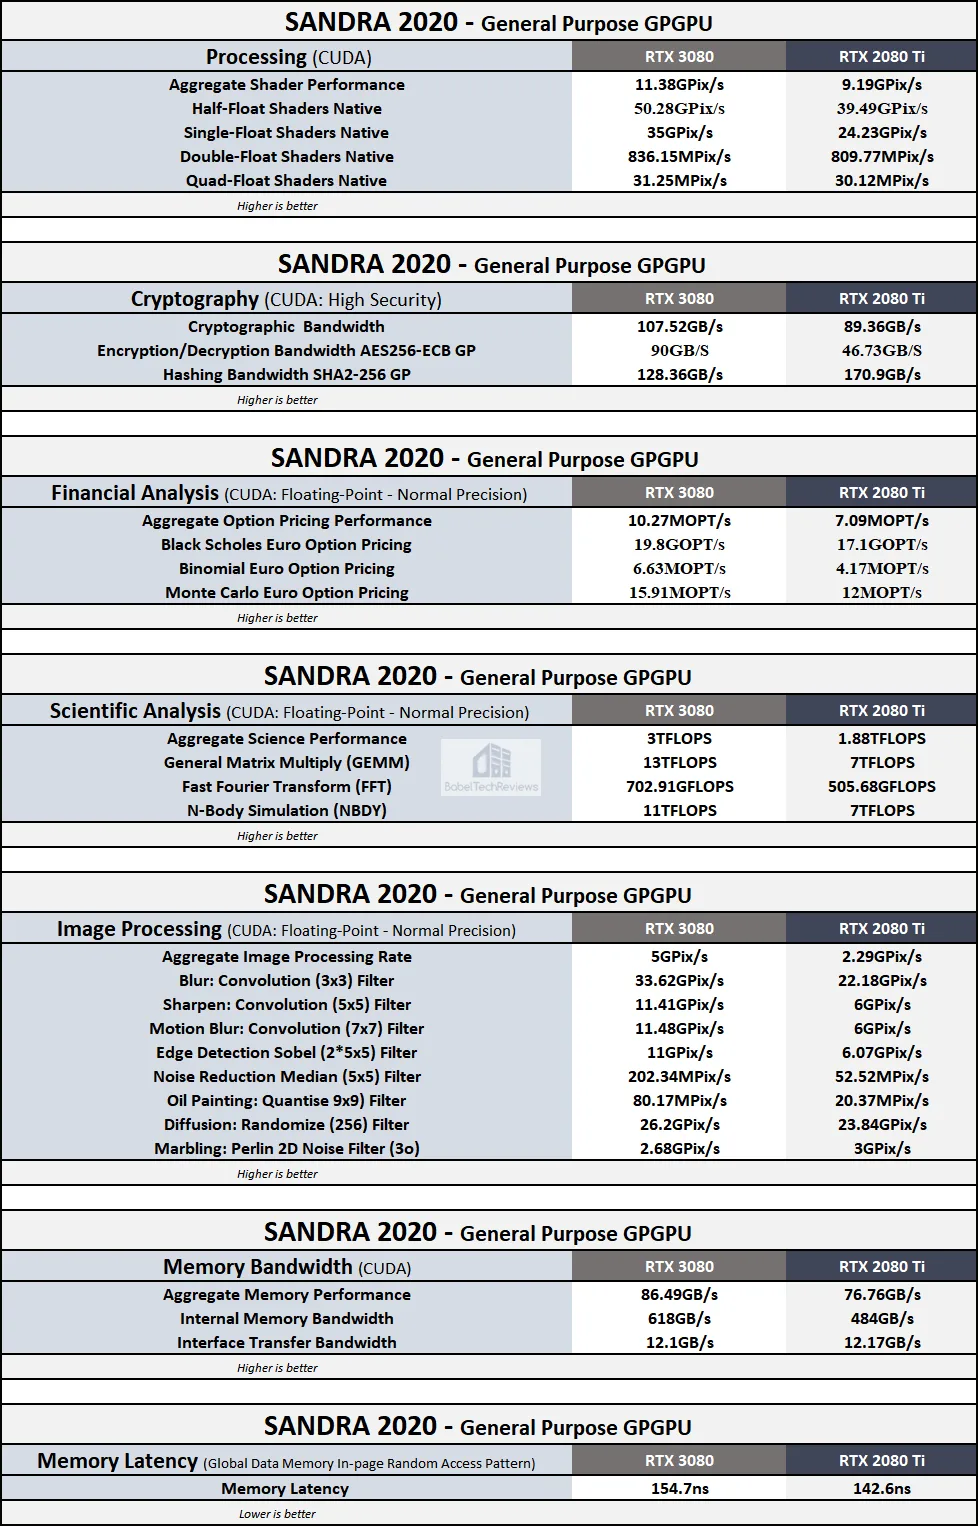
In Sandra GPGPU benchmarks, the RTX 3080 distinguishes itself from the RTX 2080 Ti in almost every area – Processing, Cryptography, Financial and Scientific Analysis, Image Processing, and Bandwidth – although interestingly, the Ti appears to be faster at hashing.
We have completed the synthetic benching, so let’s take a look at end-to-end latency and especially in RTX Fortnite.
End-to-end Latency, LDAT, and RTX Fortnite
eSport gaming is fast becoming the most popular competitive sport in the world and latency is a big problem that many online gamers just accept. Often gamers attribute latency to ‘ping’ without considering that their own PC’s end-to-end latency is critical to their aiming accuracy.
BTR recently purchased a Samsung Odyssey G7 (LC27G75TQSNXZA), a 27? 2560 x 1440 240Hz (1ms GTG) G-SYNC HDR600 Monitor, and we can easily tell the difference between a 240Hz refresh rate and a 120Hz refresh rate, and between a quick response and a slower one. We picked this G7, our fastest display, to use with LDAT which simplifies latency and display analysis – without having to spend many thousands of dollars on complex equipment.
Measuring end-to-end system latency traditionally requires recording the input and display using a high-speed camera and then manually counting the individual frames. This is both very expensive and tedious. To simplify the process of measuring system latency, NVIDIA has created a hardware latency tool called LDAT (Latency Display Analysis Tool). LDAT is a discrete hardware analyzer that uses a luminance sensor to quickly and accurately measure the motion-to-photon latency in a game or application. LDAT works with all GPUs including Intel’s and AMD’s.
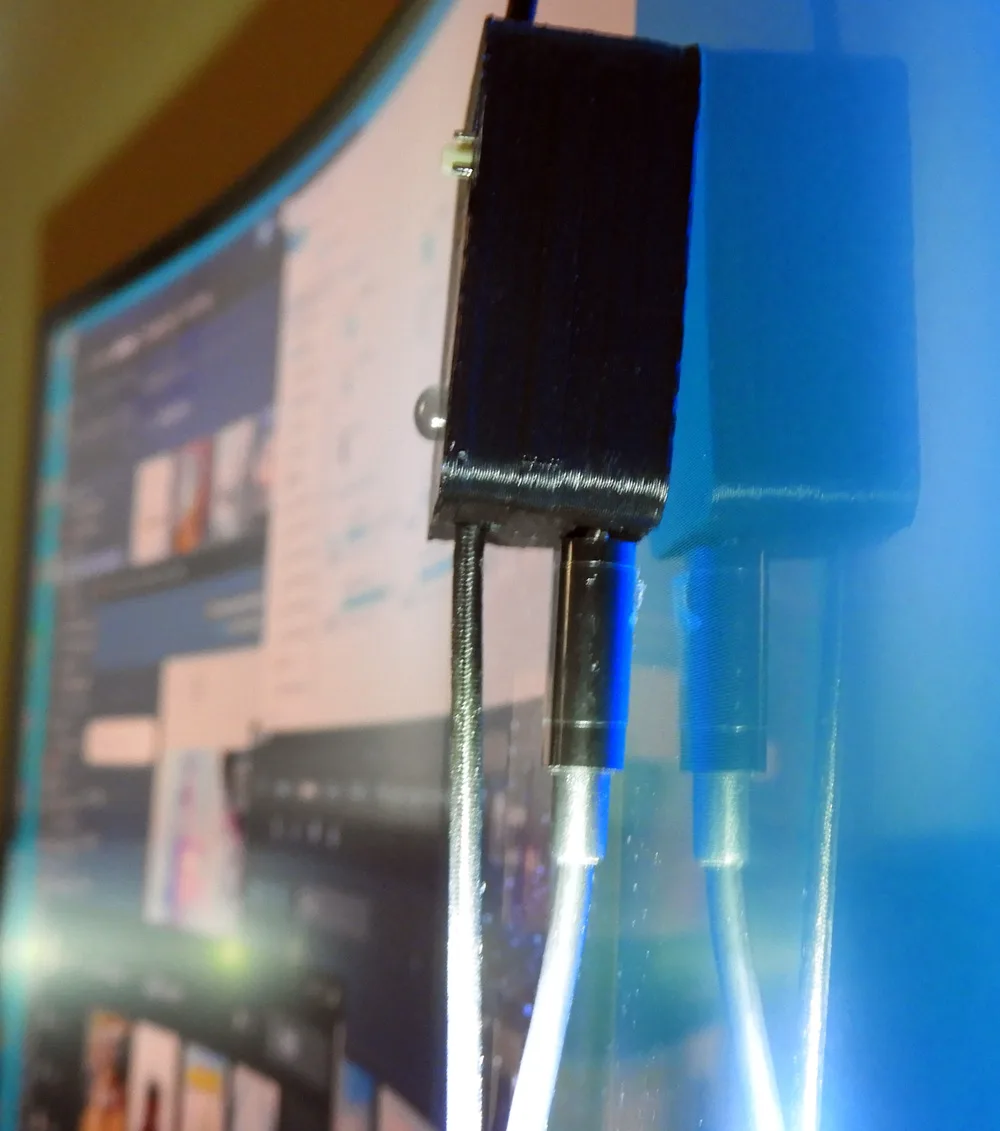
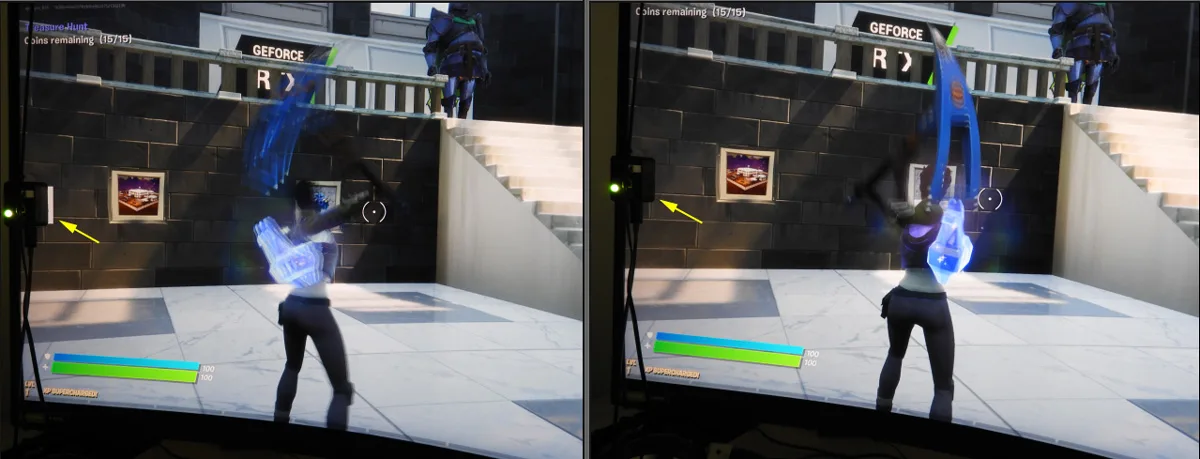
The LDAT sensor sits directly against the Samsung LCD and it responds to changes in luminescence. Unfortunately, the thick bezel of the display coupled with the R1000 curve left a gap between the screen and the sensor. So we made a simple modification using a plastic twist tie to hold the bottom of the LDAT sensor snugly against the screen. Our end-to-end latency benchmarks were performed on the Samsung G7 Odyssey display at its native resolution, 2560×1440, and at 1920×1080 for testing Fortnite RTX latency.
Using LDAT is easy. All we had to do was slide the LDAT sensor onto the Samsung screen, and then position it over an area that changes luminance (like a weapon muzzle flash) when the mouse button is pressed. The LDAT kit comes with a modified Logitech G203 Prodigy gaming mouse that plugs into the sensor which allows it to measure the entire end-to-end PC latency. Just open the LDAT software, click the mouse button, and LDAT automatically measures the PC system latency in real time. And it also can be set to flash automatically up to 100 times. So we ran it twice (x100) for each of our two test cards.
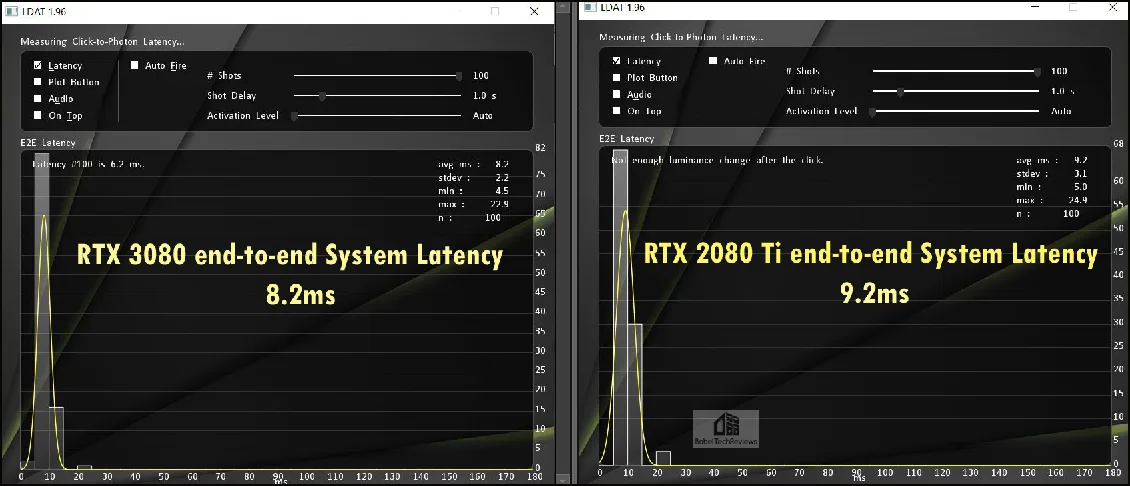
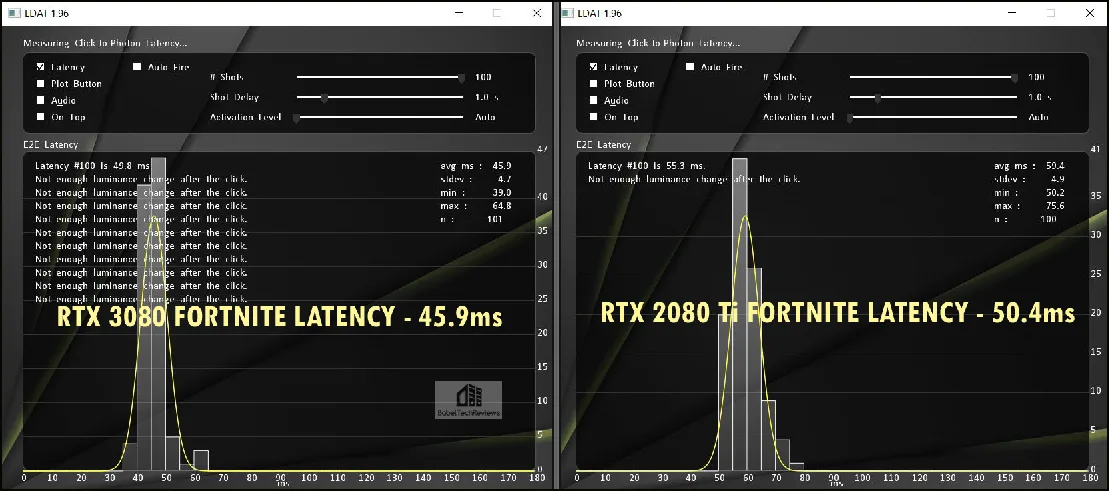
After 200 automatic flashes – which would have taken literally days to accomplish with a high speed camera and by manually counting the frames, we got the above results in a few minutes. The RTX 3080 is about 1ms faster in our PC than the RTX 2080 Ti, a very small difference. But what does this mean for games? Well, we used the upcoming NVIDIA Creative RTX map in Fortnite and we also tested Reflex.
Fortnite Latency Measured
Fortnite has received ray traced visual effects, DLSS, and Reflex in an all new custom RTX map for reviewers that will be available to all Fortnite gamers in Chapter 2, Season 4. These new ray tracing effects in Fortnite will be implemented in the ‘Battle Royale’, ‘Save the World’, and ‘Creative’ worlds. Ray-traced shadows and reflections provide a large visual contrast over using traditional rasterization methods, while ray-traced ambient occlusion and global illumination add quite a bit to the overall ambiance.
NVIDIA has also worked with Fortnite content creators to develop a new Creative Mode map known as the ‘RTX Treasure Run’ that has been specifically designed to highlight ray tracing. Players will arrive at the entrance to a museum where they are challenged to a scavenger hunt that highlights multiple ray traced effects. Along the way, players may explore a hall of mirrors, a medieval castle, a jungle, climb a giant statue, and explore a science lab to uncover the most treasures in twenty minutes. The RTX Treasure Run will be available with the launch of Fortnite RTX.
Let’s look at BTR’s Fortnite benchmark at 1920×1080 – first with RTX Off.
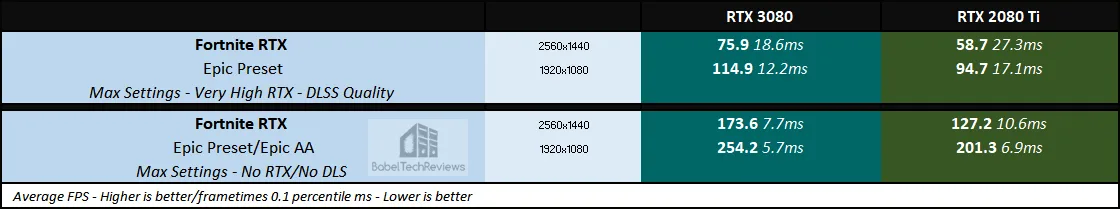
In all of the Fortnite benchmarks, the RTX 3080 is solidly faster than the RTX 2080 Ti. A competitive gamer will definitely not use RTX On at 4K due to the performance hit, and probably not at 1440P; but if you are playing Fortnite non-competitively, it’s a superb option to bring amazing visuals and eye candy that are not in the vanilla game.
Fortnite is a cultural phenomenon with more than 350 million players. It is also a platform for gamers and creators to make and play unlimited games/experiences and this is part of the reason it’s the most popular game in the world. It looks like ray tracing/DLSS and the system latency improvements from Reflex will be particularly popular for Fortnite gamers wishing to experience its creative side. So lets look at Reflex and measure end-to-end latency in Fortnite.
NVIDIA Reflex: Low Latency Technology in Fortnite
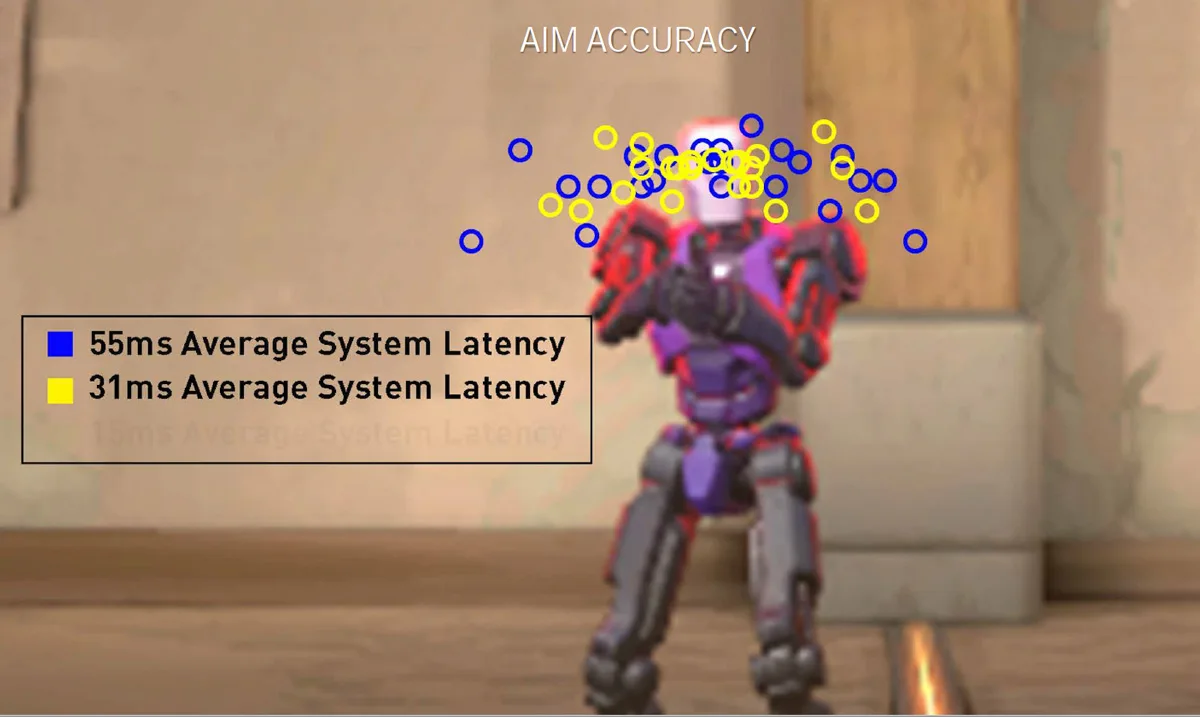
NVIDIA Reflex is a new low latency mode integrated in Fortnite that allows gamers to find targets faster, react quicker, and to potentially increase their aim precision. With Reflex, gamers can increase settings, resolution, and turn on RTX while still maintaining the responsiveness needed to play competitively. Aim accuracy improves significantly when the average system latency drops from 55ms to 31ms according to NVIDIA.
Reflex technology reduces the back pressure on the CPU, reduces the render queue to zero, and boosts GPU clocks, all of which combine to give some pretty impressive results. We set up LDAT and measured the end-to-end latency comparing the RTX 3080 with the Turing flagship, the RTX 2080 Ti. Fortnite RTX has a built-in tool that flashes a small square white that LDAT is centered over (against a contrasting background) when a mouse press occurs.
First, here is Fortnite’s end-to-end latency measured without using Reflex – this time at 1920×1080 which is the resolution a competitive gamer might choose – even with maxed-out/Epic RTX On/DLSS Quality settings as we have chosen.
The RTX 3080 has lower latency in the same PC than the RTX 2080 Ti, but latency is still a bit high. So we kept everything at maxed-out Epic/RTX On settings, but simply turned Reflex+Boost on in the Fortnite settings.
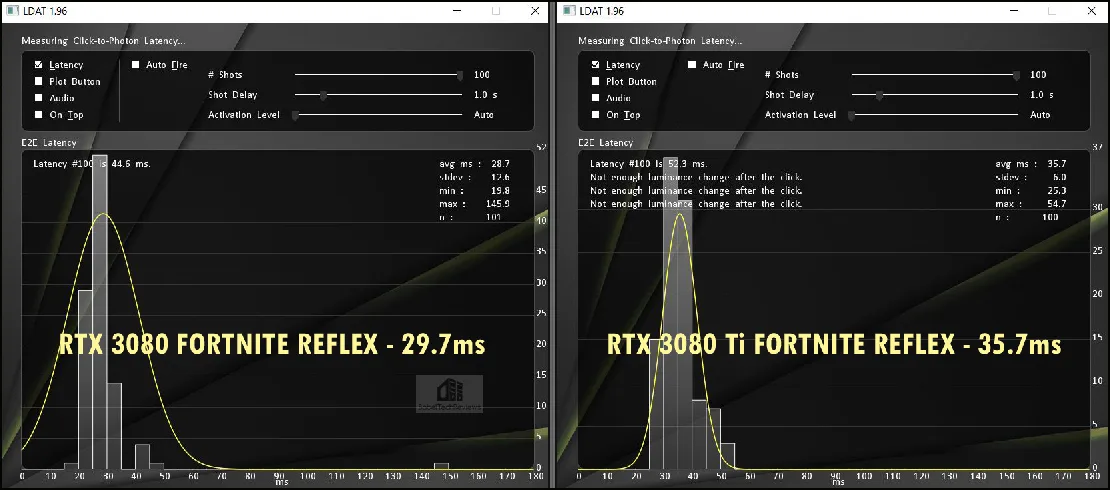
The visuals still look the same, the framerate has not changed, but the latency has dropped significantly for both video cards. Reflex may give a gamer a real competitive advantage over a gamer not using it.
Let’s head to our conclusion.
This has been a very enjoyable exploration evaluating the new Ampere RTX 3080 versus the other two fastest video cards, and against the Pascal flagship. The RTX 3080 performed exceptionally well performance-wise compared to the RTX 2080 Ti – formerly the fastest gaming card in the world. It totally blows away its other competitors and it much faster than the RTX 2080 SUPER. And it may be the upgrade that GTX 1080 Ti gamers have been holding out for since it costs the same as the Pascal flagship did at its own launch, $699.
However, for RTX 2080 Ti gamers – although it has been eclipsed by the RTX 3080 – they may wish to wait for the RTX 3090 Founders Edition which costs $1500 – or about $300 more than what they paid for their Ti – if they want to maximize their upgrade. We hope to bring you a complete analysis of NVIDIA’s upcoming flagship card.
Conclusion
We are impressed with the Founders Edition of the RTX 3080 which has exceptional performance at Ultra 4K and at 2560×1440. For now, it stands alone as the fastest video card in the world and it has launched at $699 – the same price the RTX 2080 SUPER FE launched at, and $100 less expensive than the RTX 2080 at launch – and much less expensive compared to the $1199 RTX 2080 Ti FE which launched two years ago.
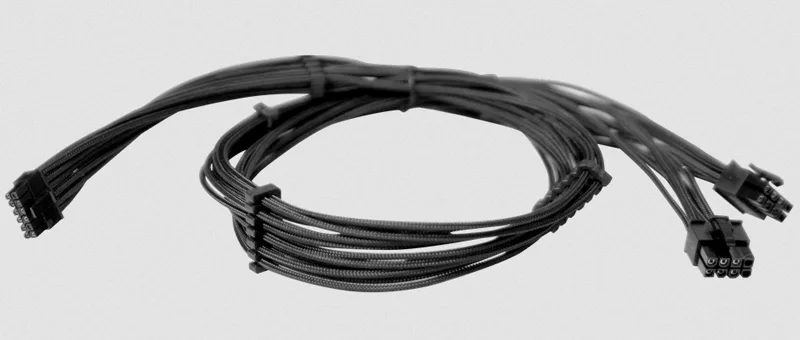
The Founders Edition of the RTX 3080 is well-built, solid, and good-looking, and it stays cool and quiet even when overclocked. The only nitpicks we have are that the shipping/display box is almost impossible to open after the card is removed, and that the 12-pin adapter cable is bulky and it looks out of place on such a great-looking card. Fortunately, EVGA has stepped up with a much less bulky cable that will aid meticulous builders for cable management.
The RTX 3080 Founders Edition is a huge improvement over any Pascal or Turing Founders Editions in every metric.
Pros
- The RTX 3080 is now the fastest video card in the world
- The RTX 3080 is priced similarly to the RTX 2080/SUPER FEs at launch and it is much faster. It is a huge leap in performance over the GTX 1080 Ti which also launched at $699, and it is faster then the $1199 RTX 2080 Ti
- Ray tracing is a game changer in every way
- Ampere improves over Turing with AI/deep learning and ray tracing to improve visuals while also increasing performance with DLSS 2.0
- Reflex is important for competitive gamers by minimizing end-to-end latency
- The RTX 3080 Founders Edition design cooling is quiet and efficient; the card and well-ventilated case stay cool even highly overclocked on a hot Summer day.
- The industrial design is eye-catching and it is solidly built
Con
- The core overclocking headroom is poor and it has been locked down
The Verdict:
![]() If you currently game on an GTX 1080 Ti, you will do yourself a big favor by upgrading to a RTX 3080. For the same launch price, the RTX 3080 will give much better visuals for ray tracing, much higher overall performance, and DLSS 2.0 will allow for better performance for the games that use it. The RTX 3080 is a true 4K/60 FPS video card for most modern games. It well deserves BabelTechReviews Editor’s Choice Award.
If you currently game on an GTX 1080 Ti, you will do yourself a big favor by upgrading to a RTX 3080. For the same launch price, the RTX 3080 will give much better visuals for ray tracing, much higher overall performance, and DLSS 2.0 will allow for better performance for the games that use it. The RTX 3080 is a true 4K/60 FPS video card for most modern games. It well deserves BabelTechReviews Editor’s Choice Award.
Stay tuned, there is a lot more on the way from BTR. Next up, we will test the RTX 3080 in VR versus the RTX 2080 Ti using the Vive Pro and its Wireless Adapter. Stay tuned to BTR for news of the RTX 3090!
Happy Gaming!
Comments are closed.