This overclocking showdown focuses on three GTX 1050 Tis and one RX 460 4GB. We are following up on last week’s PNY GTX 1050 Ti 4GB & GTX 1050 Ti XLR8 OC vs. the XFX RX 460 4GB evaluation as well as our stand alone evaluation of the EVGA GTX 1050 Ti SC. Today, we have optimized our overclocks for each of our four cards with all performance options set to their upper limits to get the highest possible performance.
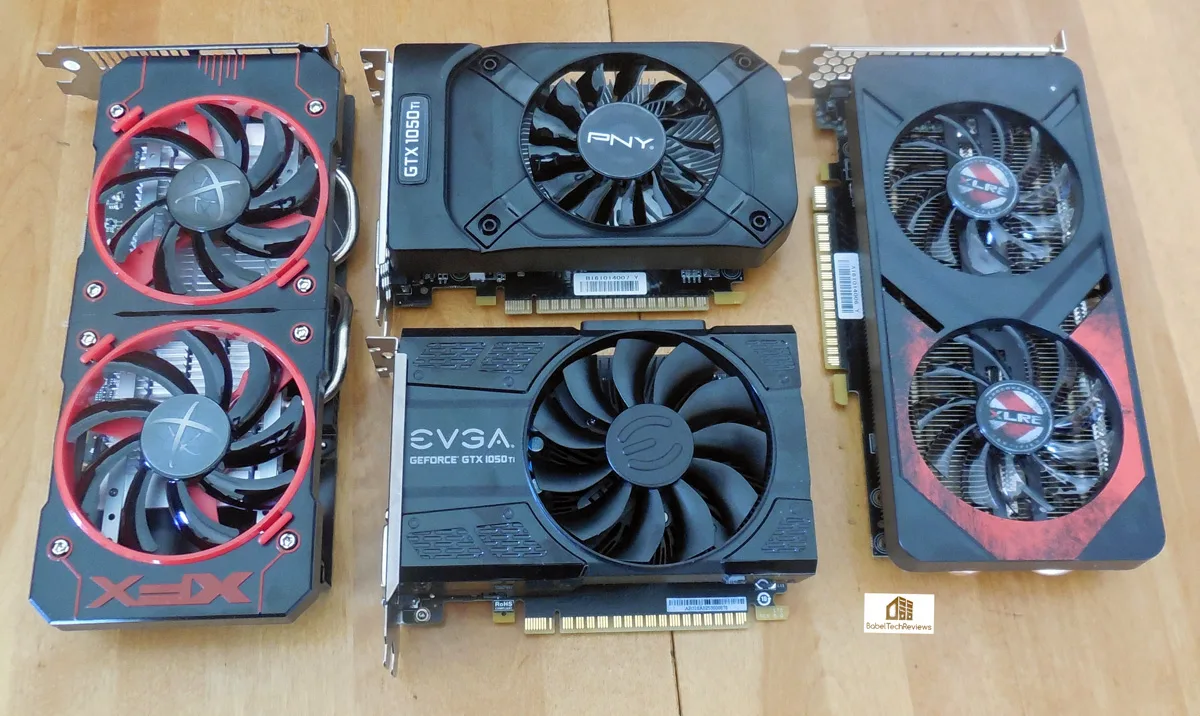
What makes this overclocking showdown particularly interesting is that two of the cards use a 6-pin PCIe connection for additional power while the other two draw all of their power from the motherboard’s PCIe slot. We measured total system average and peak power usage with each overclocked card to see if the cards with the extra power cable draw more power and/or overclock higher than the cards that are limited to 75W total from the PCIe slot.
At stock, the factory clocked PNY GTX 1050 Ti XLR8 won overall in performance over the factory overclocked EVGA GTX 1050 Ti SC. The reference clocked PNY GTX 1050 Ti came in third place, and all three GTX 1050 Tis soundly beat the XFX factory clocked RX 460. This time, we will overclock all of our cards as far as they each will go to see where they stand in relation to each other fully overclocked.
Overclocking the PNY GTX 1050 Ti
The $149 PNY GTX 1050 Ti is clocked at reference GTX 1050 Ti speeds of 1290MHz for the base clock and 1392MHz for the Boost clocks. Without adjusting the fan speed nor adding extra voltage, we were able to add 285MHz to the core for a base clock of 1771MHz and Boost clocks which fluctuated between 1847MHz to 1885MHz. All of the GTX 1050 Tis were able to hit peaks of 1911MHz which appears to be the ceiling for this GPU. We added 450MHz to the memory clocks to reach 3953MHz.
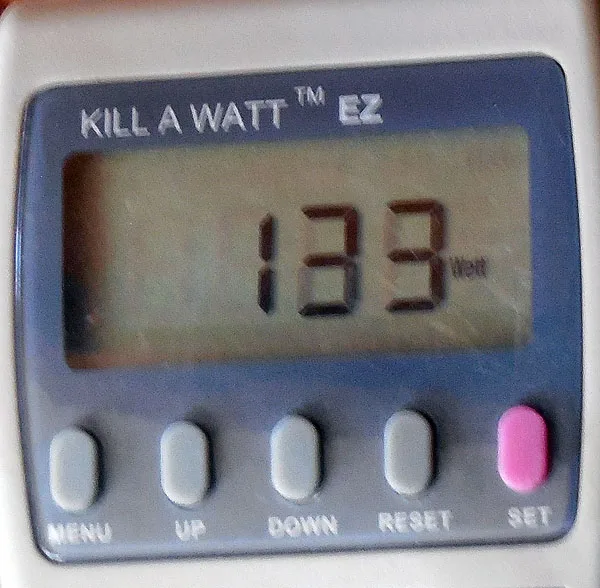
The PNY GTX 1050 Ti draws all of its power from the motherboard’s PCIe slot for a maximum of 75W. Total system power draw averaged 118W and peaked at 133W as measured by our Kill A Watt meter.
Overclocking the EVGA GTX 1050 Ti SC
The $149 EVGA GTX 1050 Ti SC is factory clocked at 1354MHz base/1468 Boost. It has a basic 3+1 Power Phase design and it draws all of its power from the PCIe slot. The SC costs the same price as the PNY GTX 1050 Ti which is reference clocked at 1290MHz base/1392MHz boost.
Without adjusting the fan speed nor adding extra voltage, we were able to add 160MHz to the core for a base clock of 1769MHz and Boost clocks which fluctuated between 1835MHz to 1898MHz. All of the GTX 1050 Tis were able to hit peaks of 1911MHz which appears to be the ceiling for this GPU. We added 320MHz to the memory clocks to reach 3823MHz. The EVGA GTX 1050 Ti SC draws all of its power from the motherboard’s PCIe slot for a maximum of 75W. Total system power draw averaged 116W and peaked at 128W as measured by our Kill A Watt meter.
Overclocking the PNY GTX 1050 Ti XLR8
The $159 PNY GTX 1050 Ti is clocked at PNY factory speeds of 1290MHz for the base clock and 1392MHz for the Boost clocks. The PNY GTX 1050 Ti XLR8’s base clock is at 1366MHz core clock which is 76MHz over Nvidia’s reference clocks, and the Boost is 1480MHz, which is clocked 88MHz over Nvidia’s guaranteed boost.
Without adjusting the fan speed nor adding extra voltage, we were able to add 80MHz to the core for a rock solid Boost clock of 1911MHz which did not fluctuate. Although all of the GTX 1050 Tis were able to hit peaks of 1911MHz which appears to be the ceiling for this GPU, the XLR8 edition evidently by virtue of its additional 6-pin PCIe connection was able to maintain this clock. We added 500MHz to the memory clocks to reach 4004MHz.

Since the PNY GTX 1050 Ti draws its power from the motherboard’s PCIe slot and has an additional connection to the PSU via a PCIe cable, the total system power draw was higher than the other two GTX 1050 Tis and it averaged 128W and peaked at 143W as measured by our Kill A Watt meter.
Overclocking the XFX RX 460 4GB
The $139 (now with a $20 mail-in-rebate at Newegg) XFX RX 460 is clocked at XFX factory clocked speeds of 1220MHz for the boost clock up 20MHz over reference clocks, and well over the 1090MHz for the base clock. 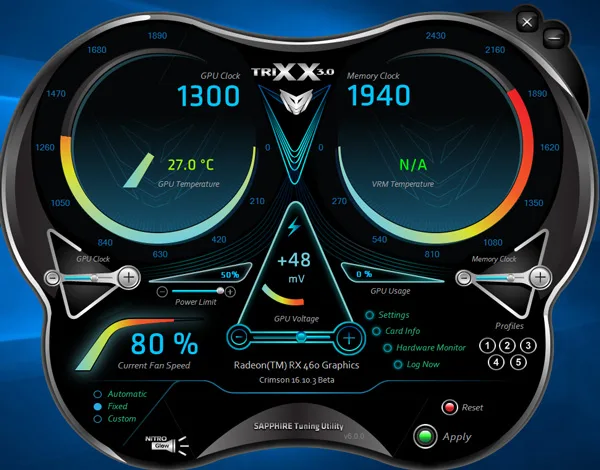
Unlike with the GTX 1050 Tis, we had to adjust the fan speed to 80% and we added .48mV extra voltage for stability and our maximum overclock. Ultimately, we were able to add 80MHz to the core for a solid Boost clock of 1300MHz which did not fluctuate. We added 190MHz to the memory clocks to reach 1940MHz, or 7760MHz effective clocks (up 760MHz over the 7000MHz reference memory clocks).
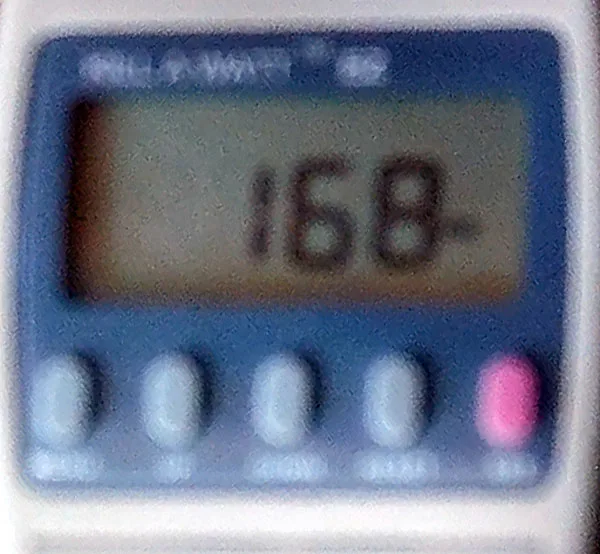
The XFX RX 460 draws its power from the motherboard’s PCIe slot and has an additional connection to the PSU via a PCIe cable. The total system power draw was higher than any of the GTX 1050 Tis and it averaged 130W and peaked at 168W as measured by our Kill A Watt meter.
Testing Platform
Our testing platform is Windows 10 Home 64-bit, using an Intel Core i7-6700K at 4.00GHz which turbos to 4.4GHz for all cores as set in the ASRock Z7170 motherboard’s BIOS, and 16GB of HyperX DDR4 at 3333MHz. The settings and hardware are identical except for the four cards being tested.
We also feature our newest 2016 games, Shadow Warrior 2 and Civilization VI, and we also include Ashes of the Singularity, Hitman, Rise of the Tomb Raider, and Total War Warhammer using DX12. We have also added Futuremark’s DX12 benchmark, Time Spy. We will compare the performance of 28 modern games at 1920×1080 resolution with maximum settings.
Before we run benchmarks, let’s check out the test configuration.
Test Configuration – Hardware
- Intel Core i7-6700K (reference 4.0GHz, HyperThreading and Turbo boost is on to 4.4GHz; DX11 CPU graphics).
- ASRock Z7170M OC Formula motherboard (Intel Z7170 chipset, latest BIOS, PCIe 3.0/3.1 specification, CrossFire/SLI 8x+8x)
- HyperX 16GB DDR4 (2x8GB, dual channel at 3333MHz), supplied by Kingston
- PNY GTX 1050 Ti XLR8 Overclocked edition 4GB, PNY clocks and further overclocked, supplied by PNY
- PNY GTX 1050 Ti 4GB, reference clocks and further overclocked, supplied by PNY
- EVGA GTX 1050 Ti SC, 4GB, EVGA clocks and further overclocked, supplied by EVGA
- XFX RX 460 4GB, XFX factory clocks and further overclocked
- Two 2TB Toshiba 7200 rpm HDDs for each platform
- EVGA 1000G 1000W power supply unit
- Thermaltake Water2.0, supplied by Thermaltake
- Onboard Realtek Audio
- Genius SP-D150 speakers, supplied by Genius
- Thermaltake Overseer RX-I full tower case, supplied by Thermaltake
- ASUS 12X Blu-ray writer
- Monoprice Crystal Pro 4K
- Kill A Watt
Test Configuration – Software
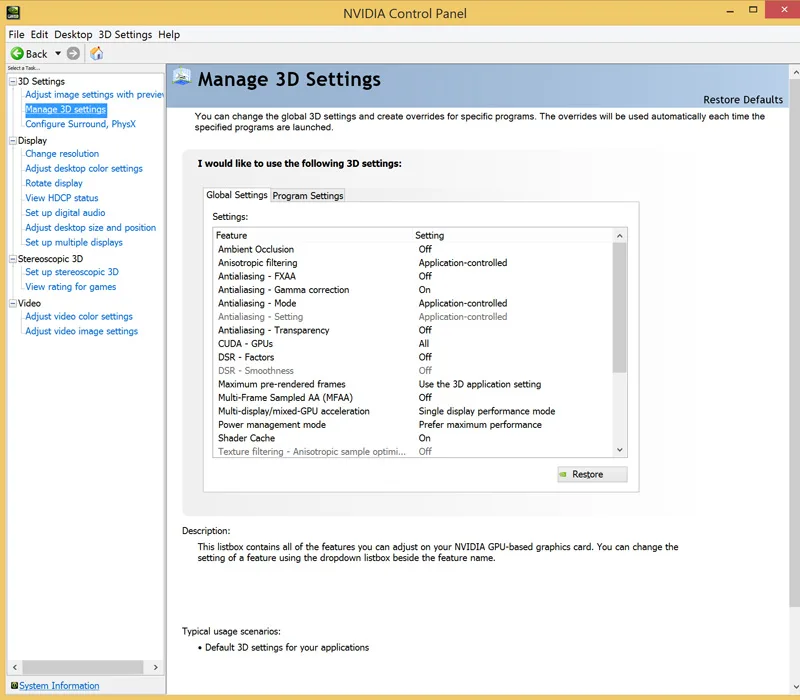
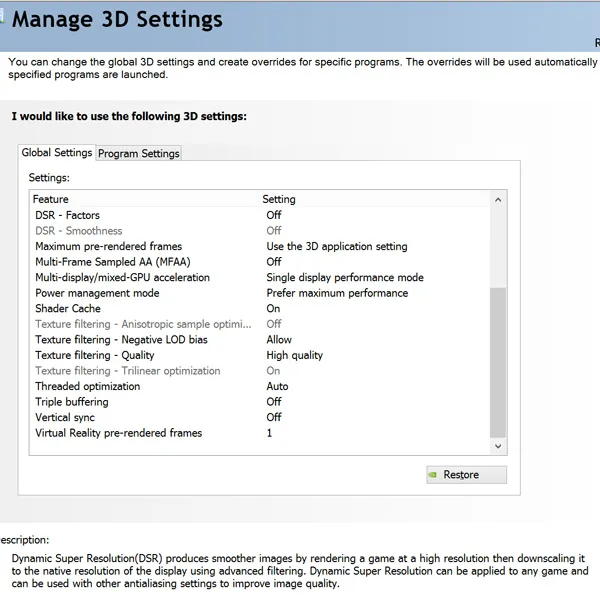
- Nvidia’s GeForce 375.57 used for all of the Nvidia cards. High Quality, prefer maximum performance, single display.
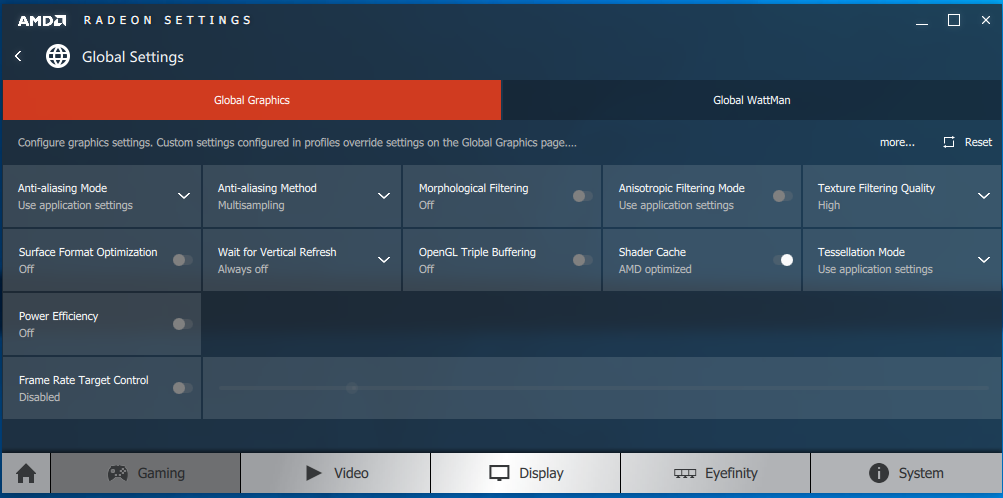
- AMD Crimson Software 16.10.2 drivers were used for benching AMD cards.
- VSync is off in the control panel.
- AA enabled as noted in games; all in-game settings are specified with 16xAF always applied
- All results show average frame rates including minimum frame rates shown in italics on the chart below the averages.
- Highest quality sound (stereo) used in all games.
- Windows 10 64-bit Home edition, all DX11 titles were run under DX11 render paths. Our DX12 titles are run under the DX12 render path. Latest DirectX
- All games are patched to their latest versions at time of publication.
- Sapphire’s TriXX was used for the RX 460 for overclocking.
- MSI’s Afterburner, latest beta, was used for Nvidia cards for overclocking.
- Unigine Heaven 4.0 was used to measure total system power consumption (2560×1440, maximum details, 8xAA)
Synthetic
- Firestrike – Ultra & Extreme
- Time Spy DX12
- Crysis 3
- Metro: Last Light Redux (2014)
- Middle Earth: Shadows of Mordor
- Alien Isolation
- Dragon’s Age: Inquisition
- Dying Light
- Grand Theft Auto V
- ProjectCARS
- the Witcher 3
- Batman: Arkham Origins
- Mad Max
- Fallout 4
- Star Wars Battlefront
- Assassin’s Creed Syndicate
- Just Cause 3
- Rainbow Six Siege
- DiRT Rally
- Far Cry Primal
- Tom Clancy’s The Division
- Mirror’s Edge Catalyst
- Deus Ex Mankind Divided
- Shadow Warrior 2
- Civilization VI
DX12 Games
- Ashes of the Singularity
- Hitman
- Rise of the Tomb Raider
- Total War: Warhammer
- Gears of War 4
Nvidia Control Panel settings:
AMD Crimson Control Center Settings:
 Let’s head to the performance charts to see how the three overclocked-to-the-max GTX 1050 Tis compare with each other and with the overclocked-to-the-max XFX RX 460.
Performance summary charts
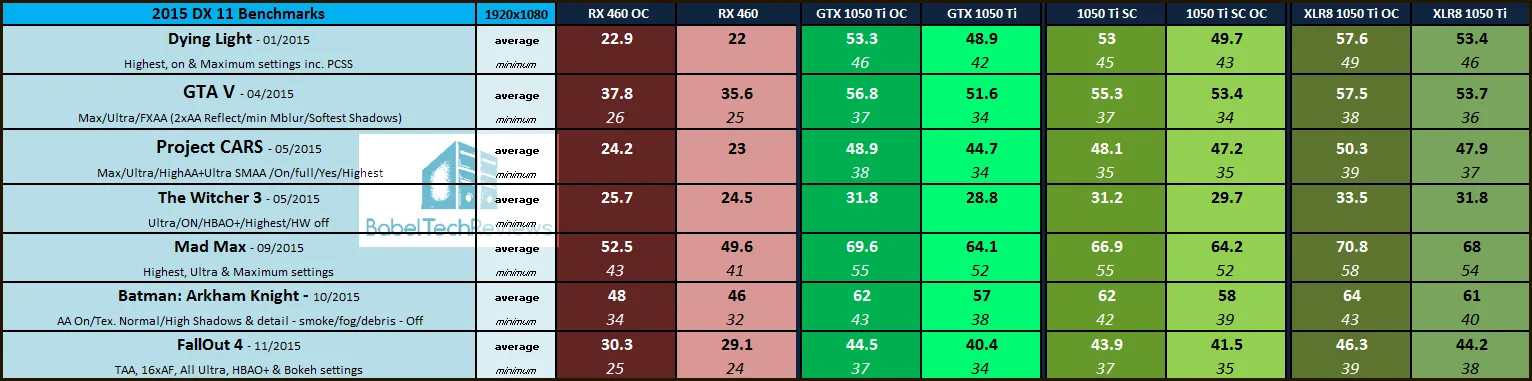
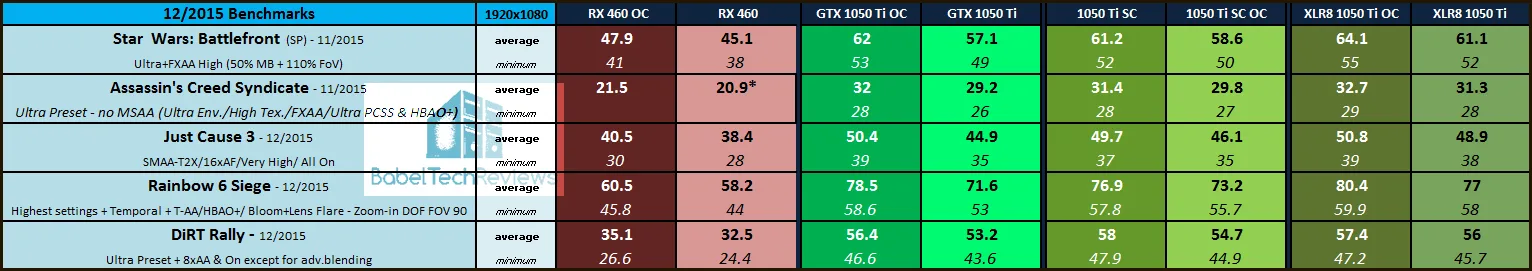
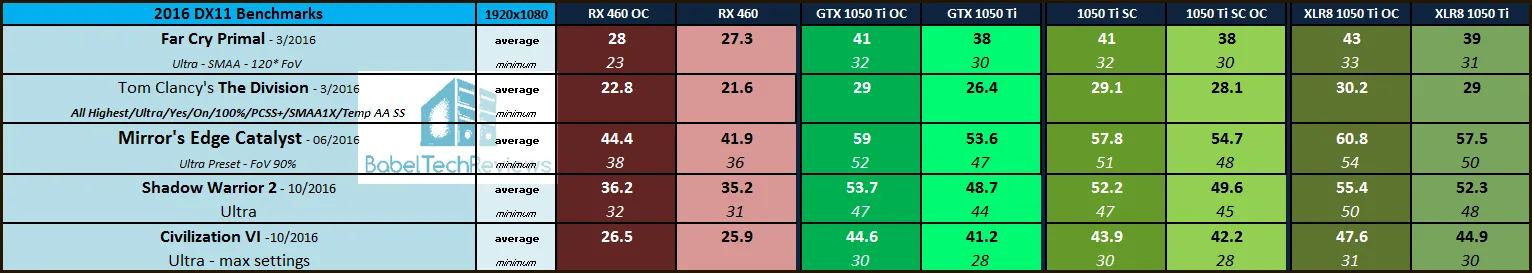
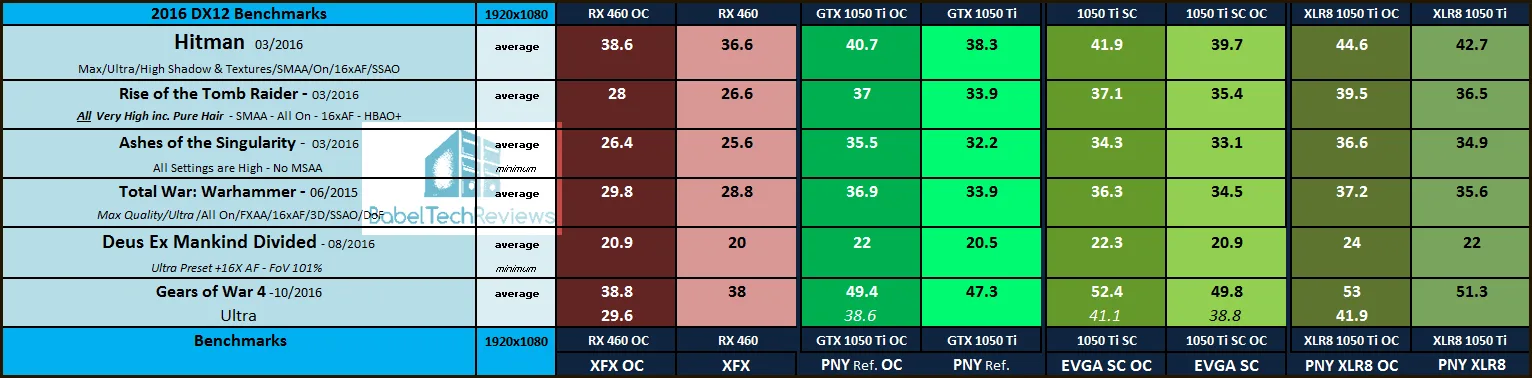
Below is the summary chart of 28 games and 2 synthetic tests. The highest settings are always chosen and it is usually DX11. DX12 is picked above DX11 where available. Specific settings are listed on the performance charts. The benches were run at 1920×1080. All results, except for FireStrike and Time Spy, show average frame rates and higher is always better. Minimum frame rates are shown when they are available and they make sense, below the averages, but they are in italics.
The XFX RX 460 results are in the first two columns – column 1 gives the overclocked results, and column 2 gives the factory clocked results. The second set of columns give the reference PNY GTX 1050 Ti results with the overclocked performance shown in column 3 versus the reference results in column 4. Columns 5 and 6 show the EVGA GTX 1050 Ti SC overclocked results versus its factory clocked performance, and the last two columns give the overclocked PNY XLR8 overclocked results in column 7 while the factory clocked results are in the last column, number 8.
Please open these charts in separate tabs or windows for easier viewing.
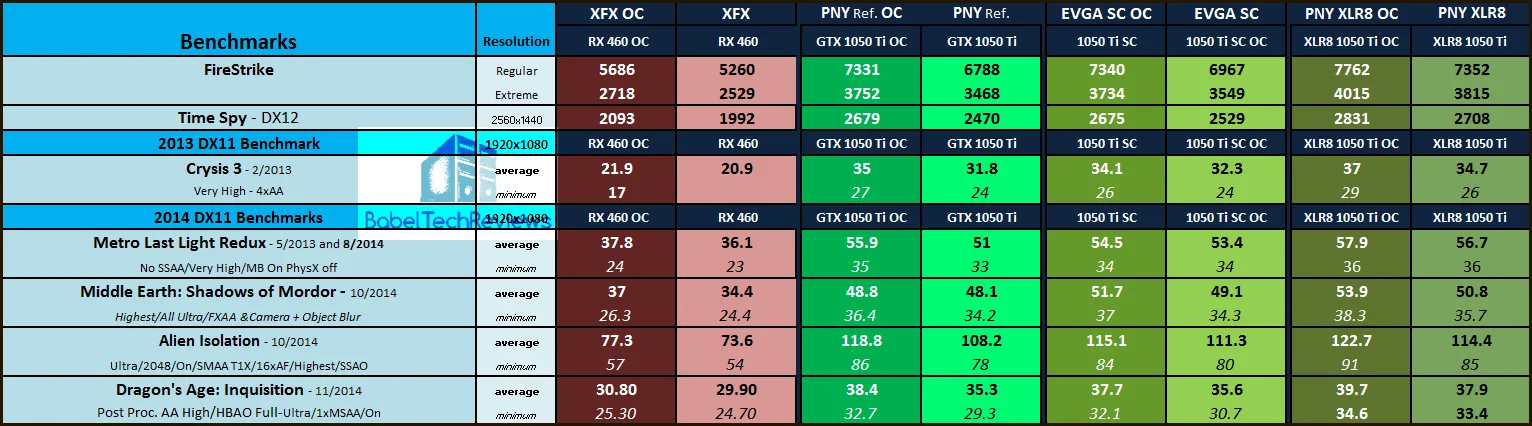
Our original charts comparing these 4 cards versus the reference EVGA GTX 1060/3GB and with the PowerColor-clocked Red Devil RX 470 are here. Although each card gained performance with their respective overclocks, they are still no match for the more expensive cards. And we also see that all of the GTX 1050 Tis overclock further than the RX 460 and generally gain more performance, widening the performance gap between them.
The superior overclocking abilities of the PNY GTX 1050 Ti XLR8 may be due to its extra PCIe connection which draws about ten more Watts than the other two GTX 1050 Tis that are limited to drawing power over the PCIe slot. We notice more variability of the overclocked results with the two GTX 1050 Tis that only draw their power over the PCIe slot than with the XLR8 GTX 1050 Ti that has an extra 6-pin power connector.
Lets head to our conclusion.
Conclusion
This has been quite an interesting exploration for us in evaluating the overclocked RX 460 versus the overclocked GTX 1050 Tis. The GTX 1050 Tis are faster cards at stock, and due to their superior headroom for overclocking, they pull even further away from the overclocked XFX RX 460.
All of our cards appears to scale well with an overclock although the GTX 1050 Tis overclock further and they use less power than the AMD card. The PNY GTX 1050 Ti XLR8, probably by virtue of its extra PCIe power connector, overclocks better and with less variability than the other two GTX 1050 Tis. We also see that the card probably draws about ten or so Watts more power over the PCIe cable which allows it to keep a solid overclock while the other two cards’ core speeds fluctuate up and down.
Next up, we will review our HyperX Cloud Stinger this weekend. Stay tuned.
Happy Gaming!